Bats Global Markets — Q3 2016 Earnings Presentation
26 slides from Bats Global Markets's earnings presentation, Nov 3, 2016
Slide 1: Third Quarter 2016 – Earnings Call
Third Quarter 2016 – Earnings Call November 3, 2016
Slide 2: Disclaimers: Non-GAAP Financial Measures
Disclaimers Non - GAAP Financial Measures To supplement Bats’ consolidated financial statements prepared in accordance with accounting principles generally accepted in th e United States (GAAP) and to better reflect period - over - period comparisons, Bats uses non - GAAP financial measures of perfo
Slide 3: Defined Terms
Defined Terms Adjusted cash is defined as cash and cash equivalents and financial investments excluding cash received for payment of Section 31 fees . Adjusted earnings is defined as net income adjusted for amortization, acquisition - related costs, IPO costs, and tax restructuring costs, net of
Slide 4: CBOE Transaction and Outlook
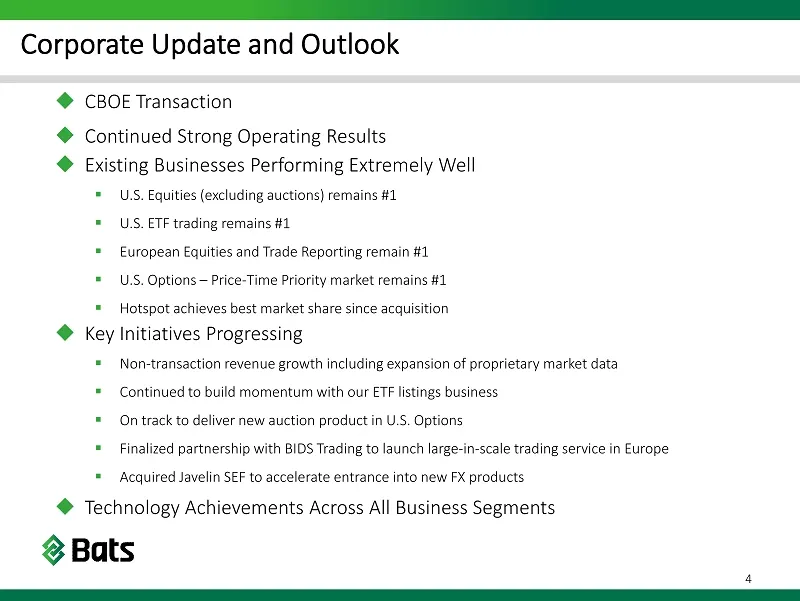
Corporate Update and Outlook CBOE Transaction Continued Strong Operating Results Existing Businesses Performing Extremely Well ▪ U.S. Equities (excluding auctions ) remains #1 ▪ U.S . ETF trading remains #1 ▪ European Equities and Trade Reporting remain #1 ▪ U.S. Options – Price - Time Priorit
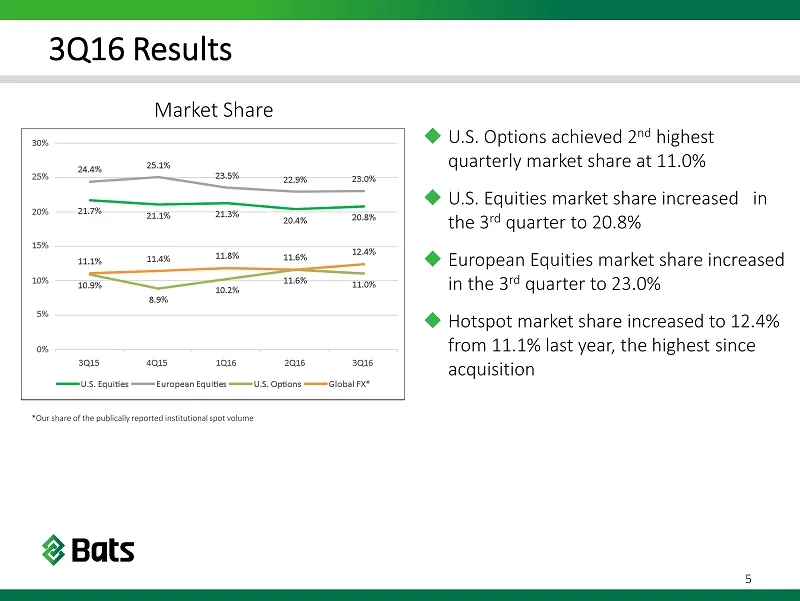
Slide 5: 3Q16 Results: Market Share
3Q16 Results 5 Market Share U.S. Options achieved 2 nd highest quarterly market share at 11.0% U.S . Equities market share increased in the 3 rd quarter to 20.8% European Equities market share increased in the 3 rd quarter to 23.0% Hotspot market share increased to 12.4% from 11.1% last year
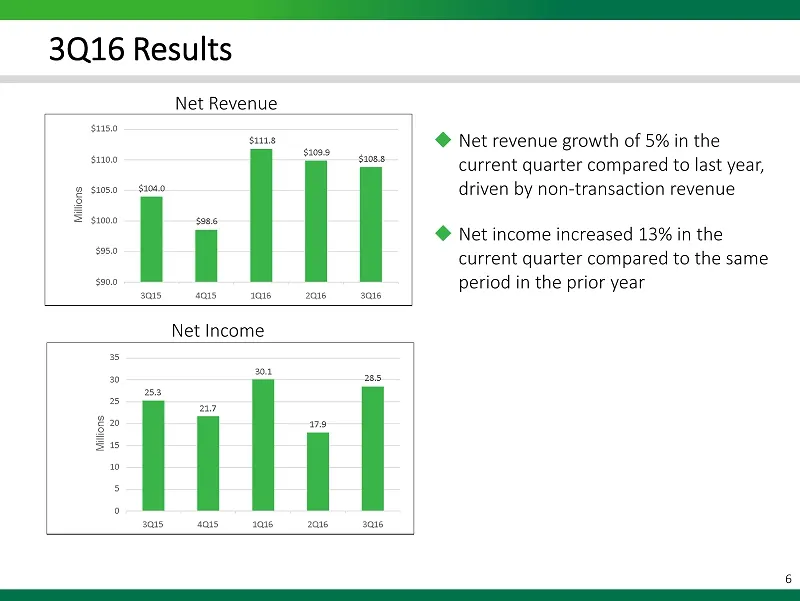
Slide 6: 3Q16 Results: Net Revenue
3Q16 Results 6 Net Revenue Net revenue growth of 5% in the current quarter compared to last year, driven by non - transaction revenue Net income increased 13% in the current quarter compared to the same period in the prior year Net Income
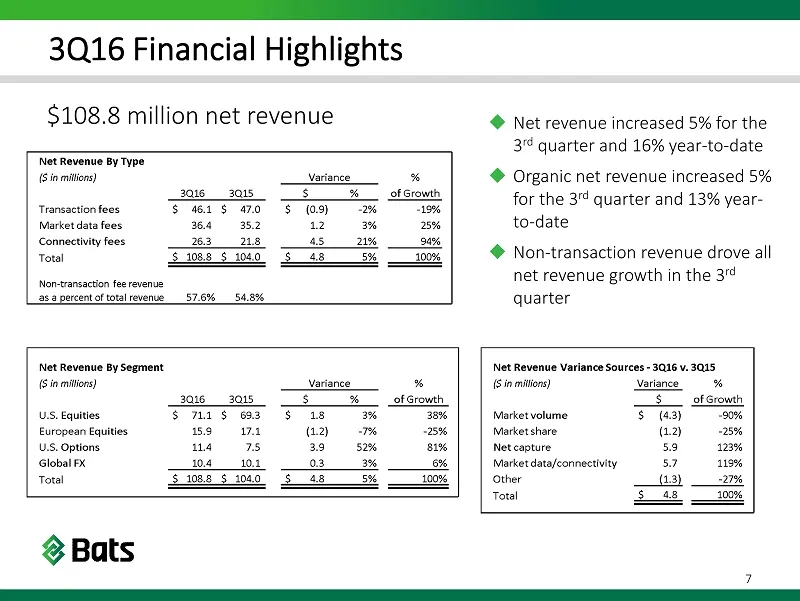
Slide 7: 3Q16 Financial Highlights: Net Revenue
3Q16 Financial Highlights 7 $108.8 million net revenue Net revenue increased 5% for the 3 rd quarter and 16% year - to - date Organic net revenue increased 5% for the 3 rd quarter and 13% year - to - date Non - transaction revenue drove all net revenue growth in the 3 rd quarter
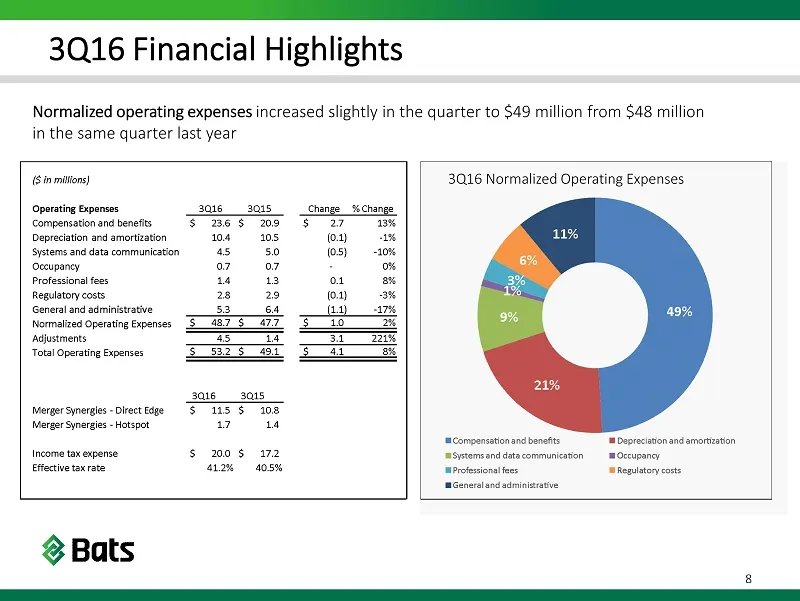
Slide 8: 3Q16 Financial Highlights: Normalized Operating Expenses
3Q16 Financial Highlights 8 Normalized operating expenses increased slightly in the quarter to $49 million from $48 million in the same quarter last year 3Q16 Normalized Operating Expenses
Slide 9: 3Q16 Financial Highlights: Adjusted Earnings
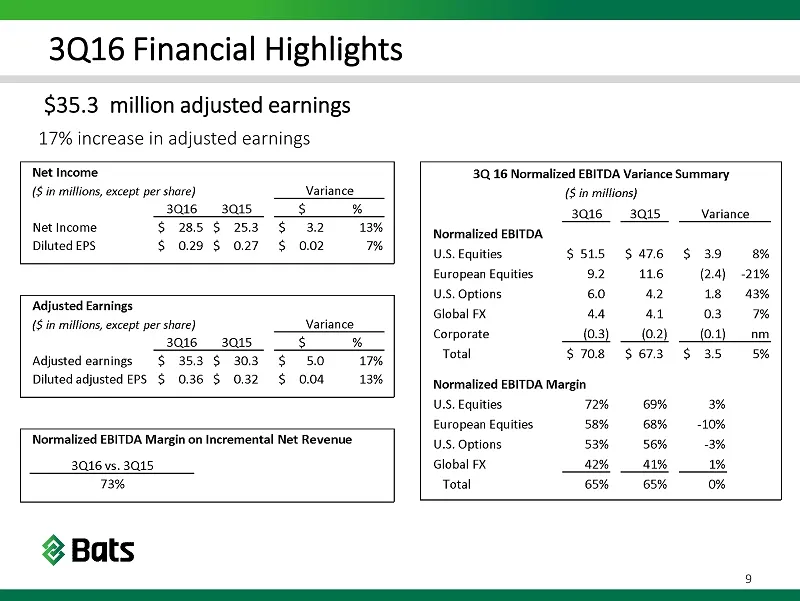
3Q16 Financial Highlights 9 $35.3 million adjusted earnings 17% increase in adjusted earnings
Slide 10: 3Q16 Financial Highlights: Leverage and Liquidity
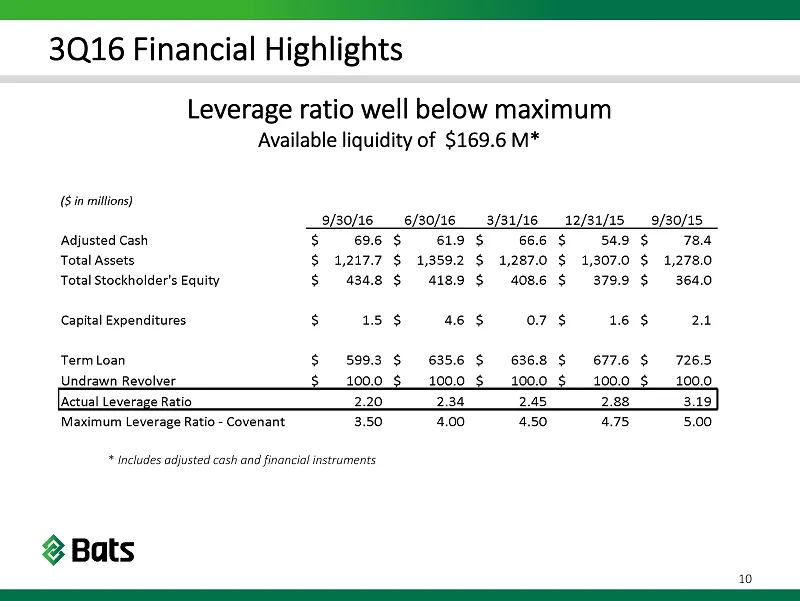
3Q16 Financial Highlights 10 Leverage ratio well below maximum Available liquidity of $169.6 M* * Includes adjusted cash and financial instruments
Slide 11: Corporate Restructuring
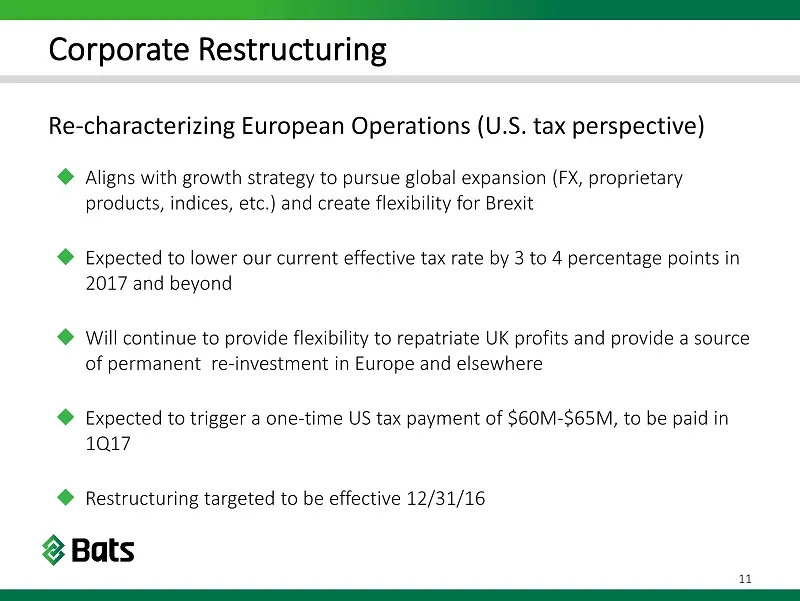
Corporate Restructuring 11 Re - characterizing European Operations (U.S. tax perspective) Aligns with growth strategy to pursue global expansion (FX, proprietary products, indices, etc.) and create flexibility for Brexit Expected to lower our current effective tax rate by 3 to 4 percentage point
Slide 12: Summary
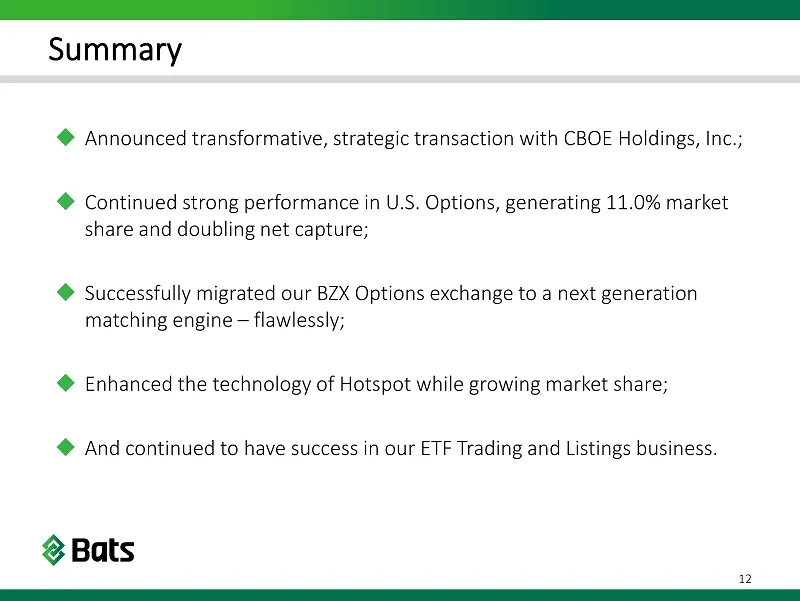
Summary Announced transformative, strategic transaction with CBOE Holdings, Inc.; Continued strong performance in U.S. Options, generating 11.0% market share and doubling net capture; Successfully migrated our BZX Options exchange to a next generation matching engine – flawlessly; Enhanced t
Slide 13: Supplemental Data
SUPPLEMENTAL DATA Bats
Slide 14: Disclaimers: Cautionary Statements Regarding Forward-Looking Information
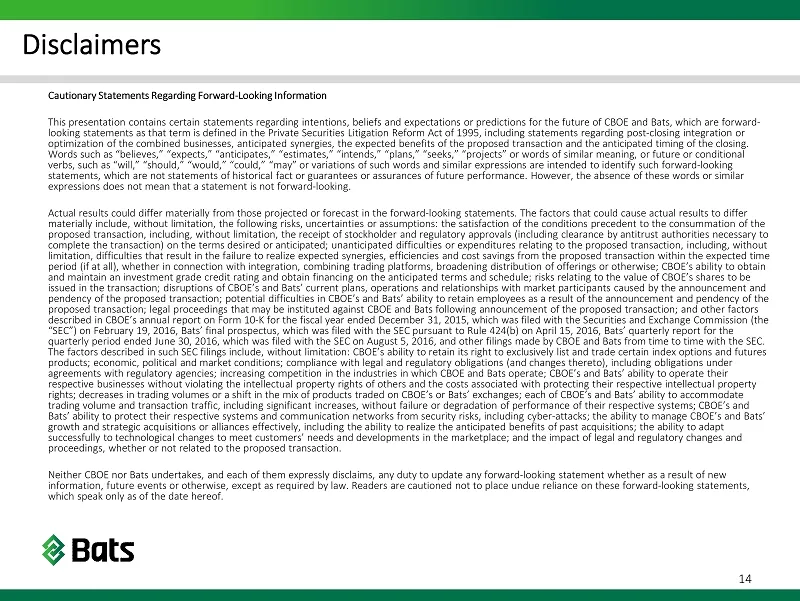
Disclaimers Cautionary Statements Regarding Forward - Looking Information This presentation contains certain statements regarding intentions, beliefs and expectations or predictions for the future of CB OE and Bats, which are forward - looking statements as that term is defined in the Private Securi
Slide 15: Disclaimers: Additional Information Regarding the Transaction
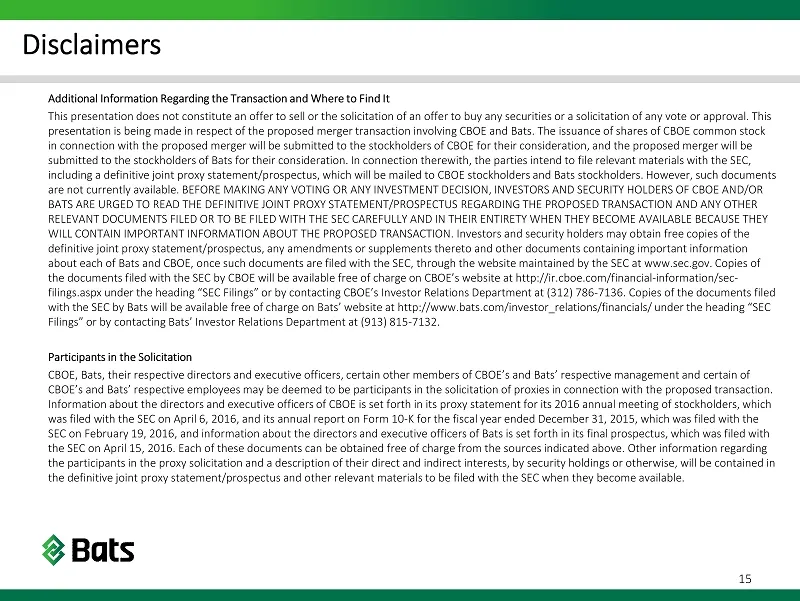
Disclaimers Additional Information Regarding the Transaction and Where to Find It This presentation does not constitute an offer to sell or the solicitation of an offer to buy any securities or a solicitation of any vote or approval. This presentation is being made in respect of the proposed merger
Slide 16: 3Q16 Metrics
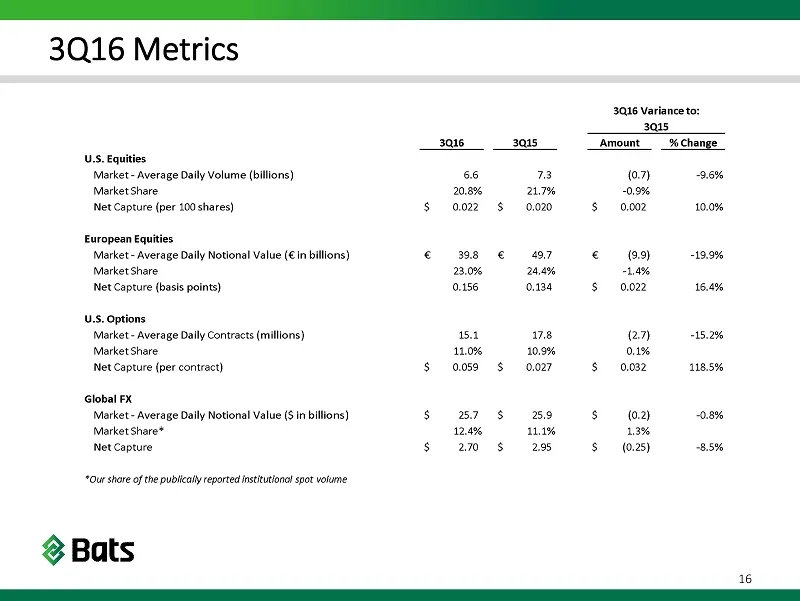
eee 3Q16 Metrics 3016 Varianceto: _—__305_ 3016 3015 ‘Amount _% Change US. Equities Market - Average Dally Volume (billions) 66 73 (0.7) 9.5% Market Shere 20.8% am 0.996 Net Capture (per 100 shares) $ 0022 $ 0020 § 0.002 10.0% European Equities Market Average Dally Notional Value (€ in billions) © 3
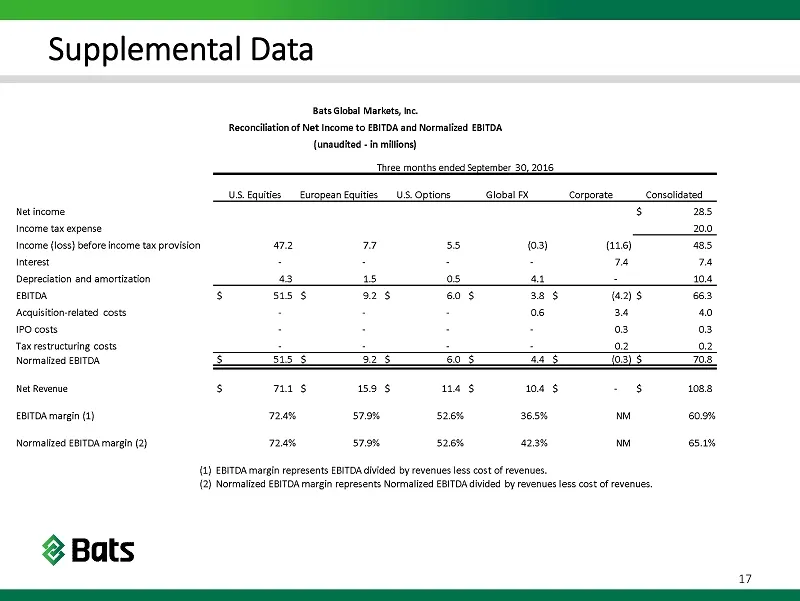
Slide 17: Supplemental Data: EBITDA Reconciliation, Q3 2016
a Supplemental Data ats Global Marks, ne. Reconciliation of Net Income to EBITDA and Normalized EBITDA (unauetted- in ilions) “Tee months ended September 30,2016 US. Equities European Equities _US.Options Global FX corporate __ Consolidated Netincome 3 235 Income tax expense 200 Income {loss before
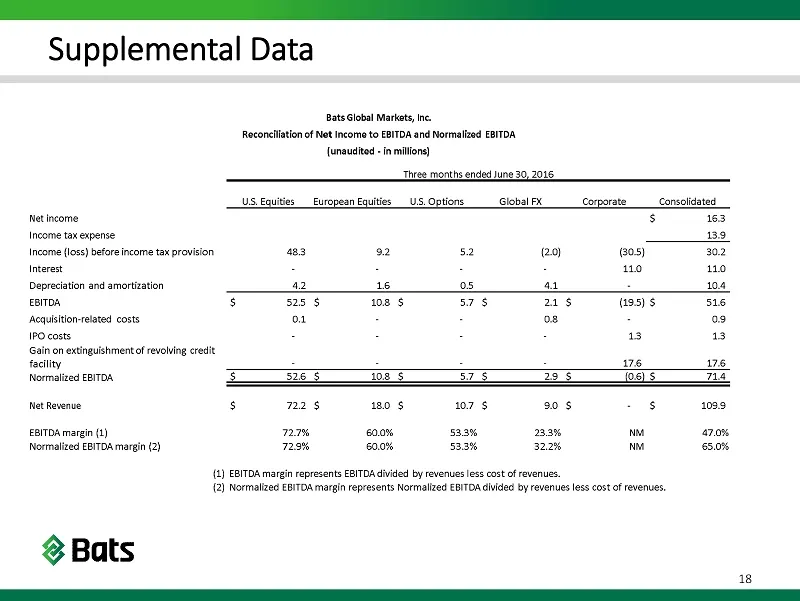
Slide 18: Supplemental Data: EBITDA Reconciliation, Q2 2016
a Supplemental Data Bate Global Markets, ne. Reconeliation of Net income to EBITDA and Normalized EBITDA {unaustted - a milfons) “Tee months ended June 30,2016. Us Equities European Equities _US.Options ___Global FX Corporate Consolidated Net income 3 163 Income tax expense Income (loss) before inco
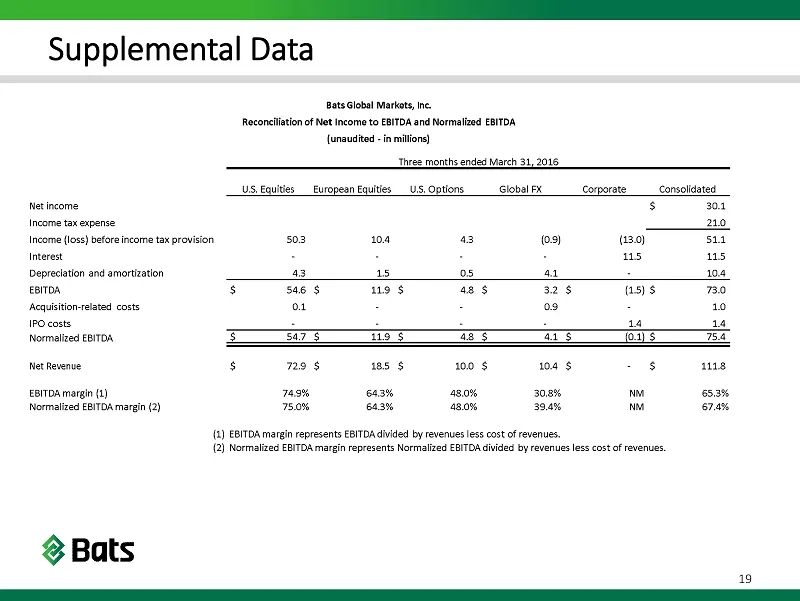
Slide 19: Supplemental Data: EBITDA Reconciliation, Q1 2016
Supplemental Data Bats Global Markos, ne. Reconelliation of Net income to EBITDA and Normalized EBITDA {unautted ia mitions) Three months ended March 31,2016 US.Eouities European Equities _US.Options_Gobal FX Corporate Consolidated Net income 3 30a Income tax expense 20 Income (loss) beforeincome ta
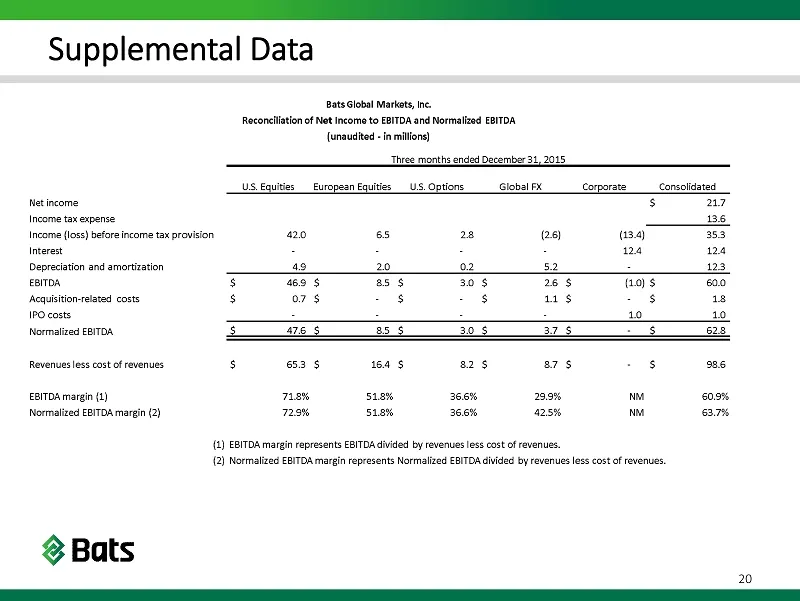
Slide 20: Supplemental Data: EBITDA Reconciliation, Q4 2015
a Supplemental Data Bats Global Markets, ne. Reconeliation of Net income to EBITDA and Normalized EBITDA {unaided - a milfons) “Three months ended December 31,2015, US Equities European Equities _US.Options Global FX Corporate Consolidated Net income 3 27 Income tax expense 136 Income (loss) before
Slide 21: Supplemental Data: EBITDA Reconciliation, Q3 2015
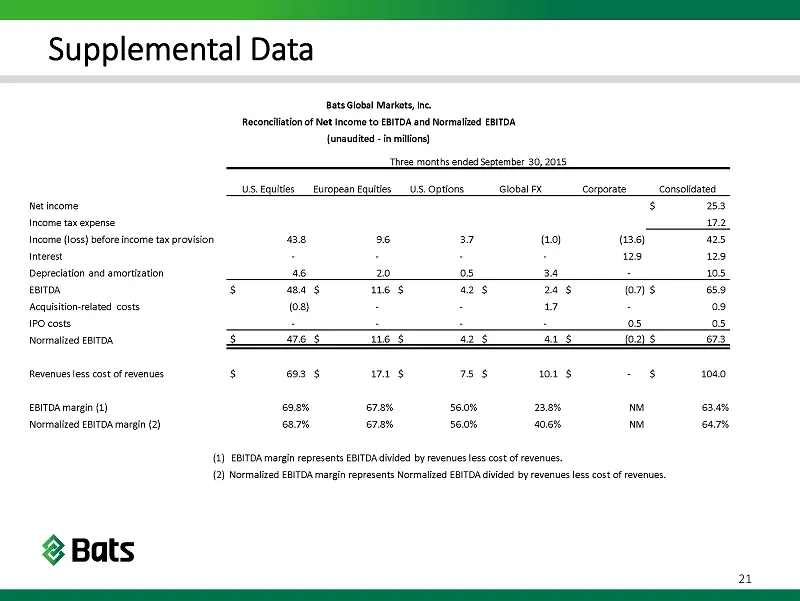
a Supplemental Data Bats Global Markos, ne. Reconelliation of Net income to EBITDA and Normalized EBITDA {unaudited -iamilfons) Thrze months ended September 30,2015 US Eouities European Equities _US.Options__Gobal FX Corporate ___consoidated Net income 3 253 Income tax expanse 172 Income (loss) befo
Slide 22: Supplemental Data: Reconciliation to Adjusted Cash
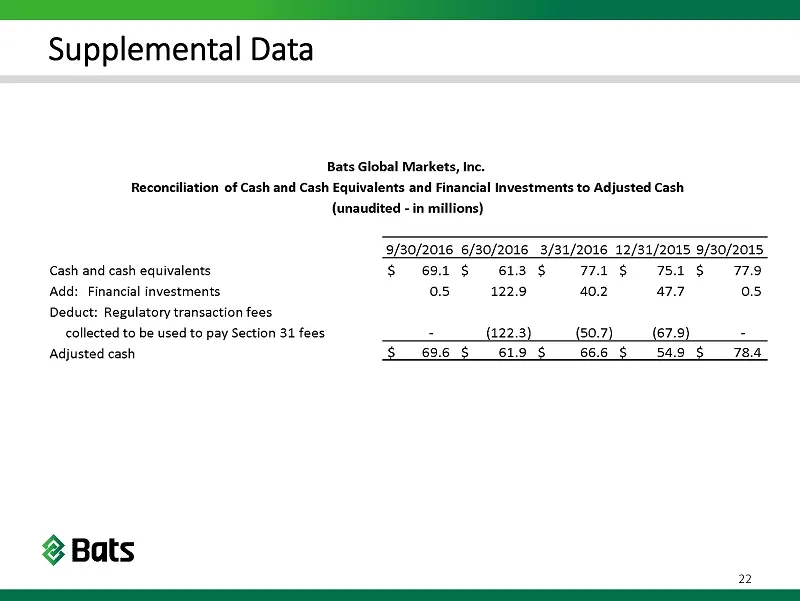
Supplemental Data Bats Global Markets, Inc. Reconciliation of Cash and Cash Equivalents and Financial Investments to Adjusted Cash (unaudited ns) 9/30/2016 6/30/2016 3/31/2016 12/31/2015 9/30/2015 Cash and cash equivalents $ 6.1$ 613$ W1$ 1$ 779 Add: Financial investments OS 122.9 40.2 477 Os Deduct
Slide 23: Supplemental Data: Reconciliation of Adjusted Earnings
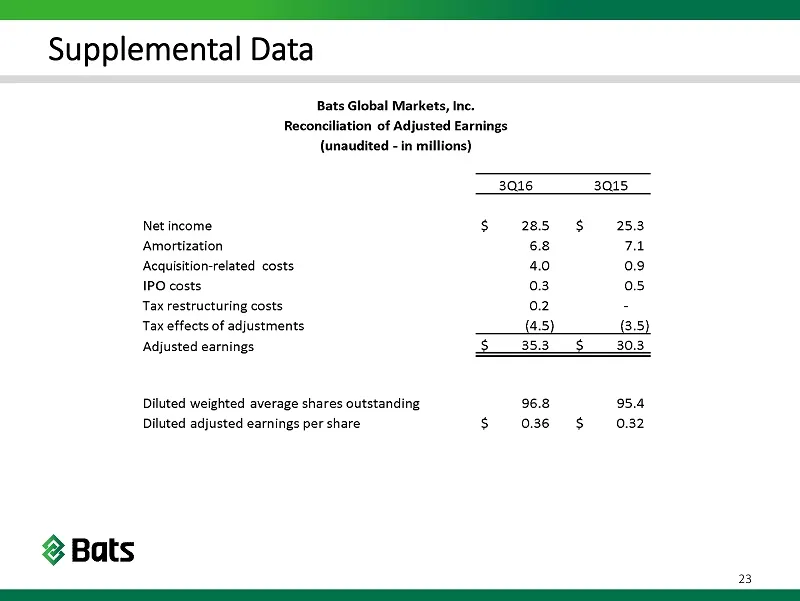
a Supplemental Data Bats Global Markets, Inc. Reconciliation of Adjusted Earnings (unaudited - in millions) 3016 3015 Net income $ 285 $ 253 ‘Amortization 68 ma Acquisition-related costs 40 0.9 IPO costs 03 os Tax restructuring costs 02 - Tax effects of adjustments (4.5) 3.5) Adjusted earnings $35.3
Slide 24: Supplemental Data: Reconciliation of Organic Net Revenue
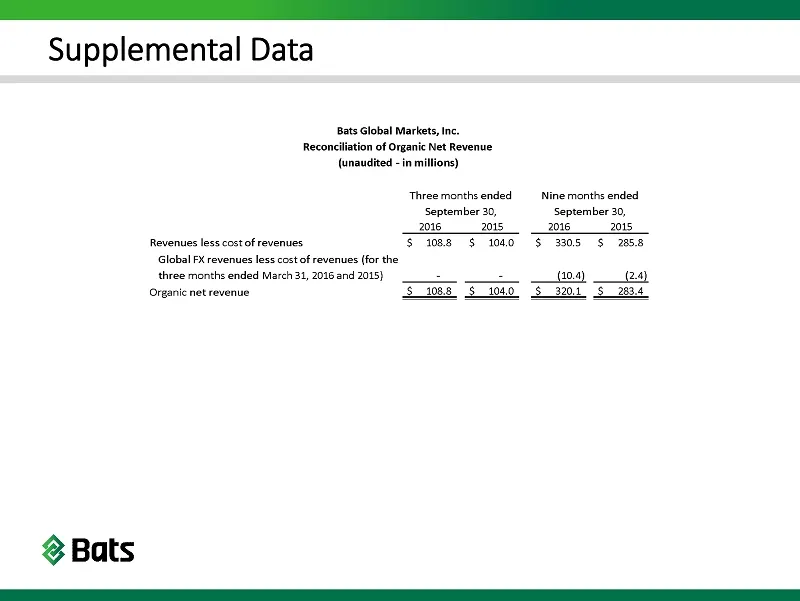
a Supplemental Data Bats Global Markets, Inc. Reconciliation of Organic Net Revenue (unaudited Qs) ‘Three months ended Nine months ended September 20, September 20, 2016 2015 2016 2015 Revenues less cost of revenues $ 13s § 1040 § 3305 § 7258 Global FX revenues less cost of revenues (for the three m
Slide 25: Supplemental Data: Reconciliation of Normalized Operating Expenses
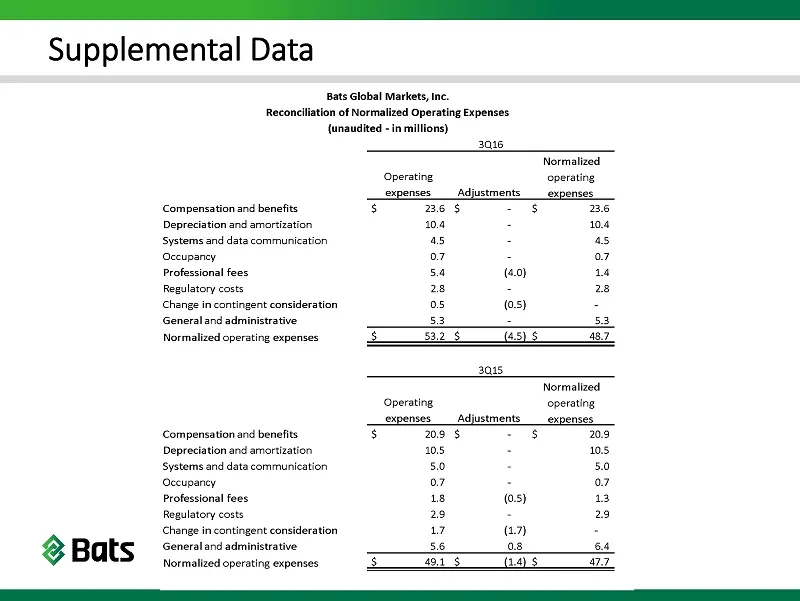
a Supplemental Data Bats Global Markets, Inc. Reconciliation of Normalized Operating Expenses {unaudited -in millions) 3016 Normalized Operating operating expenses Adjustments __ expenses. Compensation and benefits 3 26 5 - 8 26 Depreciation and amortization 104 : 104 ‘systems and date communication
Slide 26: 3Q16 Net Revenue by Segment
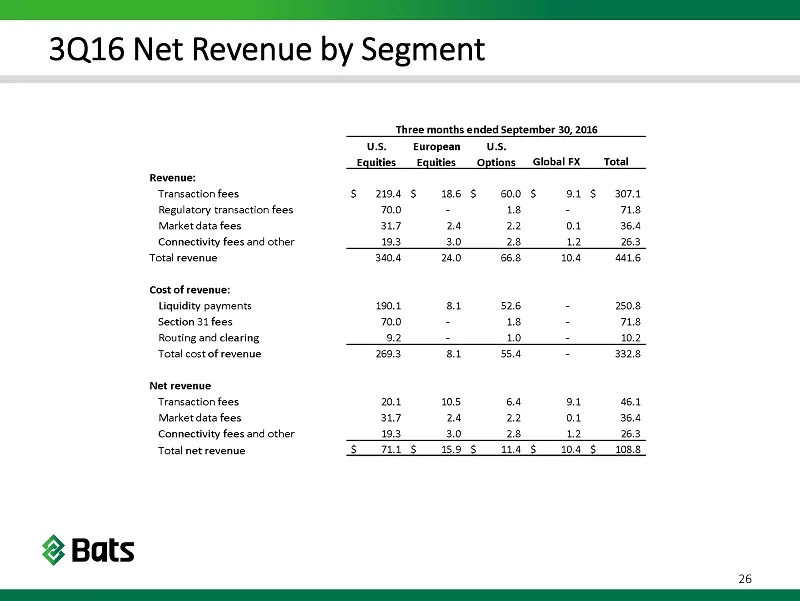
3Q16 Net Revenue by Segment 26
Source: SEC EDGAR · 425 filed Nov 3, 2016
More decks from Bats Global Markets Inc
 Q4 2016 Earnings Presentation25 slides · Feb 9, 2017
 Q4 2016 Earnings Presentation43 slides · Feb 6, 2017
 Merger or Acquisition (February 2017)7 slides · Feb 1, 2017
 Merger or Acquisition (January 2017)7 slides · Jan 18, 2017
 Merger or Acquisition (January 2017)21 slides · Jan 3, 2017
 Merger or Acquisition (December 2016)7 slides · Dec 22, 2016