Bats Global Markets — Q4 2016 Earnings Presentation
43 slides from Bats Global Markets's earnings presentation, Feb 6, 2017
Slide 1: Cautionary Statements Regarding Forward-Looking Information
Cautionary Statements Regarding Forward-Looking Information This presentation contains certain statements regarding intentions, beliefs and expectations or predictions, which are forward-looking statements as that term is defined in the Private Securities Litigation Reform Act of 1995, including sta
Slide 2: Additional Information
Additional Information Additional Information Regarding the Transaction and Where to Find It This presentation does not constitute an offer to sell or the solicitation of an offer to buy any securities. This presentation relates to the proposed merger transaction involving CBOE Holdings, Bats, CBOE
Slide 3: Agenda
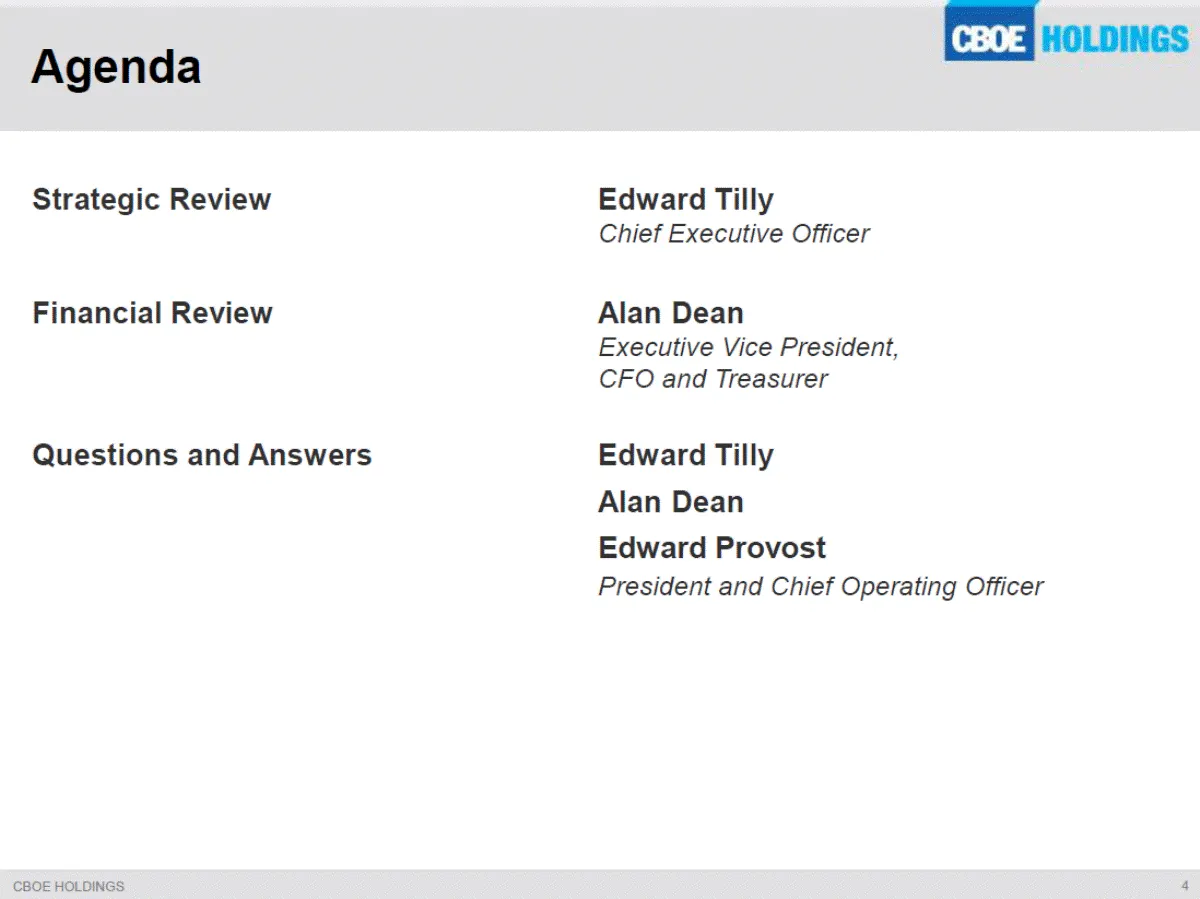
Agenda Strategic Review Edward Tilly Chief Executive Officer Financial Review Alan Dean Executive Vice President, CFO and Treasurer Questions and Answers Edward Tilly Alan Dean Edward Provost President and Chief Operating Officer John Deters Chief Strategy Officer and Head of Corporate Initiatives
Slide 4: Strategic Review
Strategic Review Edward Tilly CEO
Slide 5: Growth in Proprietary Index Suite Continues to Drive Revenue and Earnings
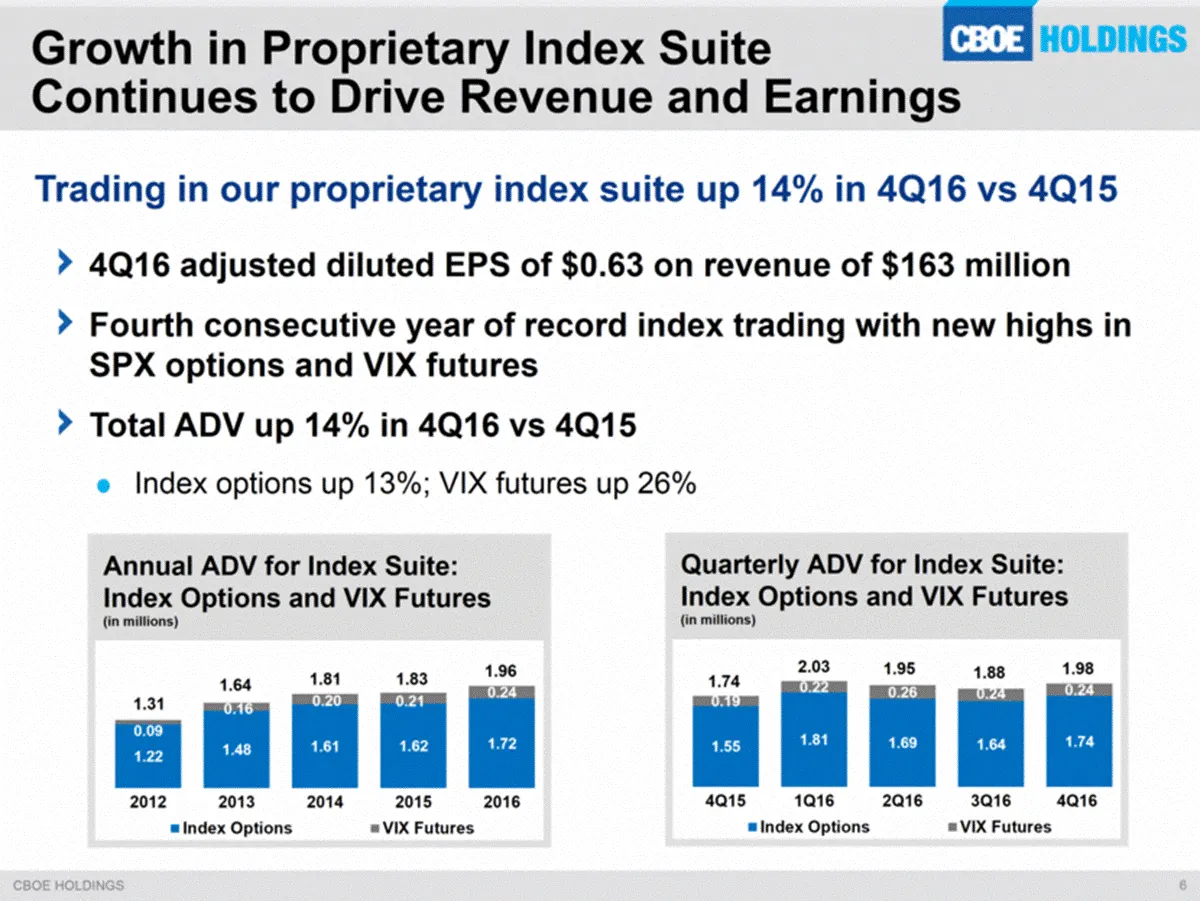
Trading in our proprietary index suite up 14% in 4Q16 vs 4Q15 4Q16 adjusted diluted EPS of $0.63 on revenue of $163 million Fourth consecutive year of record index trading with new highs in SPX options and VIX futures Total ADV up 14% in 4Q16 vs 4Q15 Index options up 13%; VIX futures up 26% Growth i
Slide 6: Key Events in Roadmap to Completion
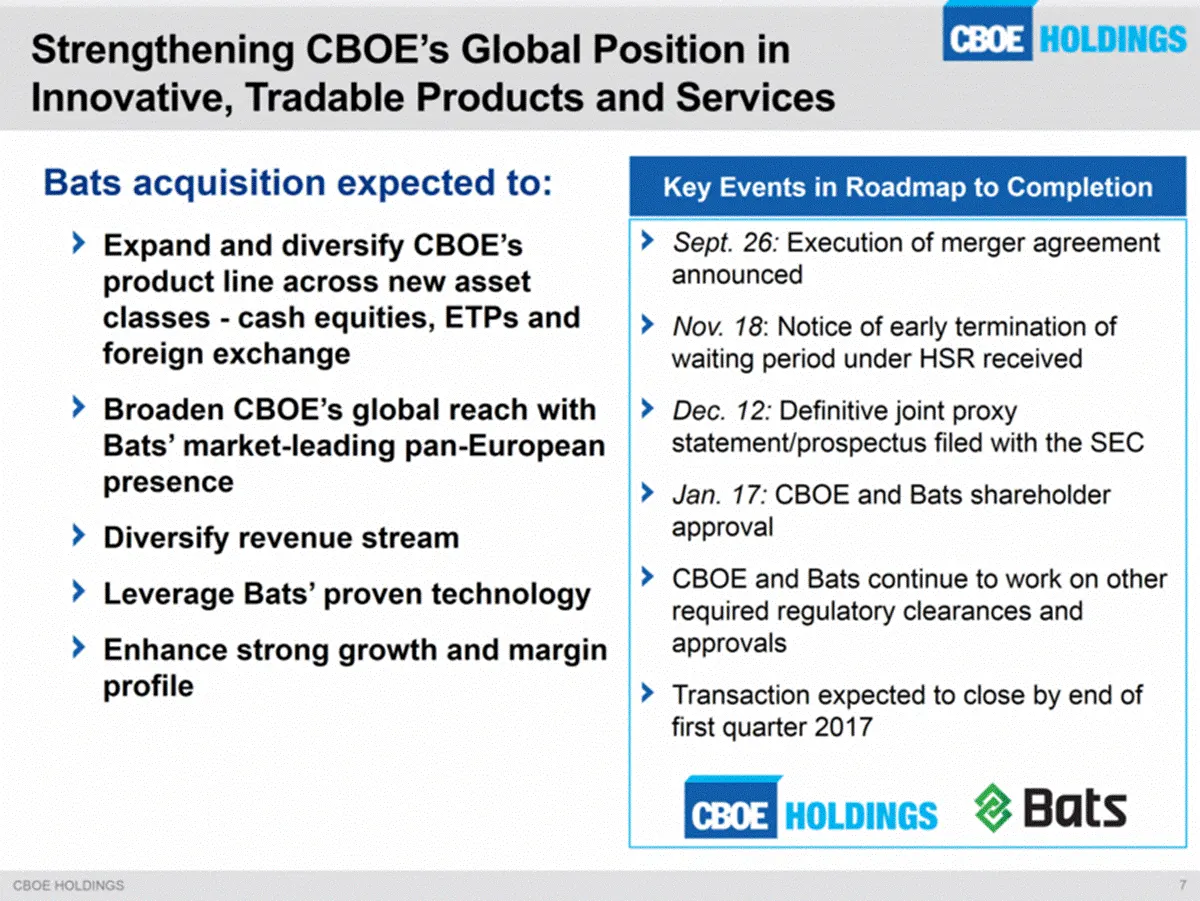
Key Events in Roadmap to Completion Sept. 26: Execution of merger agreement announced Nov. 18: Notice of early termination of waiting period under HSR received Dec. 12: Definitive joint proxy statement/prospectus filed with the SEC Jan. 17: CBOE and Bats shareholder approval CBOE and Bats continue t
Slide 7: Positioning to Better Meet Needs of Growing Index-Based Investing Market
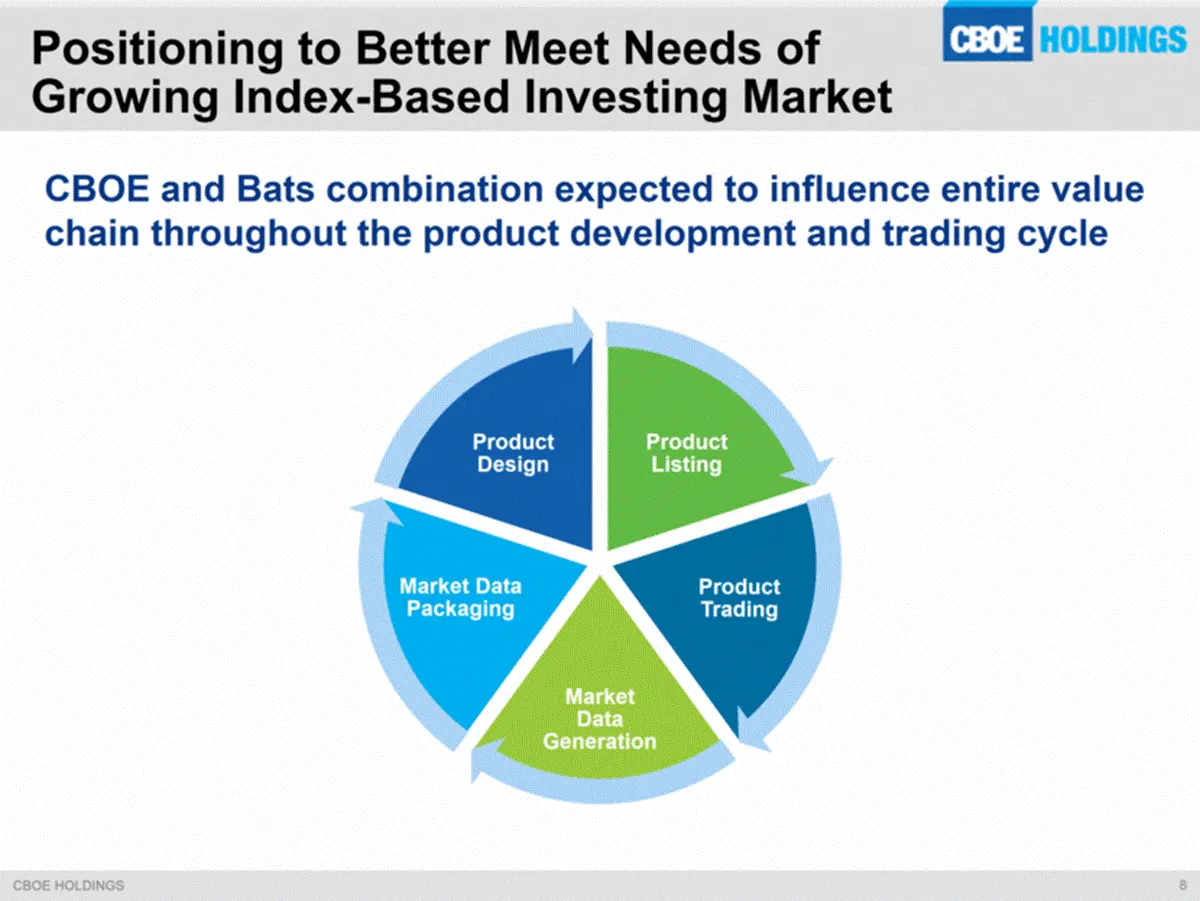
CBOE and Bats combination expected to influence entire value chain throughout the product development and trading cycle Positioning to Better Meet Needs of Growing Index-Based Investing Market Product Listing Product Trading Market Data Generation Market Data Packaging Product Design
Slide 8: Better Positioned to Capitalize on Major Industry Trends
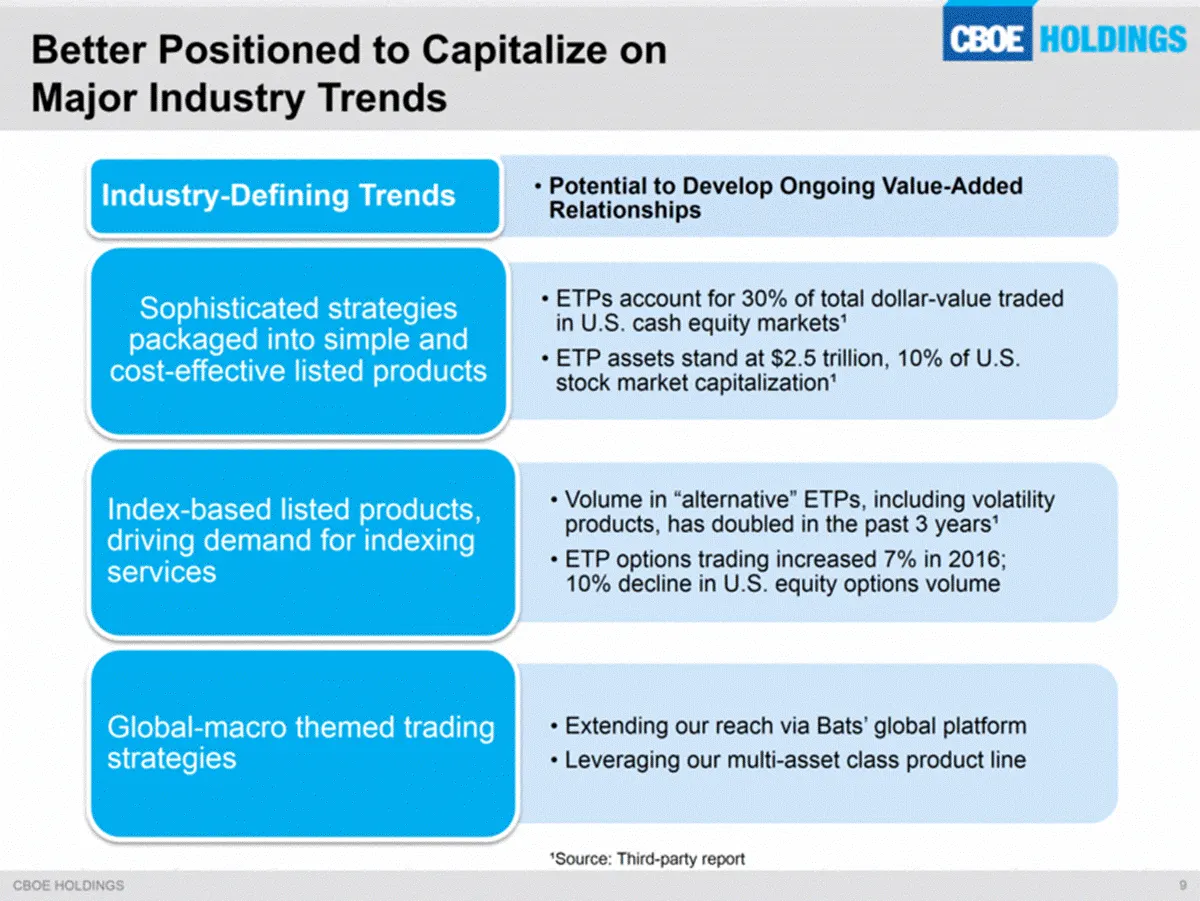
Better Positioned to Capitalize on Major Industry Trends ¹Source: Third-party report Potential to Develop Ongoing Value-Added Relationships Industry-Defining Trends ETPs account for 30% of total dollar-value traded in U.S. cash equity markets¹ ETP assets stand at $2.5 trillion, 10% of U.S. stock mar
Slide 9: Expanding Options and Volatility Trading
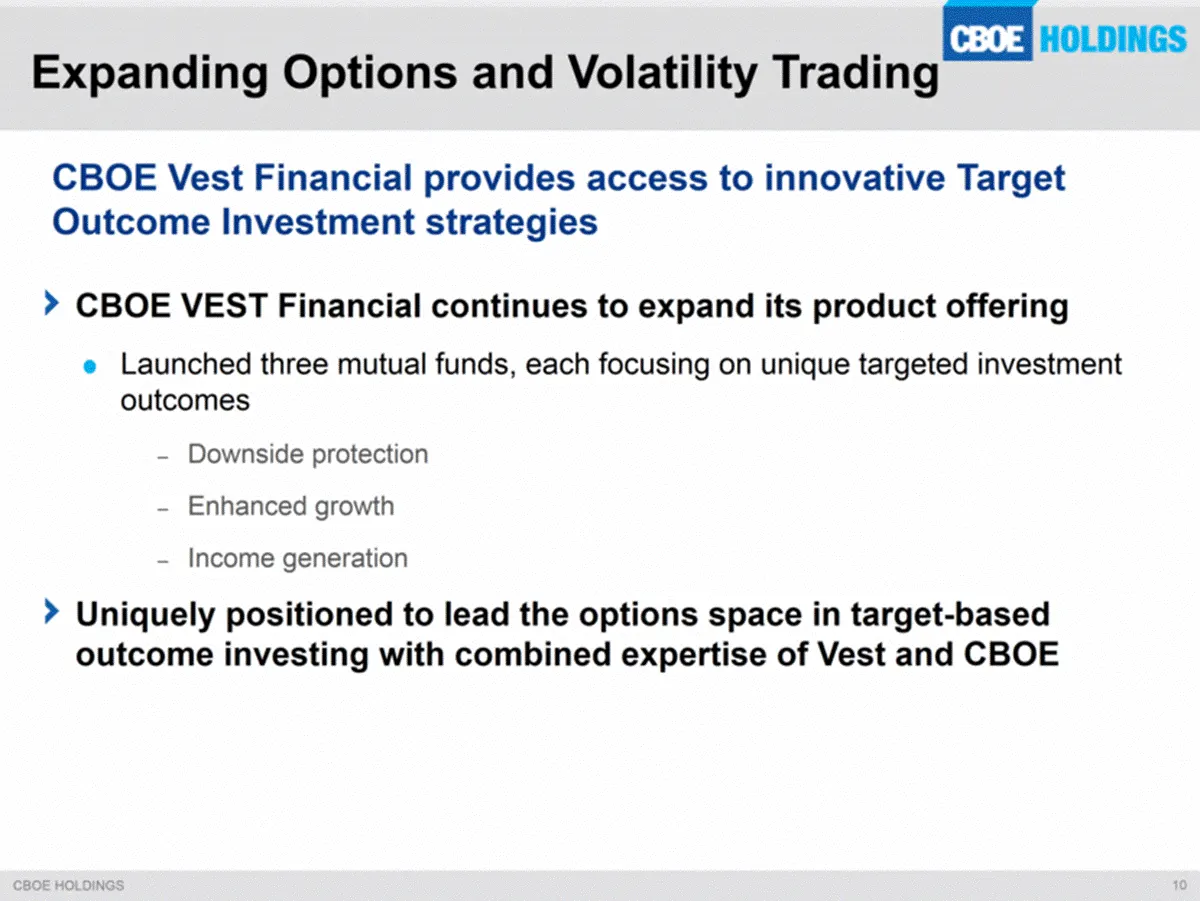
Expanding Options and Volatility Trading CBOE Vest Financial provides access to innovative Target Outcome Investment strategies CBOE VEST Financial continues to expand its product offering Launched three mutual funds, each focusing on unique targeted investment outcomes Downside protection Enhanced
Slide 10: Expanding Our Global Customer Base and Product Line
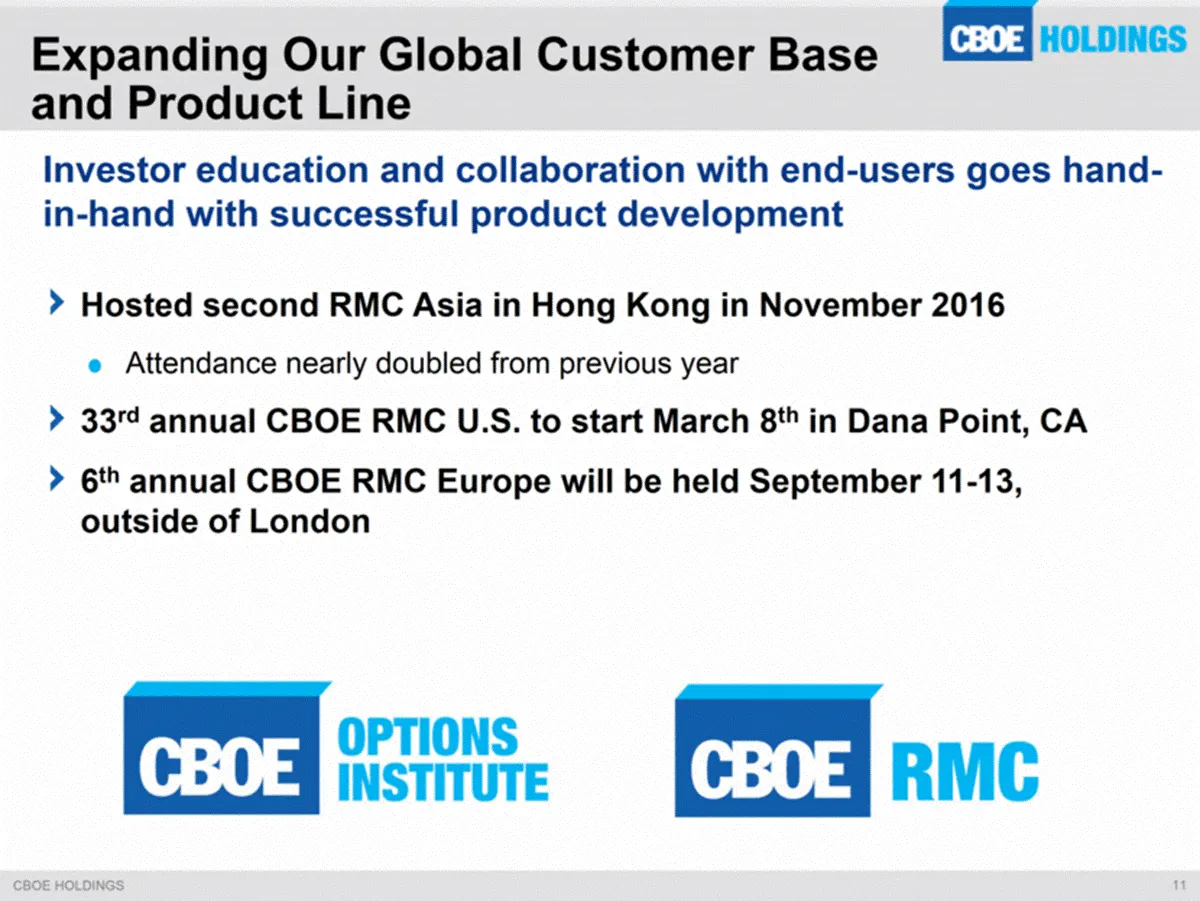
Hosted second RMC Asia in Hong Kong in November 2016 Attendance nearly doubled from previous year 33rd annual CBOE RMC U.S. to start March 8th in Dana Point, CA 6th annual CBOE RMC Europe will be held September 11-13, outside of London Expanding Our Global Customer Base and Product Line Investor edu
Slide 11: CBOE's Strategic Initiatives
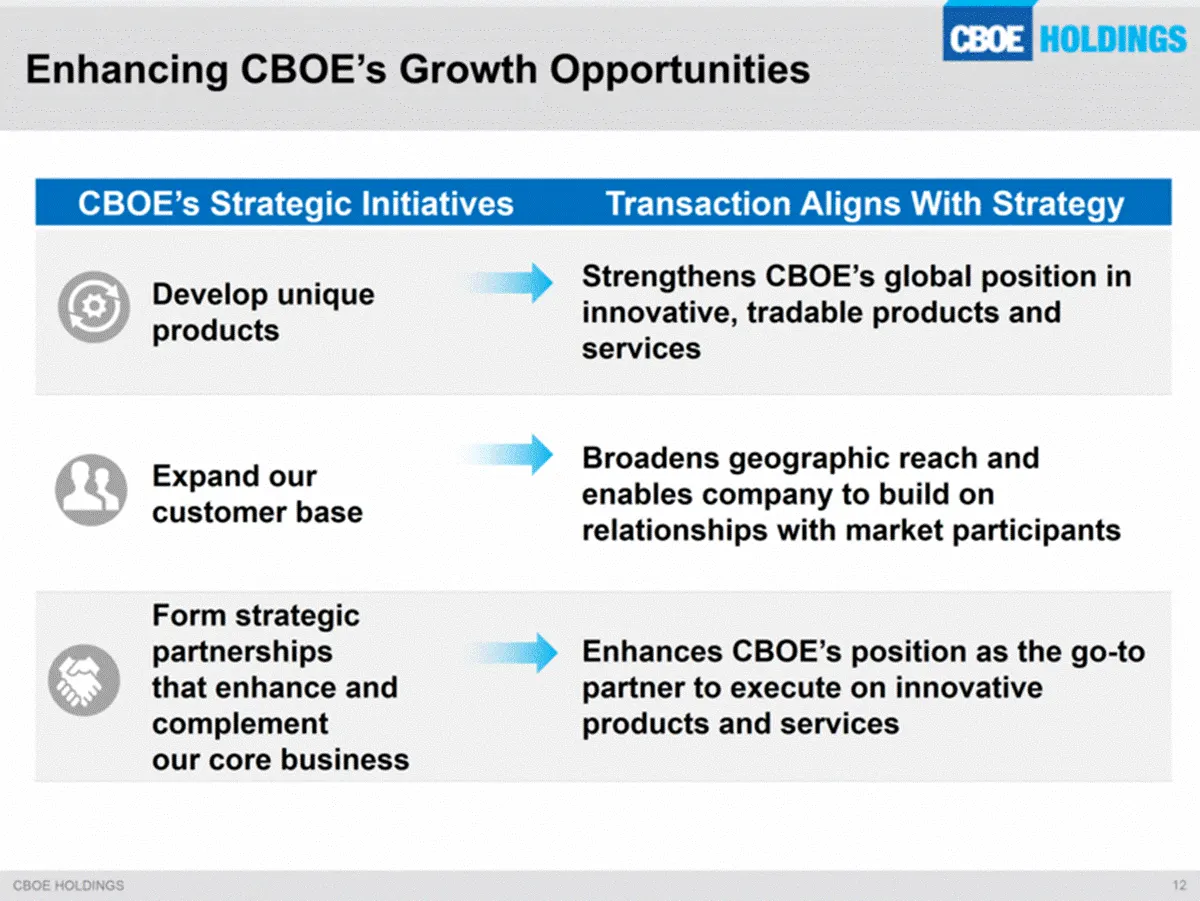
CBOE’s Strategic Initiatives Transaction Aligns With Strategy Develop unique products Strengthens CBOE’s global position in innovative, tradable products and services Expand our customer base Broadens geographic reach and enables company to build on relationships with market participants Form strate
Slide 12: Financial Review
Financial Review Alan Dean EVP, CFO and Treasurer
Slide 13: 4Q16 Financial Overview
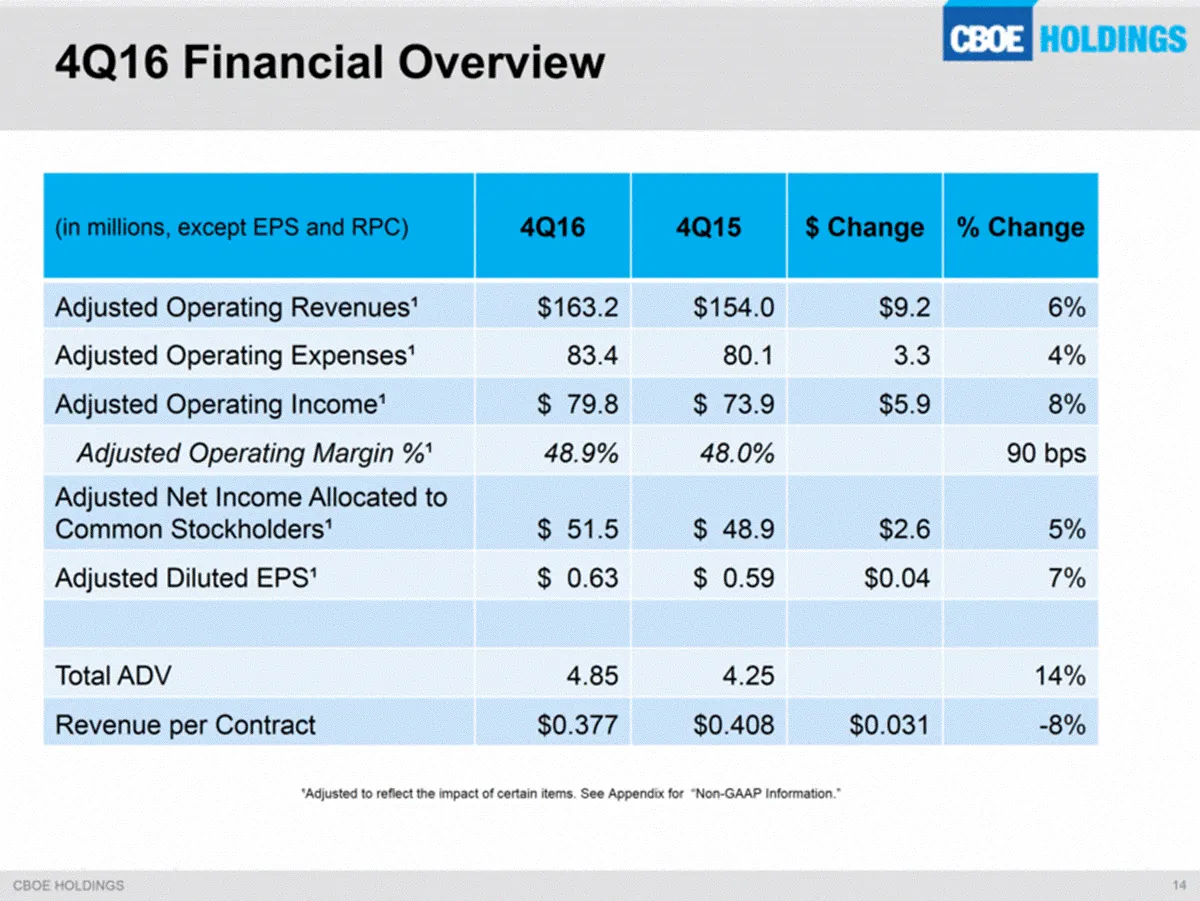
4Q16 Financial Overview (in millions, except EPS and RPC) 4Q16 4Q15 $ Change % Change Adjusted Operating Revenues¹ $163.2 $154.0 $9.2 6% Adjusted Operating Expenses¹ 83.4 80.1 3.3 4% Adjusted Operating Income¹ $ 79.8 $ 73.9 $5.9 8% Adjusted Operating Margin %¹ 48.9% 48.0% 90 bps Adjusted Net Income
Slide 14: Operating Revenue Increase Driven by Higher Trading Volume
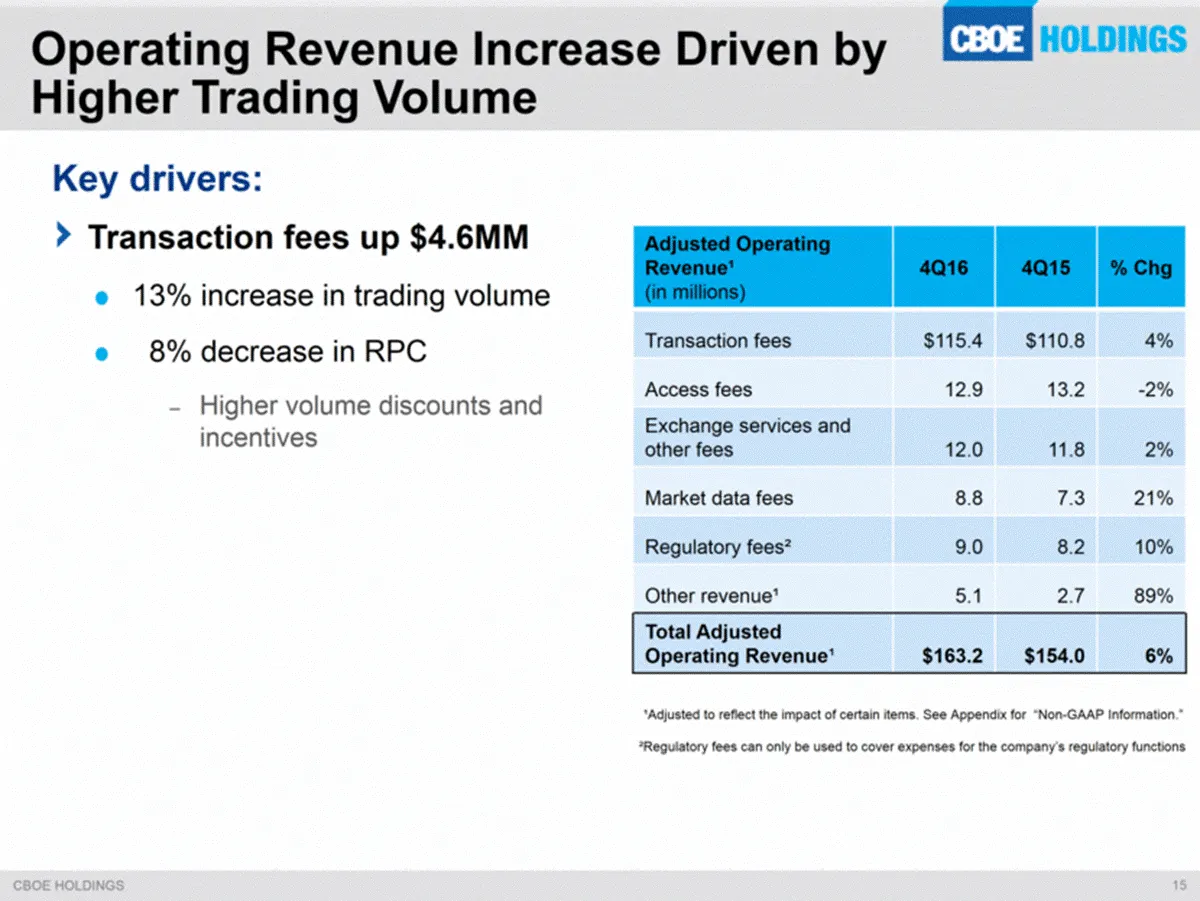
Operating Revenue Increase Driven by Higher Trading Volume Transaction fees up $4.6MM 13% increase in trading volume 8% decrease in RPC Higher volume discounts and incentives Adjusted Operating Revenue¹ (in millions) 4Q16 4Q15 % Chg Transaction fees $115.4 $110.8 4% Access fees 12.9 13.2 -2% Exchang
Slide 15: RPC Decrease Primarily Reflects Higher Volume Discounts and Incentives
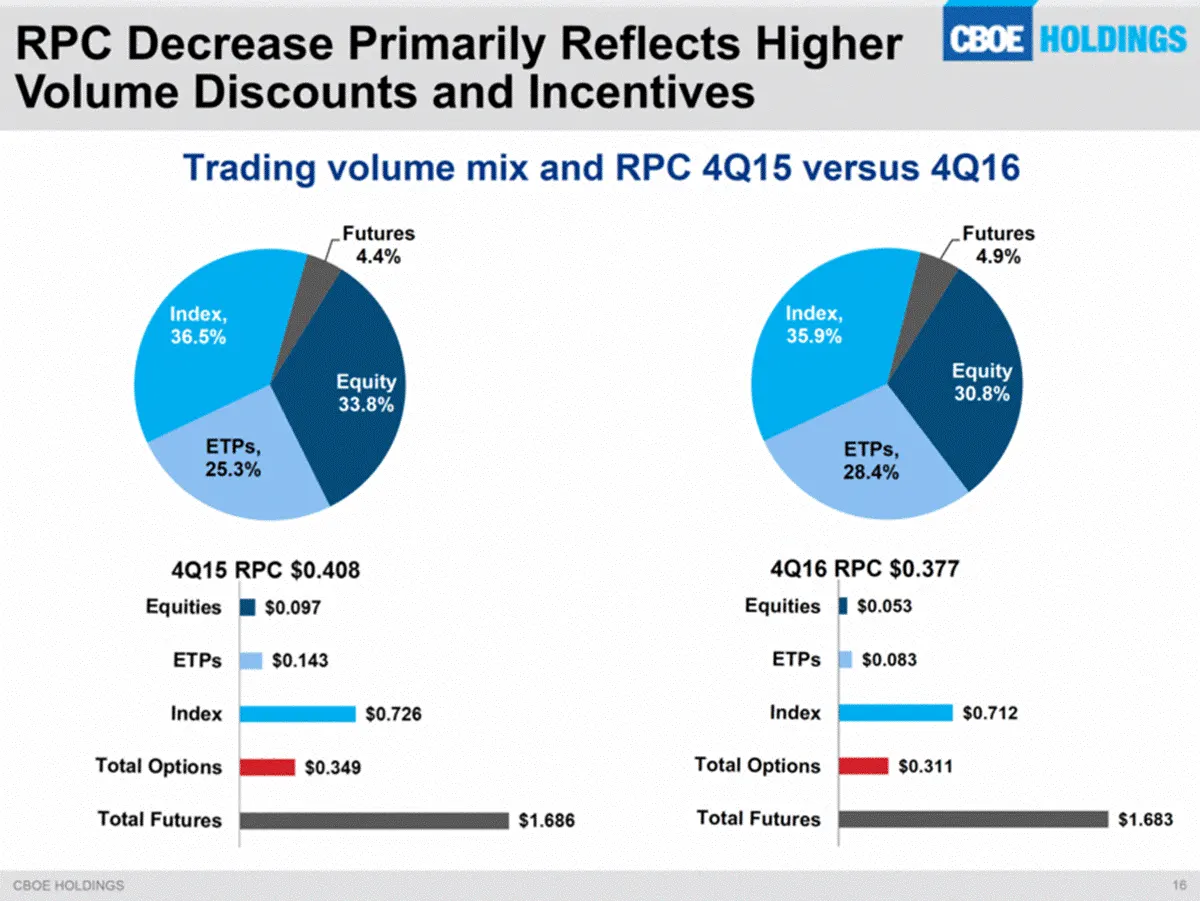
RPC Decrease Primarily Reflects Higher Volume Discounts and Incentives Trading volume mix and RPC 4Q15 versus 4Q16 Equity 30.8% ETPs , 28.4% Index , 35.9% Futures 4.9% Equity 33.8% ETPs , 25.3% Index , 36.5% Futures 4.4% $1.683 $0.311 $0.712 $0.083 $0.053 4Q16 RPC $0.377
Slide 16: Proprietary Products Account for Growing Percentage of Transaction Fee Revenue
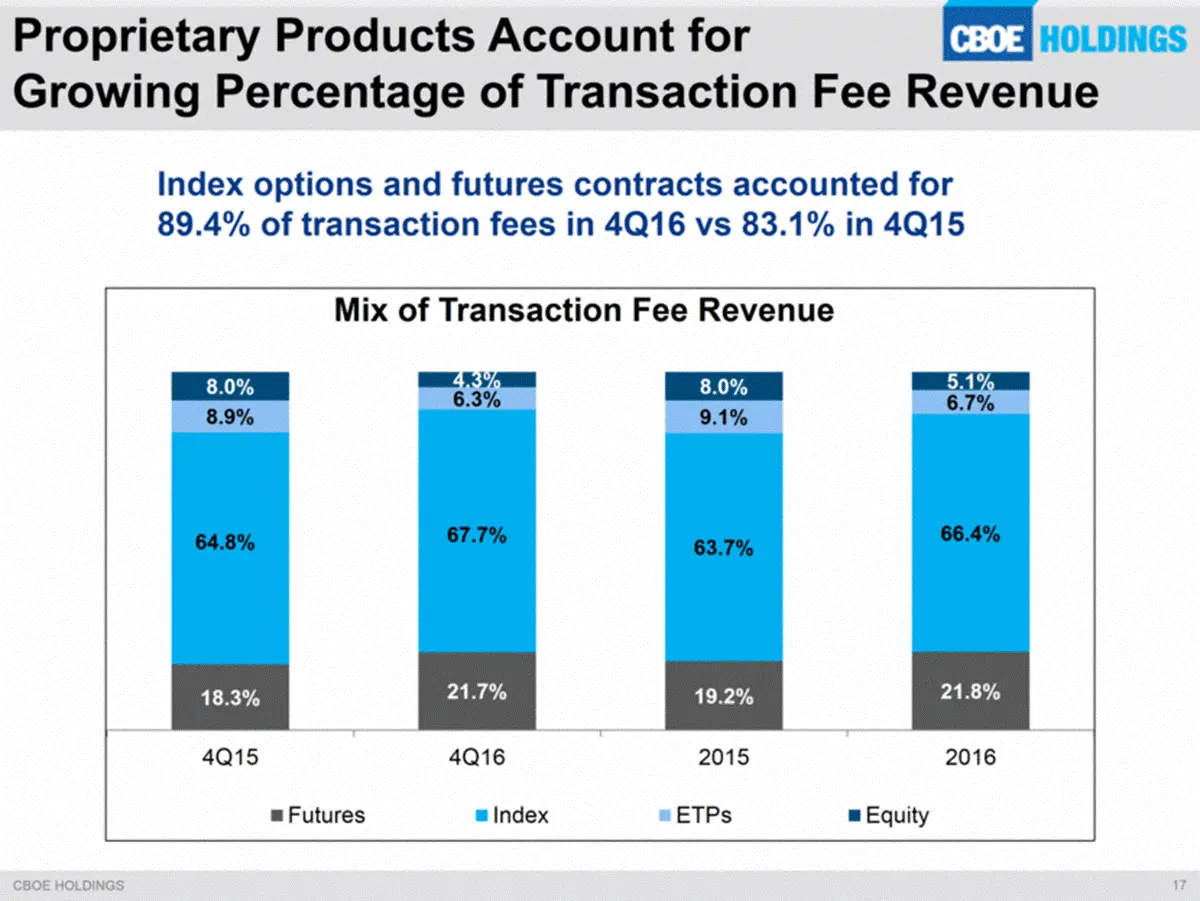
Proprietary Products Account for Growing Percentage of Transaction Fee Revenue Index options and futures contracts accounted for 89.4% of transaction fees in 4Q16 vs 83.1% in 4Q15 18.3% 21.7% 19.2% 21.8% 64.8% 67.7% 63.7% 66.4% 8.9% 6.3% 9.1% 6.7% 8.0% 4.3% 8.0% 5.1% 4Q15 4Q16 2015 2016 Mix of Trans
Slide 17: Other Operating Revenue Drivers
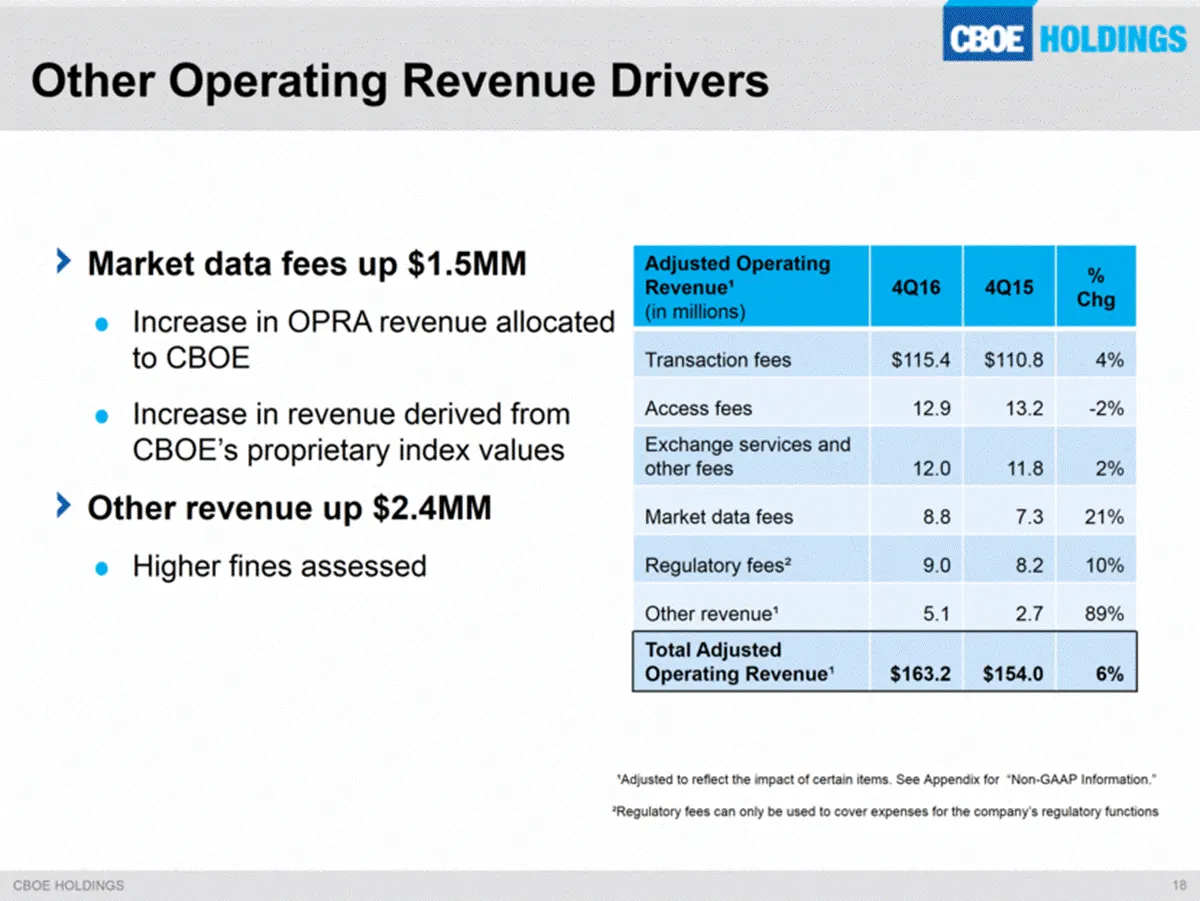
Other Operating Revenue Drivers Market data fees up $1.5MM Increase in OPRA revenue allocated to CBOE Increase in revenue derived from CBOE’s proprietary index values Other revenue up $2.4MM Higher fines assessed Adjusted Operating Revenue¹ (in millions) 4Q16 4Q15 % Chg Transaction fees $115.4 $110.
Slide 18: Ongoing Focus on Expense Management
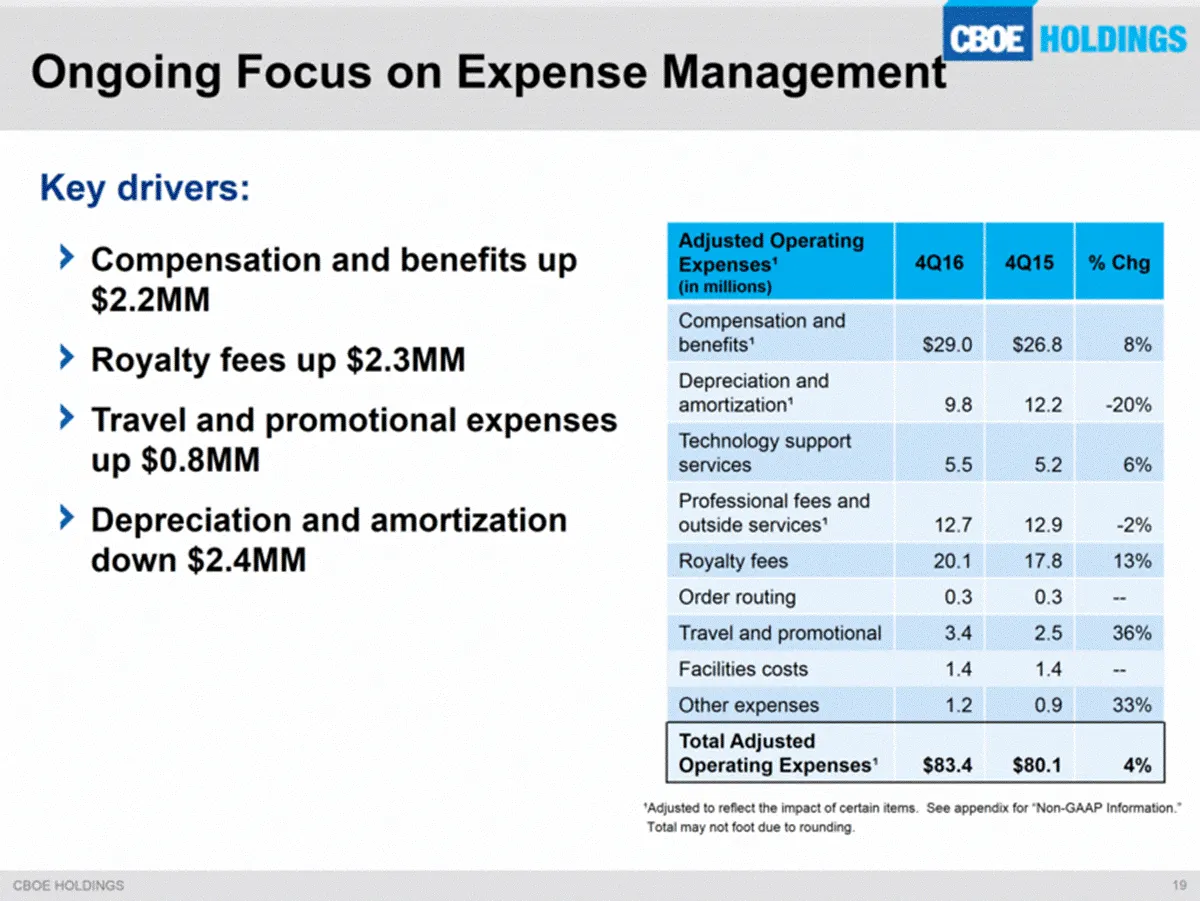
Ongoing Focus on Expense Management Key drivers: Compensation and benefits up $2.2MM Royalty fees up $2.3MM Travel and promotional expenses up $0.8MM Depreciation and amortization down $2.4MM Adjusted Operating Expenses¹ (in millions) 4Q16 4Q15 % Chg Compensation and benefits¹ $29.0 $26.8 8% Depreci
Slide 19: Core Operating Expenses Up 7% in 4Q16 vs 4Q15
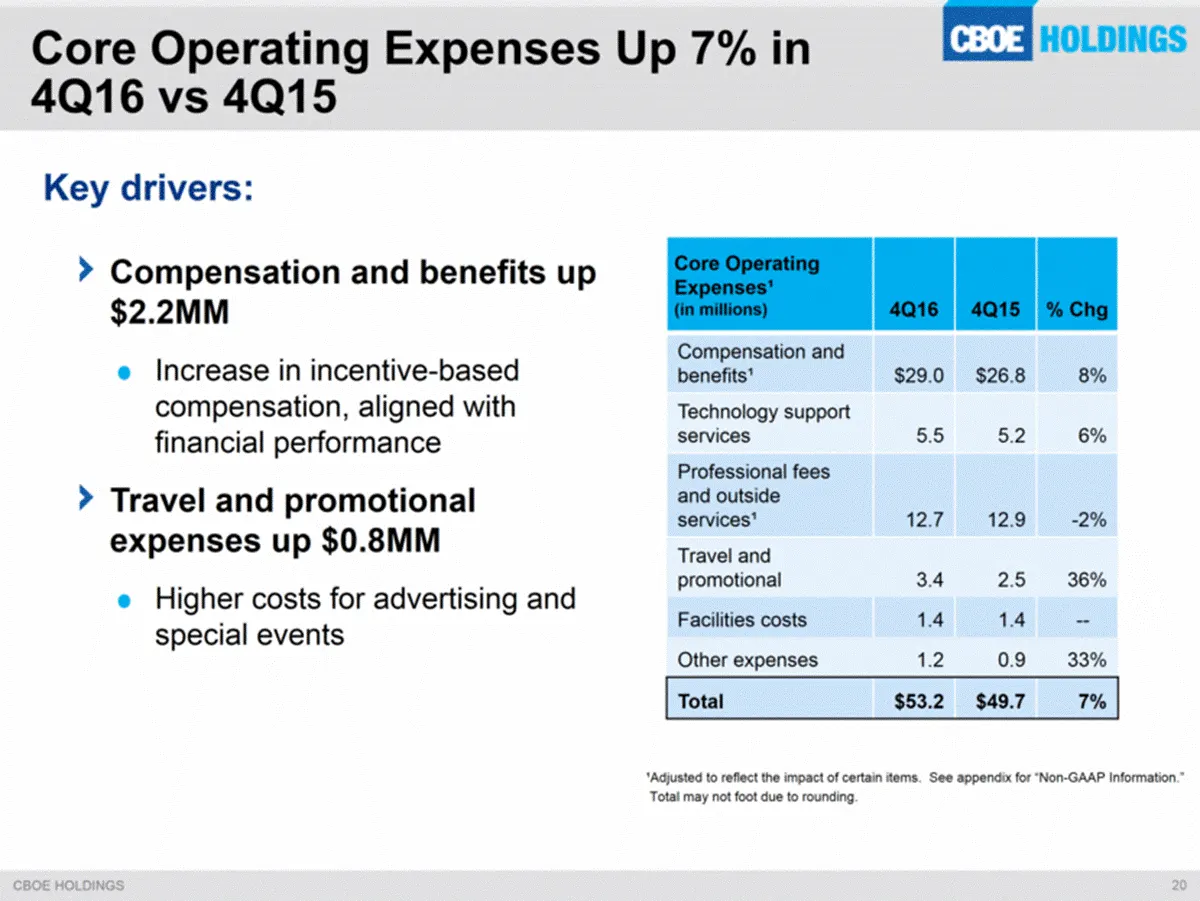
Key drivers: Core Operating Expenses¹ (in millions) 4Q16 4Q15 % Chg Compensation and benefits¹ $29.0 $26.8 8% Technology support services 5.5 5.2 6% Professional fees and outside services¹ 12.7 12.9 -2% Travel and promotional 3.4 2.5 36% Facilities costs 1.4 1.4 -- Other expenses 1.2 0.9 33% Total $
Slide 20: Volume-Based Expenses
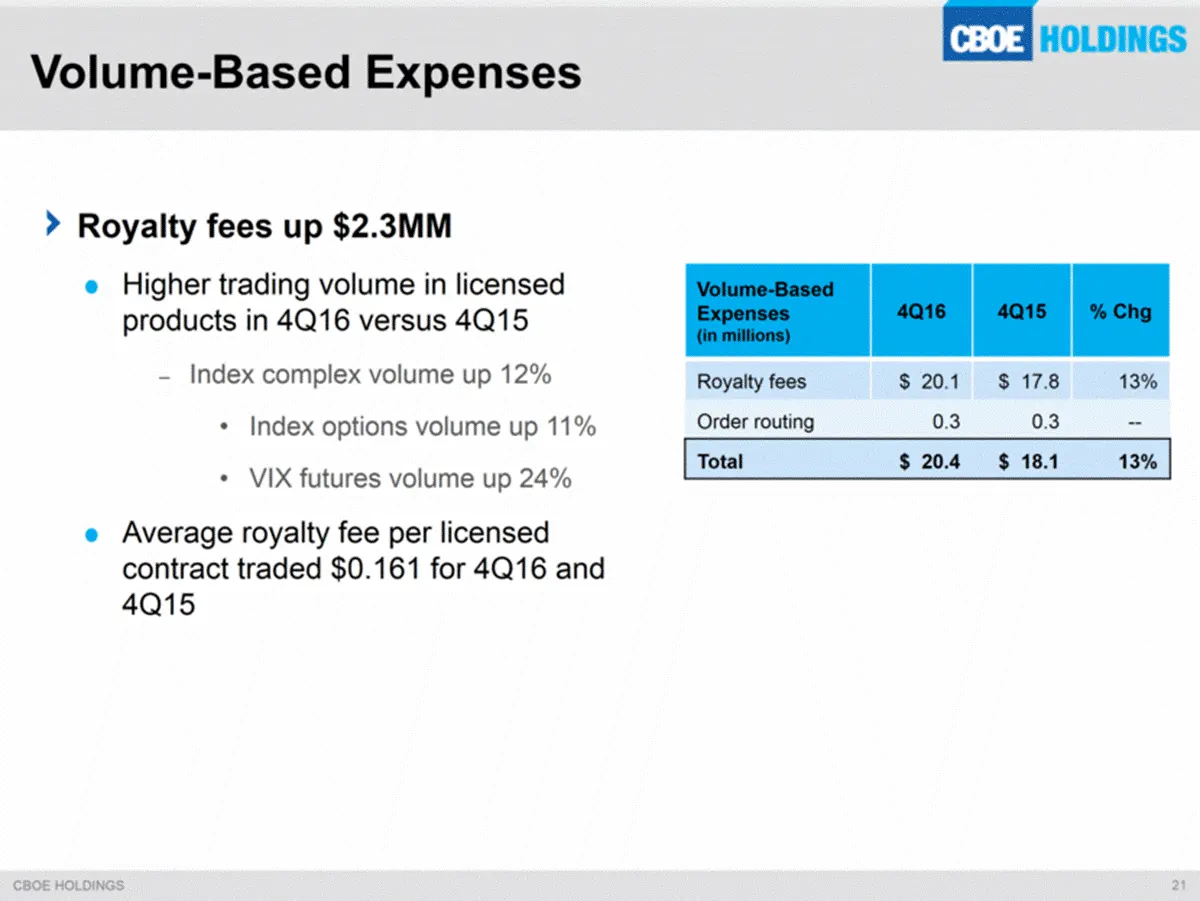
Volume-Based Expenses Royalty fees up $2.3MM Higher trading volume in licensed products in 4Q16 versus 4Q15 Index complex volume up 12% Index options volume up 11% VIX futures volume up 24% Average royalty fee per licensed contract traded $0.161 for 4Q16 and 4Q15 Volume-Based Expenses (in millions)
Slide 21: 4Q16 Financial Review
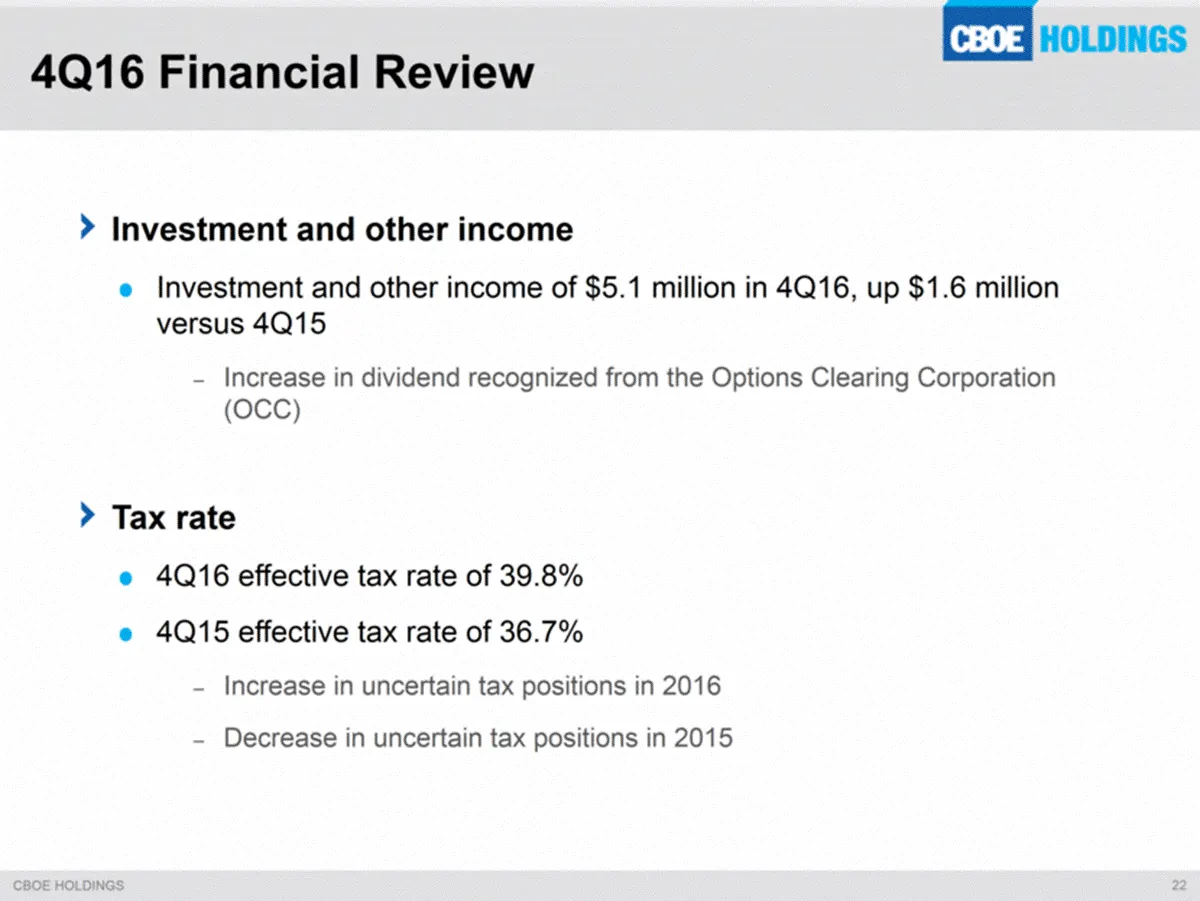
4Q16 Financial Review Investment and other income Investment and other income of $5.1 million in 4Q16, up $1.6 million versus 4Q15 Increase in dividend recognized from the Options Clearing Corporation (OCC) Tax rate 4Q16 effective tax rate of 39.8% 4Q15 effective tax rate of 36.7% Increase in uncert
Slide 22: Enhancing Shareholder Value
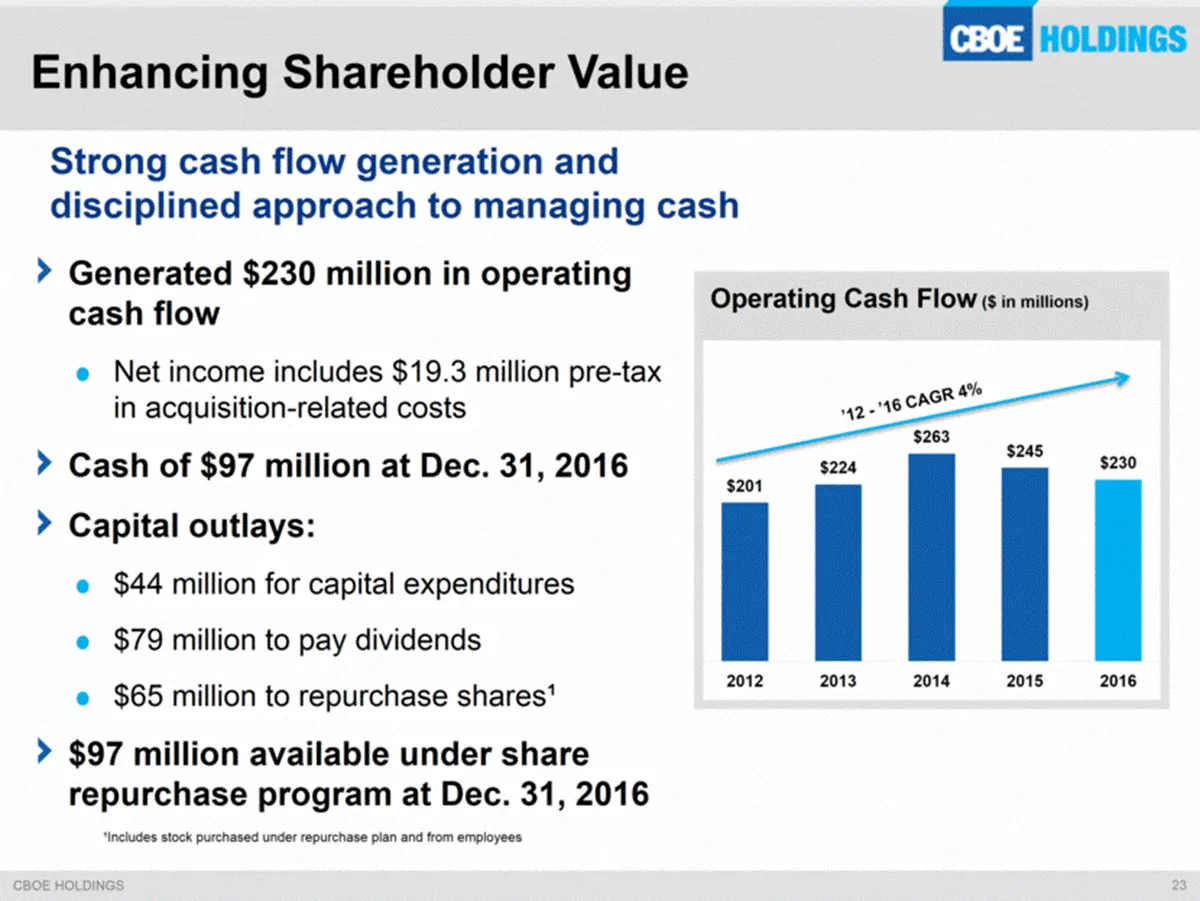
Enhancing Shareholder Value ’12 - ’16 CAGR 4% Strong cash flow generation and disciplined approach to managing cash Generated $230 million in operating cash flow Net income includes $19.3 million pre-tax in acquisition-related costs Cash of $97 million at Dec. 31, 2016 Capital outlays: $44 million f
Slide 23: 2017 Full-Year Guidance
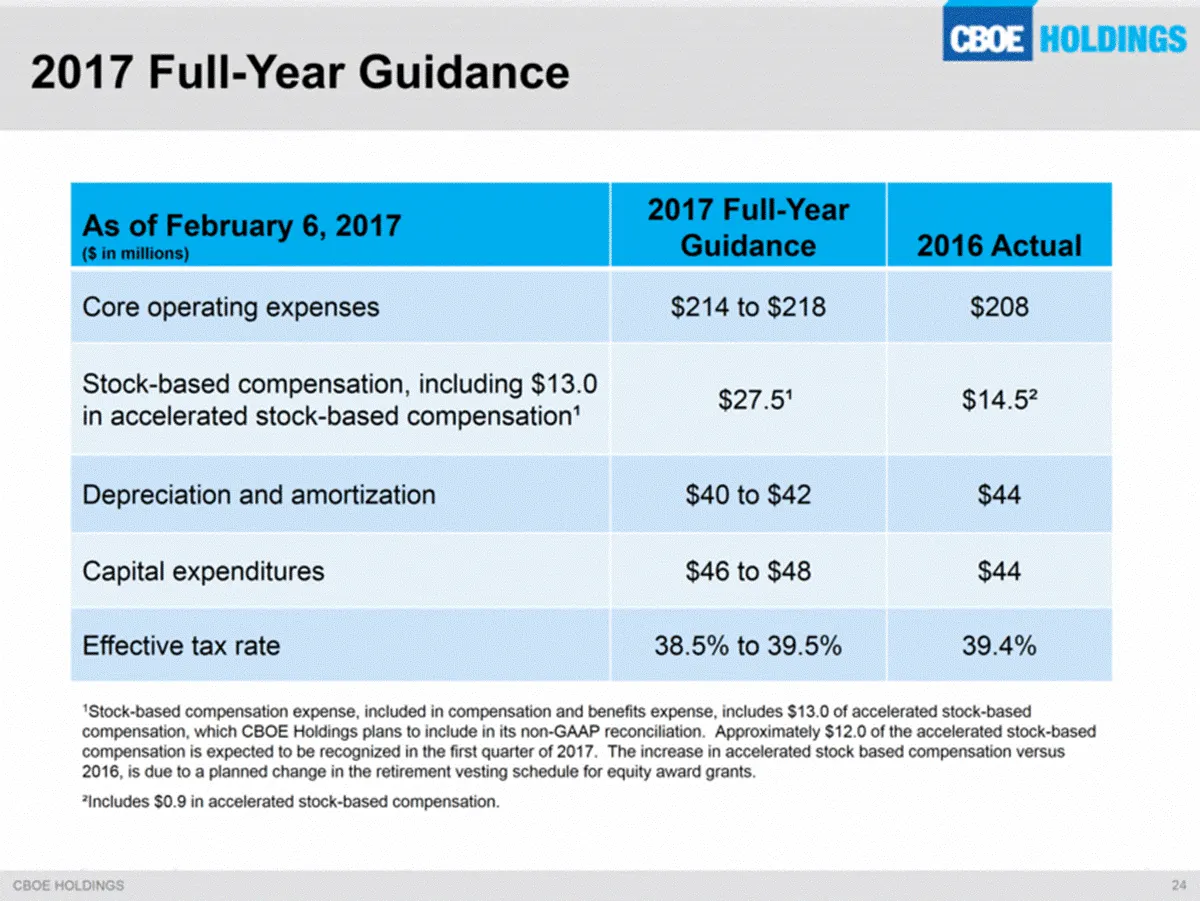
2017 Full-Year Guidance As of February 6, 2017 ($ in millions) 2017 Full-Year Guidance 2016 Actual Core operating expenses $214 to $218 $208 Stock-based compensation, including $13.0 in accelerated stock-based compensation¹ $27.5¹ $14.5² Depreciation and amortization $40 to $42 $44 Capital expenditu
Slide 24: Committed to Long-Term Value Creation for Shareholders
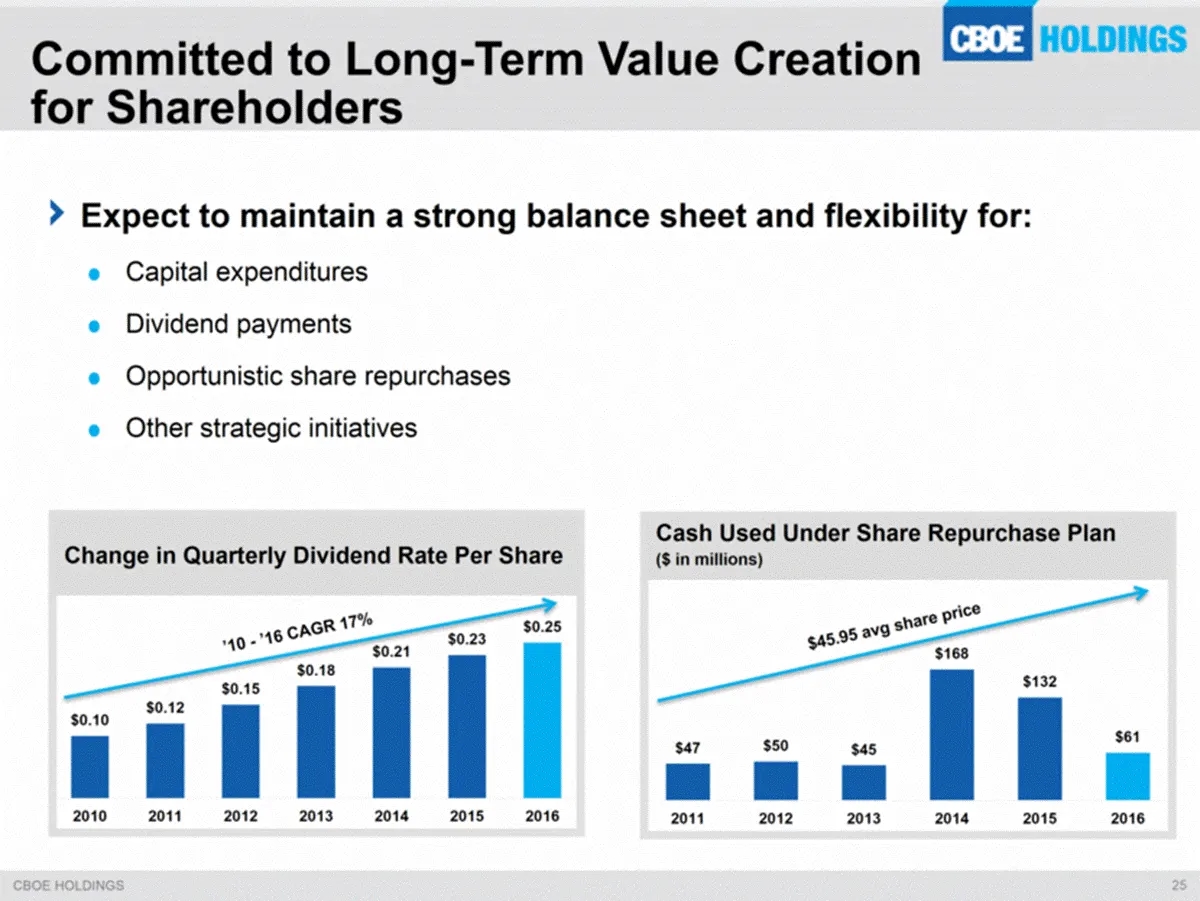
Expect to maintain a strong balance sheet and flexibility for: Capital expenditures Dividend payments Opportunistic share repurchases Other strategic initiatives Committed to Long-Term Value Creation for Shareholders $47 $50 $45 $168 $132 $61 2011 2012 2013 2014 2015 2016 Cash Used Under Share Repur
Slide 25: Committed to Long-Term Value Creation for Shareholders
Committed to Long-Term Value Creation cae [nT for Shareholders > Expect to maintain a strong balance sheet and flexibility for: e Capital expenditures e Dividend payments e Opportunistic share repurchases e Other strategic initiatives Cash Used Under Share Repurchase Plan Change in Quarterly Dividen
Slide 26: Questions & Answers
(Ev HOLDINGS Questions & Answers
Slide 27: Strong Track Record of Organic Growth
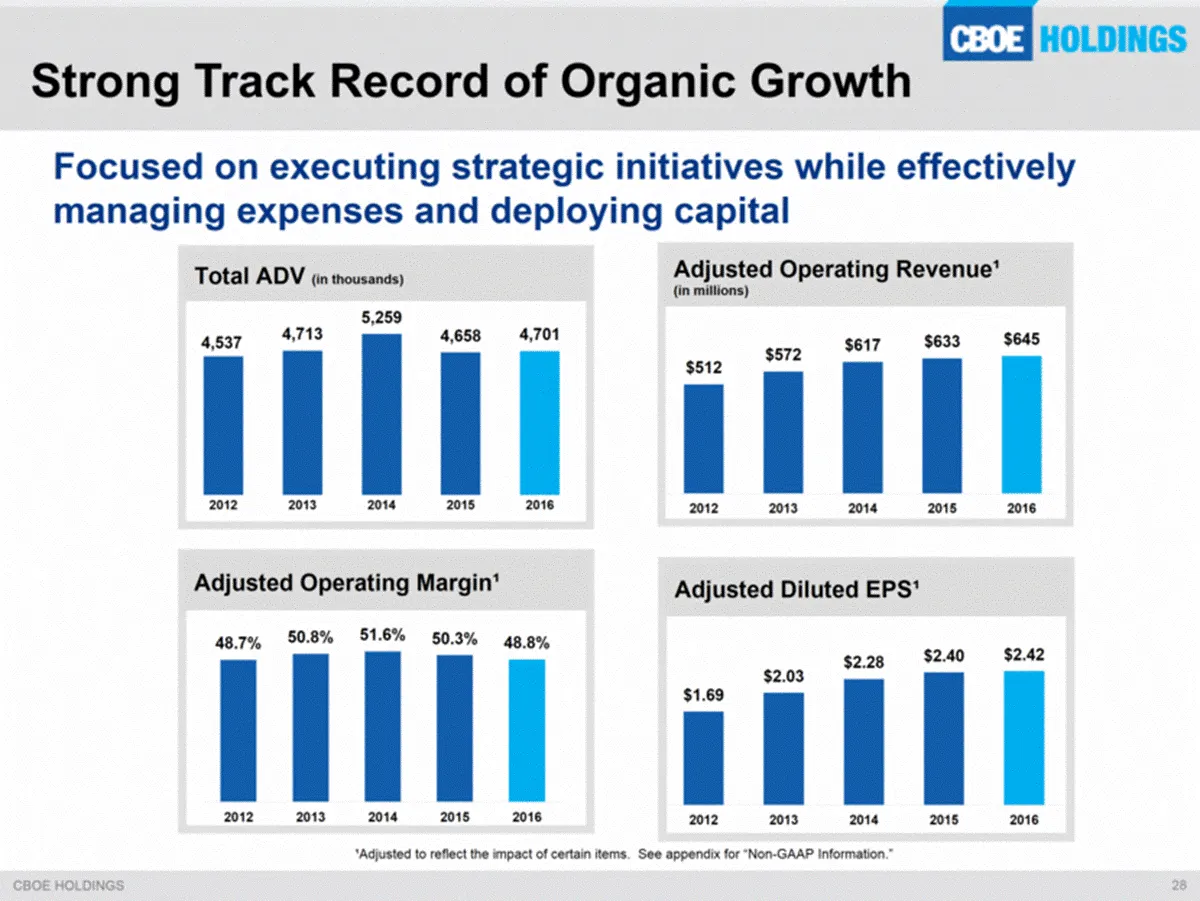
Focused on executing strategic initiatives while effectively managing expenses and deploying capital Strong Track Record of Organic Growth ¹Adjusted to reflect the impact of certain items. See appendix for “Non-GAAP Information.” $512 $572 $617 $633 $645 2012 2013 2014 2015 2016 Adjusted Operating R
Slide 28: Optimistic About Long-Term Growth Prospects
¹Adjusted to reflect the impact of certain items. See Appendix for “Non-GAAP Information.” Optimistic About Long-Term Growth Prospects $0.20 $0.25 $0.30 $0.35 $0.40 $0.45 $0.50 $0.55 $0.60 $0.65 $0.70 $0.75 $0.80 $0 $20 $40 $60 $80 $100 $120 $140 $160 $180 1Q12 2Q12 3Q12 4Q12 1Q13 2Q13 3Q13 4Q13 1Q1
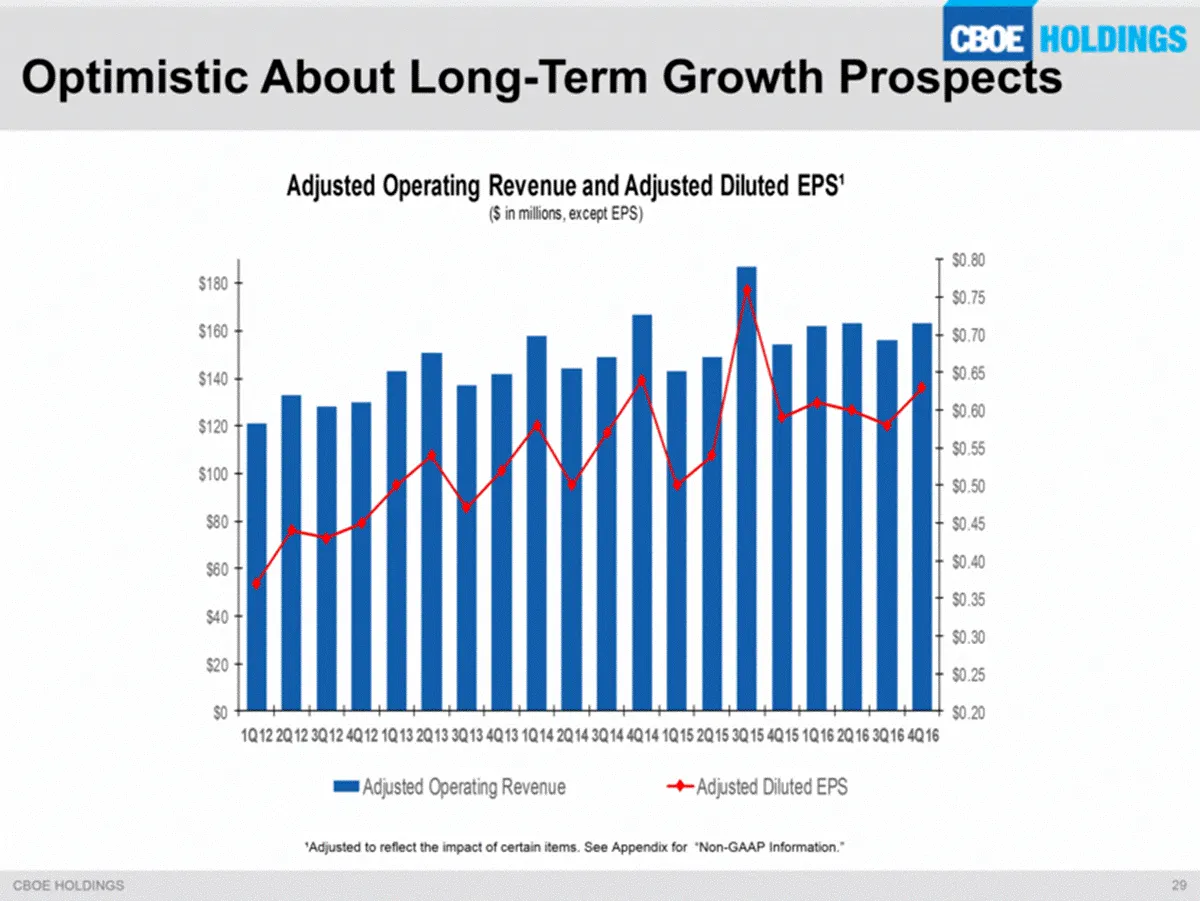
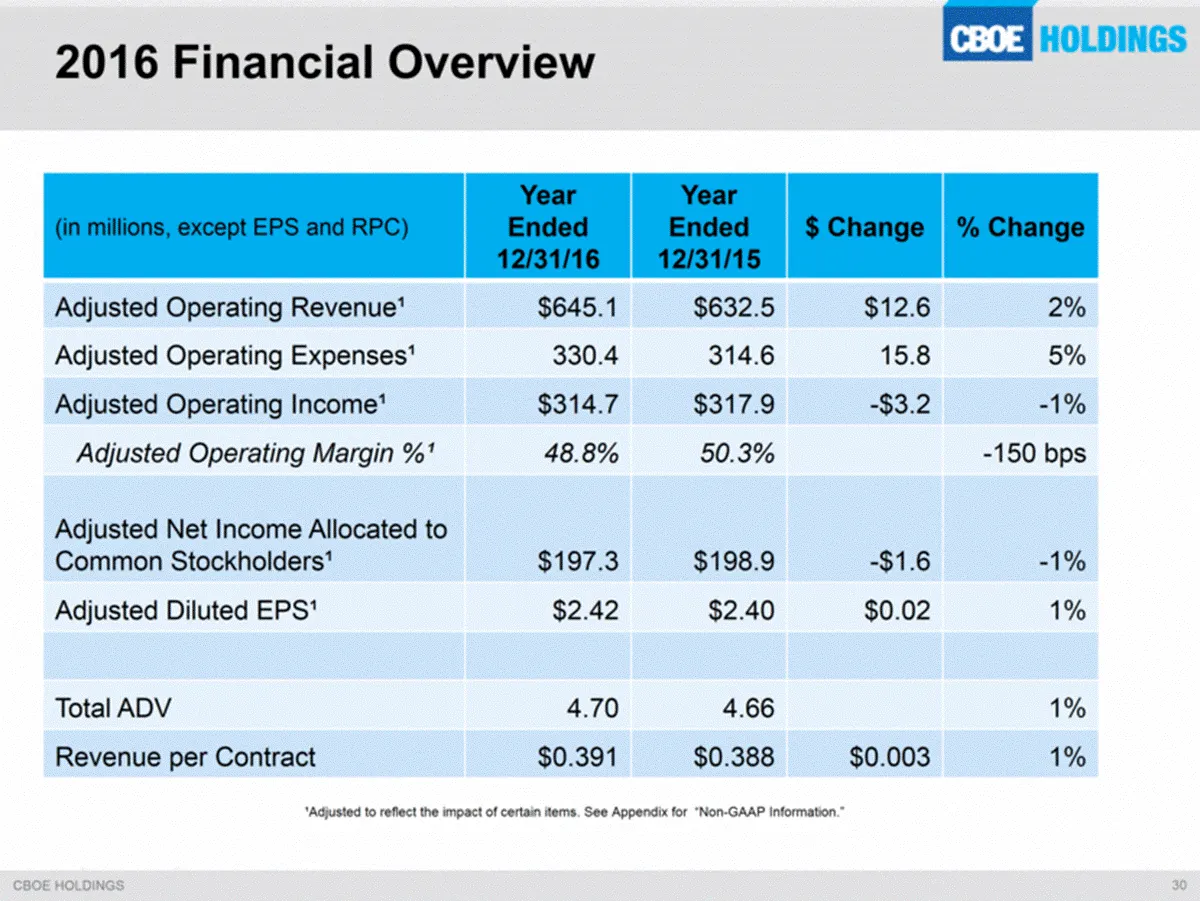
Slide 29: 2016 Financial Overview
2016 Financial Overview (in millions, except EPS and RPC) Year Ended 12/31/16 Year Ended 12/31/15 $ Change % Change Adjusted Operating Revenue¹ $645.1 $632.5 $12.6 2% Adjusted Operating Expenses¹ 330.4 314.6 15.8 5% Adjusted Operating Income¹ $314.7 $317.9 -$3.2 -1% Adjusted Operating Margin %¹ 48.8
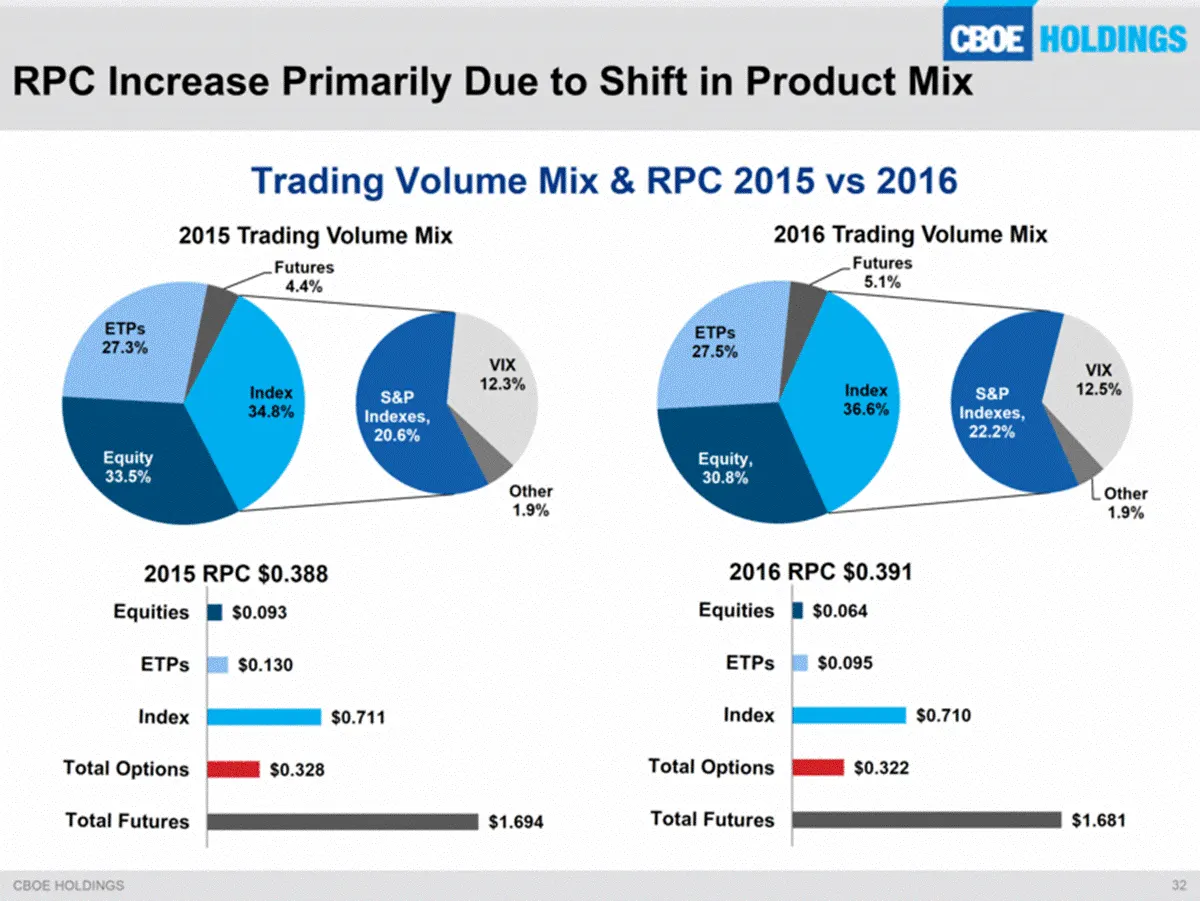
Slide 30: Proprietary Products Account for Growing Percentage of Transaction Fee Revenue
Proprietary Products Account for Growing Percentage of Transaction Fee Revenue Index options and futures contracts accounted for 88.2% of transaction fees in 2016, up from 50.6% in 2010 2.3% 4.6% 10.5% 15.9% 18.8% 19.2% 21.8% 48.3% 52.9% 57.2% 62.9% 63.0% 63.7% 66.4% 19.0% 19.9% 15.6% 11.0% 9.7% 9.1
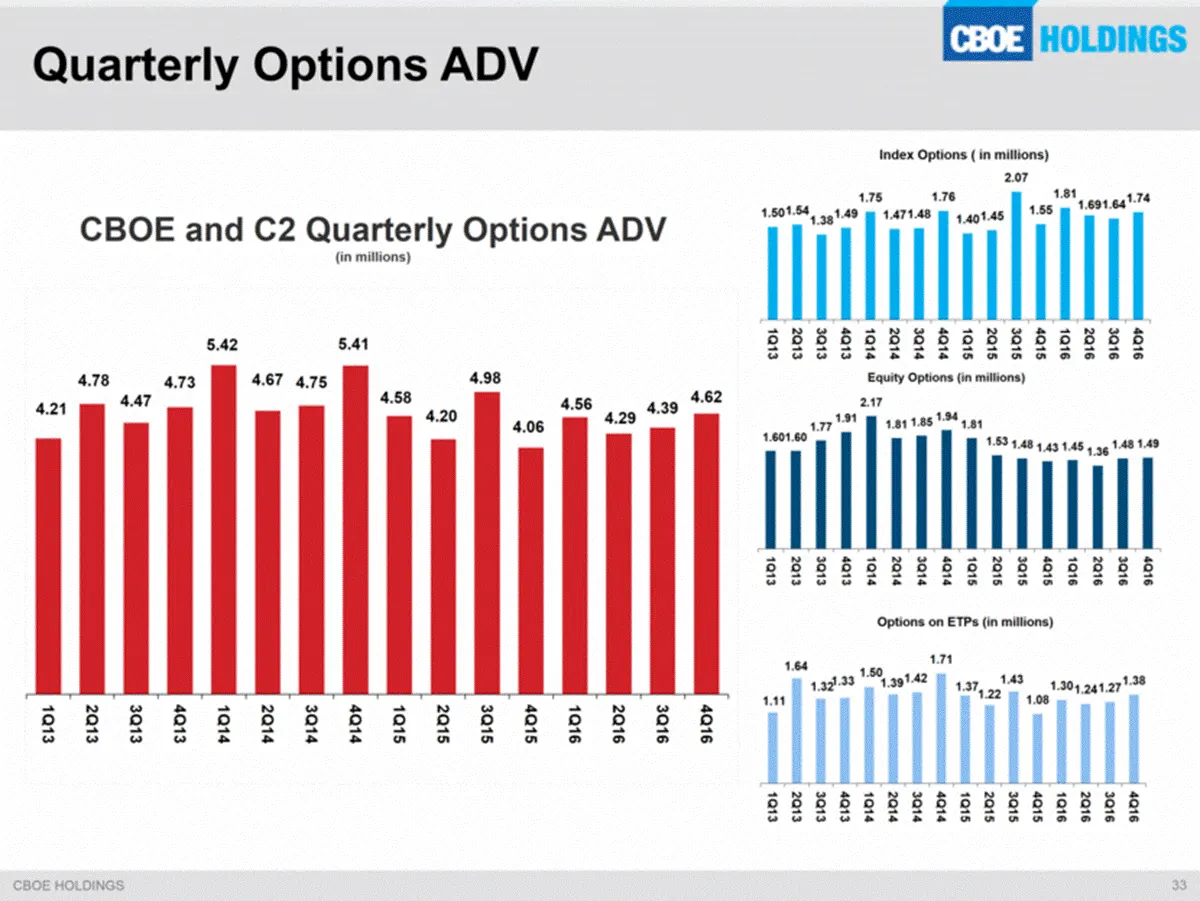
Slide 31: CBOE and C2 Quarterly Options ADV
CBOE and C2 Quarterly Options ADV (in millions) Quarterly Options ADV 1.60 1.60 1.77 1.91 2.17 1.81 1.85 1.94 1.81 1.53 1.48 1.43 1.45 1.36 1.48 1.49 1Q13 2Q13 3Q13 4Q13 1Q14 2Q14 3Q14 4Q14 1Q15 2Q15 3Q15 4Q15 1Q16 2Q16 3Q16 4Q16 Equity Options (in millions) 1.11 1.64 1.32 1.33 1.50 1.39 1.42 1.71 1
Slide 32: Growing Index Product Line
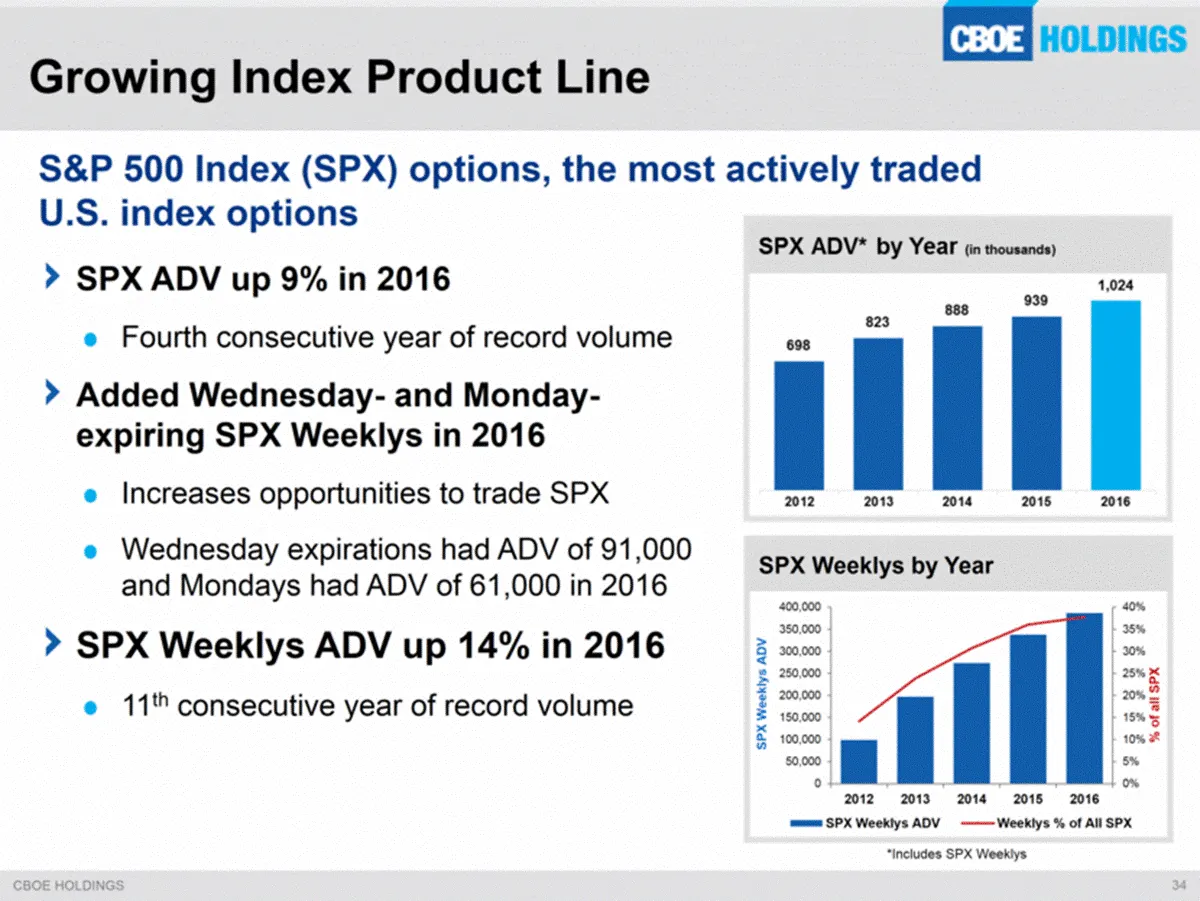
Growing Index Product Line S&P 500 Index (SPX) options, the most actively traded U.S. index options SPX ADV up 9% in 2016 Fourth consecutive year of record volume Added Wednesday- and Monday-expiring SPX Weeklys in 2016 Increases opportunities to trade SPX Wednesday expirations had ADV of 91,000 and
Slide 33: Further Developing Current Products to Grow Index Complex
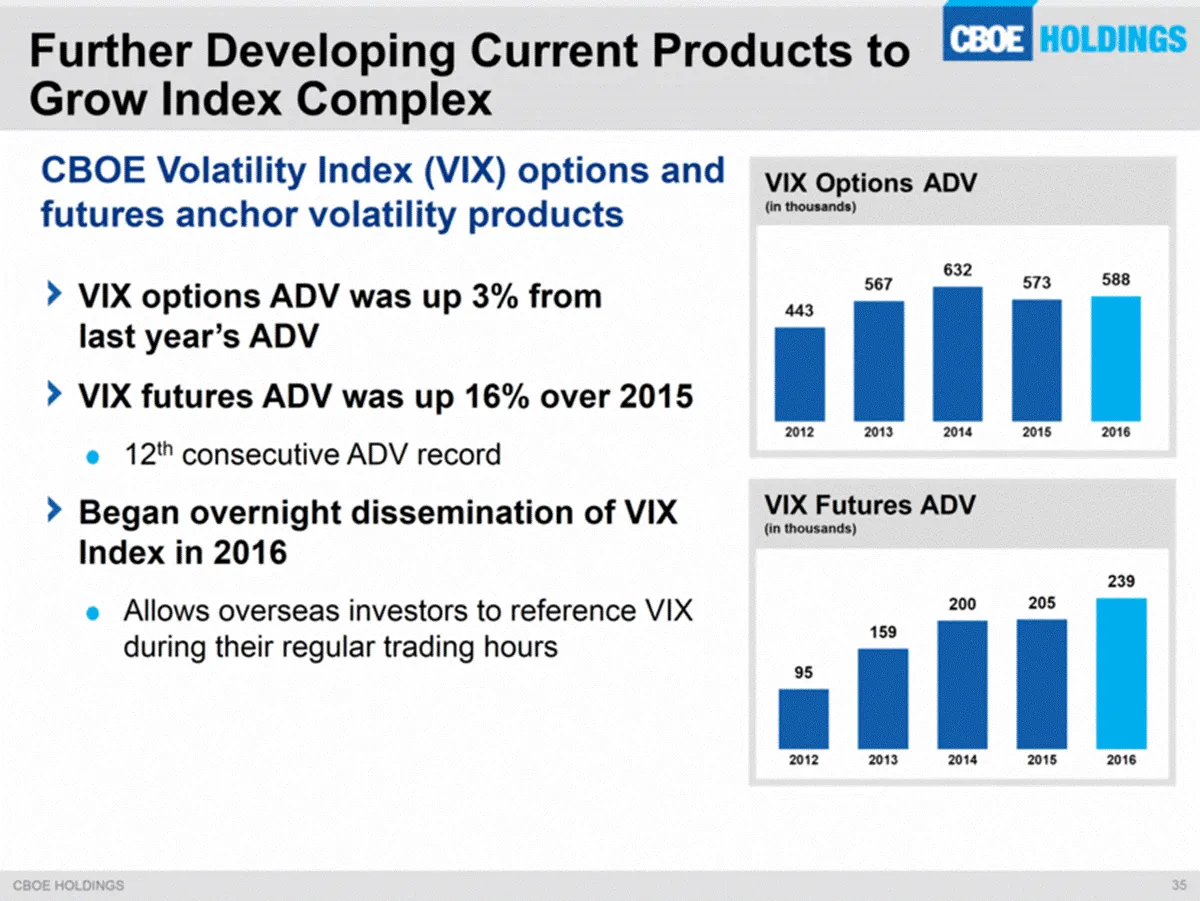
Further Developing Current Products to Grow Index Complex CBOE Volatility Index (VIX) options and futures anchor volatility products VIX options ADV was up 3% from last year’s ADV VIX futures ADV was up 16% over 2015 12th consecutive ADV record Began overnight dissemination of VIX Index in 2016 Allo
Slide 34: Broadening Access to Proprietary Products
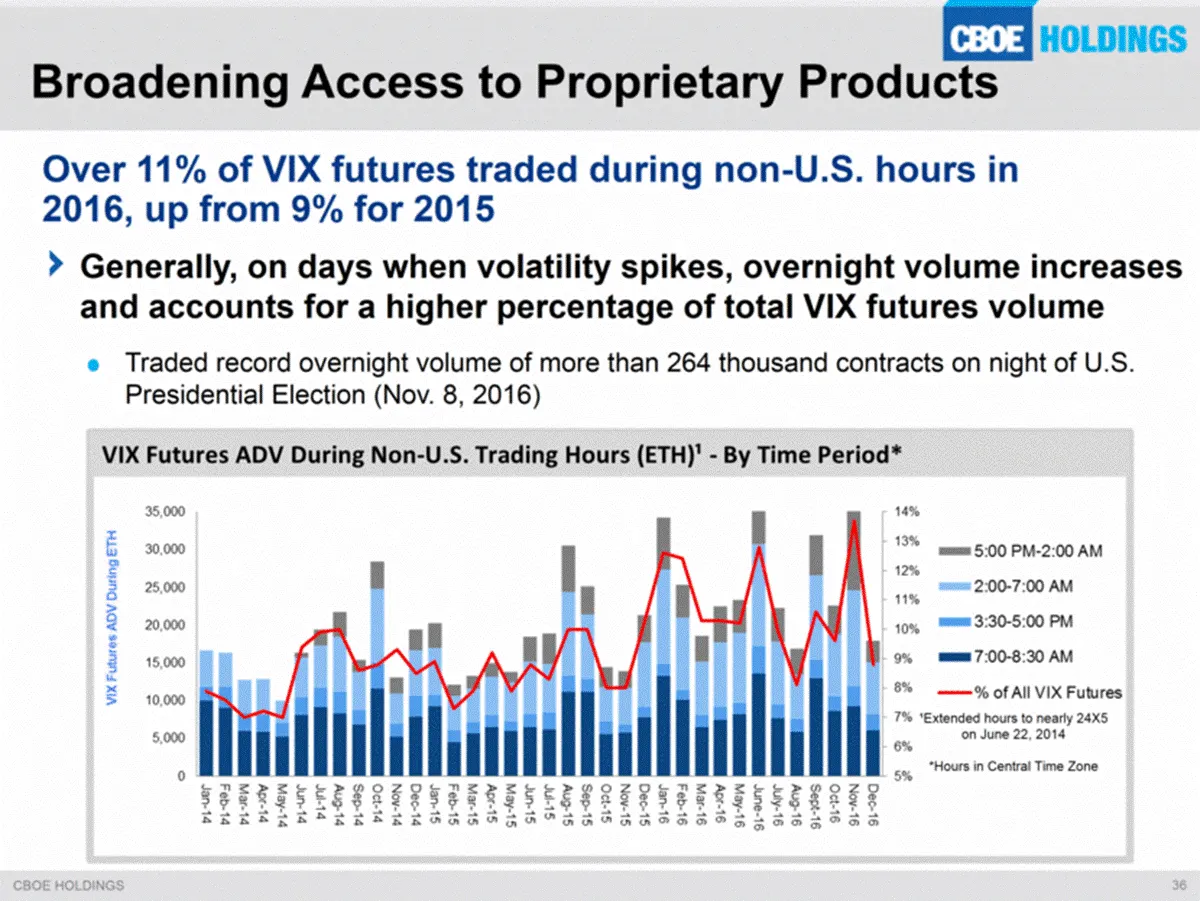
Over 11% of VIX futures traded during non-U.S. hours in 2016, up from 9% for 2015 Broadening Access to Proprietary Products ¹Extended hours to nearly 24X5 on June 22, 2014 *Hours in Central Time Zone Generally, on days when volatility spikes, overnight volume increases and accounts for a higher perc
Slide 35: CBOE Holdings Rolling 3-Month RPC
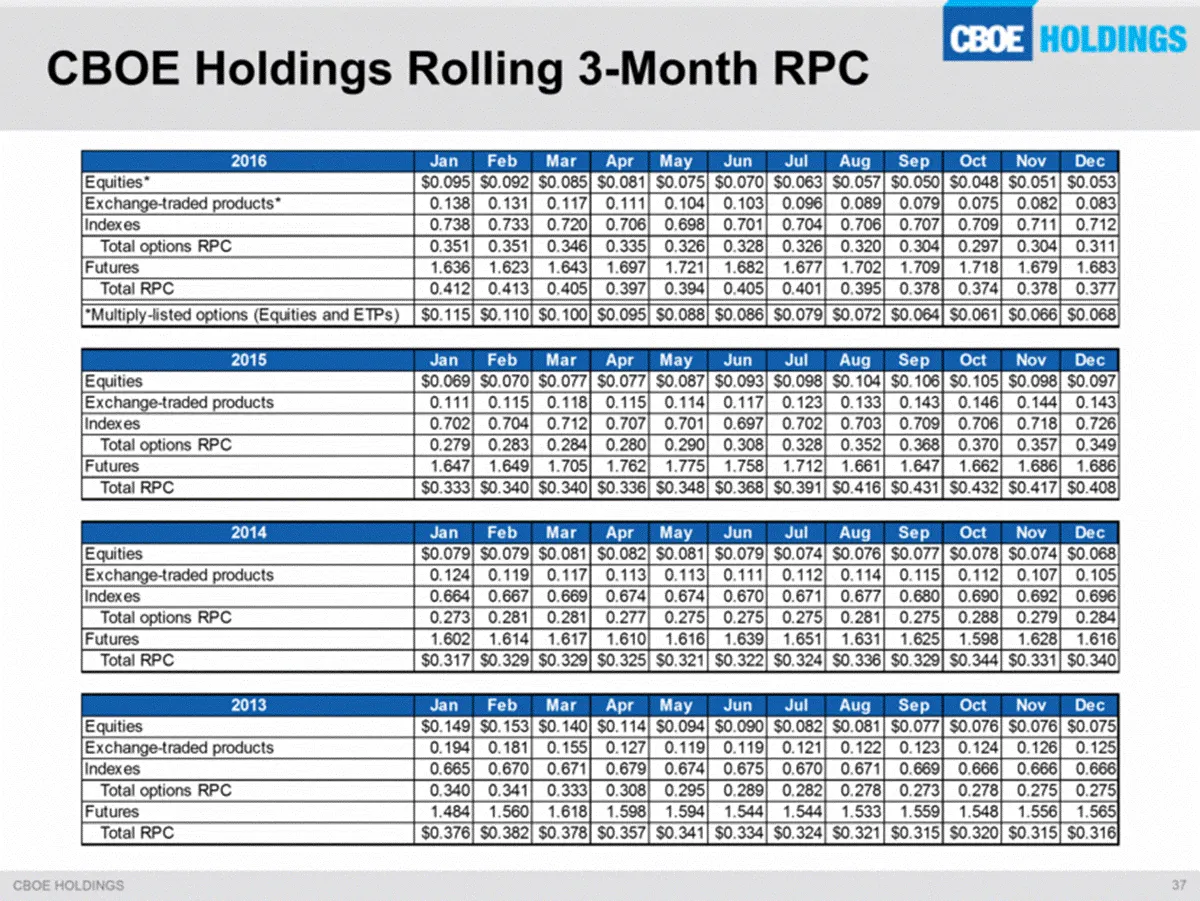
CBOE Holdings Rolling 3-Month RPC 2016 Jan Feb Mar Apr May Jun Jul Aug Sep Oct Nov Dec Equities* $0.095 $0.092 $0.085 $0.081 $0.075 $0.070 $0.063 $0.057 $0.050 $0.048 $0.051 $0.053 Exchange-traded products* 0.138 0.131 0.117 0.111 0.104 0.103 0.096 0.089 0.079 0.075 0.082 0.083 Indexes 0.738 0.733 0
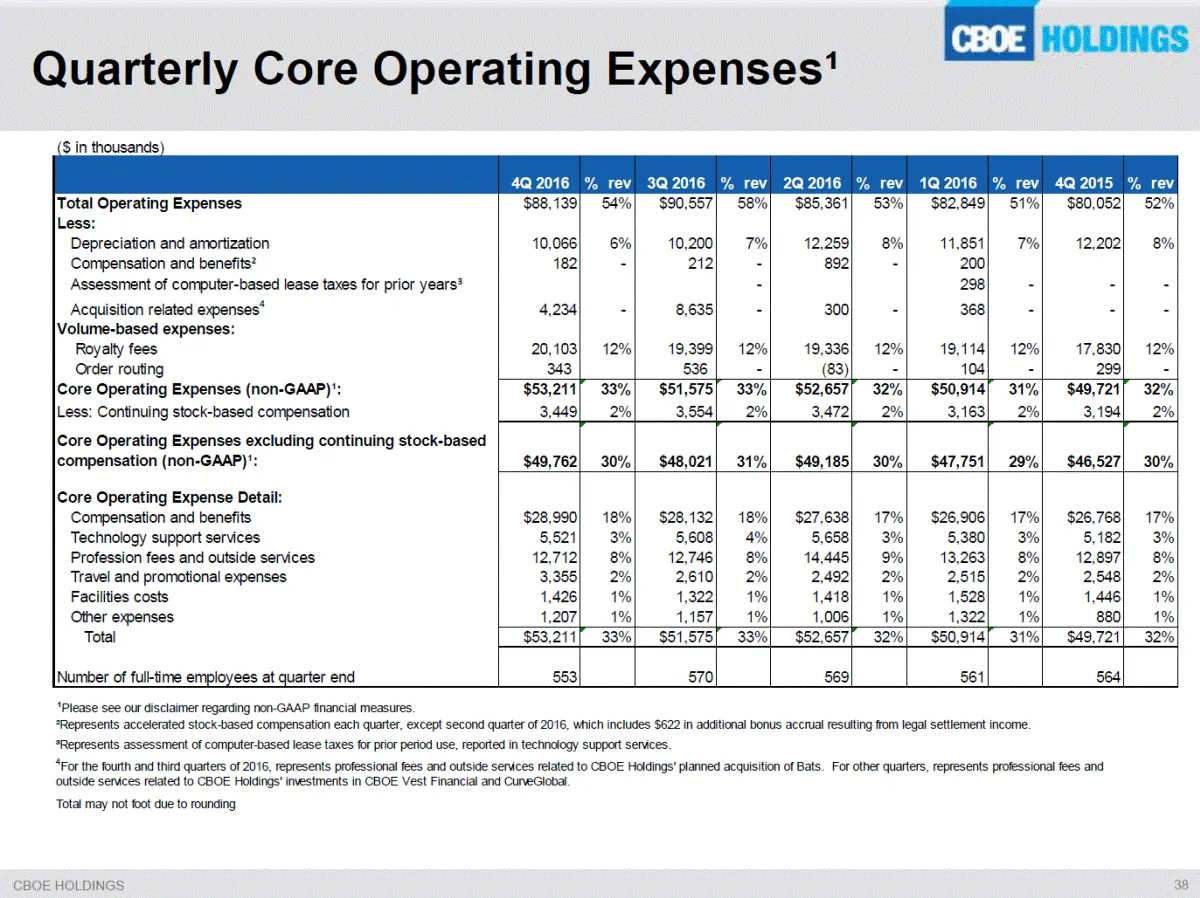
Slide 36: Quarterly Core Operating Expenses
Quarterly Core Operating Expenses¹ ($ in thousands) 4Q 2016 % rev 3Q 2016 % rev 2Q 2016 % rev 1Q 2016 % rev 4Q 2015 % rev 3Q 2015 % rev 2Q 2015 % rev 1Q 2015 % rev 4Q 2014 % rev 3Q 2014 % rev 2Q 2014 % rev 1Q 2014 % rev 4Q 2013 % rev 3Q 2013 % rev 2Q 2013 % rev 1Q 2013 % rev 4Q 2012 % rev 3Q 2012 %
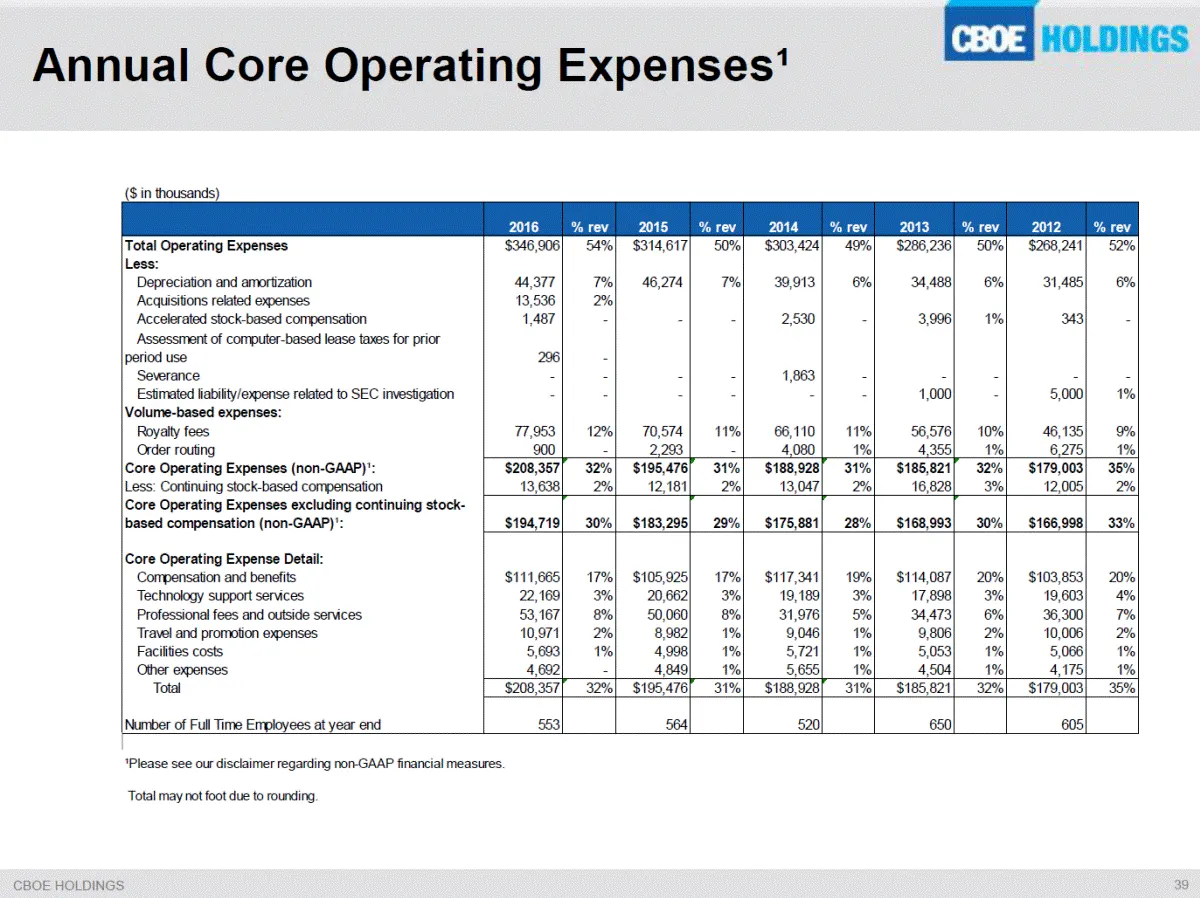
Slide 37: Annual Core Operating Expenses
Annual Core Operating Expenses¹ ($ in thousands) 2016 % rev 2015 % rev 2014 % rev 2013 % rev 2012 % rev 2011 % rev 2010 % rev 2009 % rev 2008 % rev Total Operating Expenses $346,906 54% $314,617 50% $303,424 49% $286,236 50% $268,241 52% $266,512 52% $269,763 62% $248,497 62% $229,473 55% Less: Depr
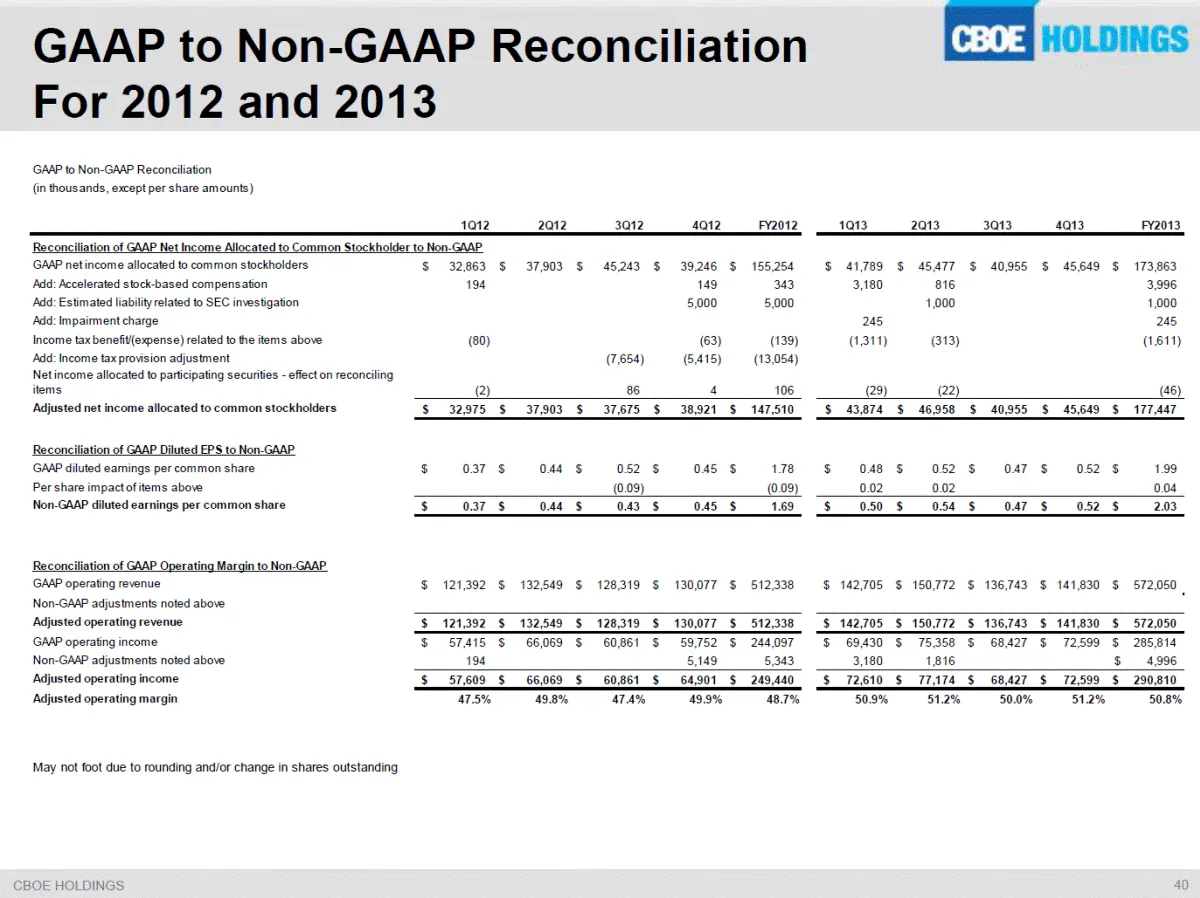
Slide 38: GAAP to Non-GAAP Reconciliation For 2012 and 2013
GAAP to Non-GAAP Reconciliation For 2012 and 2013 GAAP to Non-GAAP Reconciliation (in thousands, except per share amounts) 1Q12 2Q12 3Q12 4Q12 FY2012 1Q13 2Q13 3Q13 4Q13 FY2013 Reconciliation of GAAP Net Income Allocated to Common Stockholder to Non-GAAP GAAP net income allocated to common stockhold
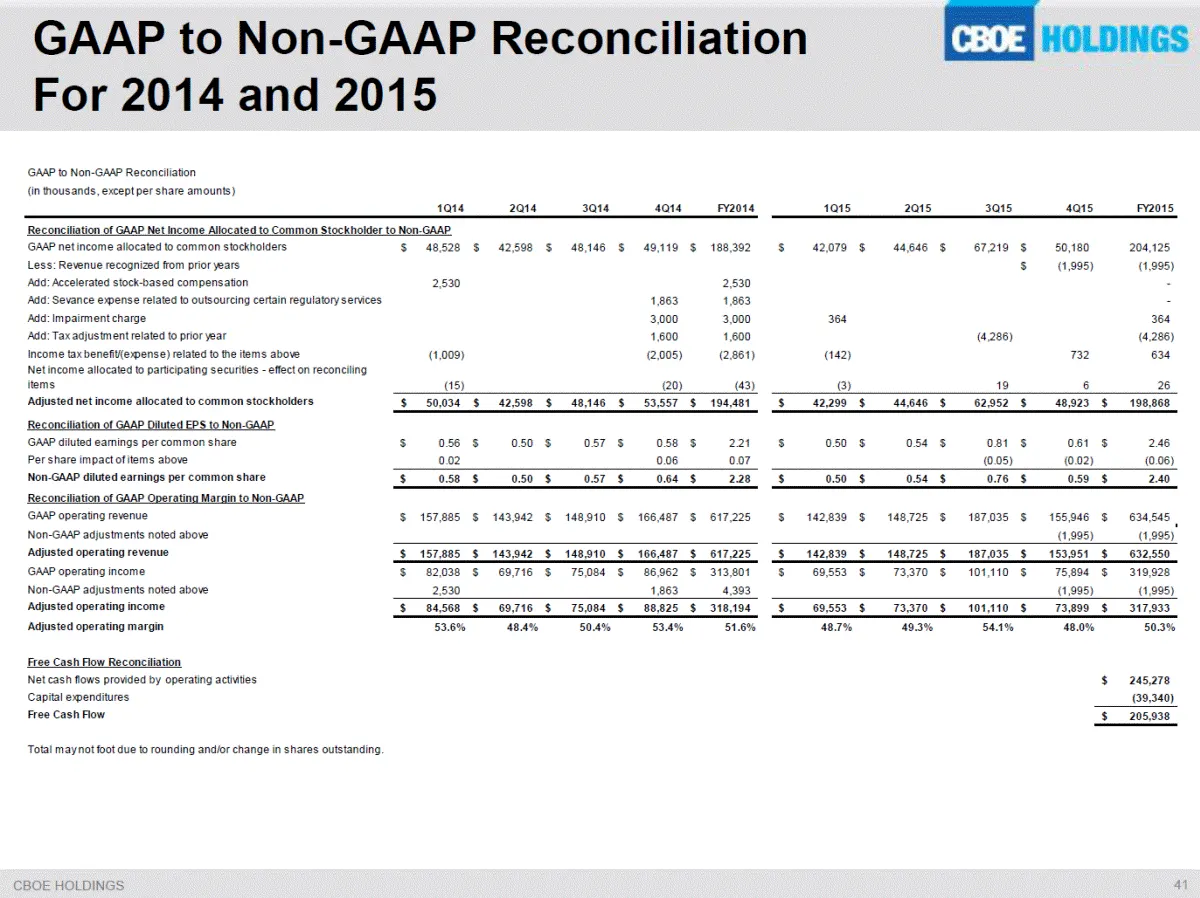
Slide 39: GAAP to Non-GAAP Reconciliation For 2014 and 2015
GAAP to Non-GAAP Reconciliation For 2014 and 2015 GAAP to Non-GAAP Reconciliation (in thousands, except per share amounts) 1Q14 2Q14 3Q14 4Q14 FY2014 1Q15 2Q15 3Q15 4Q15 FY2015 Reconciliation of GAAP Net Income Allocated to Common Stockholder to Non-GAAP GAAP net income allocated to common stockhold
Slide 40: GAAP to Non-GAAP Reconciliation For 2016
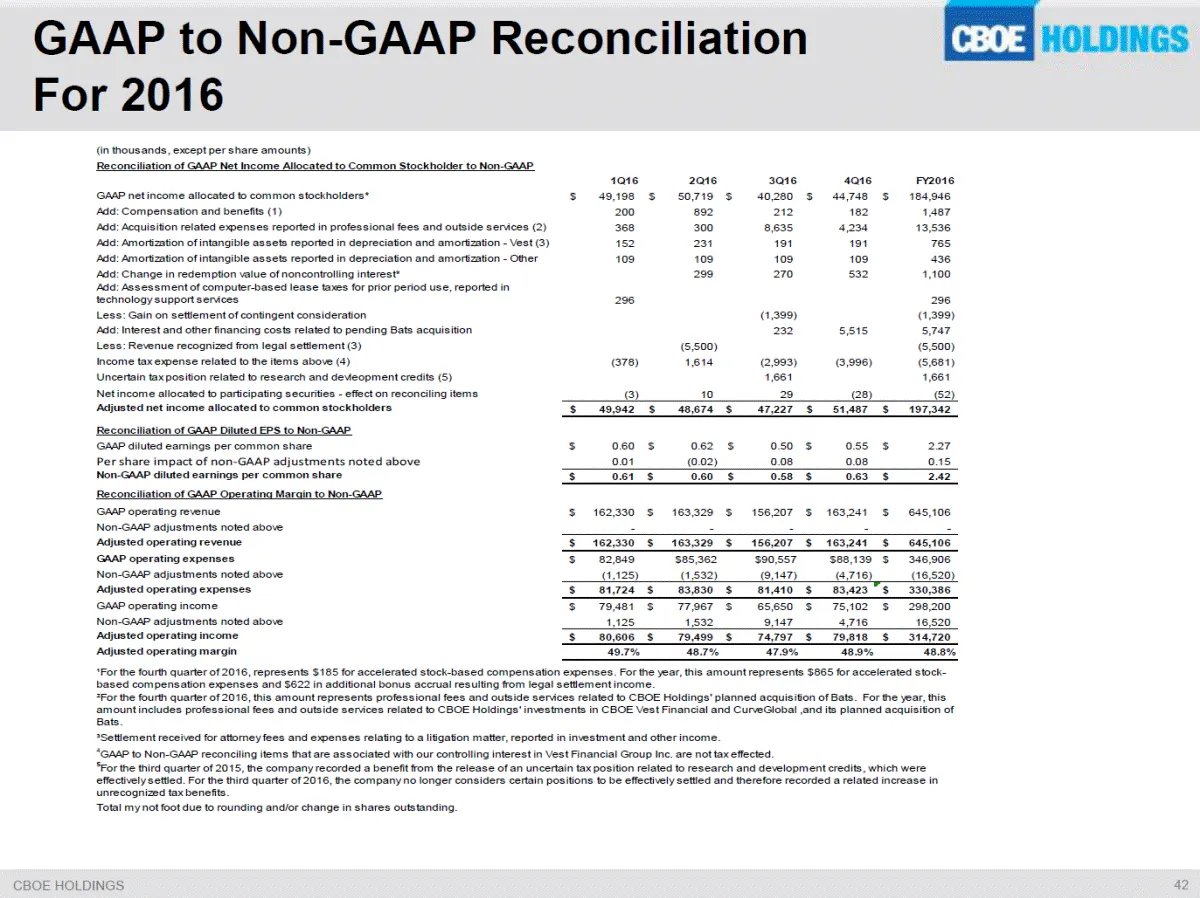
GAAP to Non-GAAP Reconciliation For 2016 ²For the fourth quarter of 2016, this amount represents professional fees and outside services related to CBOE Holdings' planned acquisition of Bats. For the year, this amount includes professional fees and outside services related to CBOE Holdings' investmen
Slide 41: Non-GAAP Information
In addition to disclosing results determined in accordance with Generally Accepted Accounting Principles (GAAP), CBOE Holdings has disclosed certain non-GAAP measures of operating performance. These measures are not in accordance with, or a substitute for, GAAP measures, and may be different from or
Slide 42: CBOE, South LaSalle Street, Chicago
CBOE 400 South LaSalle Street Chicago, Illinois 60605 www.cboe.com
Slide 43: CBOE Holdings
(es HOLDINGS (e={e)= 400 South LaSalle Street Chicago, Illinois 60605
Source: SEC EDGAR · 425 filed Feb 6, 2017
More decks from Bats Global Markets Inc
 Q4 2016 Earnings Presentation25 slides · Feb 9, 2017
 Merger or Acquisition (February 2017)7 slides · Feb 1, 2017
 Merger or Acquisition (January 2017)7 slides · Jan 18, 2017
 Merger or Acquisition (January 2017)21 slides · Jan 3, 2017
 Merger or Acquisition (December 2016)7 slides · Dec 22, 2016
 Merger or Acquisition (November 2016)35 slides · Nov 10, 2016