Strategic Hotels and Resorts Inc
Strategic Hotels and Resorts — Investor Presentation (November 2008)
25 slides from Strategic Hotels and Resorts's investor presentation, Nov 19, 2008

Slide 1: Strategic Hotels & Resorts
STRATEGIC Hotel 5 Pissorls
Slide 2: Progress Report
Progress Report Progress to Date Operating strategies EBITDA margin decline of 70 basis points on flat RevPAR Corporate overhead 14% reduction; reviewing additional opportunities Capital programs Deferrals substantially reducing 2009 commitments Cancelled Fairmont Chicago, Aqua building expansion Co
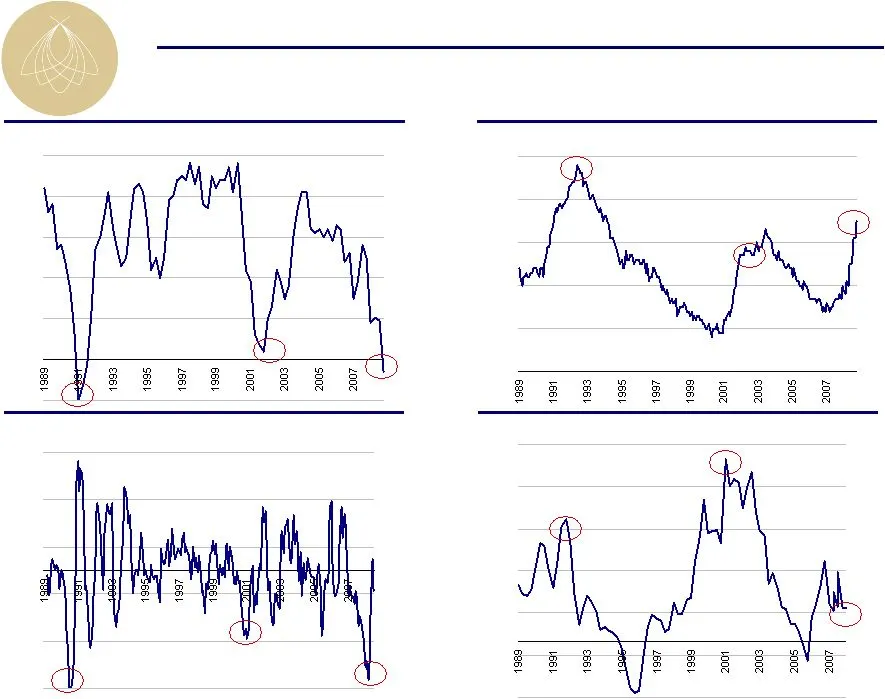
Slide 3: Economic and Industry Indicators
-1.0% 0.0% 1.0% 2.0% 3.0% 4.0% 5.0% -4.0% -1.0% 2.0% 5.0% 8.0% 11.0% 14.0% -5.0% -3.0% -1.0% 1.0% 3.0% 5.0% 3.0% 4.0% 5.0% 6.0% 7.0% 8.0% Economic and Industry Indicators Unemployment GDP Growth Consumer Confidence Luxury Supply Growth
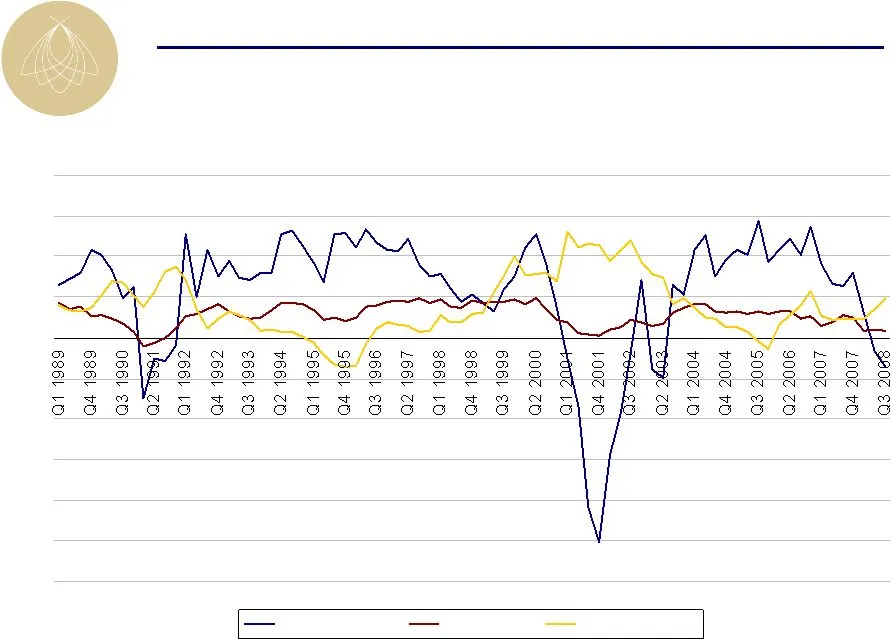
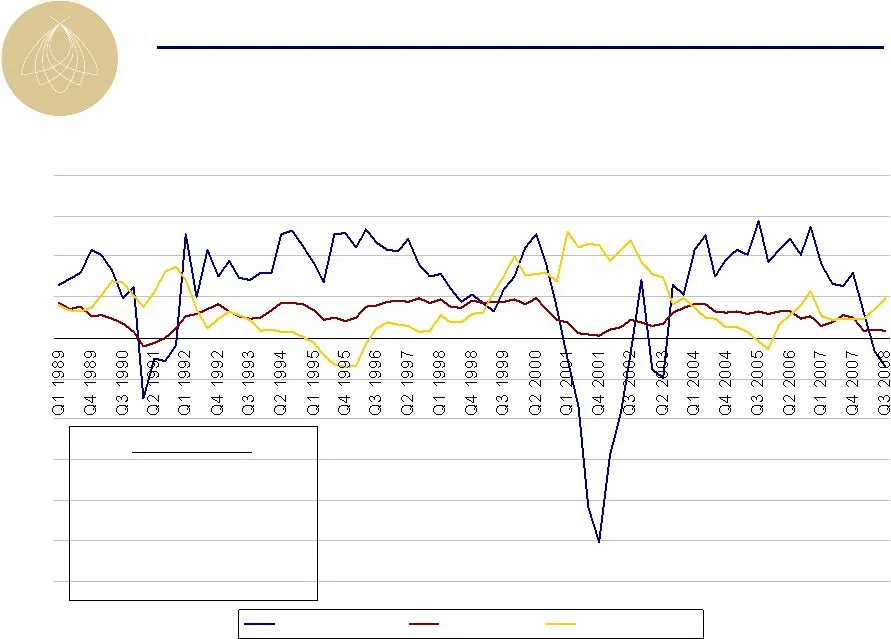
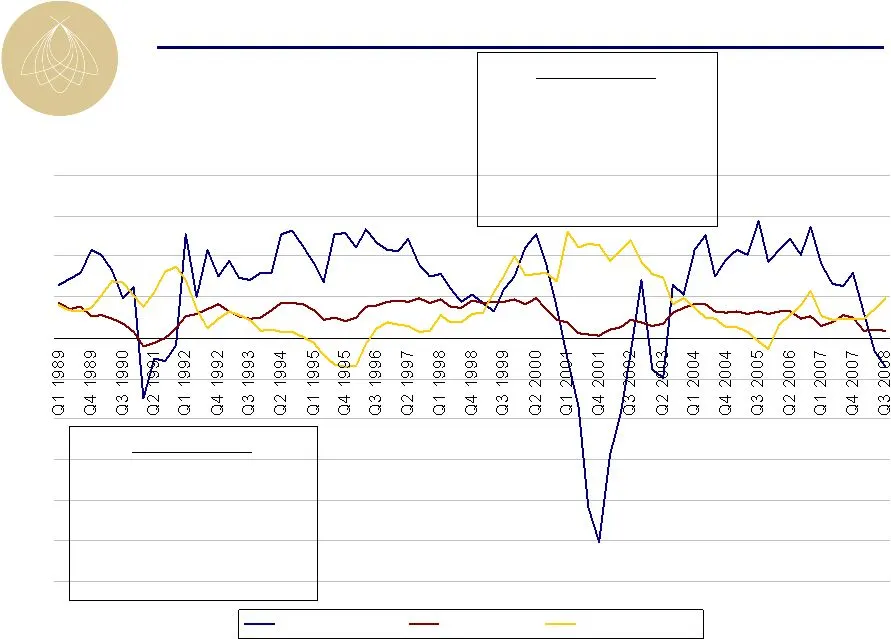
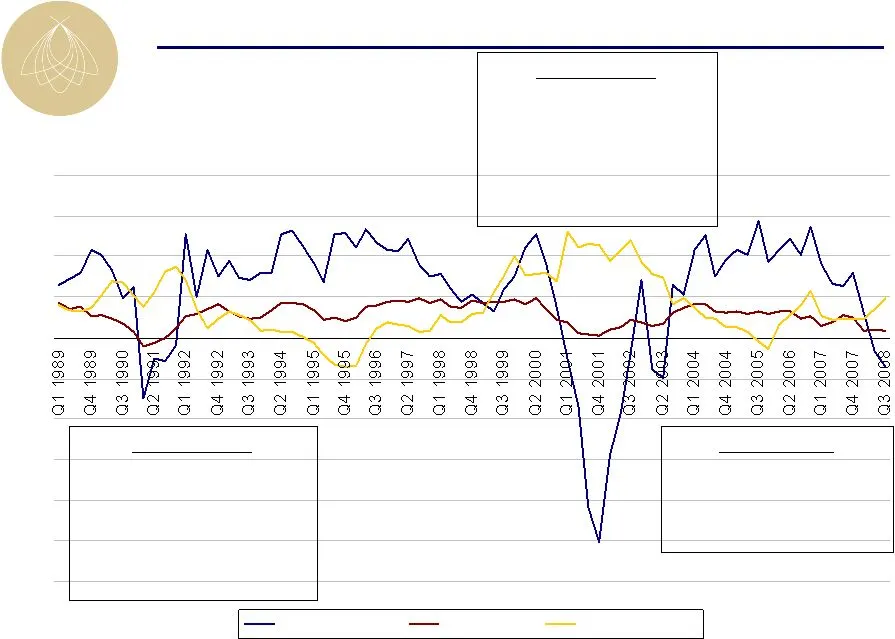
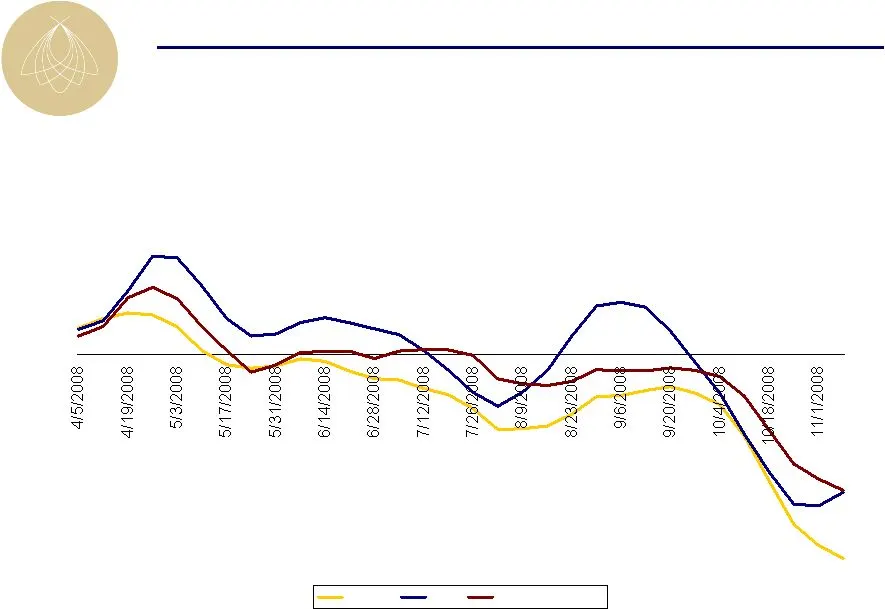
Slide 4: Is this 9/11, 1991 or 1970s?
Is this 9/11, 1991 or 1970s? Source: Smith Travel Research -30.0 -25.0 -20.0 -15.0 -10.0 -5.0 0.0 5.0 10.0 15.0 20.0 RevPAR Growth GDP Growth Supply Change
Slide 5: | pele tO
| pele tO £00 $OD: £002 16: 9002 7D: S002 ED: poo FO: poo 1D: espe zo 100g #O, fis} 0002 7D: 6661 €. 866L FO. 8661 LO 661 70) 9661 €D: P66L 70. £661 €D. T66L PO. 7661 LO. cAe) O66L ED: 6861 FO. 6861 LO
Slide 6: | pele tO
| pele tO £00 $OD: £002 16: 9002 7D: S002 ED: poo FO: poo 1D: espe zo 100g #O, fis} 0002 7D: 6661 €. 866L FO. 8661 LO 661 70) 9661 €D: P66L 70. £661 €D. T66L PO. 7661 LO. cAe) O66L ED: 6861 FO. 6861 LO
Slide 7: S002 ED:
| $802 £0 £00 $OD: £002 16: 9002 7D: S002 ED: poo FO: poo 1D: espe zo 100g #O, fis} 0002 7D: 6661 €. 866L FO. 8661 LO 661 70) 9661 €D: P66L 70. £661 €D. T66L PO. 7661 LO. cAe) O66L ED: 6861 FO. 6861 LO
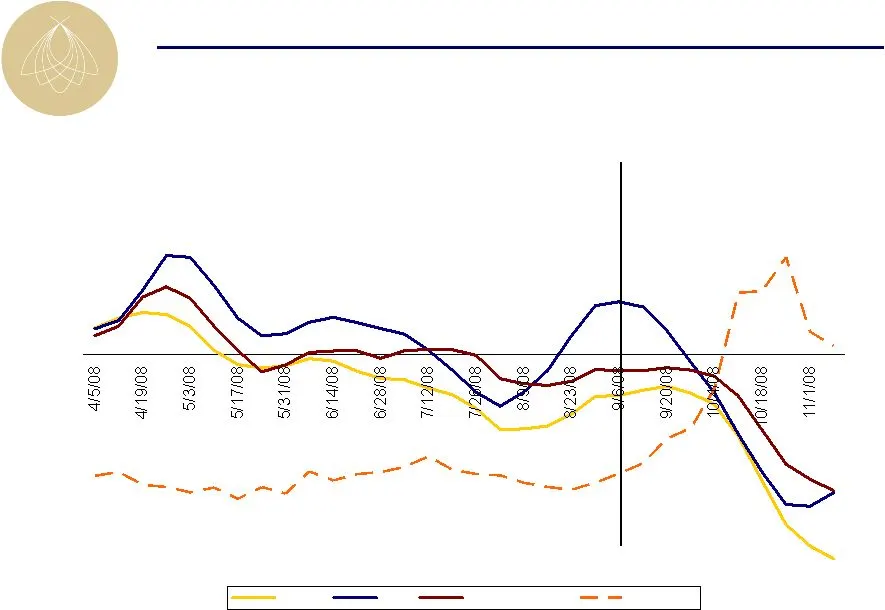
Slide 8: Lodging Fundamentals Week Moving Average; Running Day RevPAR Growth
Lodging Fundamentals 4 Week Moving Average; Running 28 Day RevPAR Growth -15.0% -10.0% -5.0% 0.0% 5.0% 10.0% Luxury BEE Upper Upscale
Slide 9: Lodging Fundamentals Week Moving Average; Running Day RevPAR Growth
Lodging Fundamentals 4 Week Moving Average; Running 28 Day RevPAR Growth -15.0% -10.0% -5.0% 0.0% 5.0% 10.0% Luxury BEE Upper Upscale VIX Index
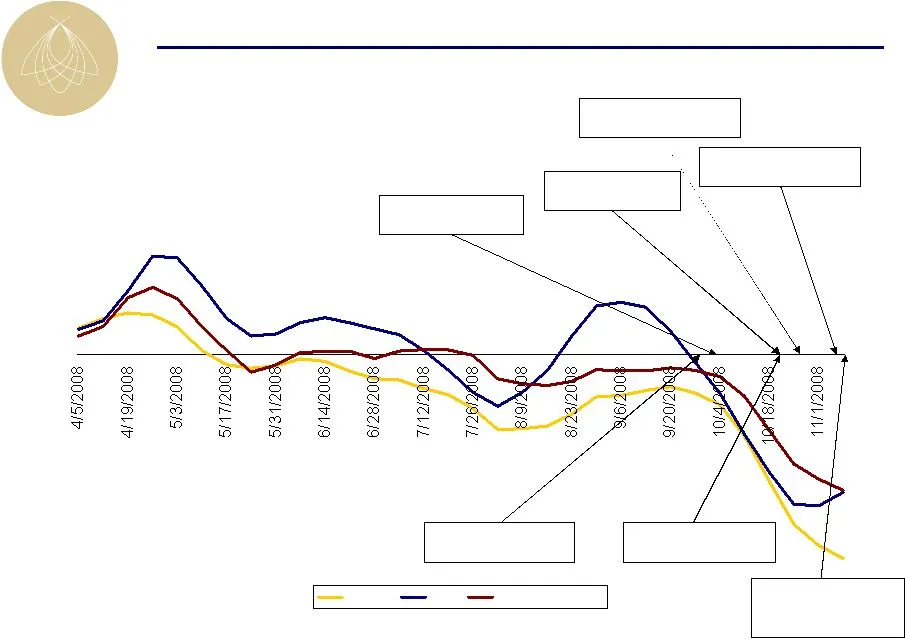
Slide 10: Lodging Fundamentals Week Moving Average; Running Day RevPAR Growth
Lodging Fundamentals 4 Week Moving Average; Running 28 Day RevPAR Growth -15.0% -10.0% -5.0% 0.0% 5.0% 10.0% Luxury BEE Upper Upscale MAR: -3% to -5% HST: -3% to -5% HOT: -9% to -11% LHO: -6% to -8% BEE: -12% to -14% LHO / HST suspend guidance MAR warns lower
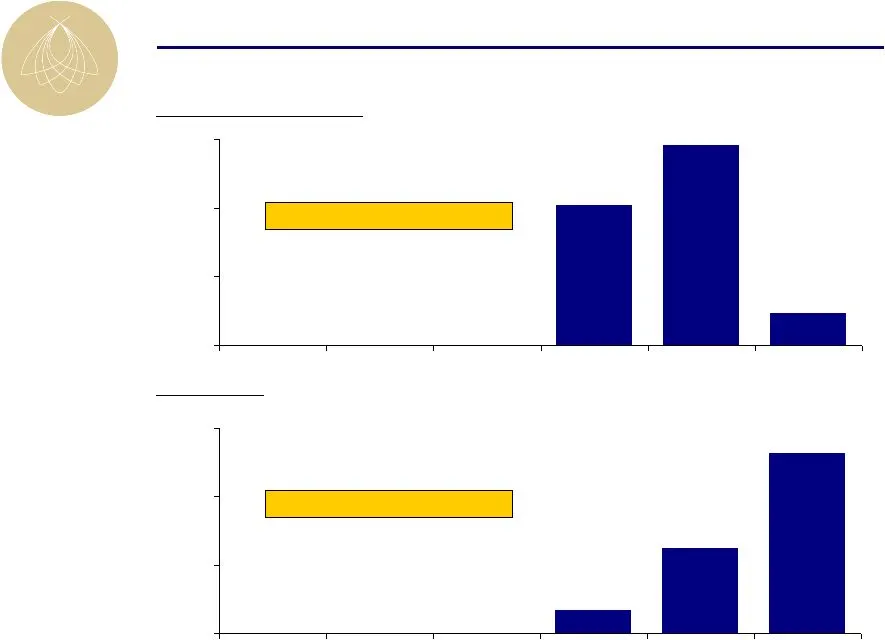
Slide 11: Debt and Swap Maturity Schedules
$611 $873 $140 $100 $375 $790 Debt and Swap Maturity Schedules $ in millions Consolidated Debt Maturity Swap Maturity Weighted Average Maturity: 3.3 years Weighted Average Maturity: 4.9 years $0 $300 $600 $900 2008 2009 2010 2011 2012 Thereafter $0 $300 $600 $900 2008 2009 2010 2011 2012 Thereafter
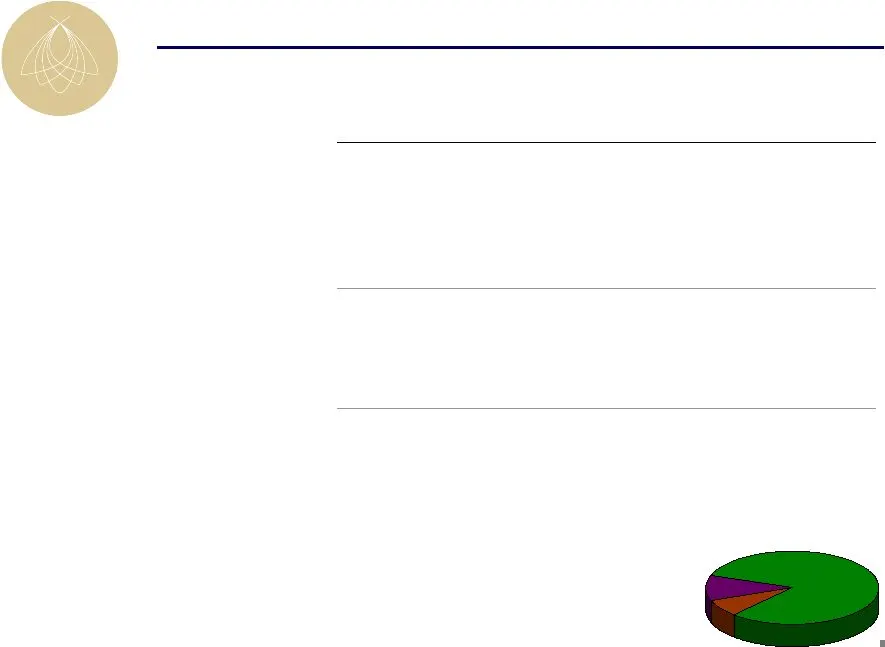
Slide 12: Debt Structure
Mortgage Debt $1,317 Debt Structure Comments Mortgage Debt Low leverage at origination Average 2.3x fixed charge coverage Average 83 bps spread bps over LIBOR Non cross-collateralized and non-recourse First maturity in August 2011 Convertible Debt No covenants Cross to corporate line of credit Recou
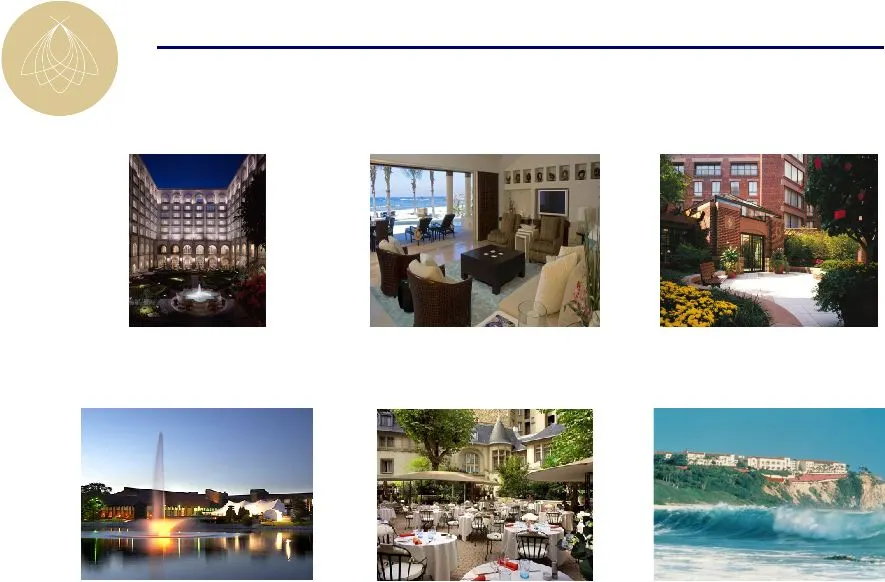
Slide 13: Six Unencumbered Assets
Six Unencumbered Assets $74 million in EBITDA Four Seasons Mexico City Four Seasons Punta Mita Four Seasons Washington, D.C. Ritz-Carlton Laguna Niguel Marriott Lincolnshire Resort Renaissance Hotel Le Parc Trocadero

Slide 14: Summary
Summary Lack of visibility into length and depth of downturn Focus on making fixed operating costs variable Continue to seek asset sales in difficult market Taking advantage of collateral quality to improve line of credit
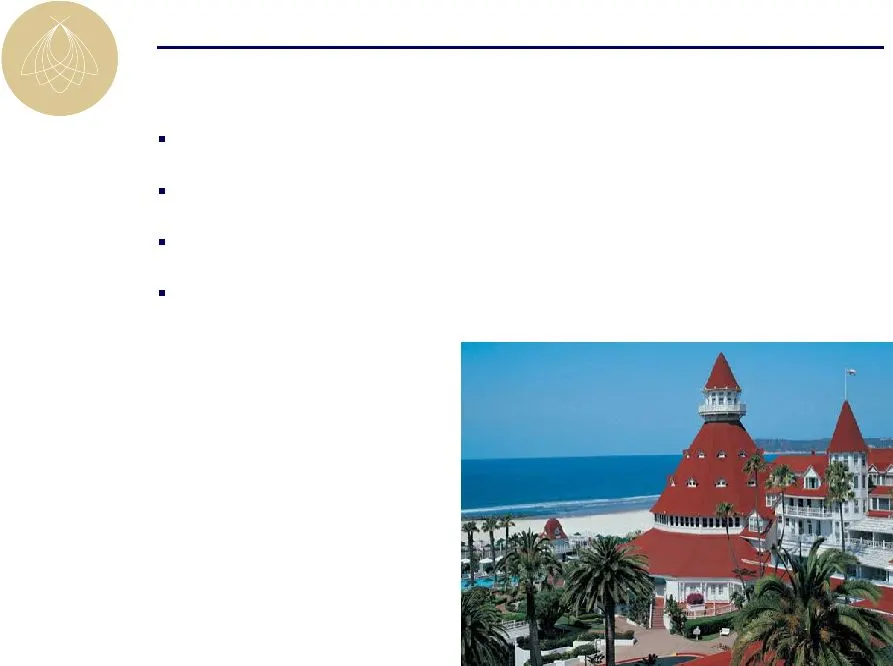
Slide 15: Hotel del Coronado
Hotel del Coronado Purchase Price: $745 million; January 2006 757 rooms; 135,500 square feet of meeting space BEE 45% Managing Partner; $70 million investment Completed Capital Improvements: $90 million Acquisition Overview

Slide 16: Hotel del Coronado Awards and Accolades
Hotel del Coronado Top 10 Resorts in the World – USA Today Best Resort Getaway – L.A. Magazine Top 10 Family Resorts – Travel + Leisure Family Magazine #1 Best Beach in Southern California – Travel Channel #2 Best Beach in the U.S.A. – Travel Channel Best Hotel Dinner – San Diego Magazine Poll Resta
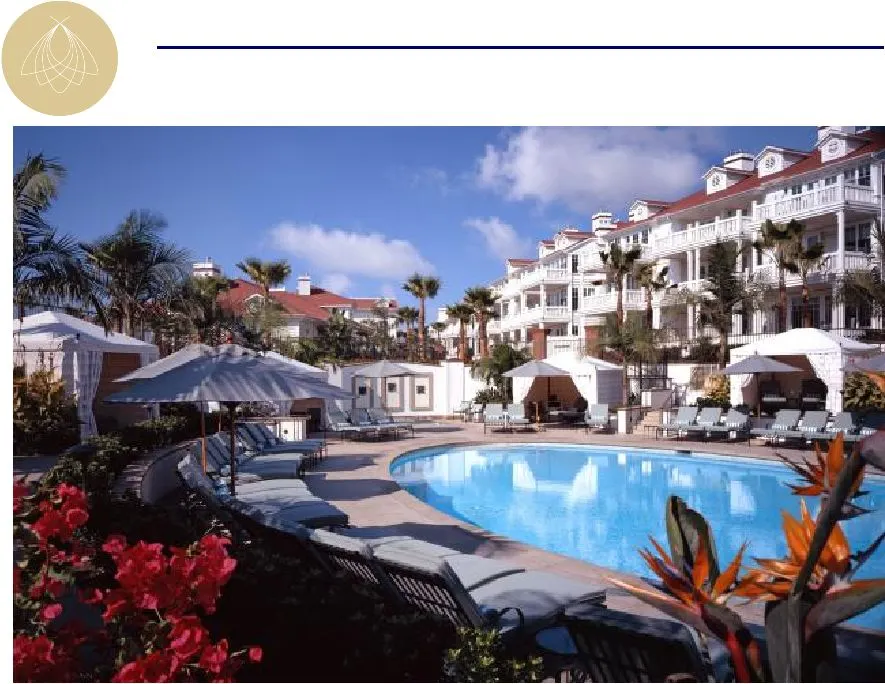
Slide 17: Beach Village Development
Beach Village Development Capital Spend: $57.0 million; Gross Sales: $115 million
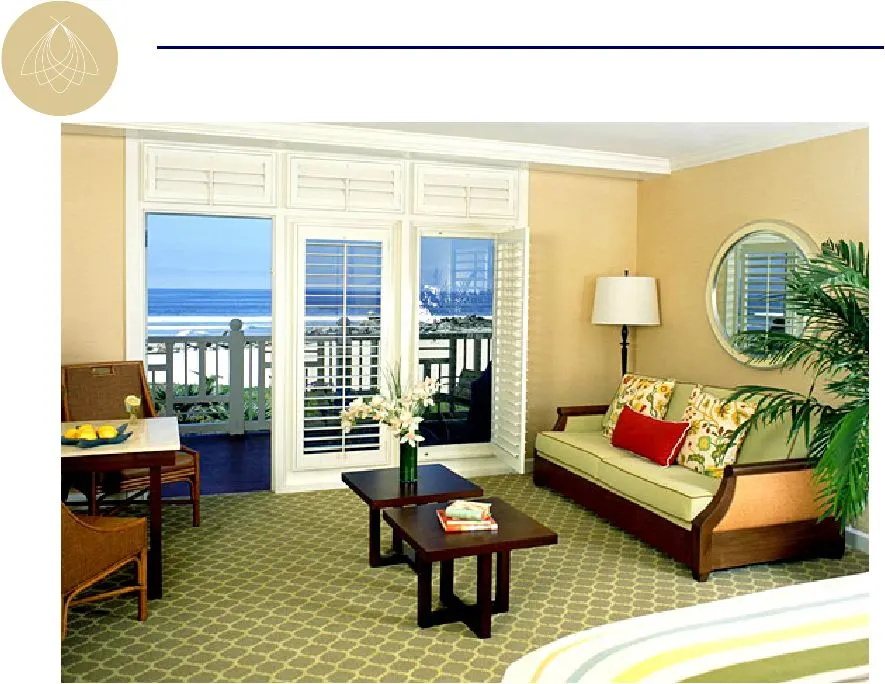
Slide 18: Guestroom Renovation
Guestroom Renovation Capital Spend: $8.0 million
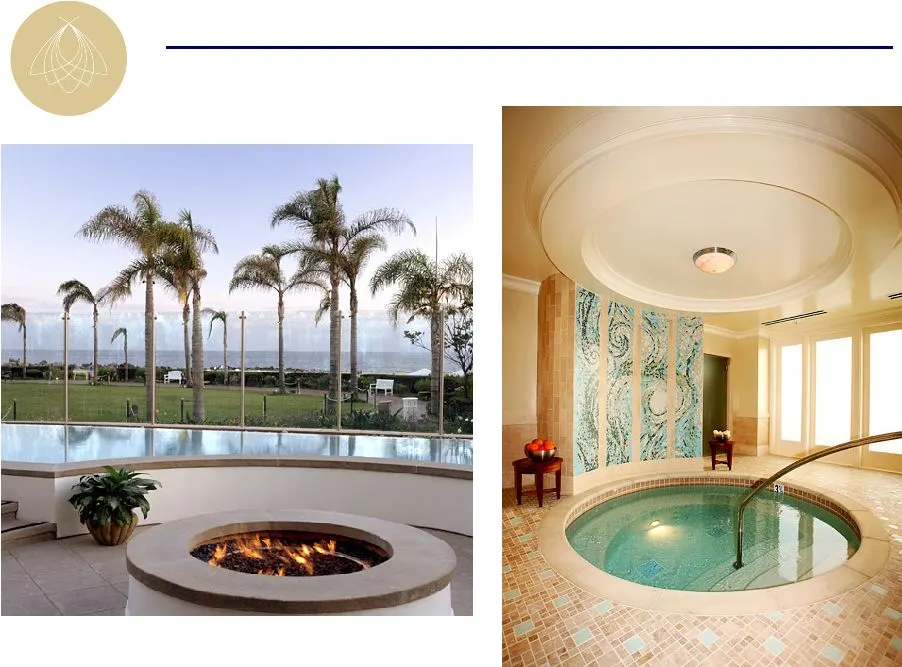
Slide 19: Spa and Fitness Center
Spa and Fitness Center Capital Spend: $18.0 million
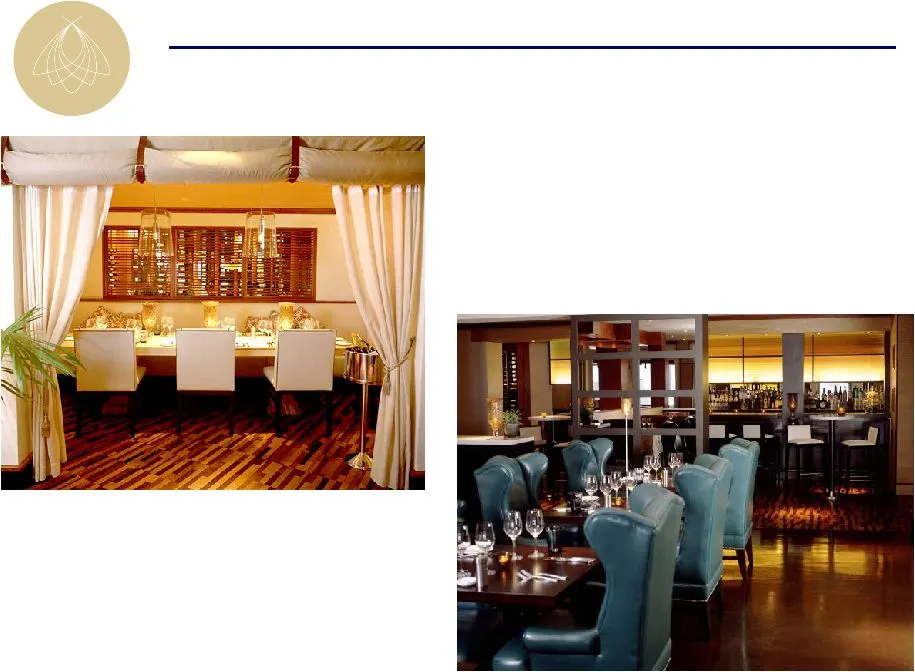
Slide 20: Restaurant Renovation
Restaurant Renovation Capital Spend: $1.5 million
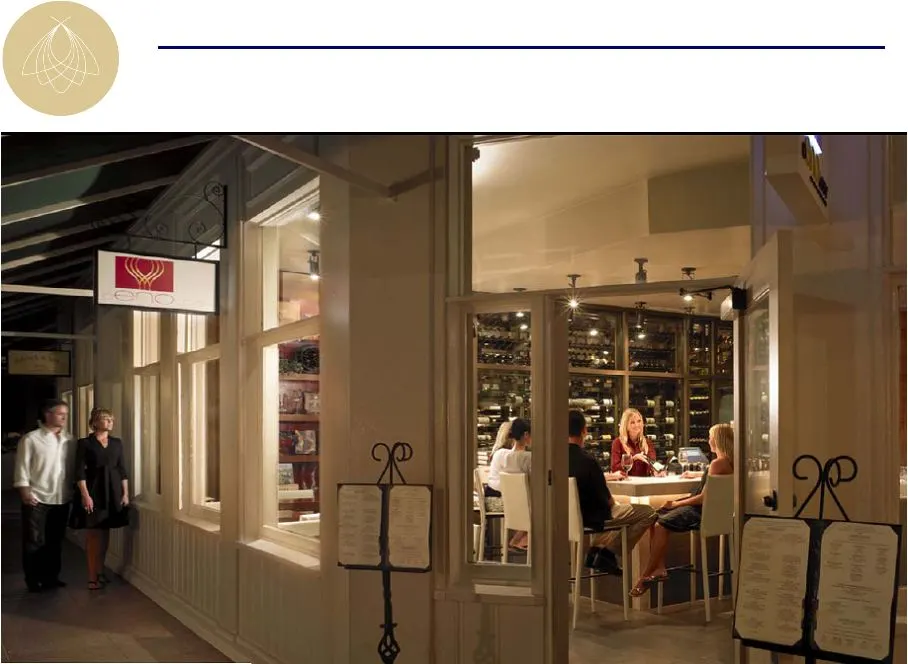
Slide 21: ENO Wine Room
ENO Wine Room Capital Spend: $700K
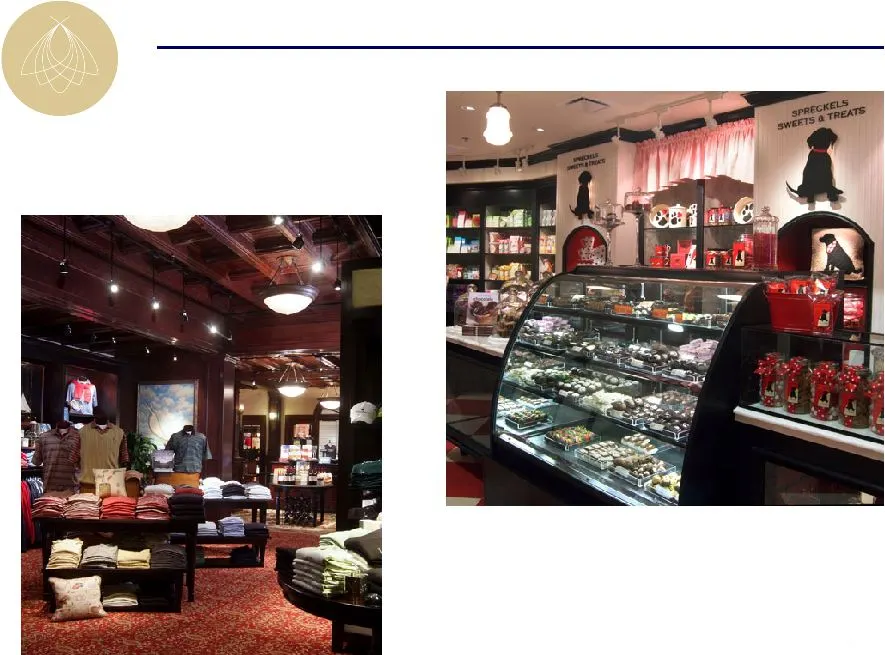
Slide 22: Retail Conversion
Retail Conversion Capital Spend: $1.9 million
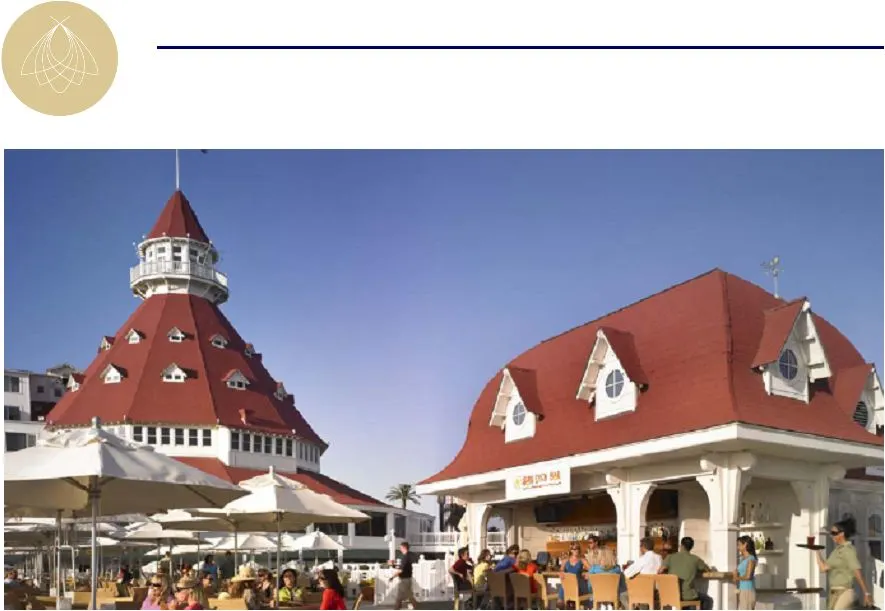
Slide 23: Sun Deck
Sun Deck Capital Spend: $1.0 million

Slide 24: Operating Performance
Operating Performance $ in millions 2000 2001 2002 2003 ADR $244.62 $248.89 $257.37 $272.25 Occupancy 78.3% 77.1% 80.8% 80.9% RevPAR $191.64 $191.77 $207.86 $220.22 Growth 0.3% 0.1% 8.4% 5.9% EBITDA $30.9 $30.3 $34.3 $38.5 2004 2005 2006 2007 ADR $284.41 $285.67 337.56 $ 354.52 $ Occupancy 78.8% 81.

Slide 25: Strategic Hotels & Resorts
STRATEGIC Hotel 5 Pissorls
Source: SEC EDGAR · 8-K filed Nov 19, 2008
More decks from Strategic Hotels and Resorts Inc
 Investor Presentation (June 2015)43 slides · Jun 1, 2015
 Investor Presentation (February 2015)43 slides · Feb 24, 2015
 Investor Presentation (January 2015)44 slides · Jan 26, 2015
 Investor Presentation (November 2014)50 slides · Nov 5, 2014
 Investor Presentation (October 2014)50 slides · Oct 3, 2014
 Investor Day (September 2014)67 slides · Sep 22, 2014