NexTier Oilfield Solutions Inc
NexTier Oilfield Solutions — Goldman Sachs 2022 Global Energy Conference
20 slides from NexTier Oilfield Solutions's conference presentation, Jan 3, 2022
Slide 1: Goldman Sachs 2022 Global Energy Conference January 2022
Goldman Sachs 2022 Global Energy Conference January 2022 NYSE: NEX
Slide 2: Forward Looking Statements & Disclosures
Forward Looking Statements & Disclosures 2 All statements other than statements of historical facts contained in this presentation and any oral statements made in connection with this presentation, including statements regarding our future operating results and financial position, business strategy
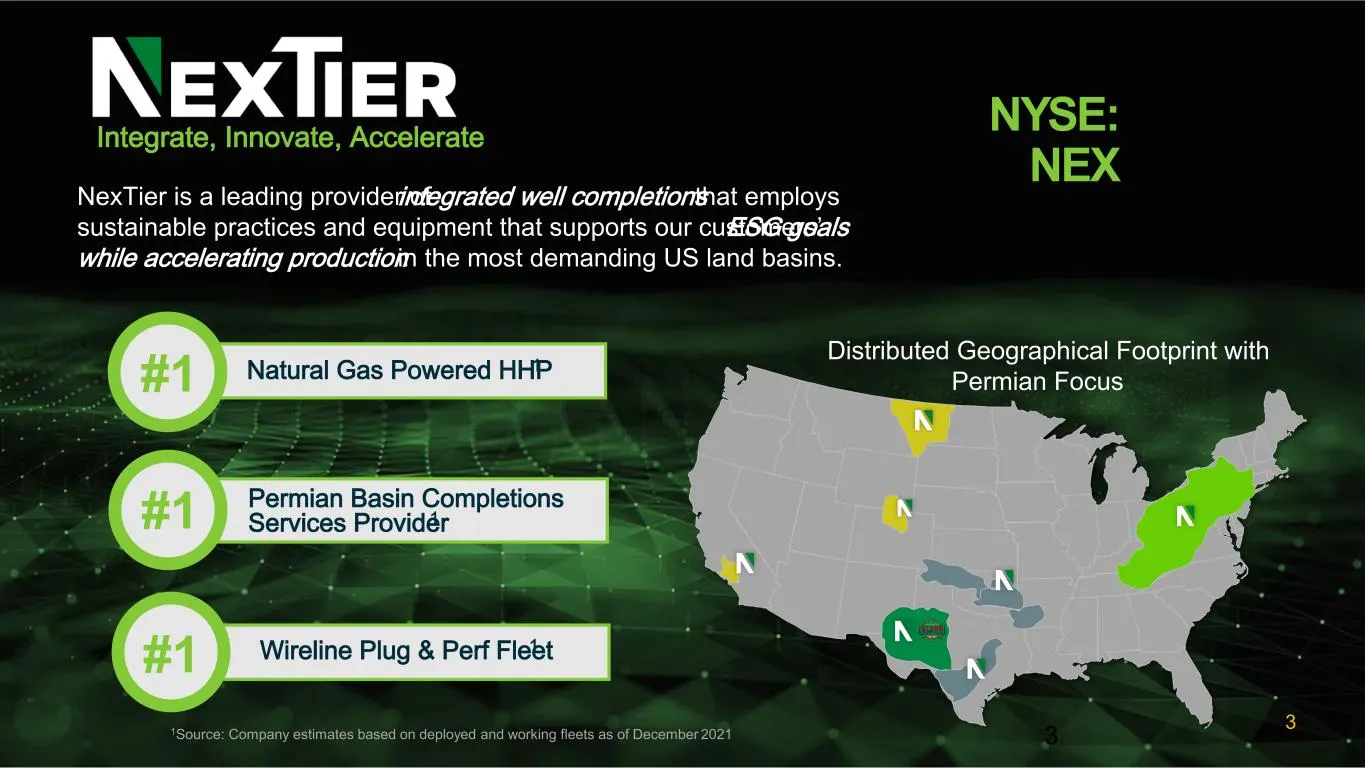
Slide 3: NexTier: Integrate, Innovate, Accelerate
Wireline Plug & Perf Fleet1 NYSE: NEX 3 #1 #1 #1 Natural Gas Powered HHP1 Permian Basin Completions Services Provider1 NexTier is a leading provider of integrated well completions that employs sustainable practices and equipment that supports our customers’ ESG goals while accelerating productionin
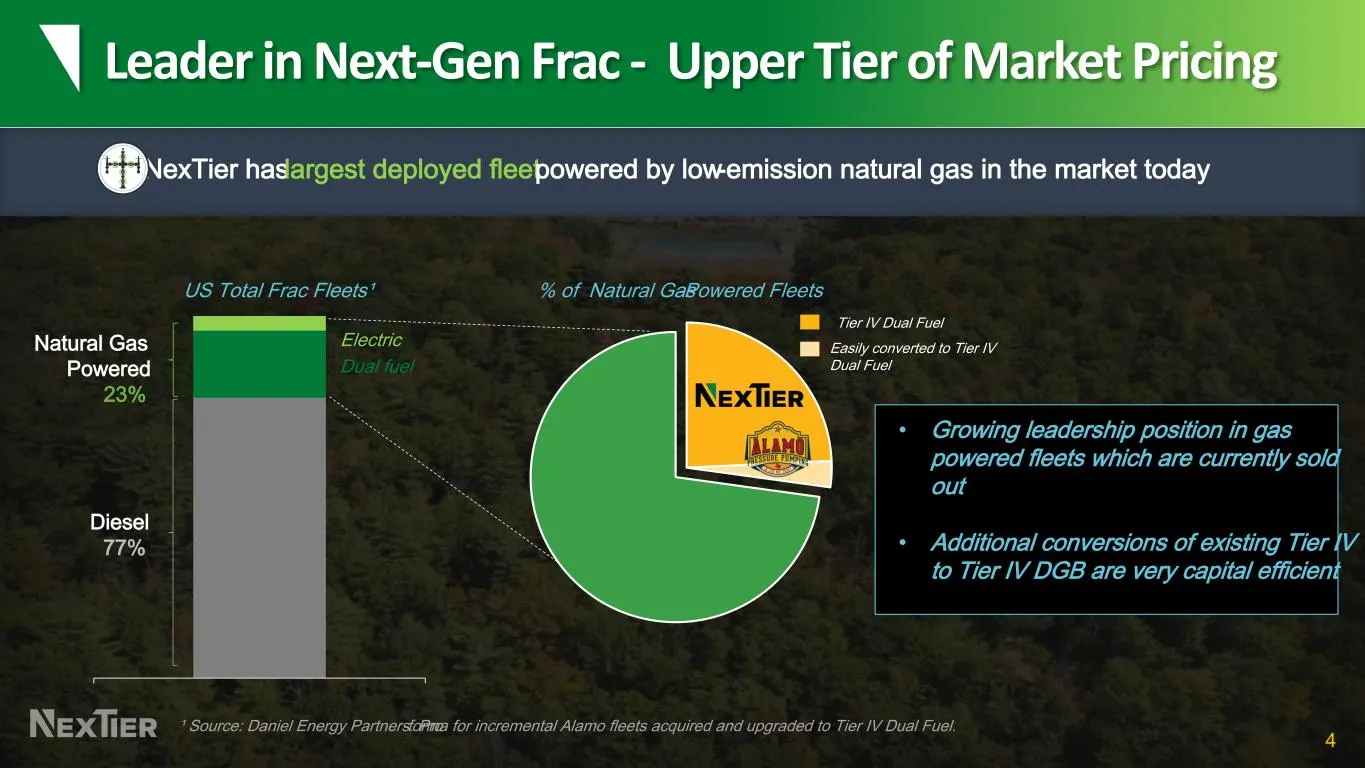
Slide 4: Leader in Next-Gen Frac - Upper Tier of Market Pricing
4 ¹ Source: Daniel Energy Partners. Pro-forma for incremental Alamo fleets acquired and upgraded to Tier IV Dual Fuel. Natural Gas Powered 23% Diesel 77% Dual fuel Electric Leader in Next-Gen Frac - Upper Tier of Market Pricing US Total Frac Fleets¹ % of Natural Gas-Powered Fleets • Growing leadersh
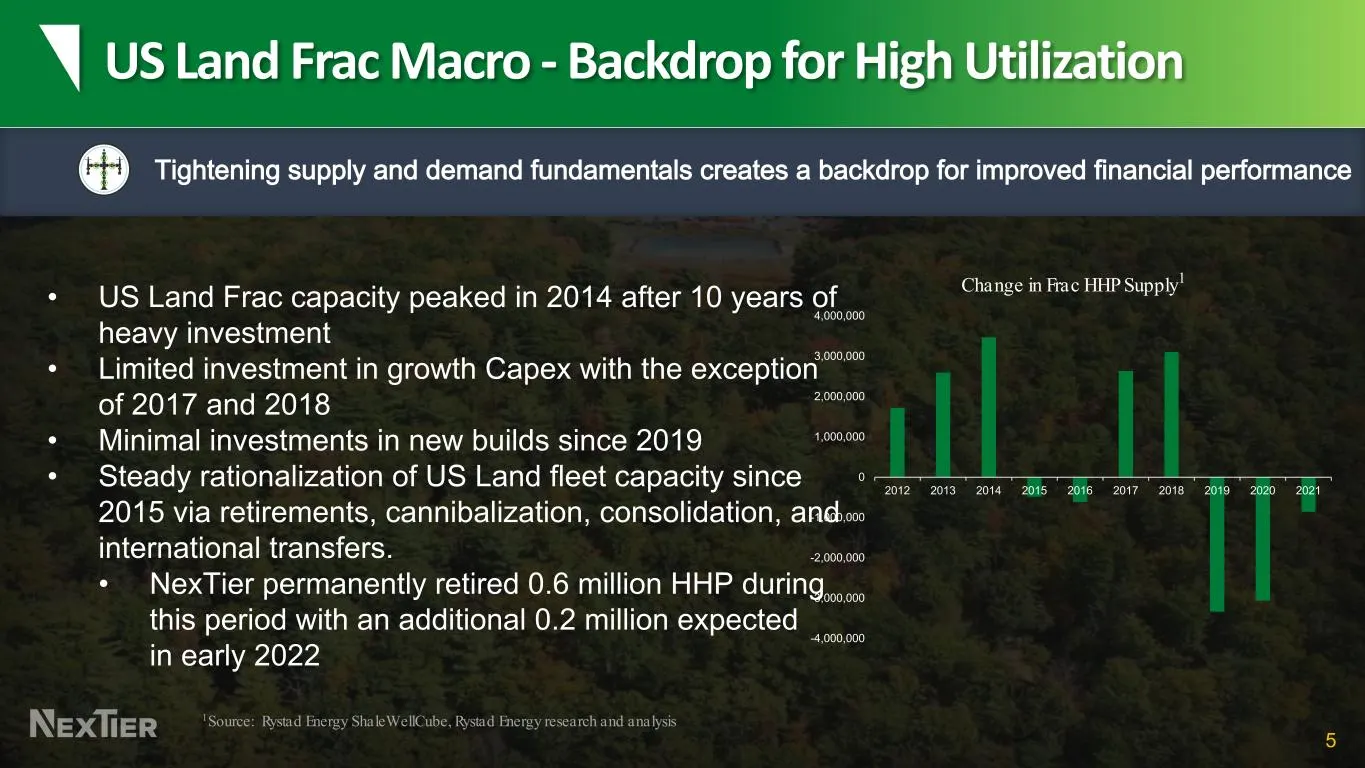
Slide 5: US Land Frac Macro - Backdrop for High Utilization
5 US Land Frac Macro - Backdrop for High Utilization Tightening supply and demand fundamentals creates a backdrop for improved financial performance • US Land Frac capacity peaked in 2014 after 10 years of heavy investment • Limited investment in growth Capex with the exception of 2017 and 2018 • Mi
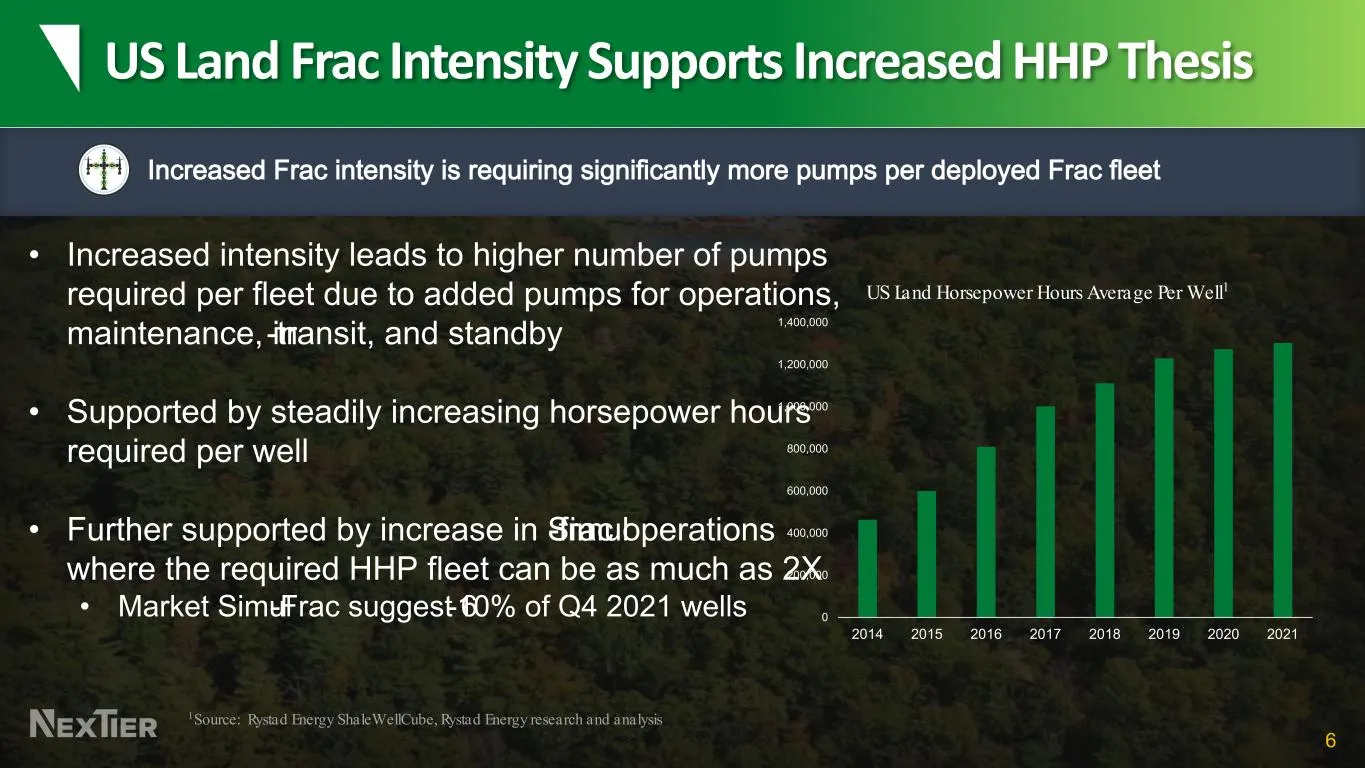
Slide 6: US Land Frac Intensity Supports Increased HHP Thesis
6 US Land Frac Intensity Supports Increased HHP Thesis Increased Frac intensity is requiring significantly more pumps per deployed Frac fleet • Increased intensity leads to higher number of pumps required per fleet due to added pumps for operations, maintenance, in-transit, and standby • Supported b
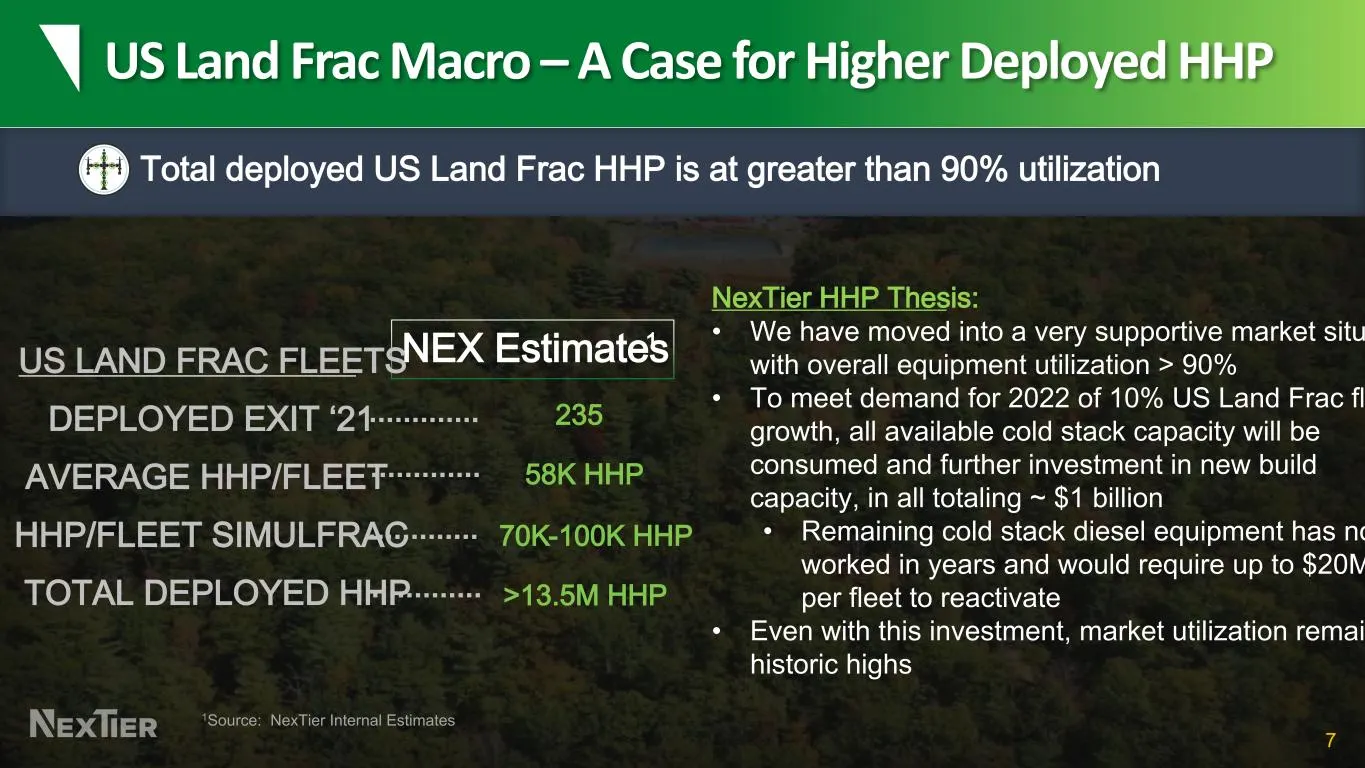
Slide 7: US Land Frac Macro – A Case for Higher Deployed HHP
7 US Land Frac Macro – A Case for Higher Deployed HHP Total deployed US Land Frac HHP is at greater than 90% utilization 1Source: NexTier Internal Estimates NEX Estimates 1 US LAND FRAC FLEETS DEPLOYED EXIT ‘21 AVERAGE HHP/FLEET HHP/FLEET SIMULFRAC TOTAL DEPLOYED HHP 58K HHP 70K-100K HHP >13.5M HHP
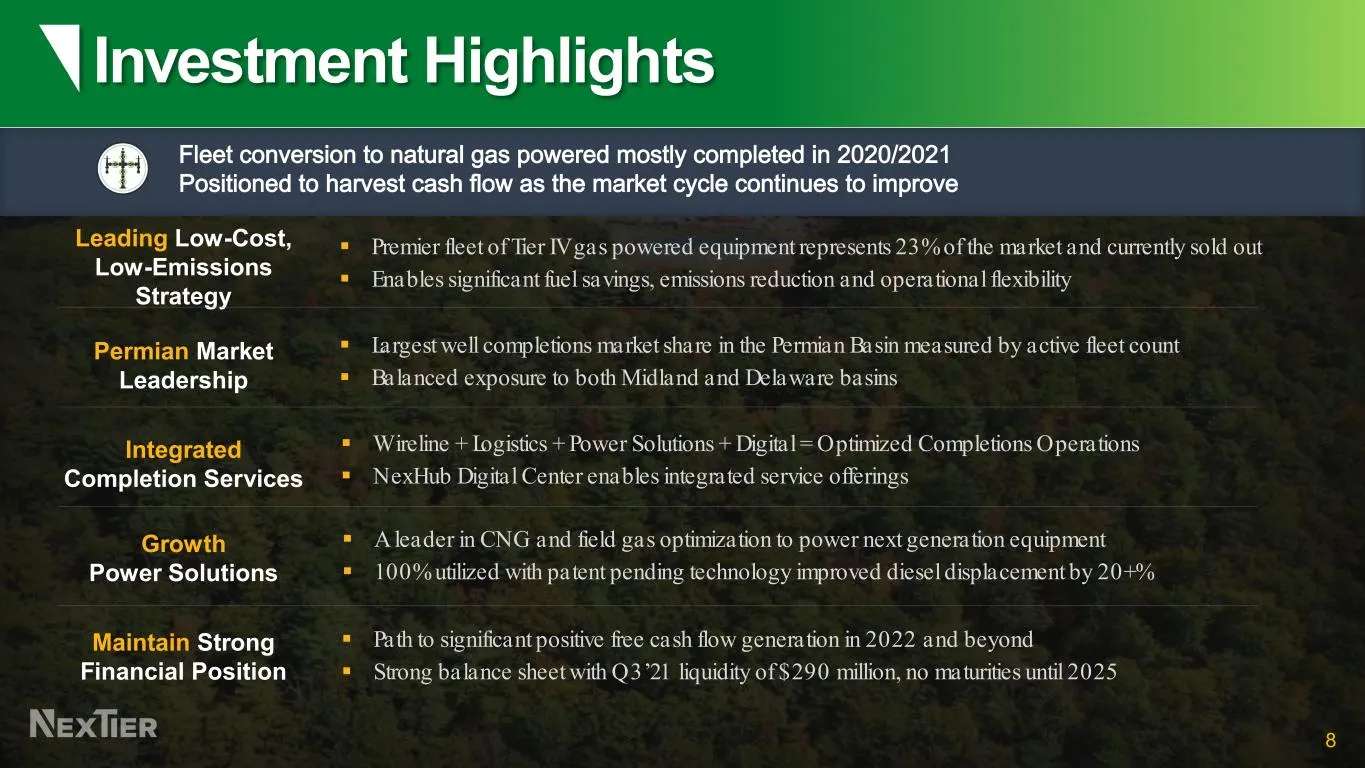
Slide 8: Investment Highlights
Investment Highlights 8 Fleet conversion to natural gas powered mostly completed in 2020/2021 Positioned to harvest cash flow as the market cycle continues to improve Largest well completions market share in the Permian Basin measured by active fleet count Balanced exposure to both Midland and D
Slide 9: NEX Low Cost, Low Emissions Strategy
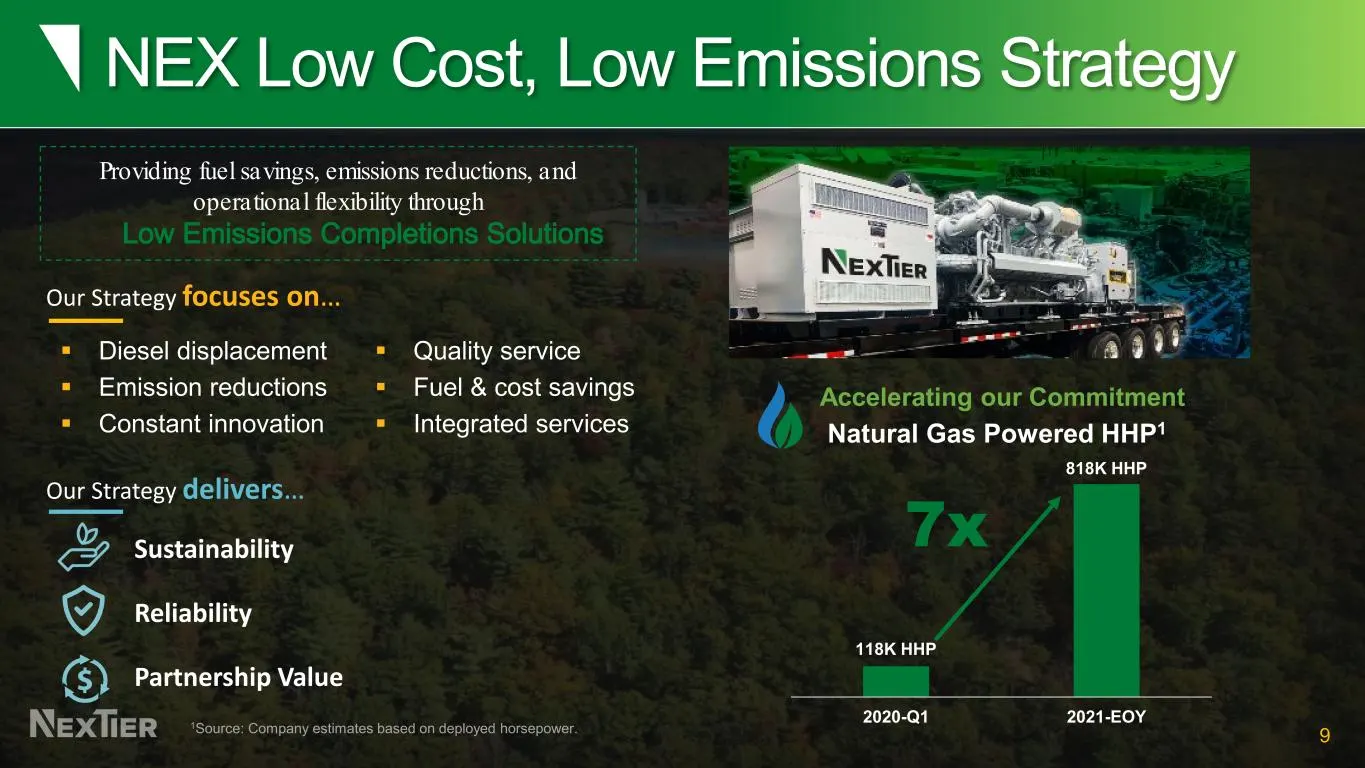
NEX Low Cost, Low Emissions Strategy 9 Diesel displacement Emission reductions Constant innovation Quality service Fuel & cost savings Integrated services 118K HHP 818K HHP 2020-Q1 2021-EOY Natural Gas Powered HHP1 7x Accelerating our Commitment Providing fuel savings, emissions reductio
Slide 10: The Natural Gas Advantage
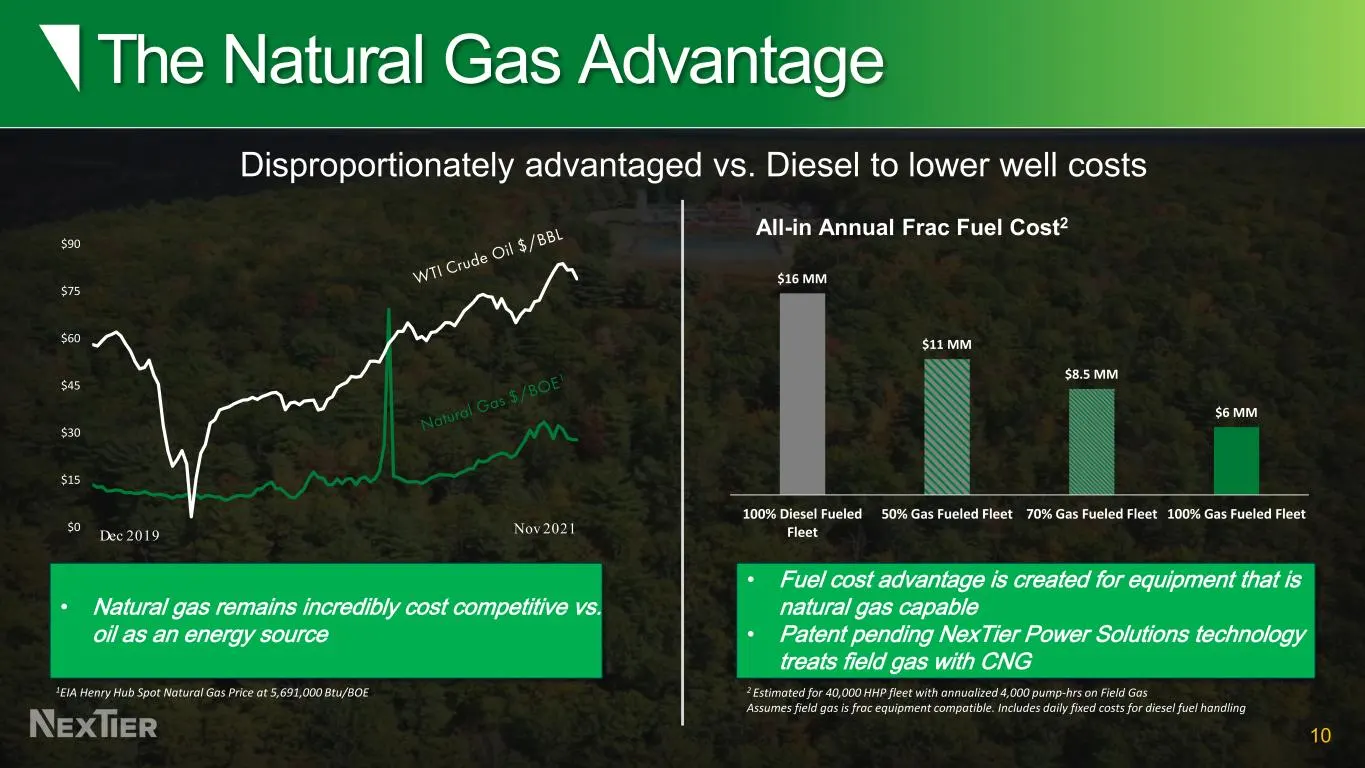
10 The Natural Gas Advantage Disproportionately advantaged vs. Diesel to lower well costs $0 $15 $30 $45 $60 $75 $90 1EIA Henry Hub Spot Natural Gas Price at 5,691,000 Btu/BOE $16 MM $11 MM $8.5 MM $6 MM 100% Diesel Fueled Fleet 50% Gas Fueled Fleet 70% Gas Fueled Fleet 100% Gas Fueled Fleet All-in
Slide 11: Integrated Completions Drives Efficiency
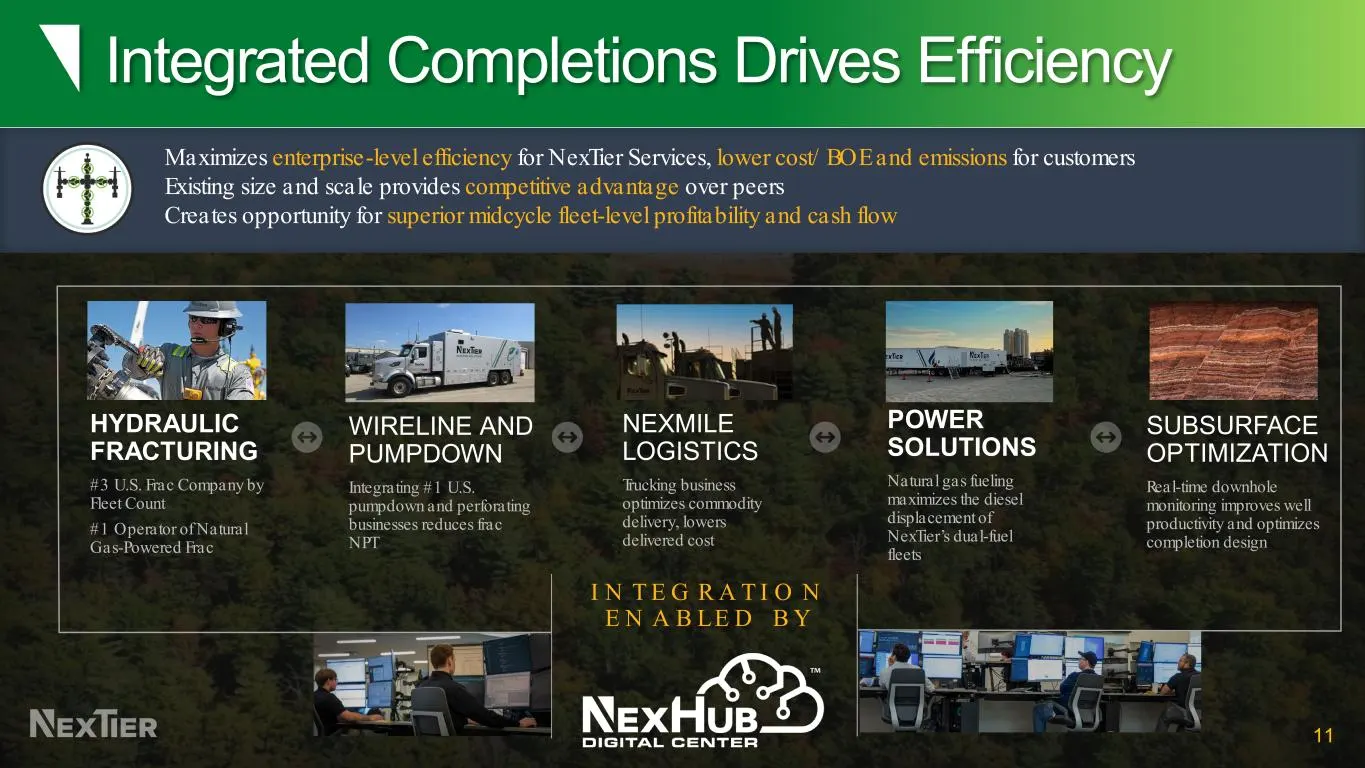
Integrated Completions Drives Efficiency 11 Maximizes enterprise-level efficiency for NexTier Services, lower cost/ BOE and emissions for customers Existing size and scale provides competitive advantage over peers Creates opportunity for superior midcycle fleet-level profitability and cash flow I N
Slide 12: Balance Sheet Management and Investment Timing
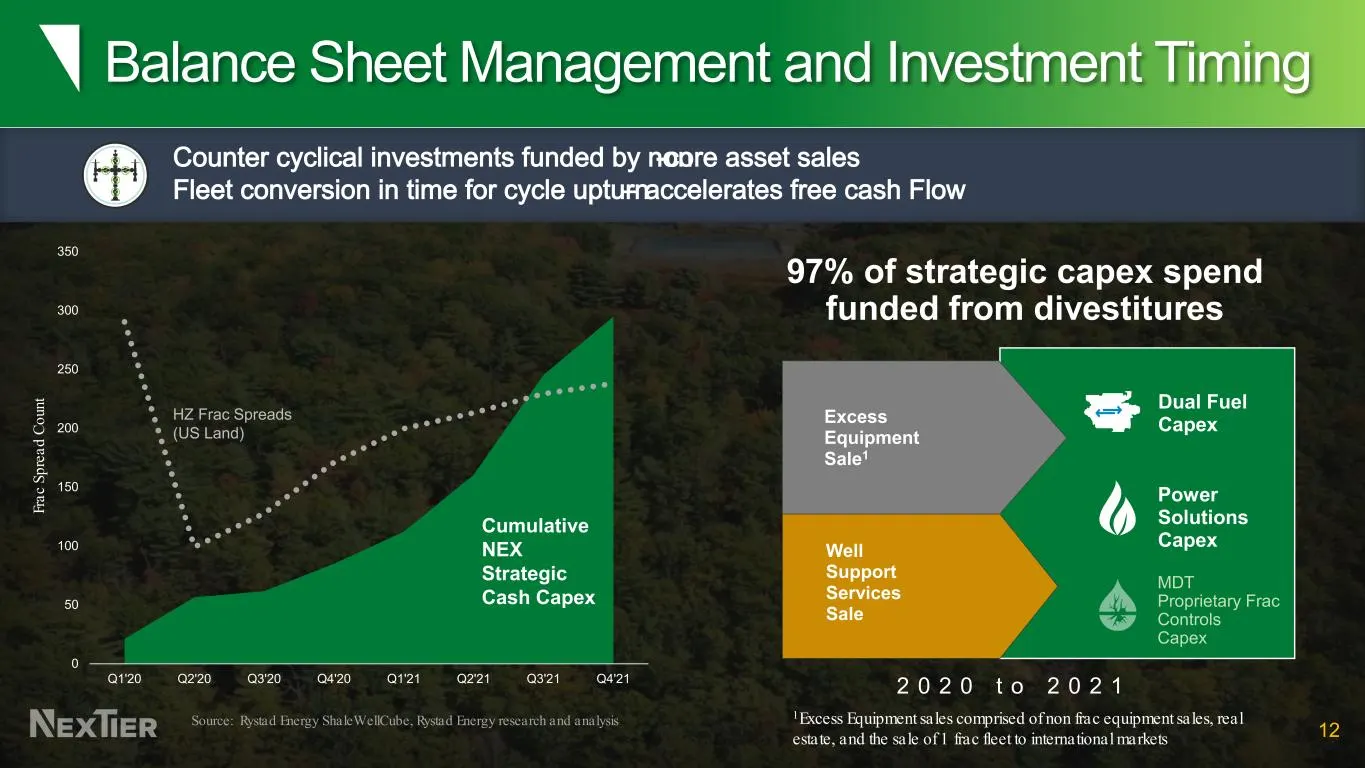
Balance Sheet Management and Investment Timing 12Source: Rystad Energy ShaleWellCube, Rystad Energy research and analysis Counter cyclical investments funded by non-core asset sales Fleet conversion in time for cycle upturn – accelerates free cash Flow 0 50 100 150 200 250 300 350 Q1'20 Q2'20 Q3'20
Slide 13: NEX Growth Outpaces Market Growth As Cycle Rebounds
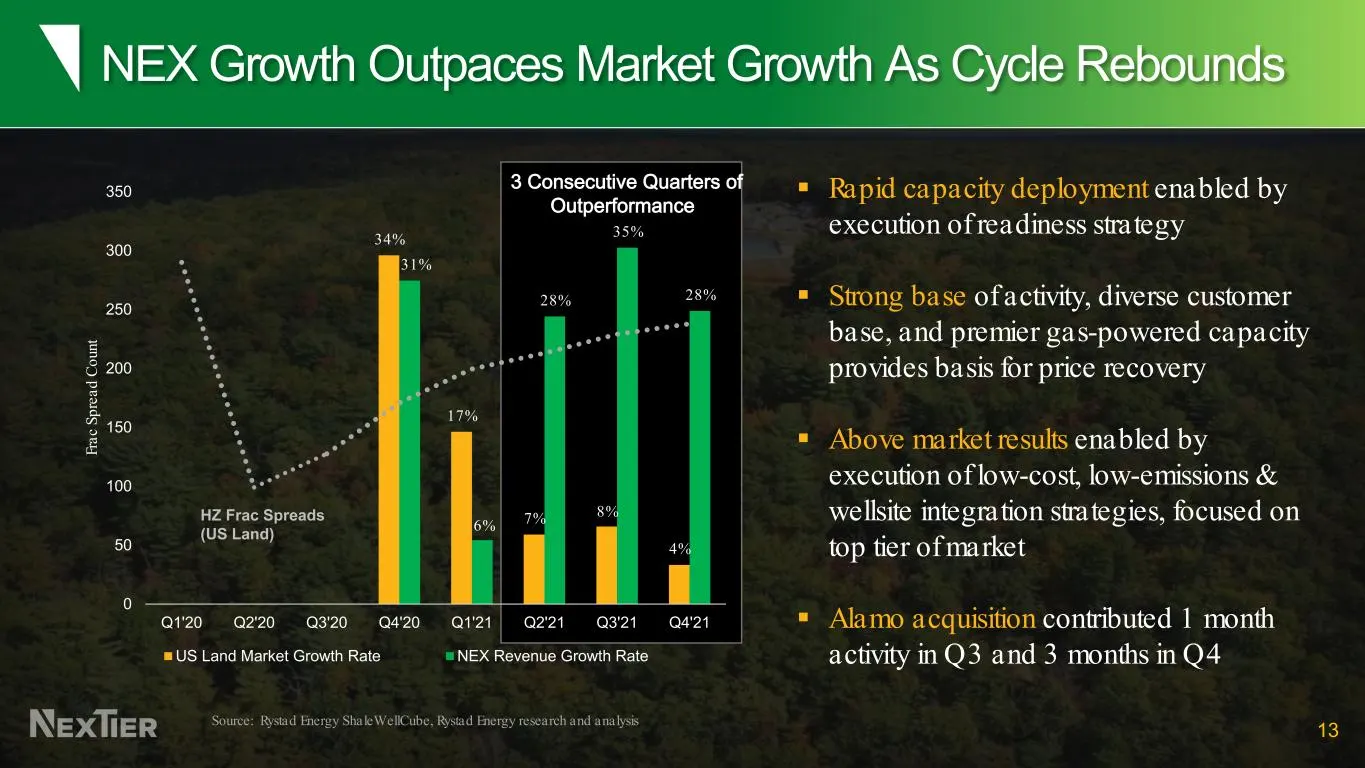
NEX Growth Outpaces Market Growth As Cycle Rebounds 13Source: Rystad Energy ShaleWellCube, Rystad Energy research and analysis Rapid capacity deployment enabled by execution of readiness strategy Strong base of activity, diverse customer base, and premier gas-powered capacity provides basis for
Slide 14: Permian Overview: Alamo Acquisition Accelerates Strategy
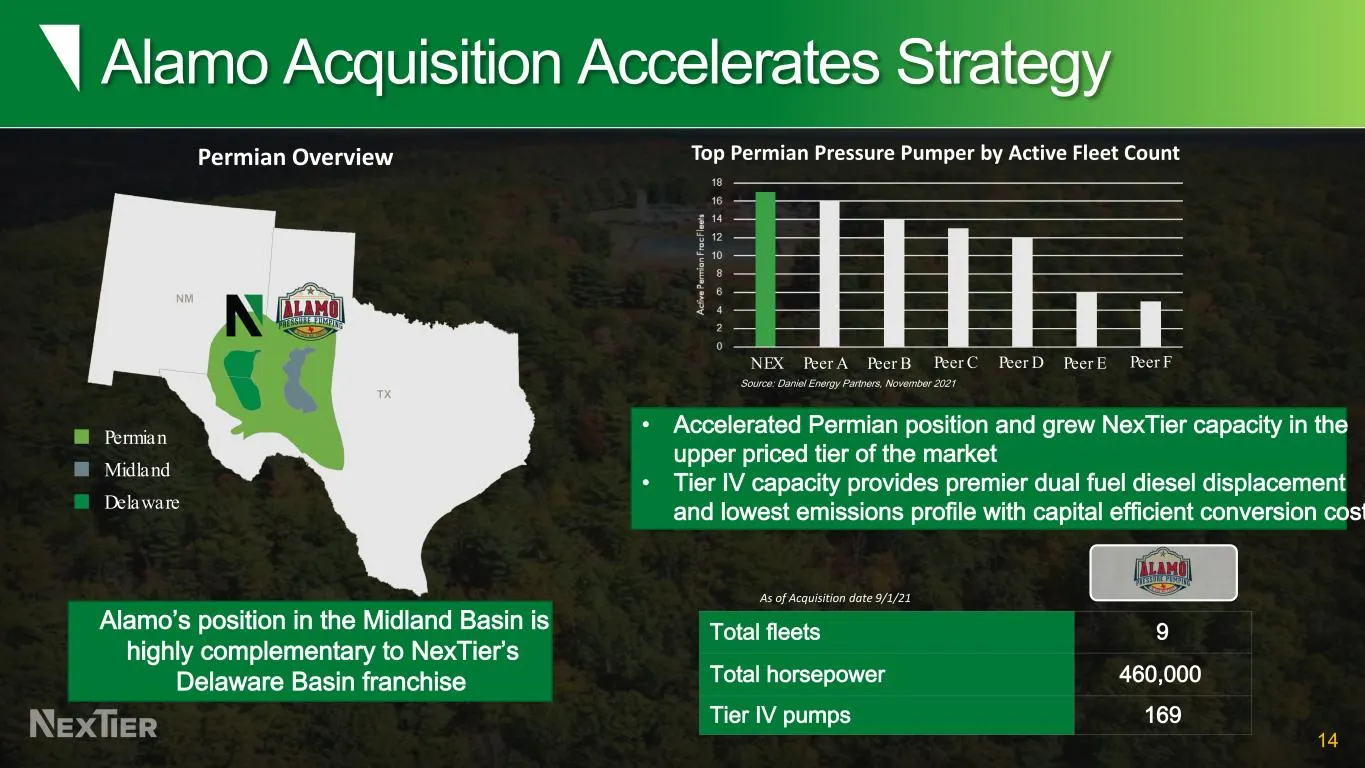
14 Permian Midland Delaware Permian Overview Alamo’s position in the Midland Basin is highly complementary to NexTier’s Delaware Basin franchise • Accelerated Permian position and grew NexTier capacity in the upper priced tier of the market • Tier IV capacity provides premier dual fuel diesel
Slide 15: ESG Strategy in Action
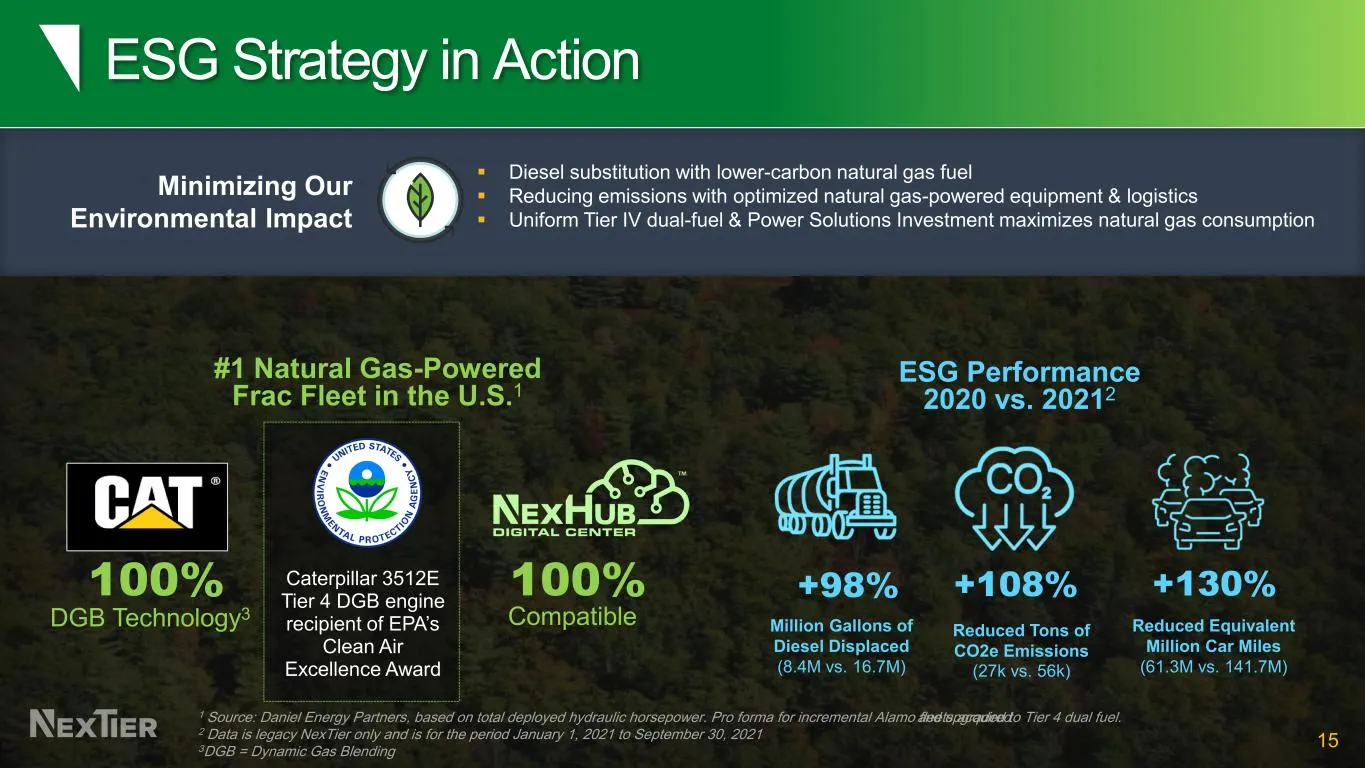
ESG Strategy in Action 15 Diesel substitution with lower-carbon natural gas fuel Reducing emissions with optimized natural gas-powered equipment & logistics Uniform Tier IV dual-fuel & Power Solutions Investment maximizes natural gas consumption #1 Natural Gas-Powered Frac Fleet in the U.S.1 E
Slide 16: Premier Position to Capitalize on Improved Cycle Dynamics
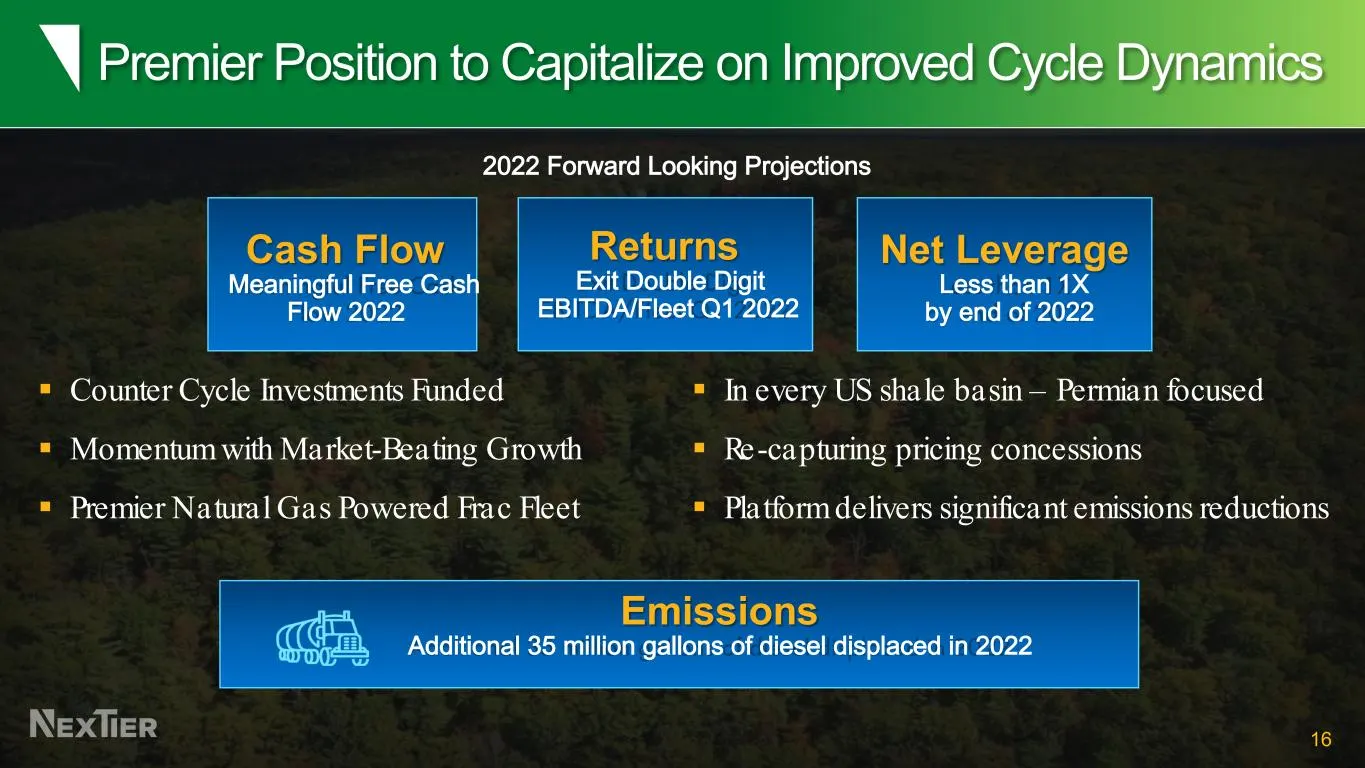
Premier Position to Capitalize on Improved Cycle Dynamics 16 Counter Cycle Investments Funded Momentum with Market-Beating Growth Premier Natural Gas Powered Frac Fleet In every US shale basin – Permian focused Re-capturing pricing concessions Platform delivers significant emissions redu
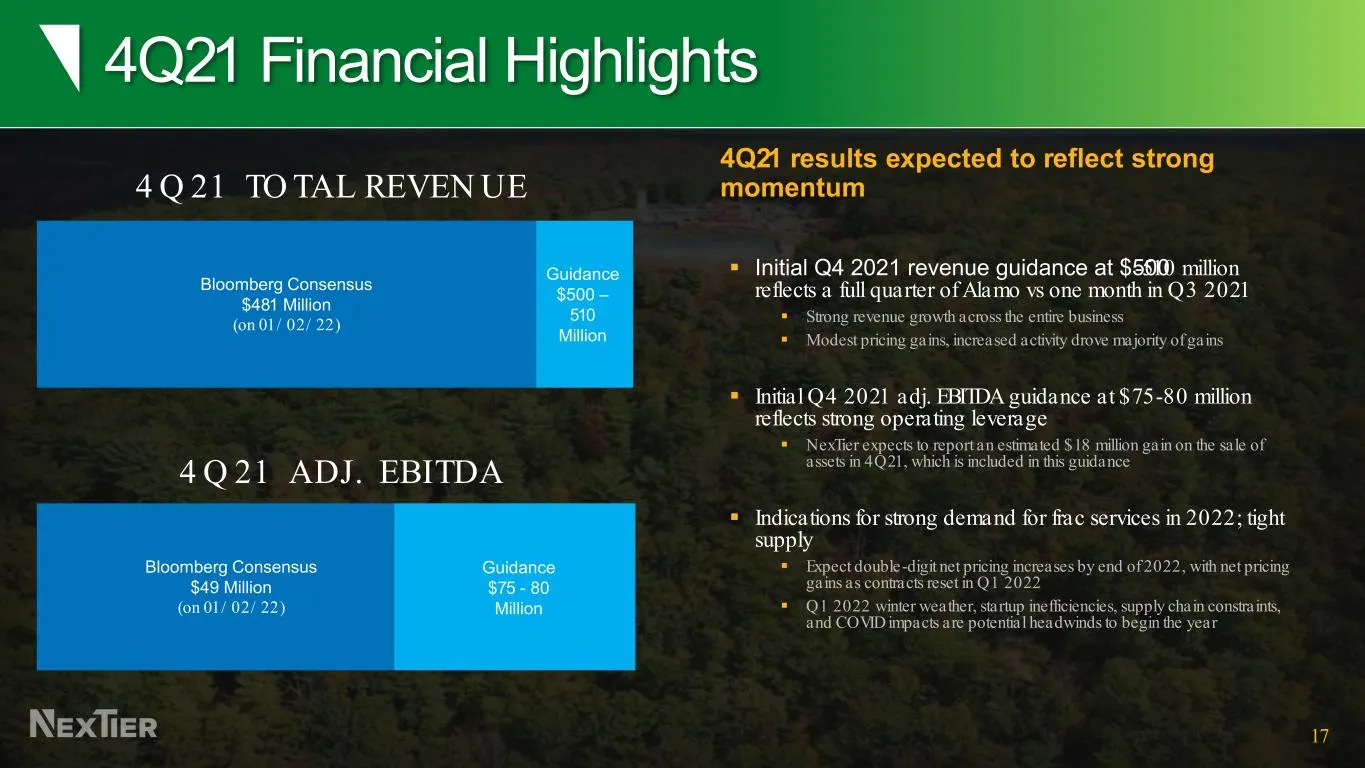
Slide 17: 4Q21 Financial Highlights
4Q21 Financial Highlights 4Q21 results expected to reflect strong momentum Initial Q4 2021 revenue guidance at $500-510 million reflects a full quarter of Alamo vs one month in Q3 2021 Strong revenue growth across the entire business Modest pricing gains, increased activity drove majority of g
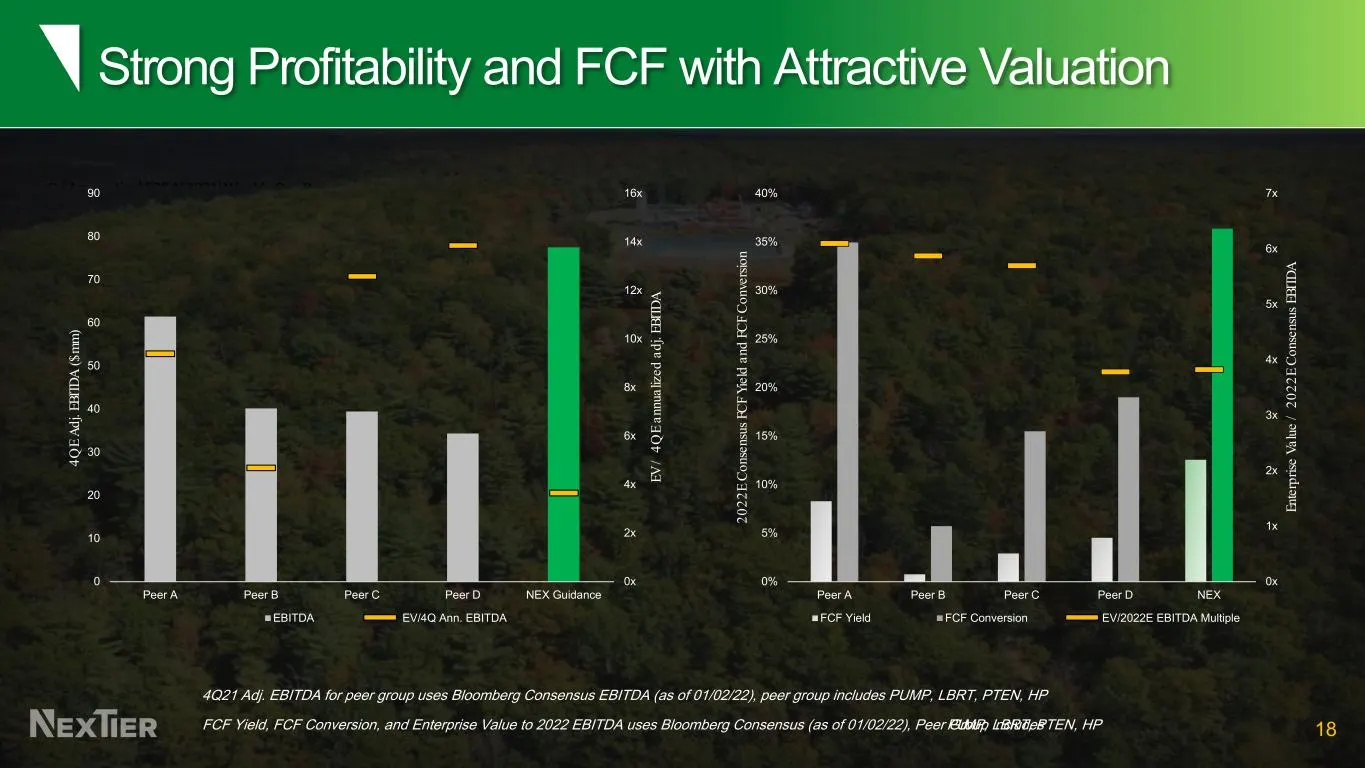
Slide 18: Strong Profitability and FCF with Attractive Valuation
Strong Profitability and FCF with Attractive Valuation 18 4Q21 Adj. EBITDA for peer group uses Bloomberg Consensus EBITDA (as of 01/02/22), peer group includes PUMP, LBRT, PTEN, HP FCF Yield, FCF Conversion, and Enterprise Value to 2022 EBITDA uses Bloomberg Consensus (as of 01/02/22), Peer Group in
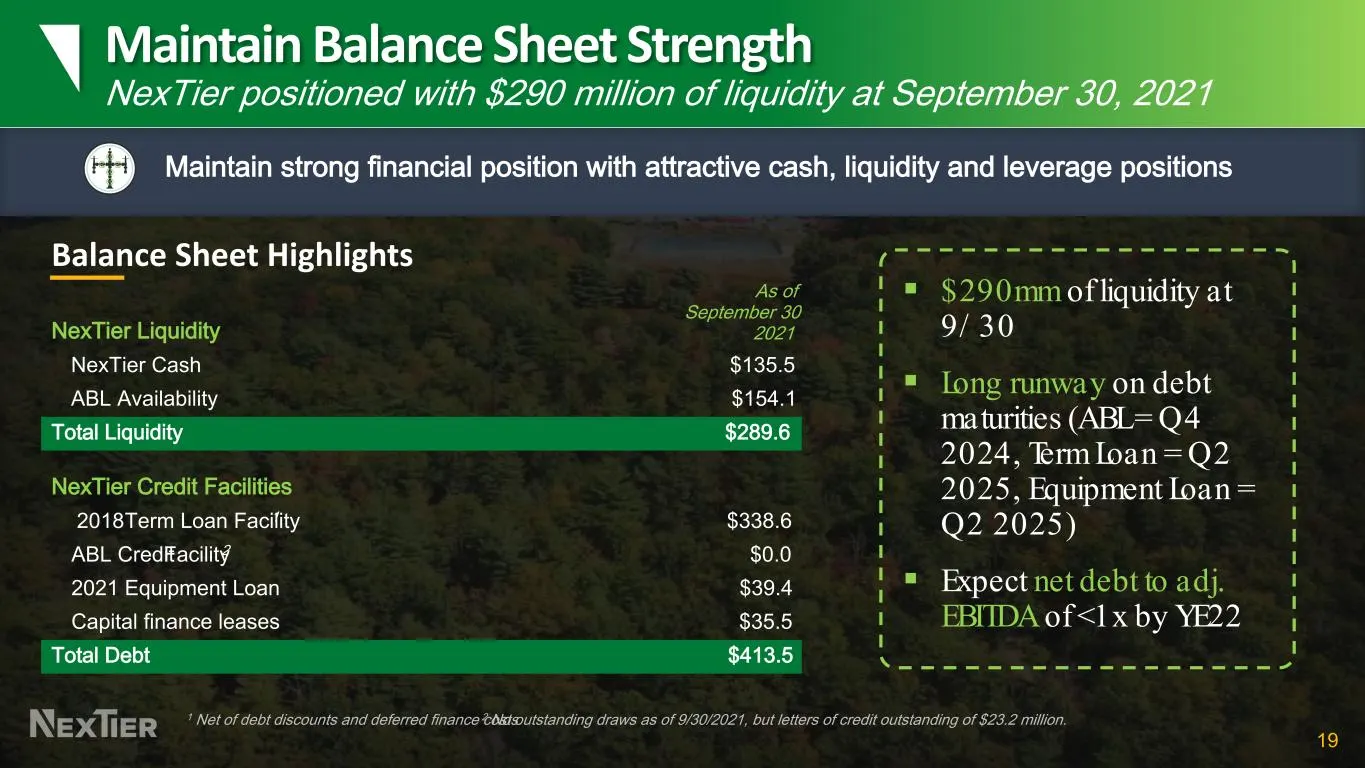
Slide 19: Maintain Balance Sheet Strength
19 1 Net of debt discounts and deferred finance costs. 2 No outstanding draws as of 9/30/2021, but letters of credit outstanding of $23.2 million. $290mm of liquidity at 9/ 30 Long runway on debt maturities (ABL = Q4 2024, Term Loan = Q2 2025, Equipment Loan = Q2 2025) Expect net debt to adj.
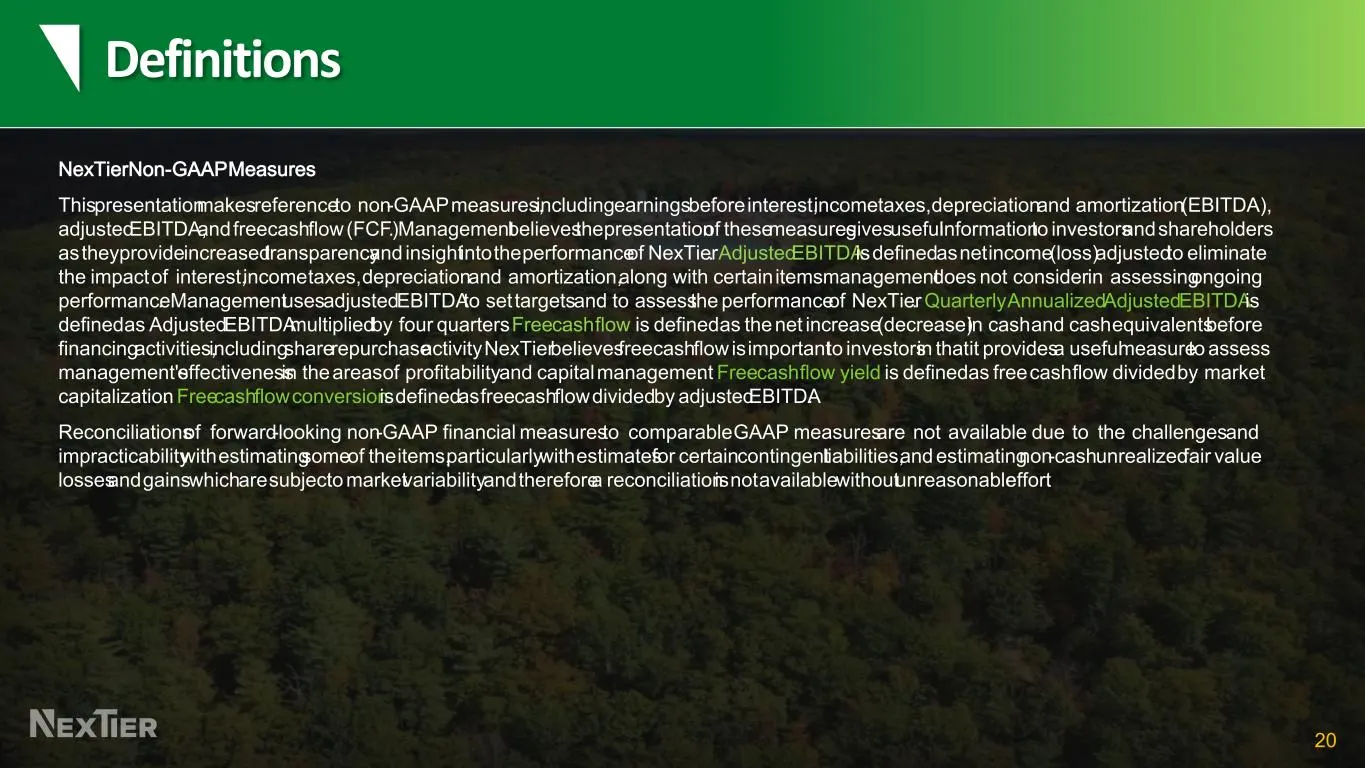
Slide 20: Definitions: NexTier Non-GAAP Measures
20 Definitions NexTierNon-GAAPMeasures Thispresentationmakesreferenceto non-GAAPmeasures,includingearningsbeforeinterest,incometaxes,depreciationand amortization(EBITDA), adjustedEBITDA,andfreecashflow(FCF). Managementbelievesthepresentationof thesemeasuresgivesusefulinformationto investorsandshareh
Source: SEC EDGAR · 8-K filed Jan 3, 2022
More decks from NexTier Oilfield Solutions Inc
 Merger or Acquisition (July 2023)18 slides · Jul 5, 2023
 Merger or Acquisition (June 2023)18 slides · Jun 16, 2023
 Merger or Acquisition (June 2023)23 slides · Jun 15, 2023
 Shareholder Meeting (June 2023)23 slides · Jun 1, 2023
 Investor Presentation (February 2023)26 slides · Feb 15, 2023
 Investor Presentation (October 2022)28 slides · Oct 25, 2022