Dresser-Rand — Howard Weil 37th Energy Conference 2009
26 slides from Dresser-Rand's conference presentation, Mar 24, 2009
Slide 1: Howard Weil 37th Energy Conference
Howard Weil 37 th Energy Conference March 25, 2009
Slide 2: Disclosure
Disclosure The Private Securities Litigation Reform Act of 1995 provides a “safe harbor” for certain forward-looking statements so long as such information is identified as forward-looking and is accompanied by meaningful cautionary statements identifying important factors that could cause actual re
Slide 3: Company Overview
Company Overview
Slide 4: Dresser-Rand - Global Supplier of Energy Solutions
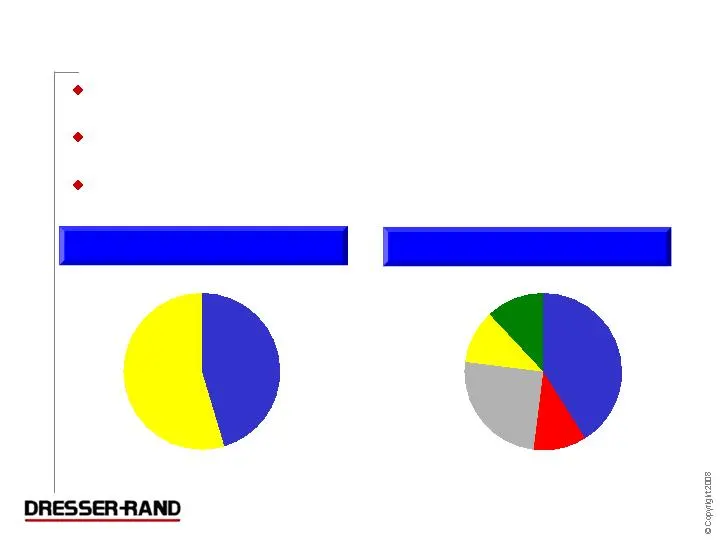
45% 2008 Sales By Business Segment 2008 Revenues By Destination 11% 41% 12% Dresser-Rand - Global Supplier of Energy Solutions Over 90% of bookings for the twelve months ended 12/31/08 of $2.3 billion from oil and gas infrastructure spending Compression is needed at every stage of the oil and gas pr
Slide 5: Strong Markets & Operational Excellence Have Led to Solid Revenue and Income Growth
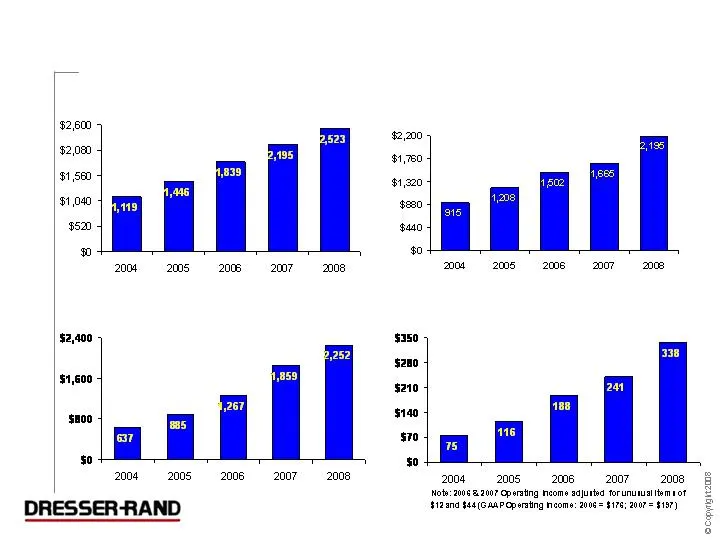
Strong Markets & Operational Excellence Have Led to Solid Revenue and Income Growth Backlog End of Period ($ in Millions) Bookings ($ in Millions) Sales ($ in Millions) Operating Income ($ in Millions)
Slide 6: Extensive Global Presence
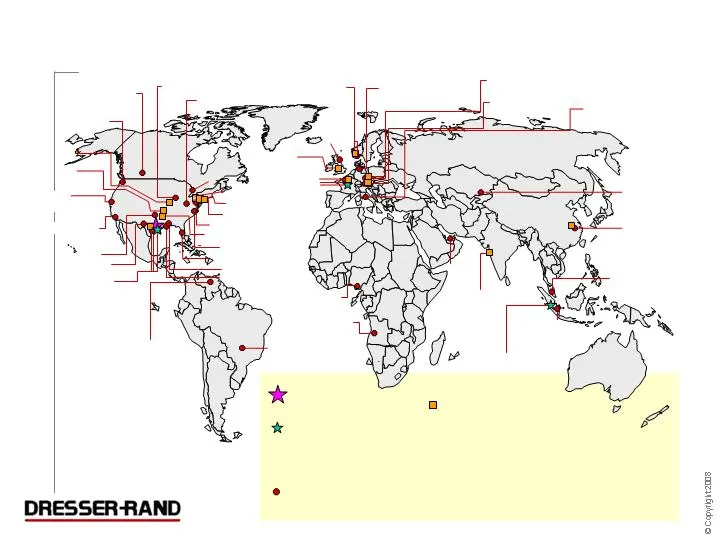
Extensive Global Presence Shanghai, PRC Kemanan, Terengganu, Malaysia Cilegon, Banten, Indonesia Naroda, India Kongsberg, Norway Spijkenisse, The Netherlands Oberhausen, Germany Peterborough Cambridgeshire U.K. Le Havre, France Genoa, Italy Campinas - SP, Brazil Maracaibo, Edo. Zulia Venezuela Edmon
Slide 7: Broadest Rotating Equipment Offering Meets All Applications
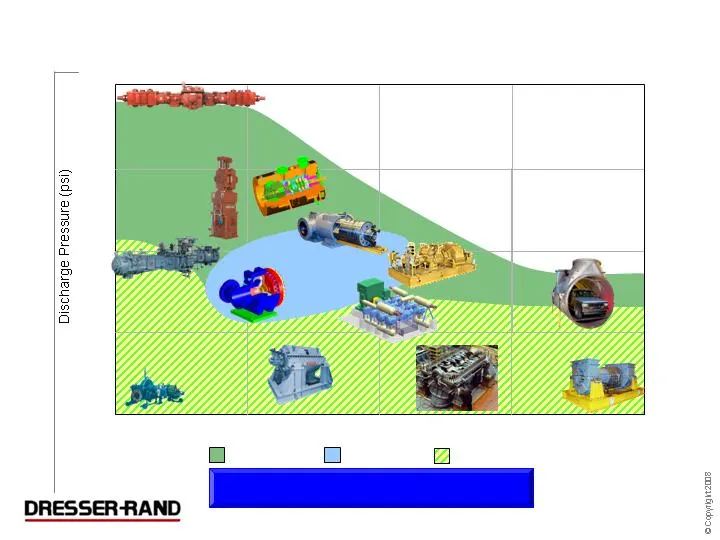
Upstream Midstream Downstream Inlet Volume (cfm) 5,000 50,000 500,000 1,500 15,000 75,000 Gas Reinjection LNG Refining Hydrogen Ethylene GTL CNG Axial DATUM Axially Split Pipeline Booster Process & Separable Recip PDI Boil-Off Recip DATUM (HP) Clean Fuels Centrifugal Gas Transmission Multi-Stage Ste
Slide 8: Most Client Alliances in Industry
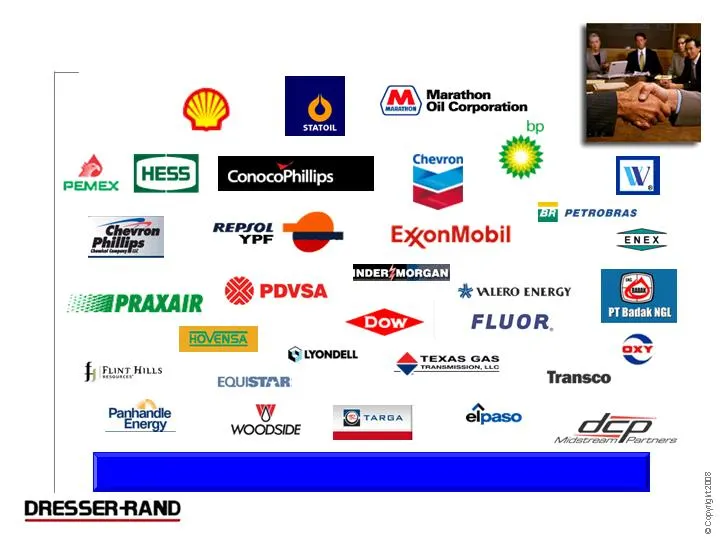
Most Client Alliances in Industry ~ 50 Validation of Dresser-Rand’s Value Proposition
Slide 9: Dresser-Rand
: DRESSER-RAND
Slide 10: Traditional Market Opportunities
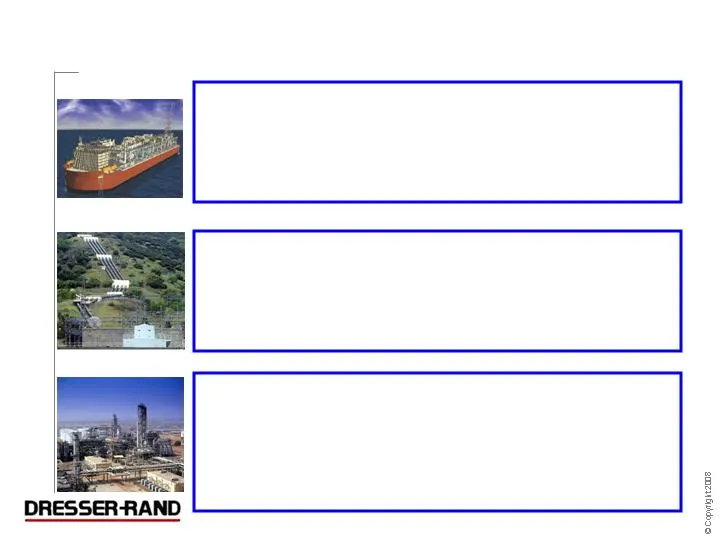
Traditional Market Opportunities Offshore production / LNG / FPSO Peter Brotherhood acquisition strengthens position in FPSO market LNG / Floating LNG (awarded world’s 1 st project) Upstream Midstream Downstream Gas pipelines & storage Recent acquisitions strengthen position (Arrow; Enginuity) Coal
Slide 11: Emerging Market Opportunities
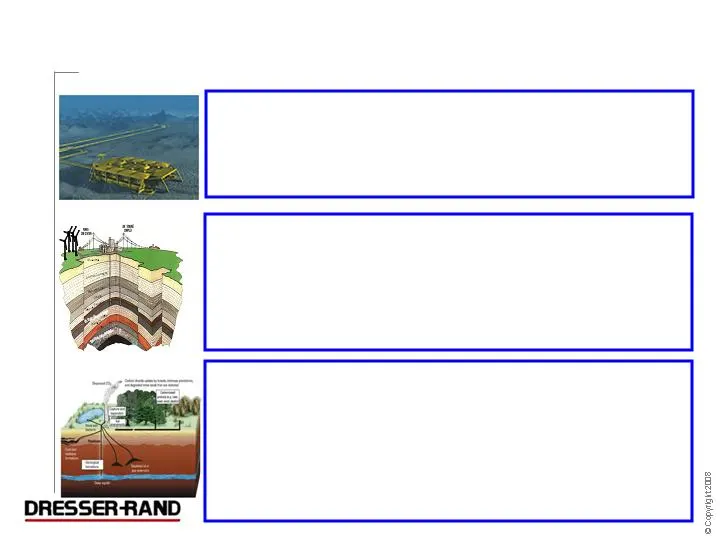
Emerging Market Opportunities ICS - DATUM derivative technology / close coupled motor / proprietary separation technology 1 st commercial order – topside Petrobras P-18 Subsea CAES CO2 Sequestration Experience and Technology - Only operating installation in North America Government Incentives - Fede
Slide 12: Current Market Conditions
Current Market Conditions New Unit Bookings 2009 estimate - $0.7 to $1.1 billion (1Q09 run rate below range) Delay appears temporary – cost reductions sought No major new unit order cancellations Inquiries remain at a high level Aftermarket bookings continue to be steady Slowing economy will challen
Slide 13: Well Positioned to Weather a Slowdown
Well Positioned to Weather a Slowdown Strong backlog of orders Historically dependable aftermarket segment Strong value proposition & selling strategy Flexible manufacturing model Unique low capital intensity business model Strong balance sheet Leadership in place to ensure continued good execution
Slide 14: Strong Backlog of Orders
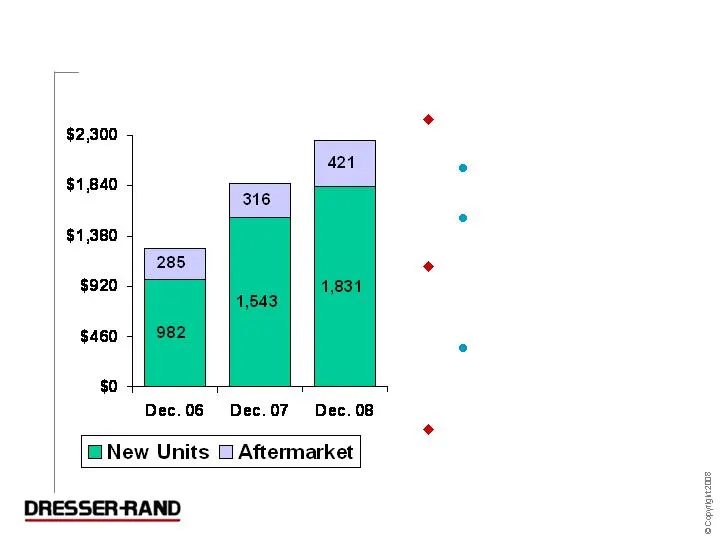
Strong Backlog of Orders ($ in Millions) Backlog of $2.3 billion 21% higher than 12/07 78% higher than 12/06 New unit backlog up 19% vs. last year $1.4 billion scheduled to ship in 2009 Aftermarket backlog up 33% vs. last year $1,267 $1,859 $2,252
Slide 15: Largest installed base - difficult to duplicate
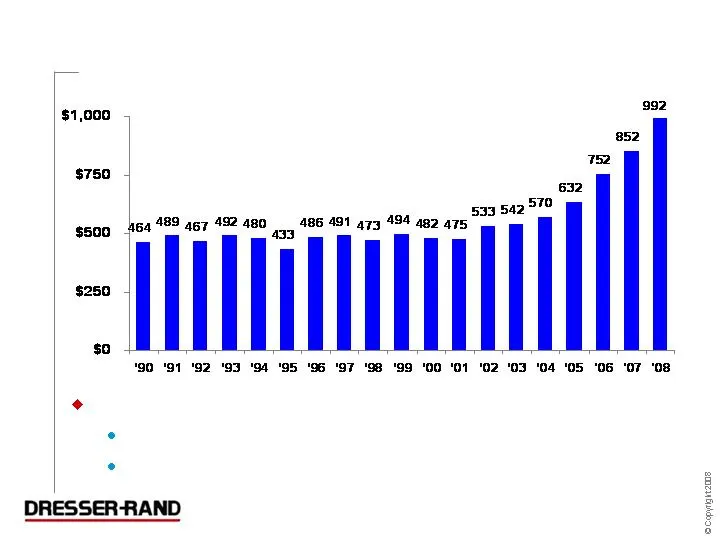
Largest installed base - difficult to duplicate: Built through organic sales and acquisitions Typical operating life of ~ 30-years Historically Dependable Aftermarket (Revenue $ in Millions)
Slide 16: Recognized for lowest Total Cost of Ownership
Recognized for lowest Total Cost of Ownership Consistently able to obtain price premiums over competition D-R’s Technology often offers unique cost saving solutions others cannot. Example: Flex LNG, world’s 1st floating LNG Actual quote from the client’s EPC Technical Director: “D-R was chosen on th
Slide 17: Flexible Manufacturing Model
Flexible Manufacturing Model Highly absorbed internally at cycle bottoms Able to flex capacity to meet cycle peaks Flexibility Through Supply Chain Management ($ in Millions) 08 vs. '01 Sales $877 $2,195 2 1/2 X Operating Income $21 $338 16 X - % of Sales 2.4% 15.4% Employees 6,084 6,400 5% Manufact
Slide 18: Unique Low Capital Intensity Business Model
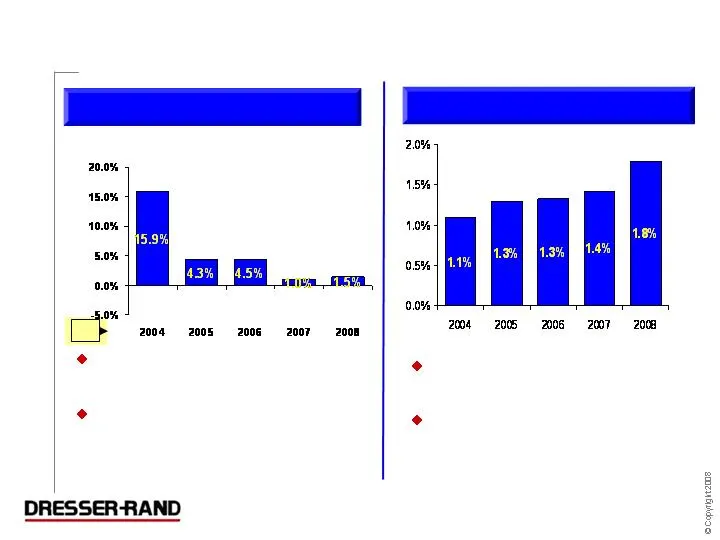
NWC as a % of LTM Sales Capex as a % of Sales Unique Low Capital Intensity Business Model Modest working capital requirements Customer advance payments and progress payments finance working capital Manufacturing strategy allows for low capital expenditures Aftermarket segment low capital intensity *
Slide 19: Strong Balance Sheet
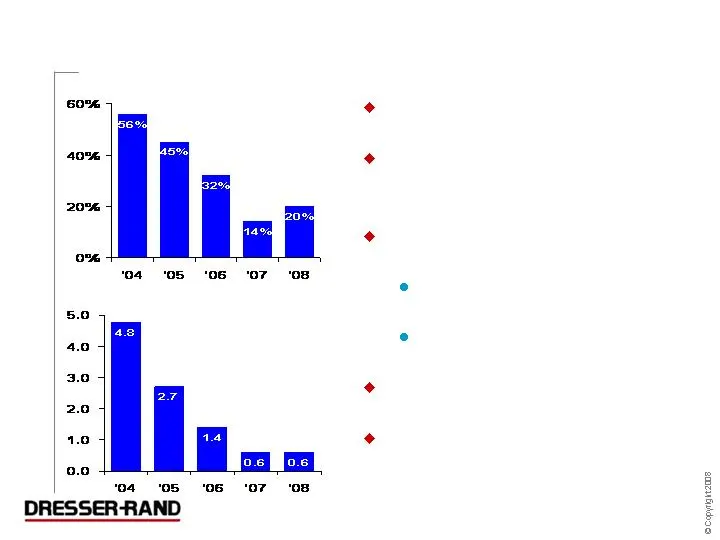
Strong Balance Sheet 7 3/8% Notes Mature 2014 No Revolver Borrowings / $271 Used for Letters of Credit Net debt to total capital 20% Total debt $370 Net debt $223 Net debt to adjusted EBITDA 0.6X Liquidity at 12/31/08 = $376 ($147 Cash + $229 Revolver) Net Debt to Adjusted EBITDA Net Debt to Capital
Slide 20: 2009 Operating Income Guidance
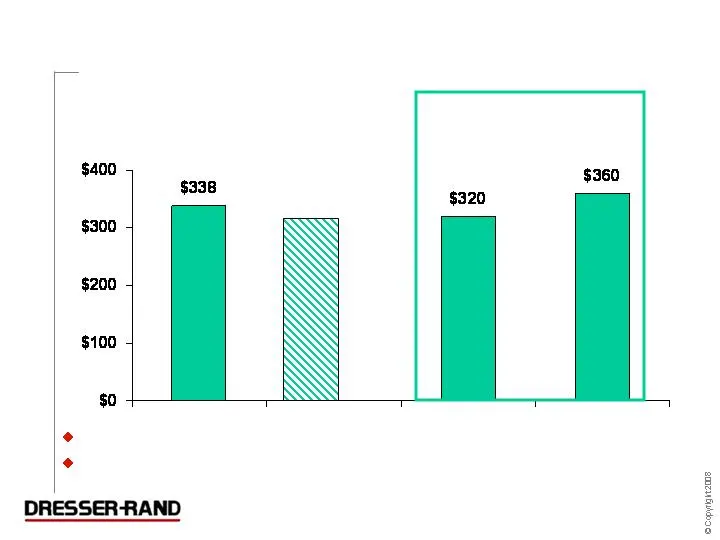
2009 Operating Income Guidance ($ in Millions) Basis of 2009 estimate – 1/31/09 exchange rate (EURO to US$ = 1.28) 1Q09 Operating Income guidance unchanged – 11% to 13% of full year guidance range 2009 Guidance Range Actual Pro Forma (1/31/09 Exch. Rate) $310 - $315
Slide 21: Summary
Summary Believe we have sustainable competitive advantages: Technology, Alliances, Installed Base, Service Network Believe we are very well positioned for difficult economy Unique business model (manufacturing flexibility / low capital intensity) Dependable aftermarket revenue stream Strong financia
Slide 22: Dresser-Rand
DRESSER-RAND
Slide 23: Adjusted EBITDA Reconciliation to GAAP
Adjusted EBITDA Reconciliation to GAAP ($ in Millions) GAAP Net Income $197.7 $106.7 $78.8 $37.1 $49.4 Interest Expense - net 29.4 36.8 47.9 57.0 6.5 Depreciation & Amortization 48.8 49.3 50.3 61.4 39.0 Income Tax Expense 103.6 60.9 58.6 15.5 19.2 EBITDA $379.5 $253.7 $235.6 $171.0 $114.1 Adjustment
Slide 24: NWC Reconciliation to GAAP
NWC Reconciliation to GAAP ($ in Millions) Current Assets $907.8 $825.7 $669.0 $549.4 $574.6 Less: Current Liabilities (736.3) (620.5) (471.5) (393.2) (329.7) GAAP Net Working Capital (NWC) $171.5 $205.2 $197.5 $156.2 $244.9 Adjustments: Cash and Cash Equivalents (147.1) (206.2) (146.8) (98.0) (111.
Slide 25: Net Debt Reconciliation to GAAP
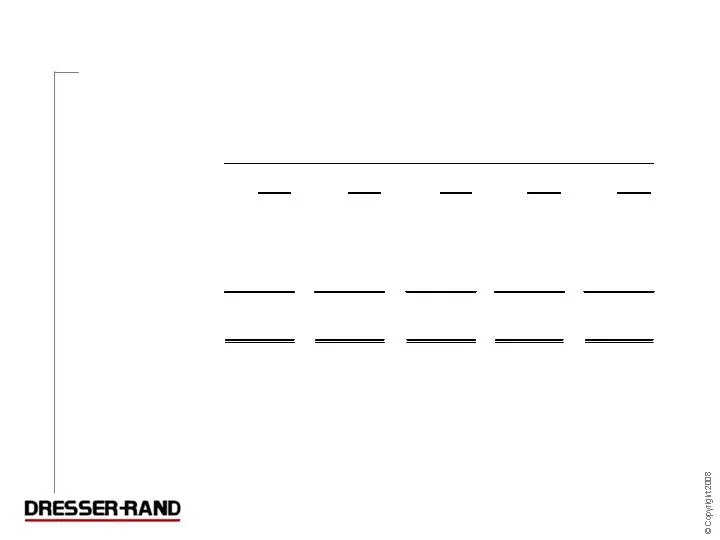
Net Debt Reconciliation to GAAP ($ in Millions) Total Debt $370 $370 $506 $598 $823 Less Cash (147) (206) (147) (98) (112) Net Debt $223 $164 $359 $500 $711 At 12/31
Slide 26: www.dresser-rand.com
www.dresser-rand.com [email protected]
Source: SEC EDGAR · 8-K filed Mar 24, 2009
More decks from Dresser-Rand Group Inc
 Merger or Acquisition (September 2014)16 slides · Sep 23, 2014
 Merger or Acquisition (March 2011)32 slides · Mar 7, 2011
 Credit Suisse Energy Summit 201128 slides · Feb 7, 2011
 Investor Day (November 2010)111 slides · Nov 10, 2010
 Howard Weil 2010 Energy Conference24 slides · Mar 19, 2010
 Pritchard Capital Partners – Energize 201022 slides · Jan 5, 2010