Dresser-Rand — Investor Day (November 2010)
111 slides from Dresser-Rand's investor day presentation, Nov 10, 2010
Slide 1: Accelerating Profitable Growth – Investor / Analyst Day
MENT INTOH, Accelerating Profitable Growth Investor / Analyst Day November 11, 2010
Slide 2: Disclosure
» Disclosure The Private Secures Litgation Reform Act of 1995 provides a "safe harbor for catan fwd. looking statements so long as such information is identified as forward-looking and is accompani by meaningful cautionary slaternentsilenfying important factors that coud cause actual resus, ‘2 diffe
Slide 3: Agenda
BRINGING ENERGY AND THEENVIRONMENT INTO.HAR “_ Agenda
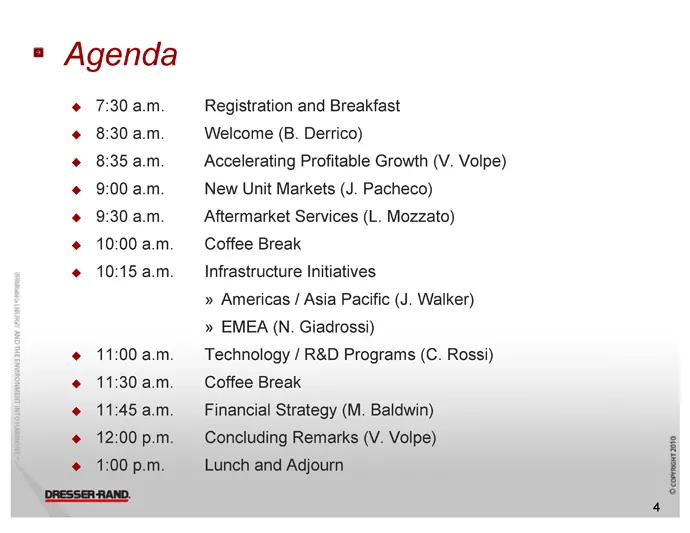
Slide 4: Agenda
Agenda 7:30 a.m 8:30 a.m 8:35 a.m. 9:00 a.m. 9:30 a.m. 10:00 a.m. 10:15 a.m. oo oe eee @ 11:00 a.m. @ 11:30 a.m. @ 11:45 a.m. @ 12:00 p.m. @ 1:00 p.m. Snessen RAND Registration and Breakfast Welcome (B. Derrico) Accelerating Profitable Growth (V. Volpe) New Unit Markets (J. Pacheco) Aftermarket Serv
Slide 5: Accelerating Profitable Growth
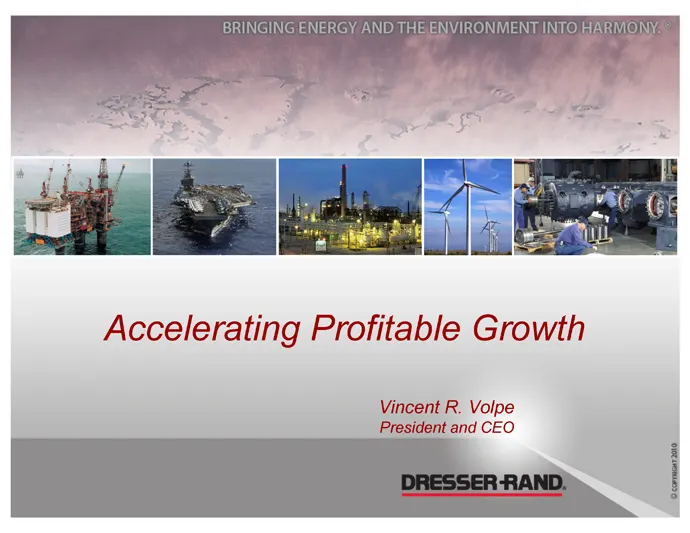
Accelerating Profitable Growth Vincent R. Volpe President and CEO
Slide 6: Safety - Dresser-Rand's Top Priority
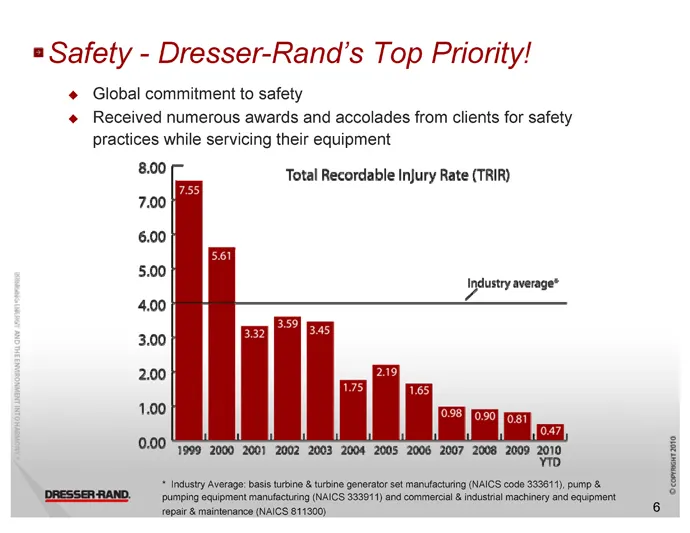
= Safety - Dresser-Rand’s Top Priority! ¢ Global commitment to safety ¢ Received numerous awards and accolades from clients for safety practices while servicing their equipment 8.00 Total Recordable Injury Rate (TRIR) 7.00 6.00 500 dustry averag justry average* 4.00 3.00 2.00 1.00 0.00 4999 2000 200
Slide 7: Vision, mission and guiding principles
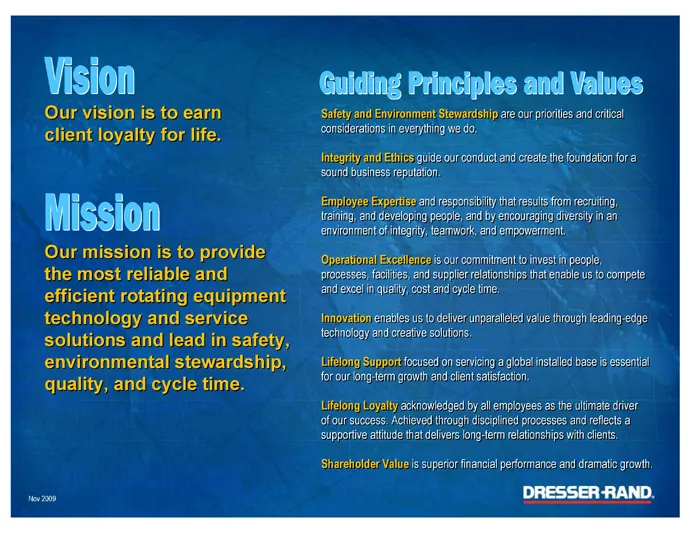
Our vision is to earn client loyalty for life. Our mission is to provide the most reliable and) efficient rotating equipment technology and service solutions and lead in safety, Guiding Principles and Values considerations everyting we do. Integrity and Ethics guide our conduct and oreate:the founda
Slide 8: Global Supplier of Energy Infrastructure Solutions
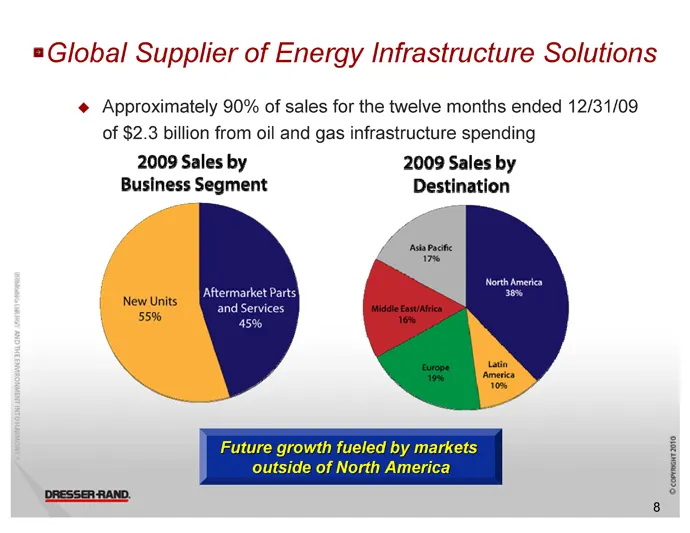
"Global Supplier of Energy Infrastructure Solutions ¢ Approximately 90% of sales for the twelve months ended 12/31/09 of $2.3 billion from oil and gas infrastructure spending 2009 Sales by 2009 Sales by Business Segment Destination Aftermai Sccomanr 3019
Slide 9: Dresser-Rand Investment Highlights
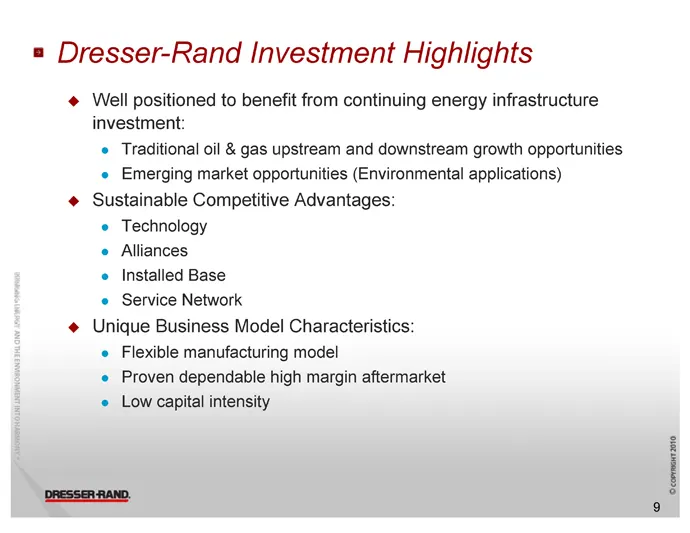
= Dresser-Rand Investment Highlights ¢ Well positioned to benefit from continuing energy infrastructure investment: Traditional oil & gas upstream and downstream growth opportunities Emerging market i © Sustai C on * Technology « Alliances © Installed Base e Service Network Unique Business Model Cha
Slide 10: Focus on Technology Leadership
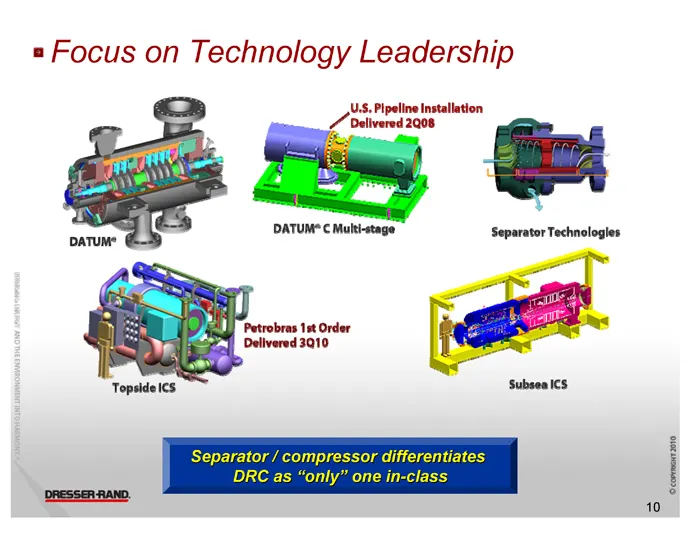
» Focus on Technology Leadership U.S. Pipeline installation Delivered 2008 DATUM®C Multi-sta paTume ge Separator Technologies Petrobras Ist Order Delivered 3010 Topsidelcs Subsea ICS ‘cccrmmac 10
Slide 11: Largest Installed Base of Rotating Equipment
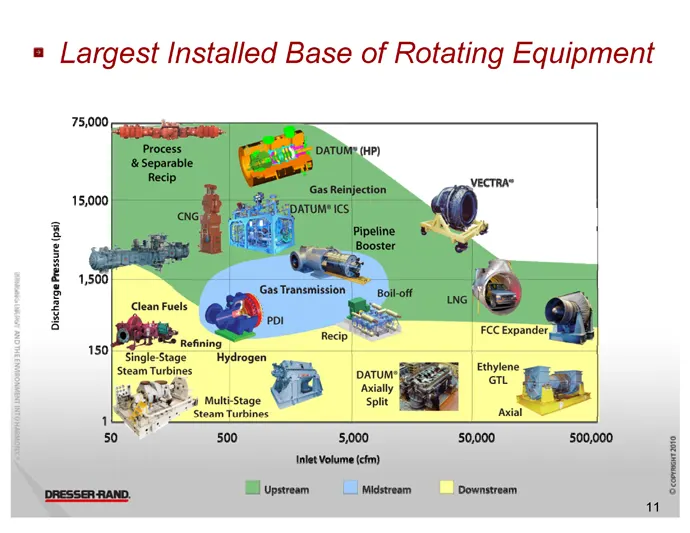
= Largest Installed Base of Rotating Equipment Discharge Pressure (psi Recip . 150F SraleStage Hydrogen ene reared ey ‘Axilly Multi-Stage Split Steam Turbines a 500 Inlet Volume (cfm) resem Hivyeran lieve \_loomaram
Slide 12: Extensive Global Presence
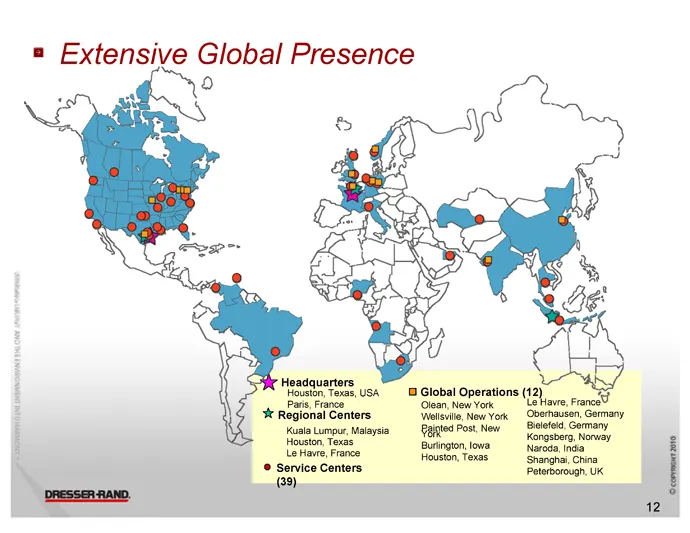
Extensive Global Presence Headquarters austen Texas, USA Global Operations (1 ‘te Regional Centers ‘Olean, New York ‘Wolvite, New York ‘Baten Post, New Tiae France eae
Slide 13: Most Client Alliances in Industry
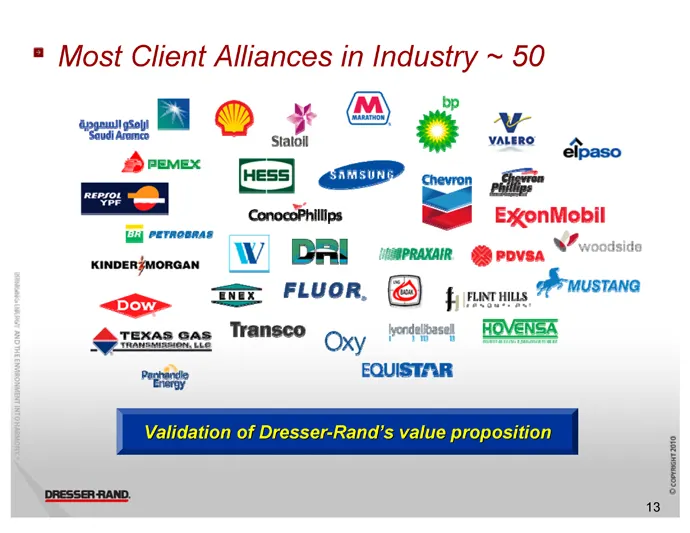
® Most Client Alliances in Industry ~ 50 gSobl Ps | ud AFCO » PEMEX HESS! — elpaso bp @x* 8x a“ ConocoPhillips 3 ExxonMobil snoenjonann Ww Bra] owrwae gpoven Wvoodsiae <> = FLUOR, finer oPrmustana 2A peodetsel EQUISTAR rena
Slide 14: Unique Business Model Characteristics
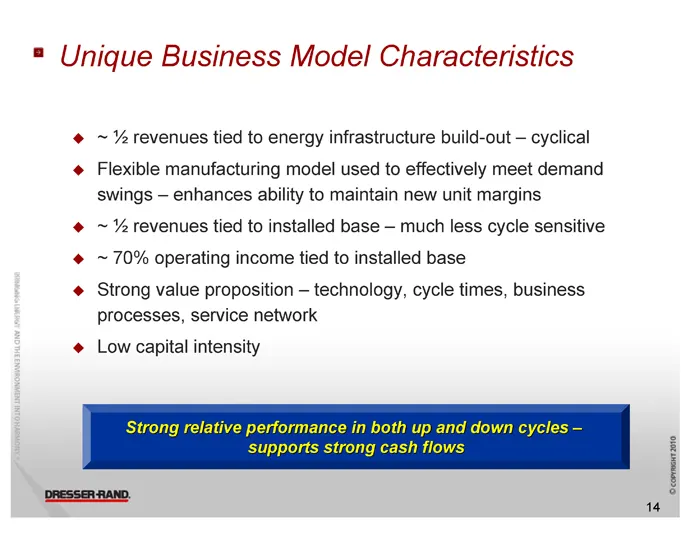
= Unique Business Model Characteristics ° ° oo ° ~ % revenues tied to energy infrastructure build-out — cyclical Flexible manufacturing model used to effectively meet demand swings — enhances ability to maintain new unit margins ~ % revenues tied to installed base — much less cycle sensitive ~ 70% o
Slide 15: Base Business Enablers – Growth ~10% CAGR
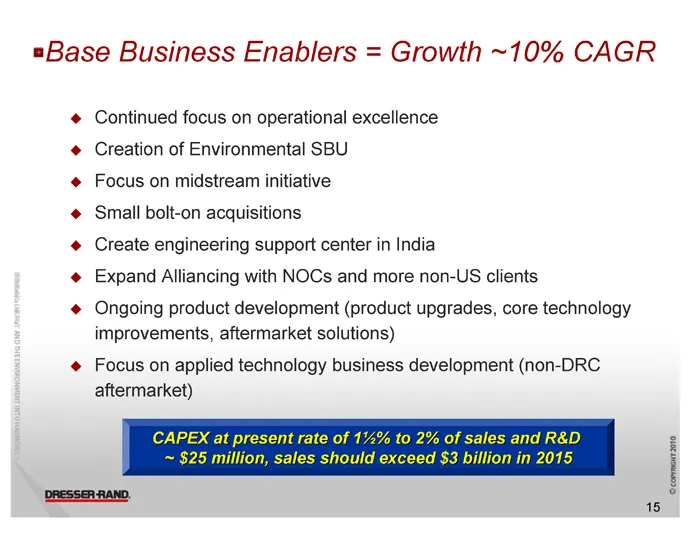
=Base Business Enablers = Growth ~10% CAGR Continued focus on operational excellence Creation of Environmental SBU Focus on midstream initiative Small bolt-on acquisitions Create engineering support center in India Expand Alliancing with NOCs and more non-US clients ooo eo oe Ongoing product develop
Slide 16: Growth Accelerators
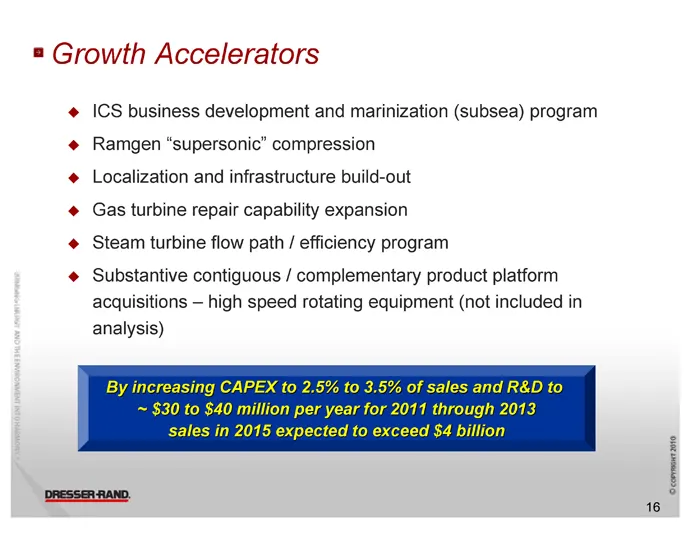
= Growth Accelerators ICS business development and marinization (subsea) program Ramgen “supersonic” compression Localization and infrastructure build-out Gas turbine repair capability expansion Steam turbine flow path / efficiency program / y product platform acquisitions — high speed rotating equi
Slide 17: Baseline vs. Accelerated Sales Growth
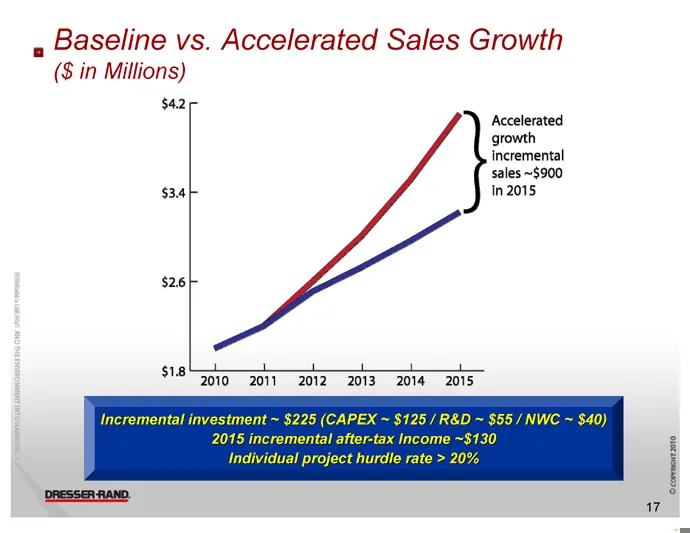
2 Baseline vs. Accelerated Sales Growth ($ in Millions) $42 Accelerated incremental sales ~$900 $34 in 2015, $26 $1.8 2010 2011 (2012 «2013-2014 «2015
Slide 18: New Units
New Units Jesus Pacheco Executive Vice President, New Equipment Worldwide
Slide 19: Summary
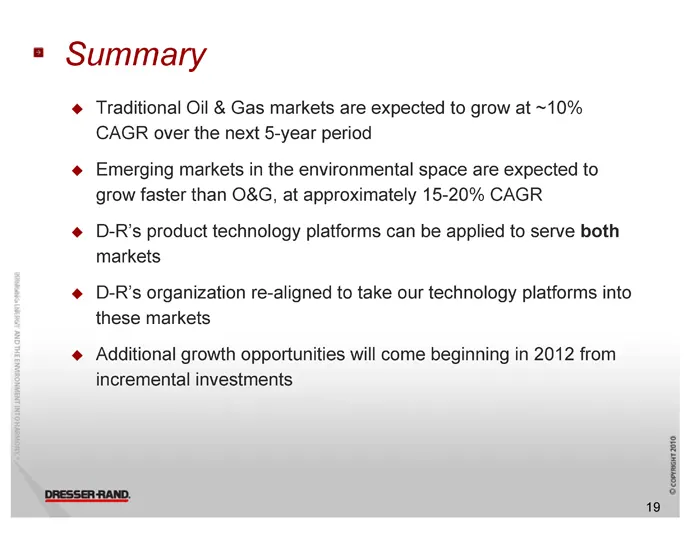
=» Summary Traditional Oil & Gas markets are expected to grow at ~10% CAGR over the next 5-year period ° Emerging markets in the environmental space are expected to grow faster than O&G, at approximately 15-20% CAGR ° D-R’s product technology platforms can be applied to serve both markets DR's izati
Slide 20: Fundamentals Drive Energy Infrastructure Investment
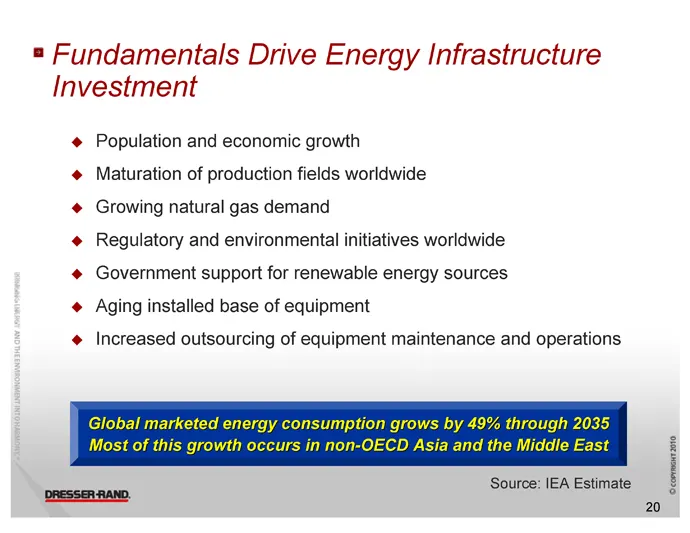
= Fundamentals Drive Energy Infrastructure Investment Population and economic growth of pi 1 fields Growing natural gas demand Government support for renewable energy sources ° . . o 9) y and i initiatives . Aging installed base of equipment + Increased outsourcing of equipment maintenance and opera
Slide 21: Oil & Gas Market Growth Drivers
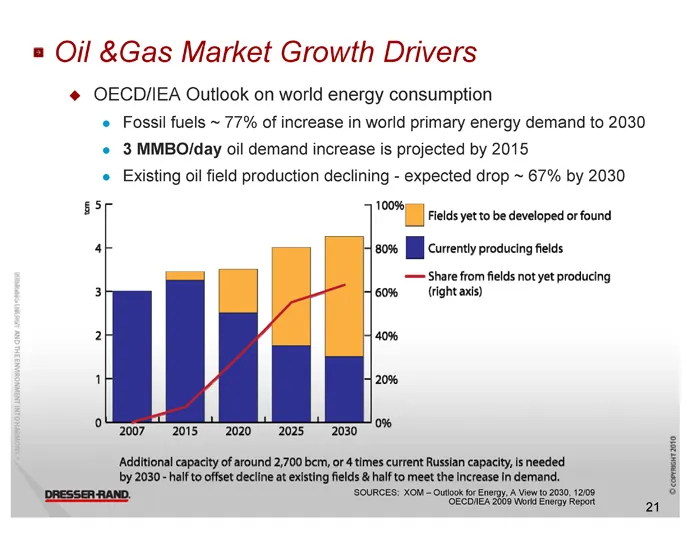
® Oil &Gas Market Growth Drivers ¢@ OECD/IEA Outlook on world energy consumption © Fossil fuels ~ 77% of increase in world primary energy demand to 2030 © 3 MMBO/day oil demand increase is projected by 2015 © Existing oil field production declining - expected drop ~ 67% by 2030 55 10086 [Dy elds yer
Slide 22: Growth Drivers - Energy Demand by Sector
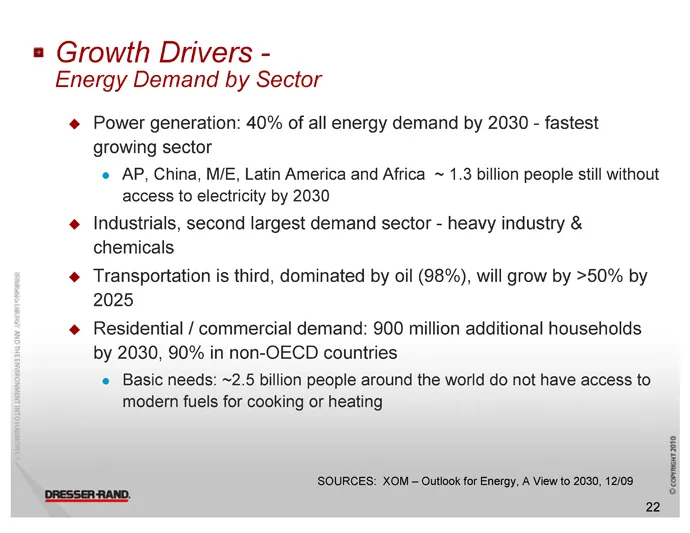
= Growth Drivers - Energy Demand by Sector ° Power generation: 40% of all energy demand by 2030 - fastest growing sector e AP, China, M/E, Latin America and Africa ~ 1.3 billion people still without access to electricity by 2030 Industrials, second largest demand sector - heavy industry & chemicals
Slide 23: Environmental Market Primary Growth Drivers
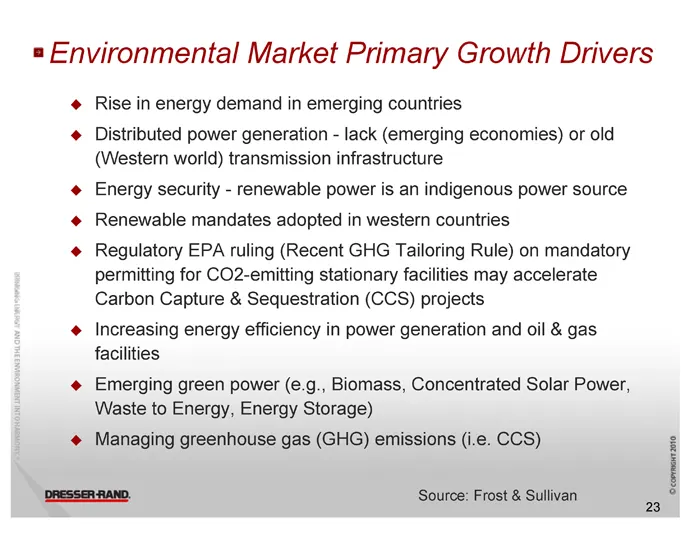
» Environmental Market Primary Growth Drivers ° ° ° ° Rise in energy demand in emerging countries Distributed power ion - lack i ies) or old (Western world) transmission infrastructure Energy security - renewable power is an indigenous power source Renewable mandates adopted in western countries Reg
Slide 24: Environmental Market Primary Growth Drivers
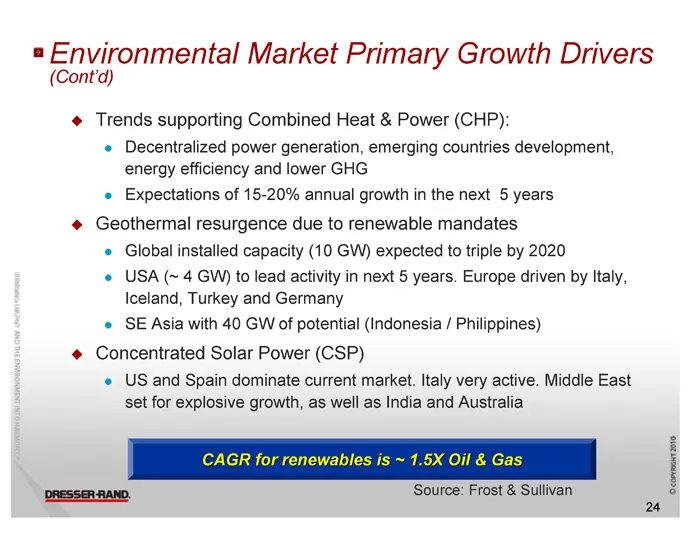
a fe onmental Market Primary Growth Drivers ¢ Trends supporting Combined Heat & Power (CHP): « Decentralized power generation, emerging countries development, energy efficiency and lower GHG « Expectations of 15-20% annual growth in the next 5 years ¢ Geothermal resurgence due to renewable mandates
Slide 25: Upstream - FPSO/LNG
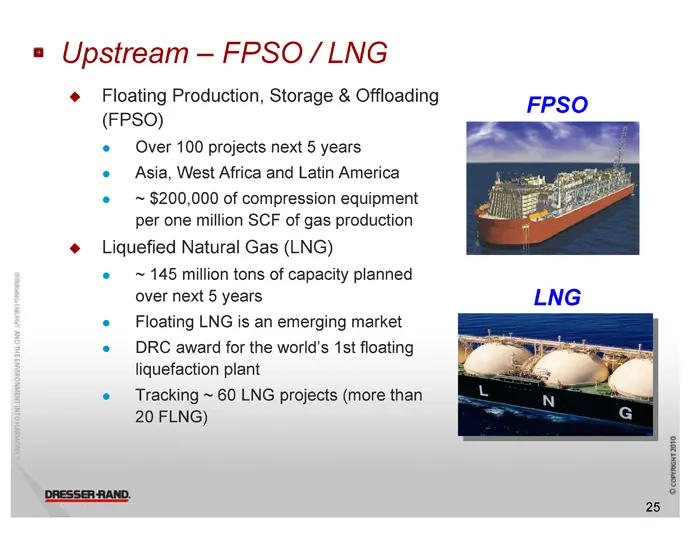
=» Upstream —-FPSO/LNG ¢@ Floating Production, Storage & Offloading (FPSO) e Over 100 projects next 5 years e Asia, West Africa and Latin America * ~ $200,000 of compression equipment per one million SCF of gas production ¢@ Liquefied Natural Gas (LNG) ® ~ 145 million tons of capacity planned over n
Slide 26: Midstream – Pipelines & Storage
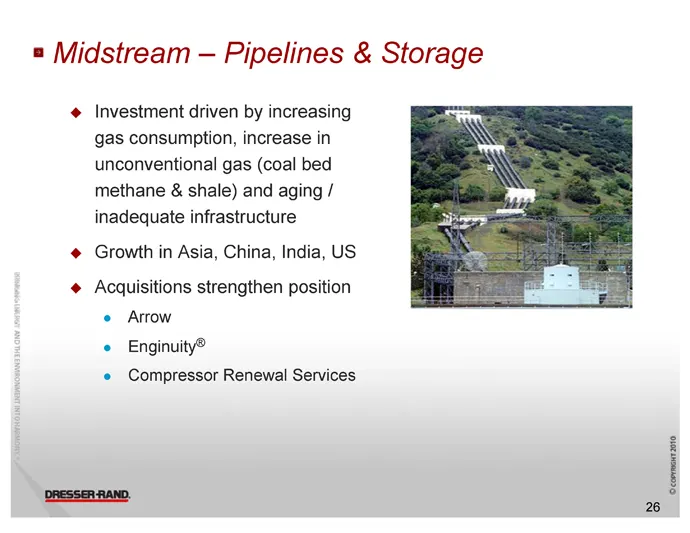
= Midstream — Pipelines & Storage @ Investment driven by increasing gas consumption, increase in unconventional gas (coal bed methane & shale) and aging / inadequate infrastructure Growth in Asia, China, India, US ¢ Acquisitions strengthen position ° Arrow © Enginuity® * Compressor Renewal Services
Slide 27: Downstream – Refining / Petro-Chemical
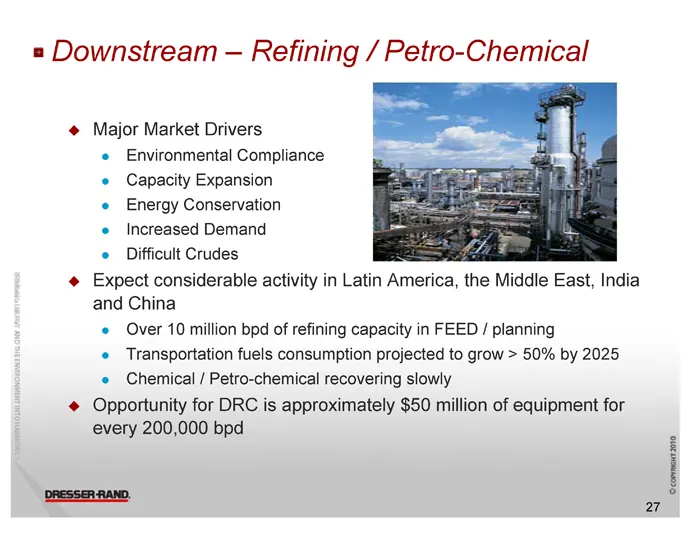
2 Downstream — Refining / Petro-Chemical @ Major Market Drivers | ; Environmental Compliance Capacity Expansion Energy Conservation Increased Demand Difficult Crudes « Expect considerable activity in Latin America, the Middle East, India and China © Over 10 million bpd of refining capacity in FEED /
Slide 28: Compressed Air Energy Storage (CAES)
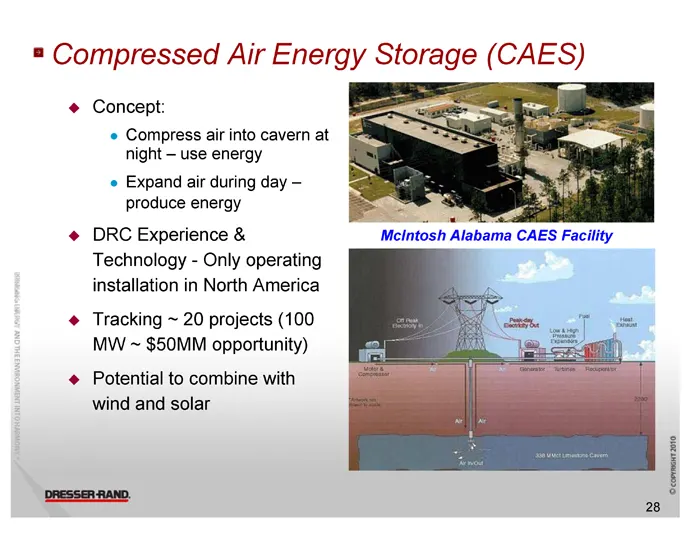
=" Compressed Air Energy Storage (' Concept: = ‘s Compress air into cavern at night - use energy Expand air during day - produce energy @ DRC Experience & Technology - Only operating installation in North America Tracking ~ 20 projects (100 MW ~ $50MM opportunity) Potential to combine with wind and
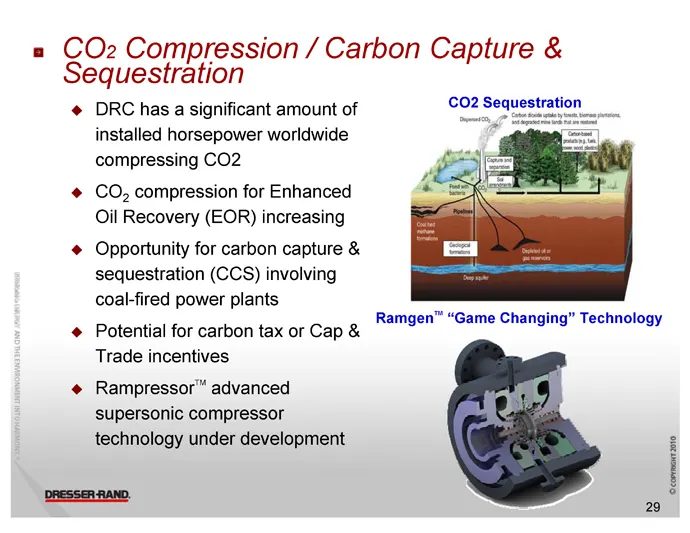
Slide 29: CO2 Compression / Carbon Capture & Sequestration
a COz Compression / Carbon Capture & Sequestration @ DRC has a significant amount of ba ei installed horsepower worldwide is compressing CO2 ° CO, compression for Enhanced Oil Recovery (EOR) increasing ° Opportunity for carbon capture & sequestration (CCS) involving coal-fired power plants Ramgen™ “
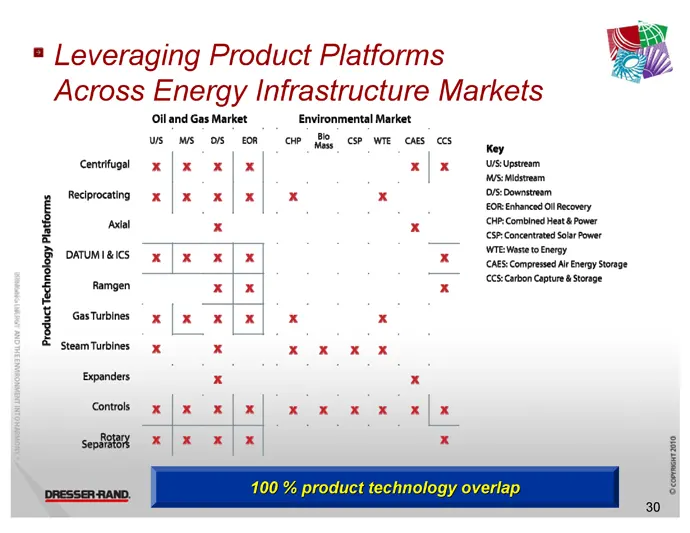
Slide 30: Leveraging Product Platforms Across Energy Infrastructure Markets
® Leveraging Product Platforms 3) Across Energy Infrastructure Markets ll and Gas Market Environmental Market a Cernig ox | x ox | x | a | ners Reciprocating ox |x x) xX) x x i : : = oa react f ovouo x] x a coten apt &Seage | Ramgen x| x x z % cums x |x x|x| x x E sentutres xk x x x Expanders x x co
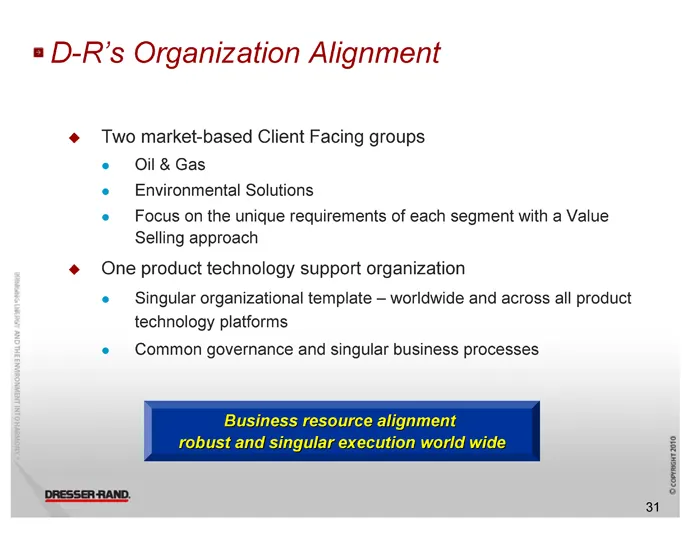
Slide 31: D-R's Organization Alignment
= D-R’s Organization Alignment ¢ Two market-based Client Facing groups e Oil & Gas « — Environmental Solutions « Focus on the unique requirements of each segment with a Value Selling approach One product technology support organization Singular organizational template - worldwide and across all prod
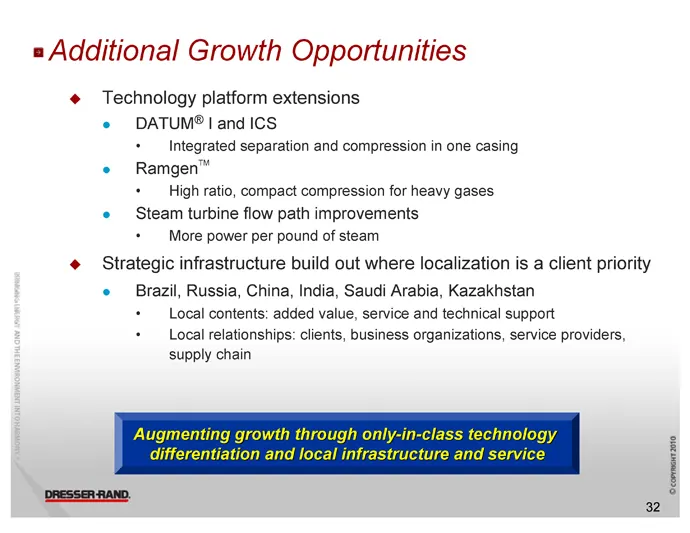
Slide 32: Additional Growth Opportunities
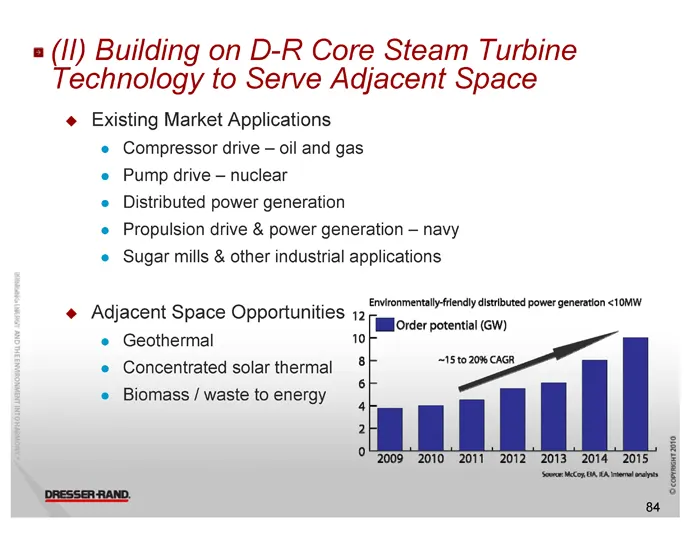
2 Additional Growth Opportunities ¢@ Technology platform extensions ¢ DATUM® | and ICS + Integrated separation and compression in one casing ° Ramgen™ + High ratio, compact compression for heavy gases Steam turbine flow path improvements + More power per pound of steam ¢ Strategic infrastructure bui
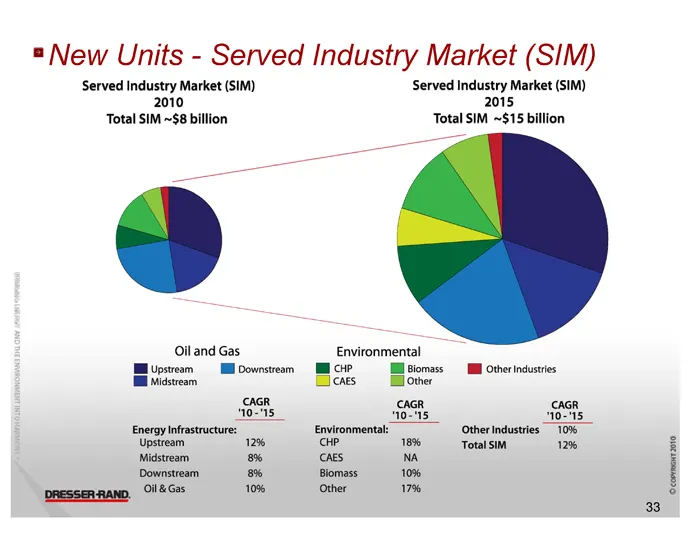
Slide 33: New Units - Served Industry Market (SIM)
= New Units - Served Industry Market (SIM) Served Industry Market (SIM) Served Industry Market (SIM) Total SIM ~$8 billion Total SIM ~$15 billion Oil and Gas Environmental Upstream Il Downstream lh Wl other industries Hi Midstream CAGR R 30-15 40-15 110-15 Energy Infrastructure: Environmental: Other
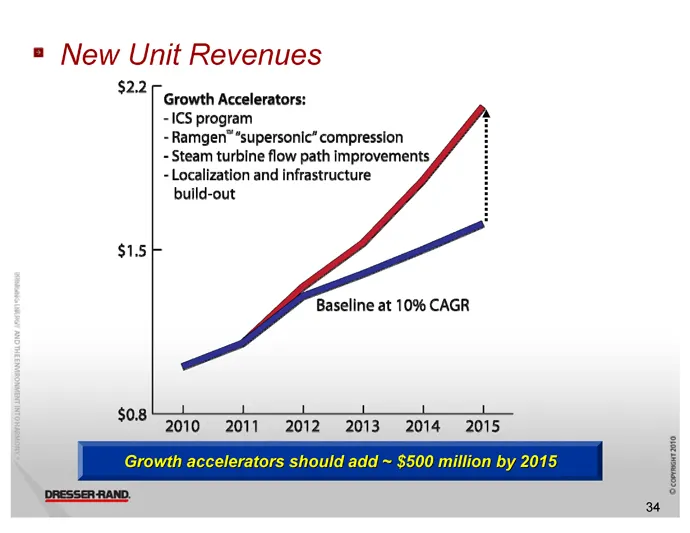
Slide 34: New Unit Revenues
=» New Unit Revenues $2.2 $1.5 $0.8 [ Growth Accelerators: ICS program -Ramgen”*supersonic” compression - Steam turbine flow path improvements Localization and infrastructure build-out Baseline at 10% CAGR 1 1 1 1 1 n 2010) «2011 «2012, 2013, 2014-2015 ‘cccrmmac 10
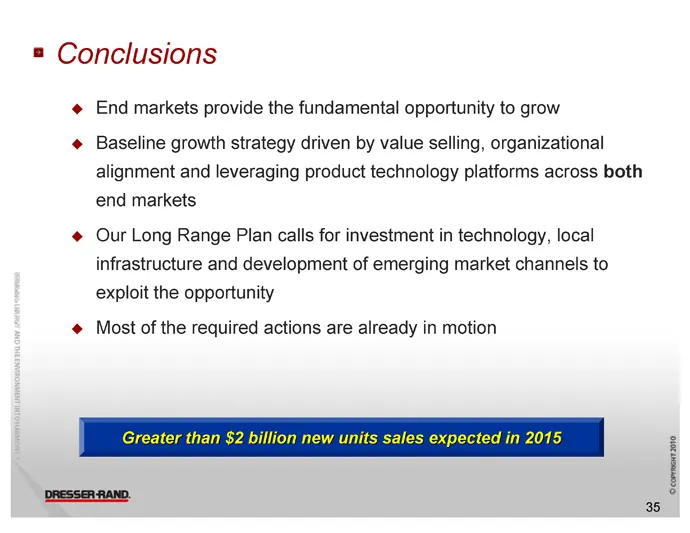
Slide 35: Conclusions
® Conclusions ¢ End markets provide the fundamental opportunity to grow ¢ Baseline growth strategy driven by value selling, organizational and Jing product platforms across both end markets ¢ Our Long Range Plan calls for investment in technology, local and It of ‘ging market channels to exploit the
Slide 36: Aftermarket
Aftermarket Luciano Mozzato Executive Vice President Services Worldwide
Slide 37: Summary
=Global Supplier of Energy Infrastructure Solutions Summary Base business growth at ~10% CAGR is sustainable and will deliver $1.6 billion in sales by 2015. Accelerated initiatives will deliver ~15% CAGR in excess of $2 billion by 2015. @ The key ongoing initiatives: © Continued focus on safety e “L
Slide 38: Global Supplier of Service Solutions
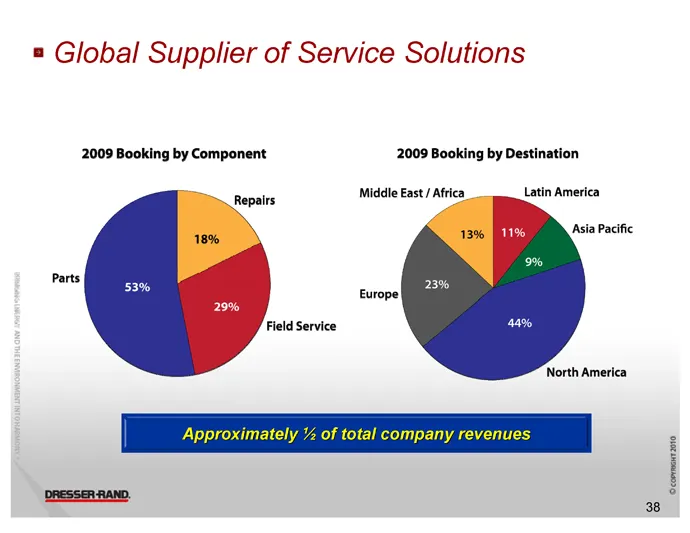
= Global Supplier of Service Solutions Field Service
Slide 39: Market Drivers
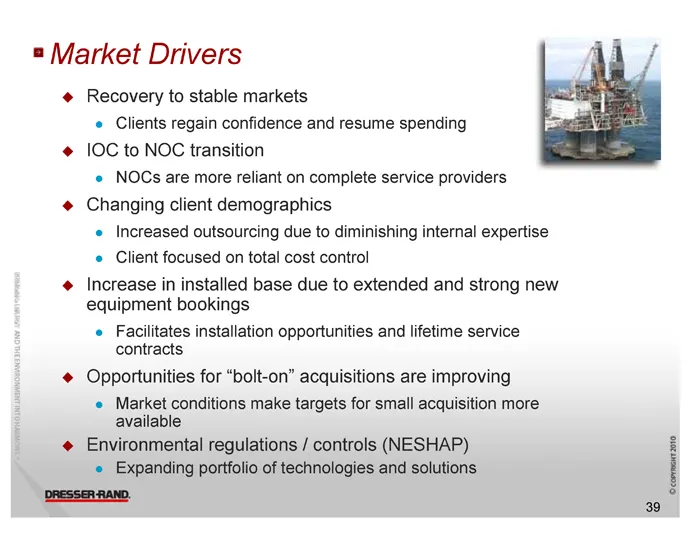
® Market Drivers @ Recovery to stable markets Clients regain confidence and resume spending IOC to NOC transition * NOCs are more reliant on complete service providers Changing client demographics * Increased outsourcing due to diminishing internal expertise * Client focused on total cost control In
Slide 40: Full Range of Services
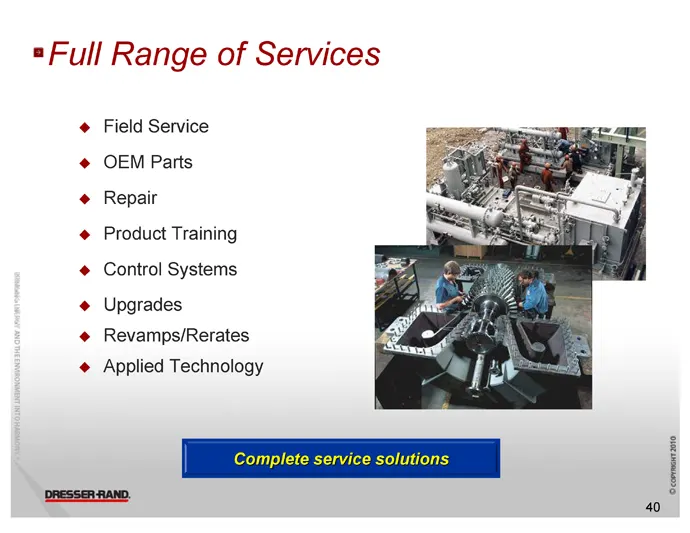
*Full Range of Services Field Service OEM Parts o°¢ + Repair Product Training Control Systems Upgrades Revamps/Rerates Applied Technology oo © © ‘cccrmmac 10
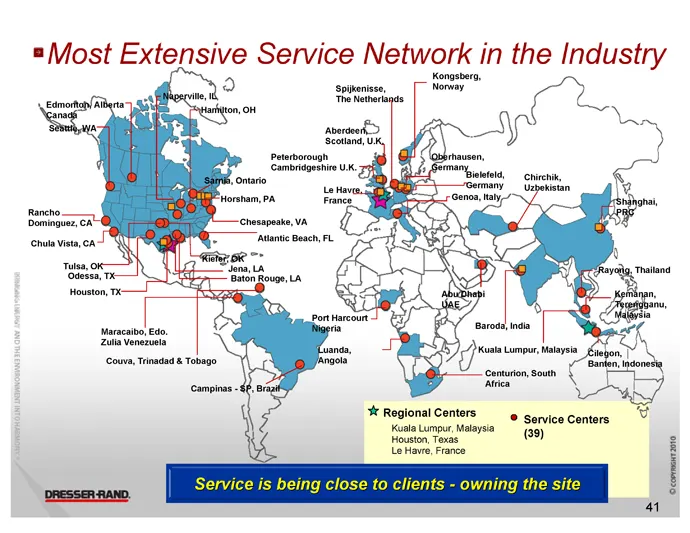
Slide 41: Most Extensive Service Network in the Industry
= Most Extensive Service Network in the Industry 3 pea Regional Centers Kuala Lumpur, Malaysia Houston, Texas UeHae, France © Service Centers (38)
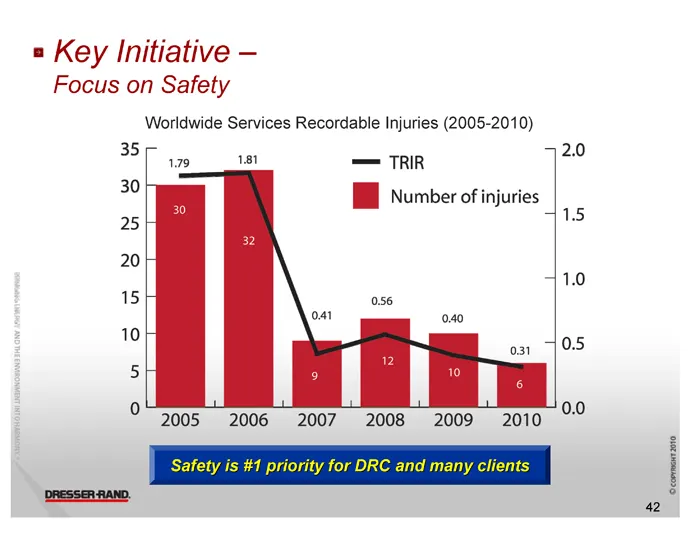
Slide 42: Key Initiative – Focus on Safety
» Key Initiative — Focus on Safety Worldwide Services Recordable Injuries (2005-2010) 35 == TRIR 30 |_| Number of injuries 2005 2006 2007 2008 2009 2010
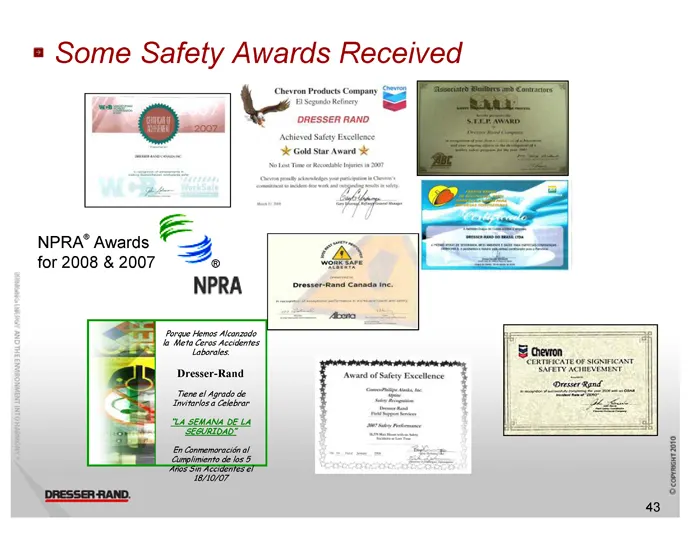
Slide 43: Some Safety Awards Received
= Some Safety Awards Received NPRA® Awards for 2008 & 2007 EF ay NPRA comer onessen nano
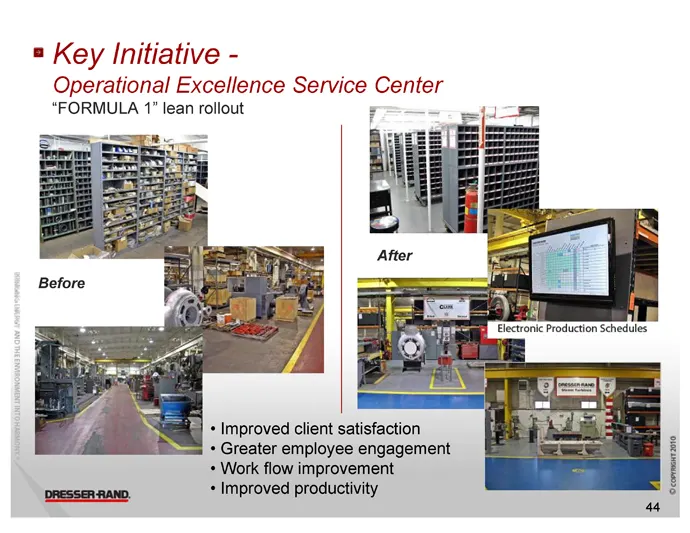
Slide 44: Key Initiative - Operational Excellence Service Center
® Key Initiative - Operational Excellence Service Center “FORMULA 1” lean rollout + Improved client satisfaction + Greater employee engagement + Work flow improvement * Improved productivity
Slide 45: Key Initiative - Operational Excellence Service Center
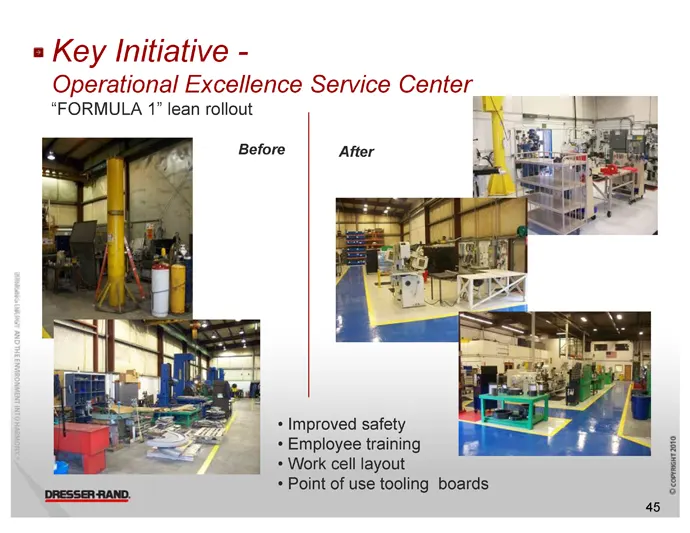
» Key Initiative - Operational Excellence Service Center “FORMULA 1” lean rollout Before + Improved safety + Employee training | + Work cell layout + Point of use tooling boards ‘cccrmmac 10
Slide 46: Key Initiative – Training
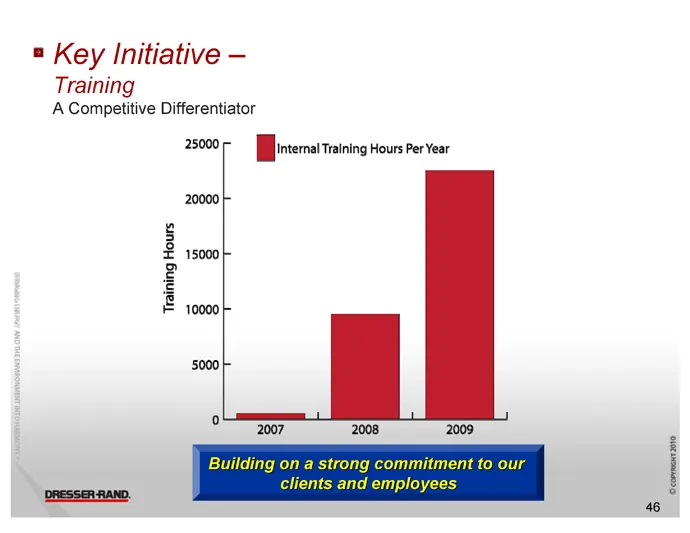
® Key Initiative — Training A Competitive Differentiator | | Internal Training Hours Per Year Sccomanr 3019
Slide 47: Key Initiative – Employee Training
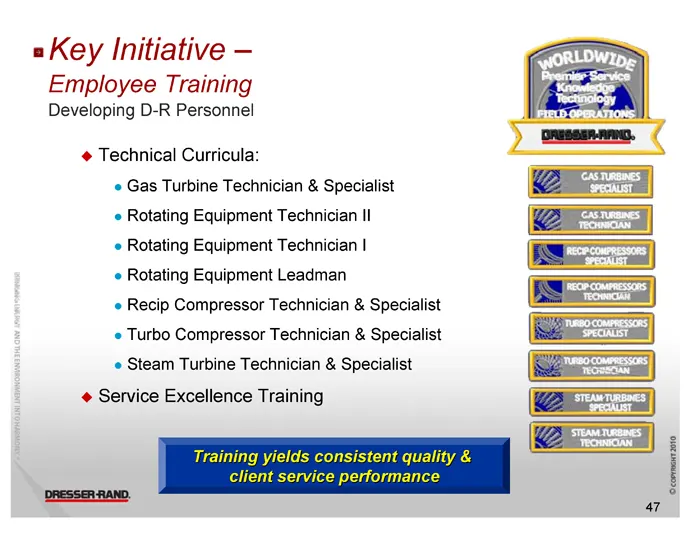
a Key Initiative — Employee Training Developing D-R Personnel Technical Curricula: e Gas Turbine Technician & Specialist Z__ eens Rotating Equipment Technician II « Rotating Equipment Technician | e Rotating Equipment Leadman Ror OUESSOS “Recip Compressor Techrician& Specaist «Bal Turbo Compressor T
Slide 48: Key Initiative - Applied Technology (Non-OEM)
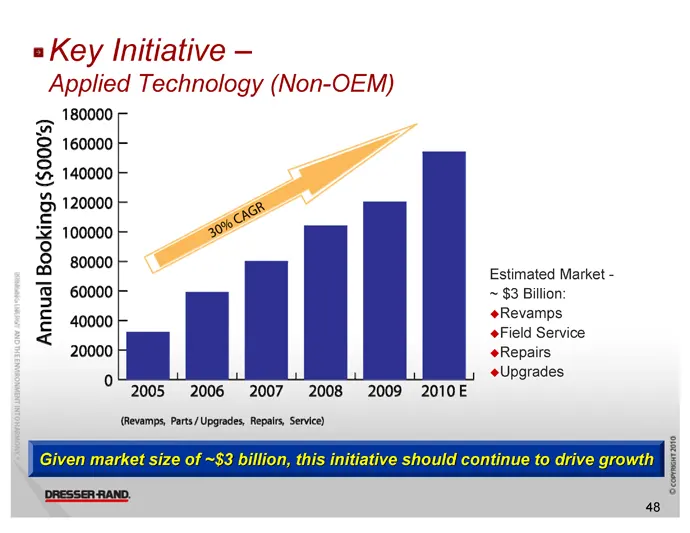
=Key Initiative - Applied Technology (Non-OEM) 180000 160000 140000 120000 100000 80000 60000 40000 20000 0 Annual Bookings ($000’s) 2007 +2008 2009 2010E (evamps, Parts/ Upgrades, Repairs, Service) Estimated Market - ~ $3 Billion: ‘Revamps ‘Field Service ‘Repairs ‘Upgrades
Slide 49: Key Initiative - Expansion of Gas Turbine Repair Capacity
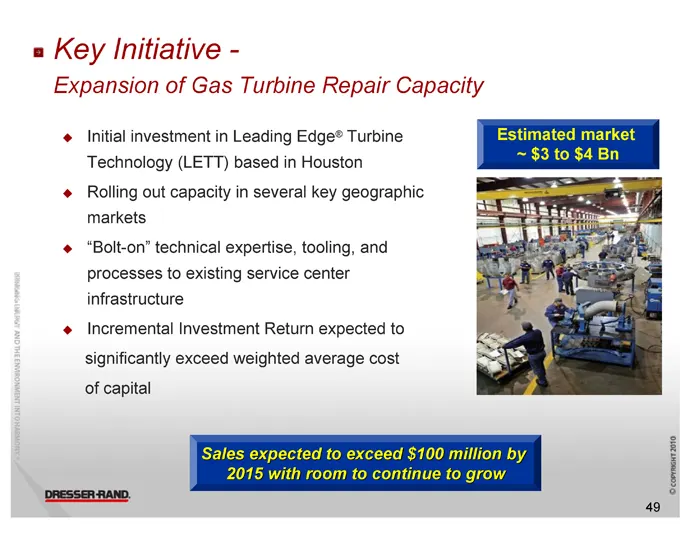
a Key Initiative - Expansion of Gas Turbine Repair Capacity Initial investment in Leading Edge® Turbine Technology (LETT) based in Houston Rolling out capacity in several key geographic markets ° . “Bolt-on” technical expertise, tooling, and processes to existing service center infrastructure ° Incr
Slide 50: Key Initiative - Expansion Service Footprint
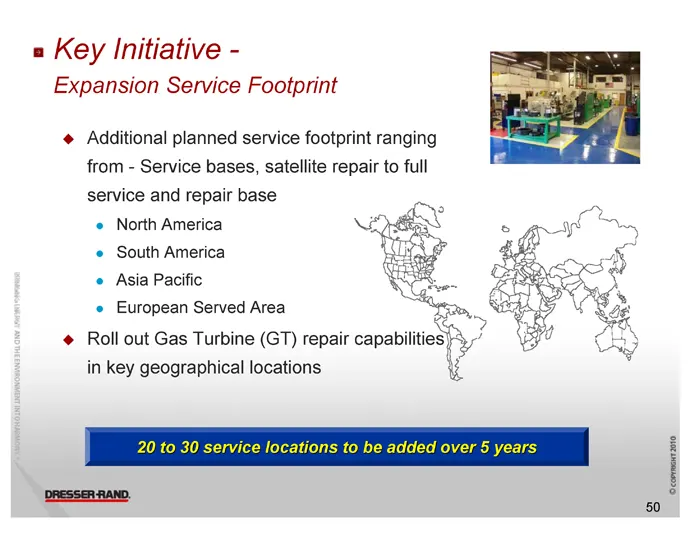
a Key Initiative - Expansion Service Footprint Additional planned service footprint ranging from - Service bases, satellite repair to full service and repair base North America South America Asia Pacific © European Served Area ¢ Roll out Gas Turbine (GT) repair capabilities in key geographical locat
Slide 51: Key Initiatives Summary - Overall Share Analysis
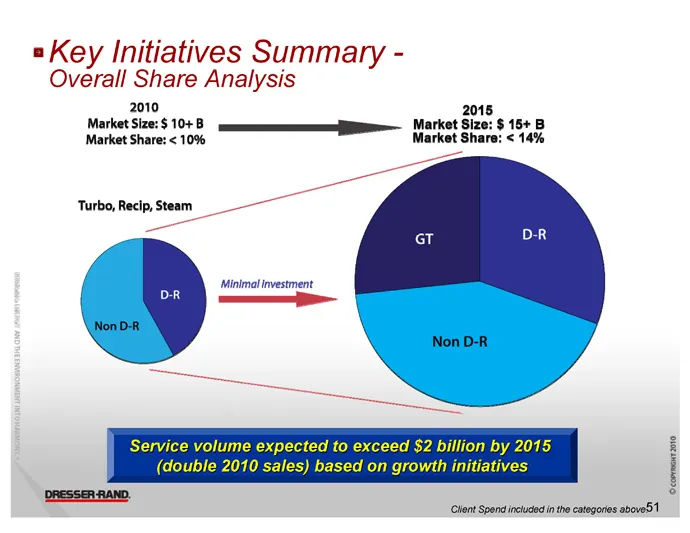
=Key Initiatives Summary - Overall Share Analysis 2010 201: 5 10+B $ 15+ B Market Share: < 10% Market Share: < 14% Turbo, Recip, Steam ‘Minimal investment — SS | i oon cn Clint Spend iced inthe categores above5'1
Slide 52: Aftermarket Revenues
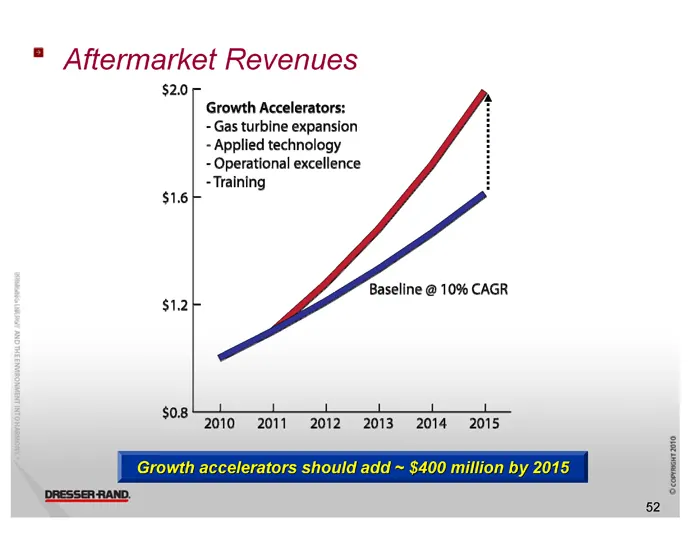
® Aftermarket Revenues $207 $1.65 $12 Growth Accelerators: ~ Gas turbine expansion - Applied technology - Operational excellence =Training Baseline @ 10% CAGR 1 1 1 1 1 1 2010 ©2011 «2012 «2013-2014 2015 ‘cccrmmac 10
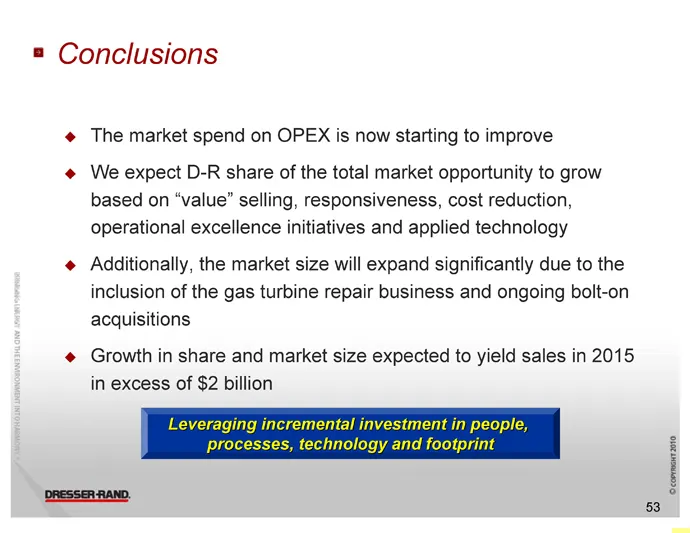
Slide 53: Conclusions
® Conclusions ° ° ° ° The market spend on OPEX is now starting to improve We expect D-R share of the total market opportunity to grow based on “value” selling, responsiveness, cost reduction, operational excellence initiatives and applied technology Additionally, the market size will expand signific
Slide 54: Infrastructure Initiatives
Infrastructure Initiatives Jerry Walker Vice President and General Manager, Americas Operations & Asia Pacific Operations Nicoletta Giadrossi Vice President and General Manager ope, Middle East & Africa Operations
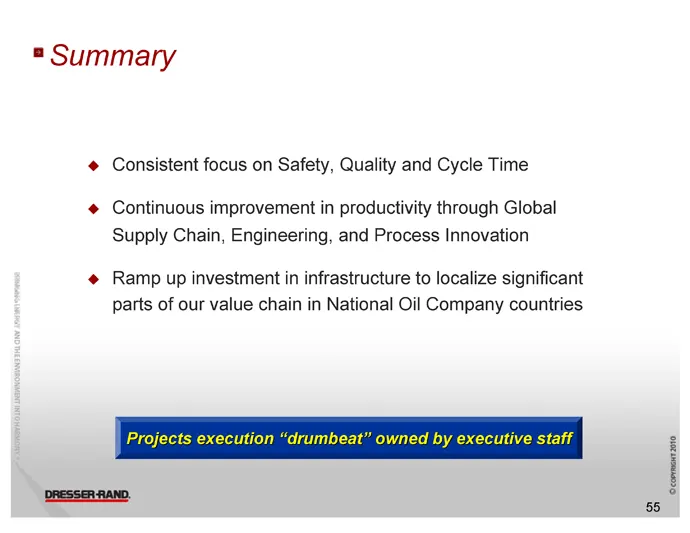
Slide 55: Summary
=" Summary ¢ Consistent focus on Safety, Quality and Cycle Time Continuous improvement in productivity through Global Supply Chain, Engineering, and Process Innovation Ramp up investment in infrastructure to localize significant parts of our value chain in National Oil Company countries ‘cccrmmac 10
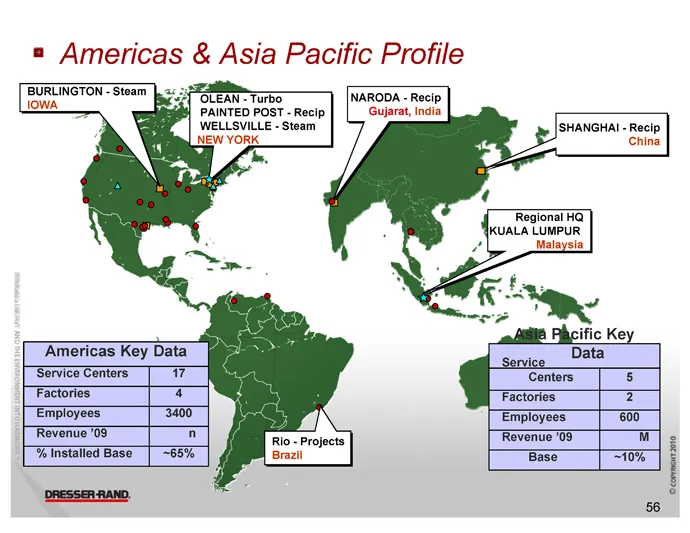
Slide 56: Americas & Asia Pacific Profile
= Americas & Asia Pacific Profile BURLINGTON - Steam IOWA, ‘OLEAN - Turbo PAINTED POST - Recip WELLSVILLE - Steam New YOR os Americas Key Data ‘Service Centers Factories 4 ‘Employees 3400 | ‘Employees’ 600 Revenue "09 7 Rio - Projects [Revenue "0s Wi % Installed Base ~65% Brazil [ Base ~10% ‘occrrma
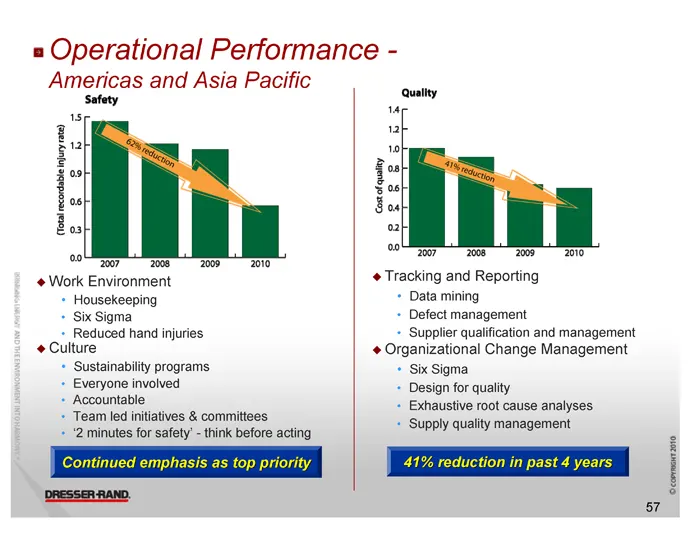
Slide 57: Operational Performance - Americas and Asia Pacific
» Operational Performance - Americas and Asia Pacific Safety + Reduced hand injuries Culture + Sustainability programs + Everyone involved * Accountable + Team led initiatives & committees + '2 minutes for safety’ - think before acting Quality 14 Sos Sua a 07 2008 2009 2010 ¢ Tracking and Reporting
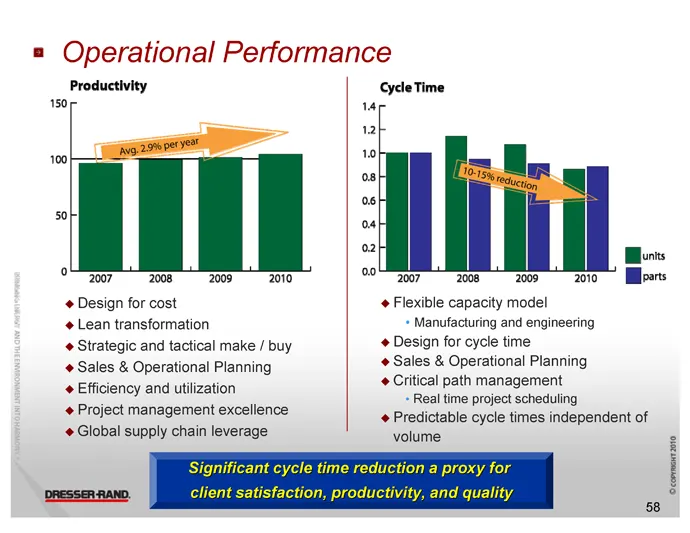
Slide 58: Operational Performance
= Operational Performance Productivity 150 on 2007 2008 Design for cost ‘Lean transformation ‘Strategic and tactical make / buy ‘# Sales & Operational Planning # Efficiency and utilization ‘Project management excellence ‘Global supply chain leverage Cycle Time ons 2007 2008 2009 Hors Flexible capaci
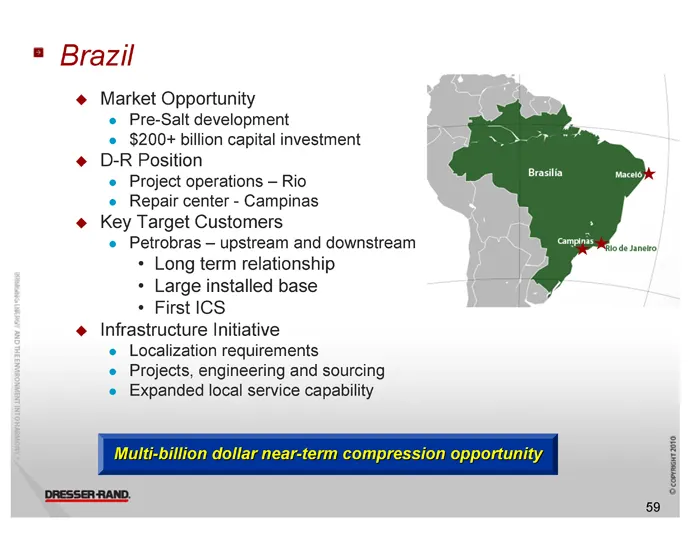
Slide 59: Brazil
= Brazil ¢ Market Opportunity e Pre-Salt development $200+ billion capital investment @ D-R Position ‘Project operations — Rio ‘Repair center - Campinas @ Key Target Customers ‘© Petrobras — upstream and downstream + Long term relationship + Large installed base + First ICS Infrastructure Initiative
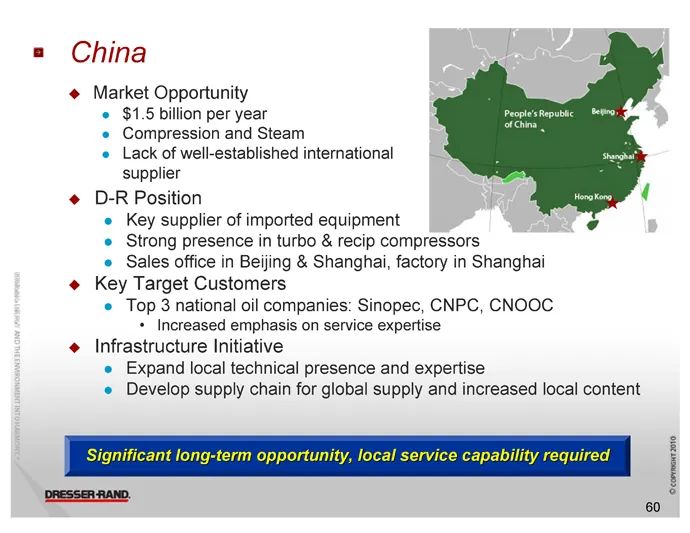
Slide 60: China
China ° ° ° ° Market Opportunity © $1.5 billion per year Compression and Steam Lack of well-established international supplier D-R Position e Key supplier of imported equipment e Strong presence in turbo & recip compressors e Sales office in Beijing & Shanghai, factory in Shanghai Key Target Custome
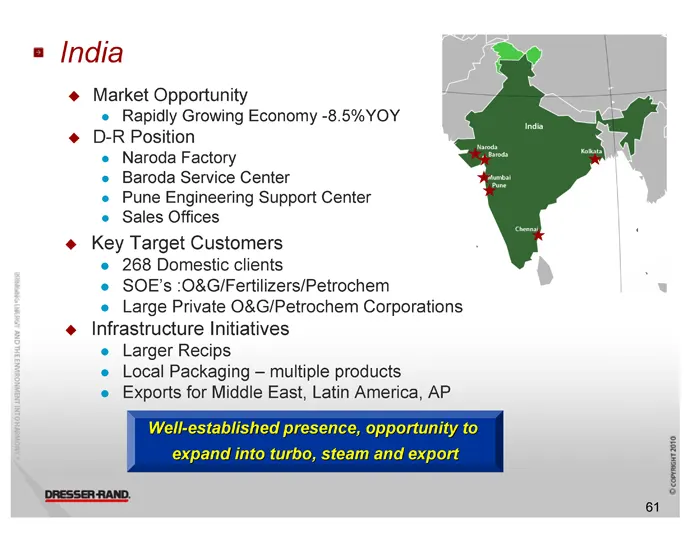
Slide 61: India
= India ¢ Market Opportunity Rapidly Growing Economy -8.5% YOY @ D-R Position * Naroda Factory « Baroda Service Center Pune Engineering Support Center e Sales Offices @ Key Target Customers 268 Domestic clients e SOE’s :0&G/Fertilizers/Petrochem e Large Private O&G/Petrochem Corporations @ Infrastru
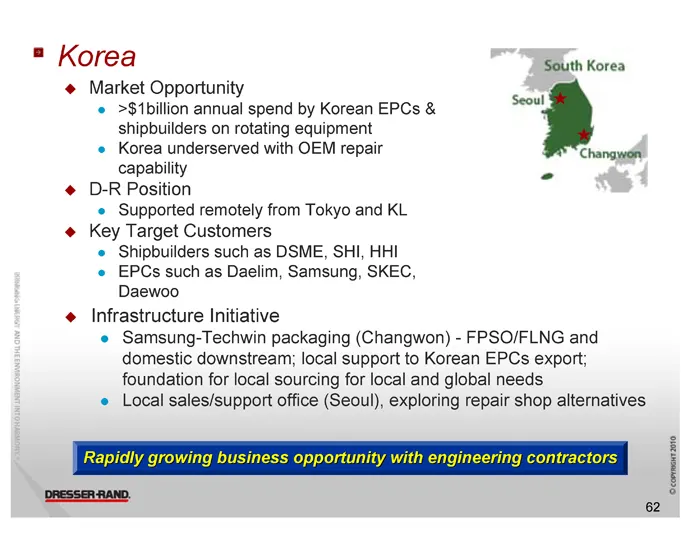
Slide 62: South Korea
=" Korea South Korea Market Opportunity ¢ >$tbillion annual spend by Korean EPCs & shipbuilders on rotating equipment e Korea underserved with OEM repair capability @ D-R Position e Supported remotely from Tokyo and KL @ Key Target Customers e Shipbuilders such as DSME, SHI, HHI « EPCs such as Daeli
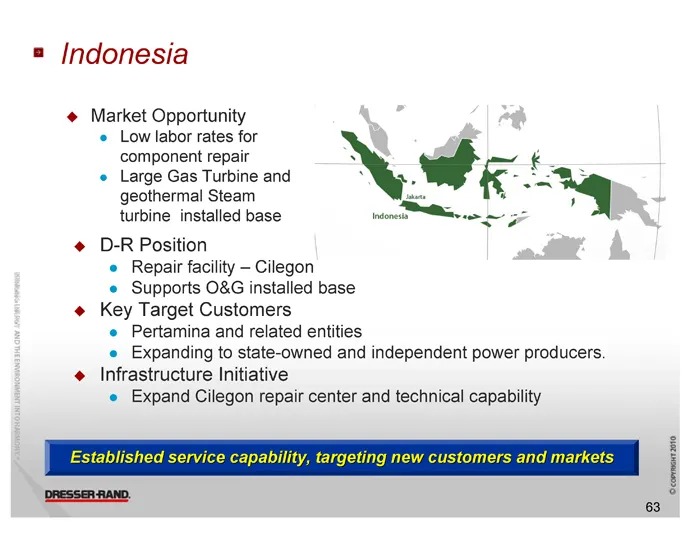
Slide 63: Indonesia
= Indonesia Market Opportunity « Low labor rates for component repair a Large Gas Turbine and . geothermal Steam turbine installed base @ D-R Position e Repair facility — Cilegon Supports O&G installed base Key Target Customers e Pertamina and related entities to stat d and it power ° Infrastructure
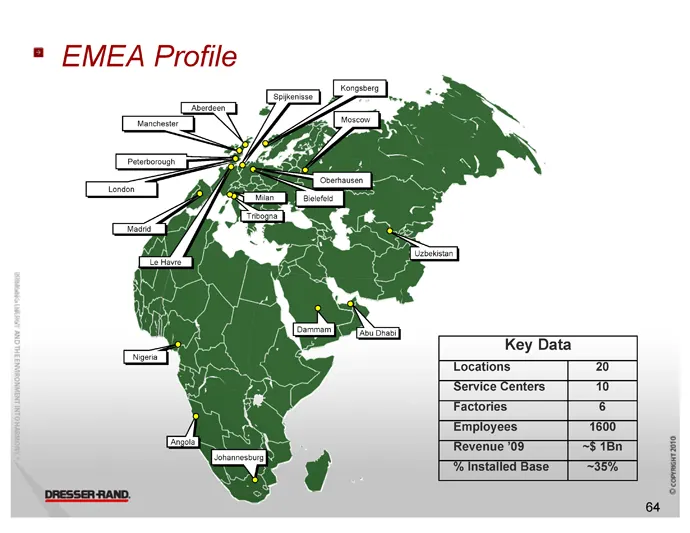
Slide 64: EMEA Profile
=" EMEA Profile Key Data Locations jarvice Centers Factories Employees Revenue 0S Thstalled Base ‘cccrmmac 10
Slide 65: Operational Performance - EMEA
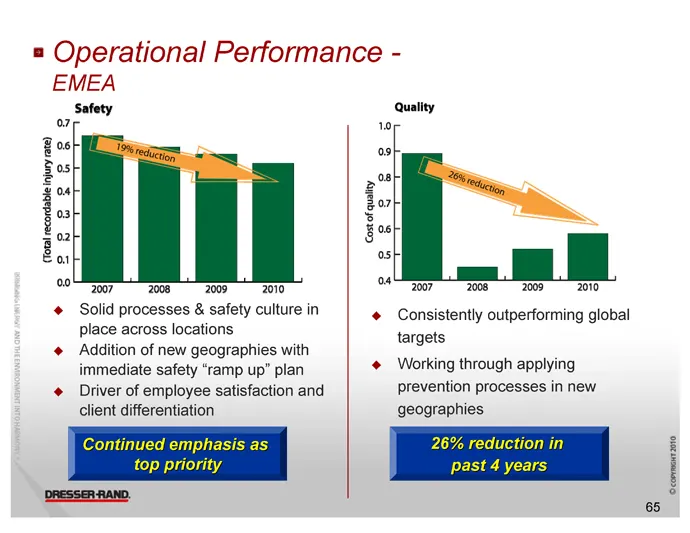
® Operational Performance - EMEA Safety °7 Jos Bos = oa i: Fo Ba corm7007- 2008-2009 «2010 Solid processes & safety culture in place across locations Addition of new geographies with immediate safety “ramp up” plan Driver of employee satisfaction and client differentiation Quality ry oat WOOT 2008 2
Slide 66: Operational Performance - EMEA
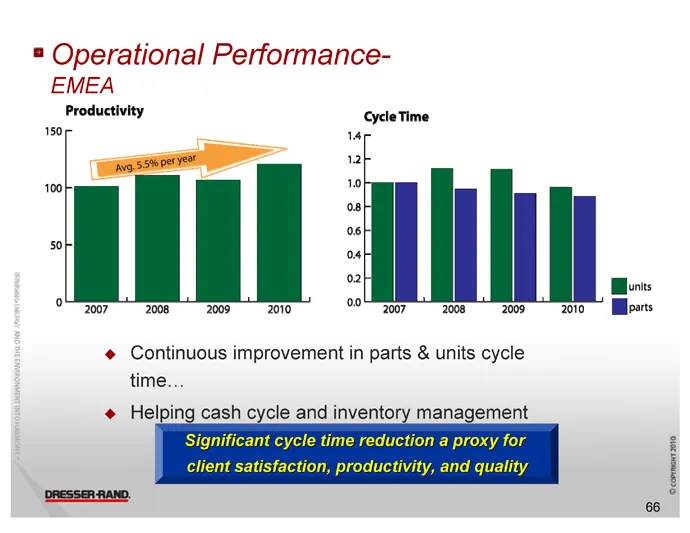
® Operational Performance- EMEA Productivity cycle Time 150 Hons 2010 Mbpars 2010 ¢ Continuous improvement in parts & units cycle time... @ Helping cash cycle and inventory management ‘cccrmmac 10
Slide 67: Kazakhstan
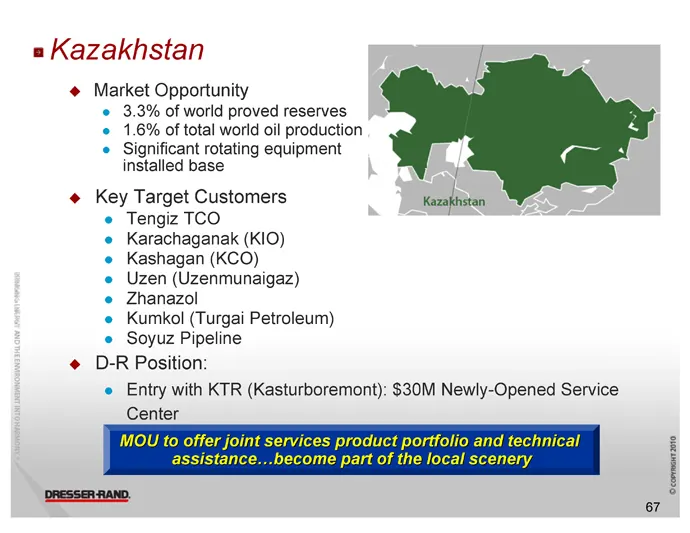
a Kazakhstan @ Market Opportunity 3.3% of world proved reserves © 1.6% of total world oil production © Significant rotating equipment installed base ! @ Key Target Customers Kazan Tengiz TCO Karachaganak (KIO) Kashagan (KCO) Uzen (Uzenmunaigaz) . . . Zhanazol Kumkol (Turgai Petroleum) Soyuz Pipeline
Slide 68: Kingdom of Saudi Arabia
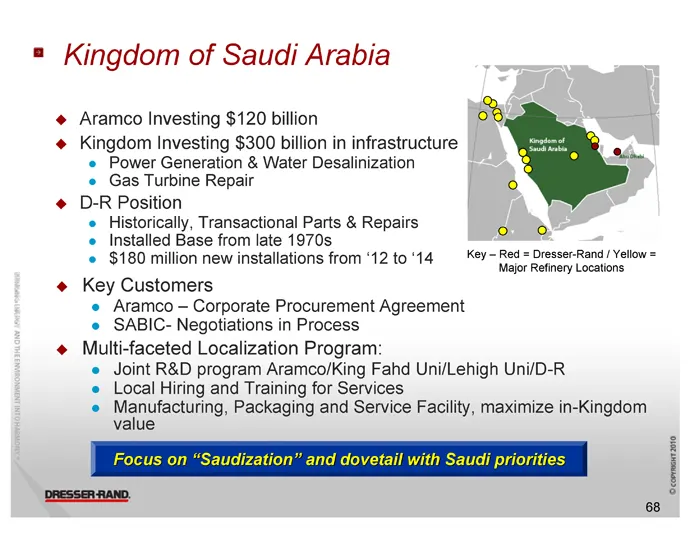
= Kingdom of Saudi Arabia oe Aramco Investing $120 billion Kingdom Investing $300 billion in infrastructure Power Generation & Water Desalinization Gas Turbine Repair ° @ D-R Position e Historically, Transactional Parts & Repairs oO e Installed Base from late 1970s e $180 million new installations f
Slide 69: Angola
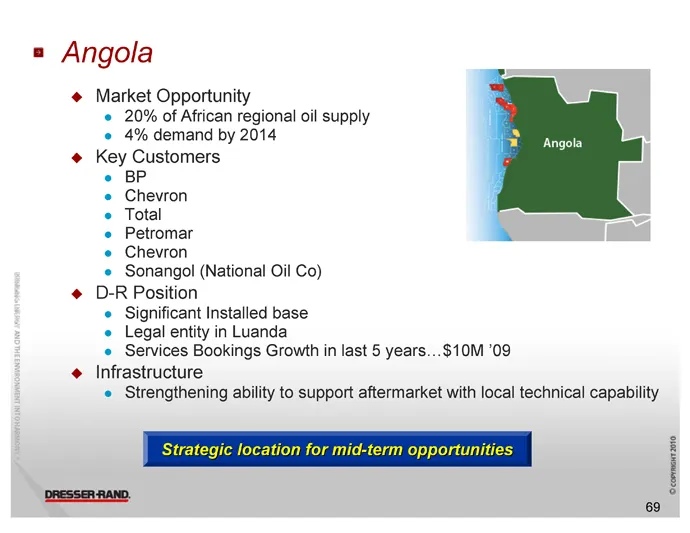
= Angola ¢@ Market Opportunity ¢ 20% of African regional oil supply © 4% demand by 2014 @ Key Customers « BP Chevron fi Total | Petromar Chevron Sonangol (National Oil Co) @ D-R Position « Significant Installed base « Legal entity in Luanda « Services Bookings Growth in last 5 years...$10M '09 @ Inf
Slide 70: SubSahara Africa
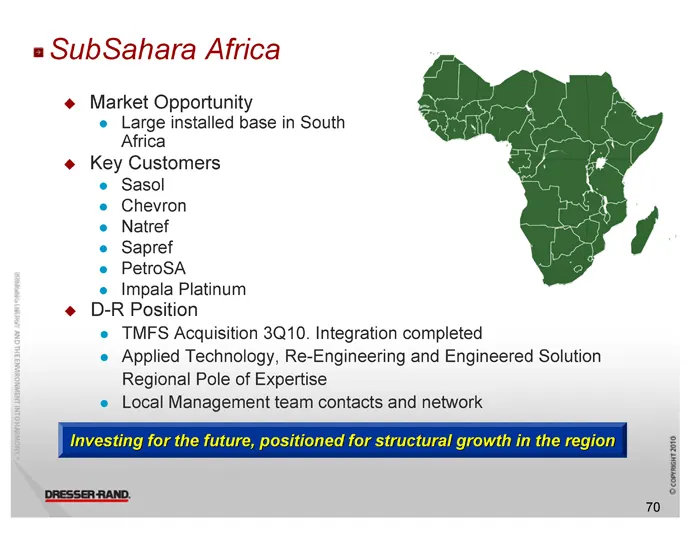
a SubSahara Africa ¢@ Market Opportunity e Large installed base in South rica Key Customers e Sasol e Chevron e Natref © Sapref e PetroSA Impala Platinum @ D-R Position e TMFS Acquisition 3Q10. © Applied T Ri Regional Pole of Expertise e Local Management team contacts and network and Solution ‘cccrm
Slide 71: Conclusion
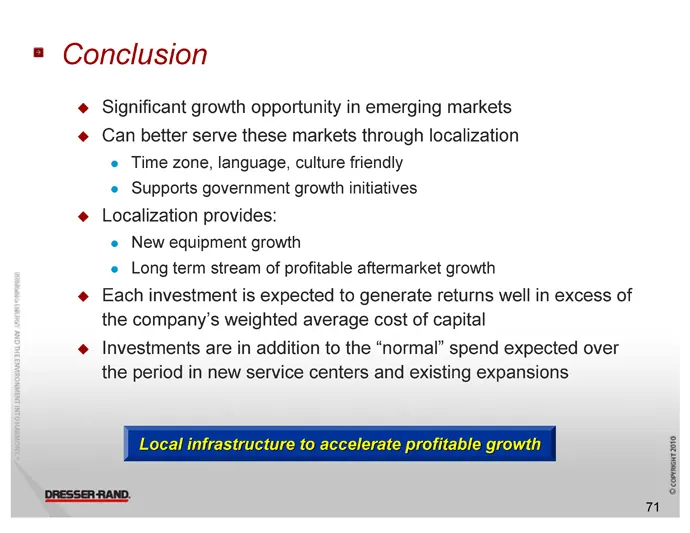
= Conclusion ° Significant growth opportunity in emerging markets Can better serve these markets through localization Time zone, language, culture friendly ¢ Supports government growth initiatives Localization provides: ¢ New equipment growth « Long term stream of profitable aftermarket growth Each
Slide 72: Investment in Technology for Accelerated Growth
MENT INTOH, Investment in Technology for Accelerated Growth Chris Rossi Vice President Technology and Business Development
Slide 73: Summary
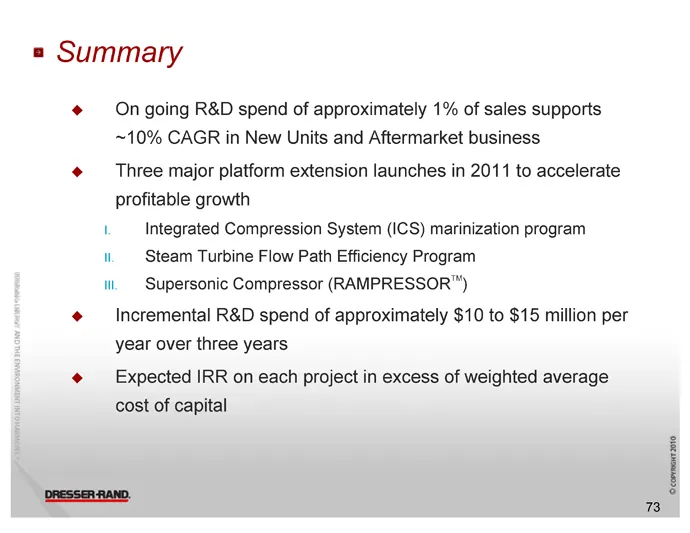
=» Summary @ Ongoing R&D spend of approximately 1% of sales supports ~10% CAGR in New Units and Aftermarket business Three major platform extension launches in 2011 to accelerate profitable growth | Integrated Compression System (ICS) marinization program U. Steam Turbine Flow Path Efficiency Progra
Slide 74: Technology Platform Build out for Accelerated Growth
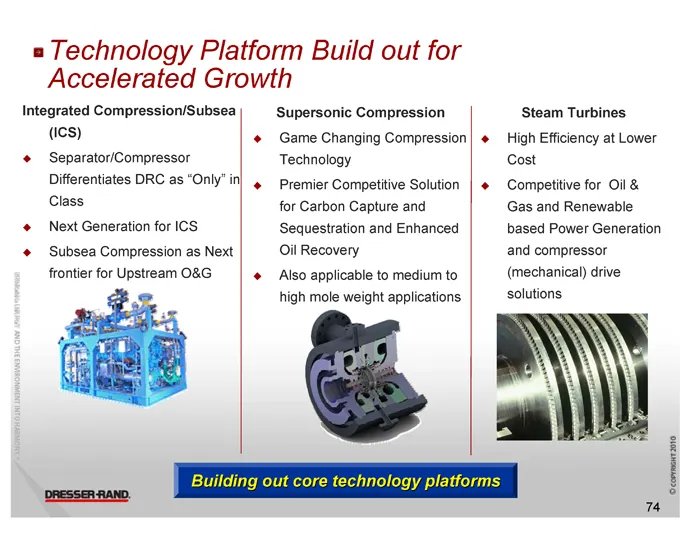
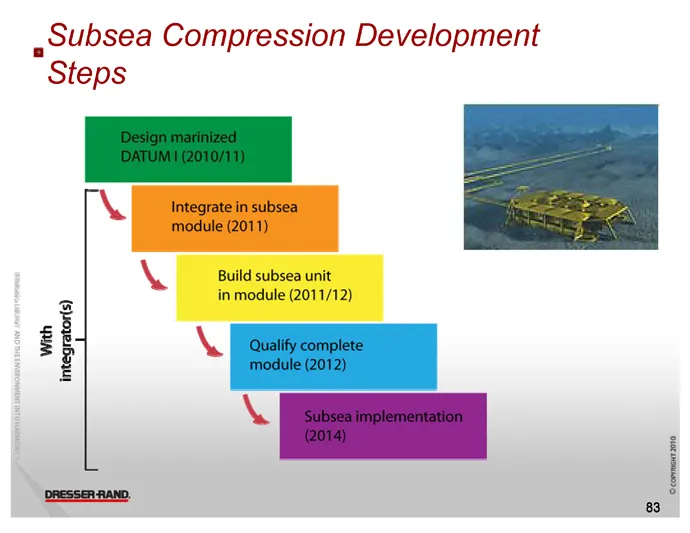
= Technology Platform Build out for Accelerated Growth Integrated Supersonic (ics) Game Changing Compression @ Separator/Compressor Technology Differentiates DRC as “Only in| , Premier Competitive Solution Class for Carbon Capture and ‘Next Generation for ICS Sequestration and Enhanced Subsea Compre
Slide 75: Technology Build out R&D Spending
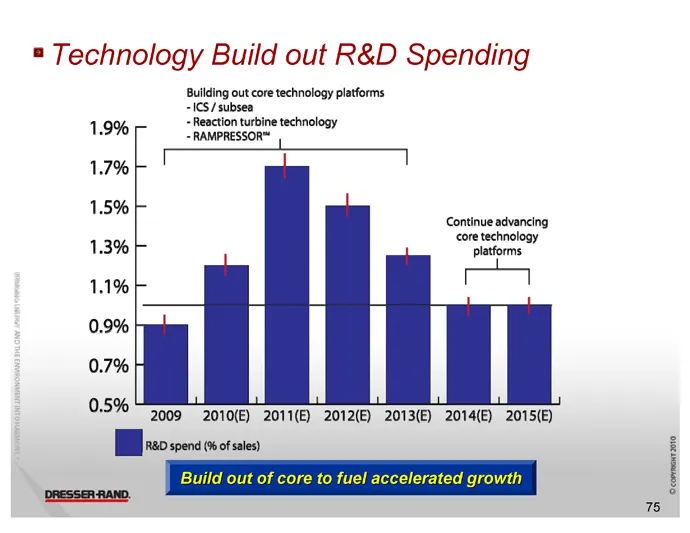
® Technology Build out R&D Spending Building out core technology platforms / subsea Reaction turbine technology RAMPRESSOR" Continue advancing core technology platforms 2009 © 2010(E) 2011(E) 2012(E) 2013(E) 2014(E) 2015(E) DB x0 sence of sien
Slide 76: Integrated Compression System (ICS) - Concept
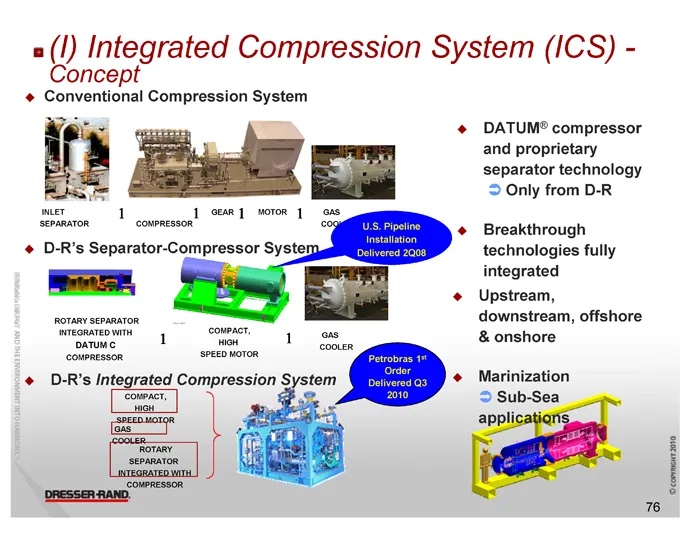
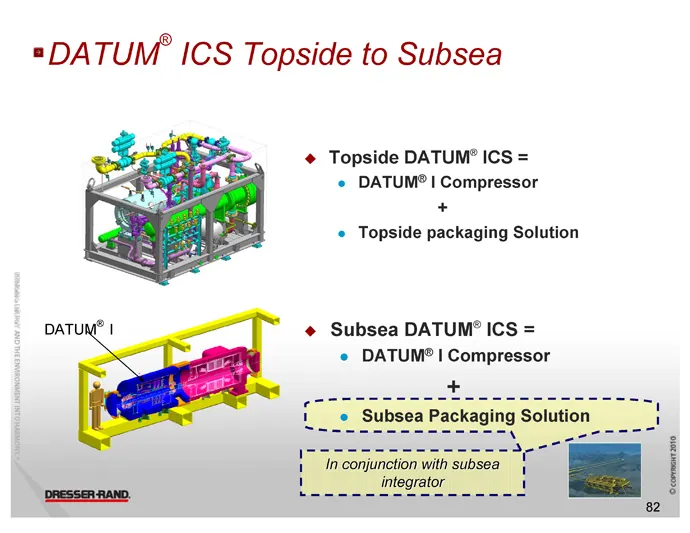
2 () picorated Compression System (ICS) - Concept # Conventional Compression System V8 Hal op 1 ean | motor J DATUM® compressor and proprietary separator technology 2 Only from D-R ° scramaron |! cournesson Breakthrough ¢ D-R’s Separator-Compressor Syste! technologies fully ee, integrated ROTARY SEP
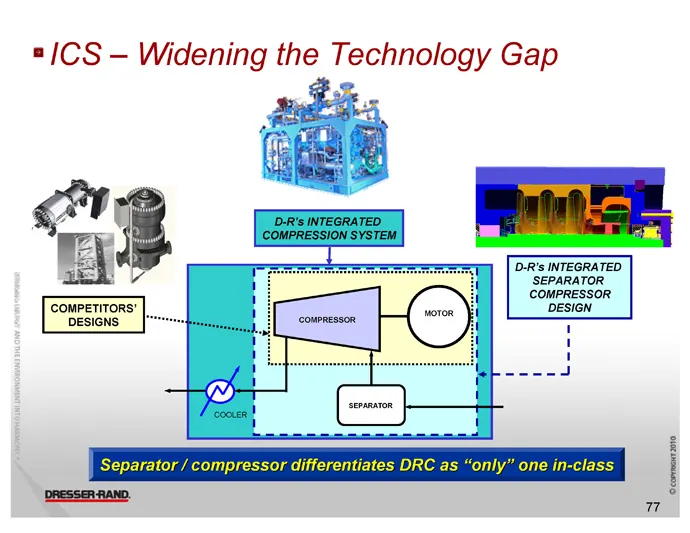
Slide 77
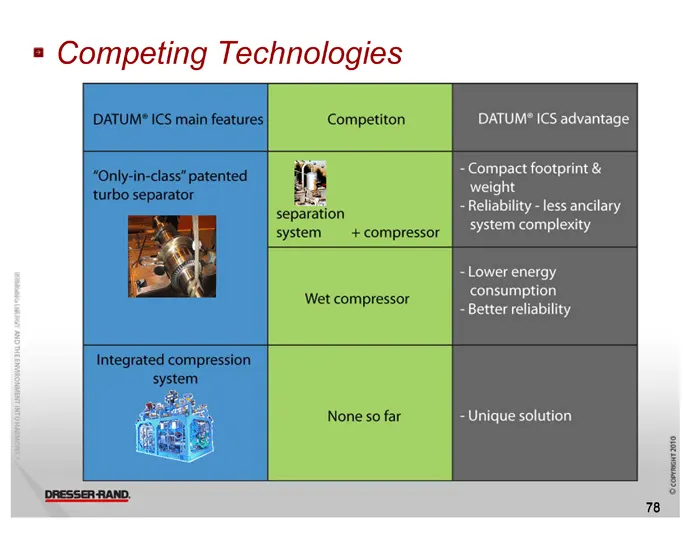
Slide 78: Competing Technologies
=" Competing Technologies DATUM? ICS advantage - Compact footprint & - less ancilary system complexity - Lower energy consumption. - Better reliability - Unique solution
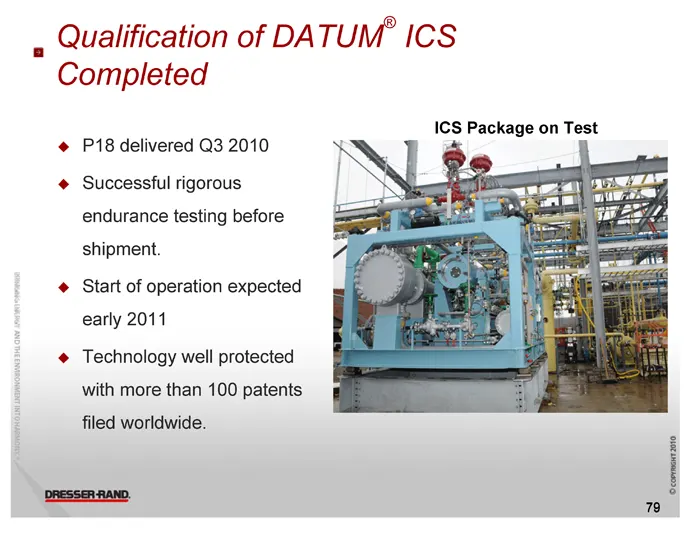
Slide 79: Qualification of DATUM ICS
, Qualification of DATUM? ICS Completed ICS Package on Test P18 delivered Q3 2010 ° ° Successful rigorous endurance testing before shipment. ° Start of operation expected early 2011 ° Technology well protected with more than 100 patents filed worldwide.
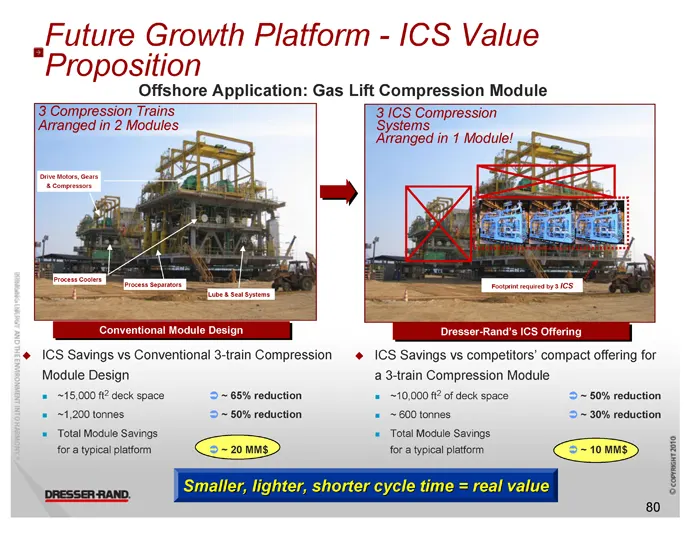
Slide 80: Future Growth Platform - ICS Value Proposition
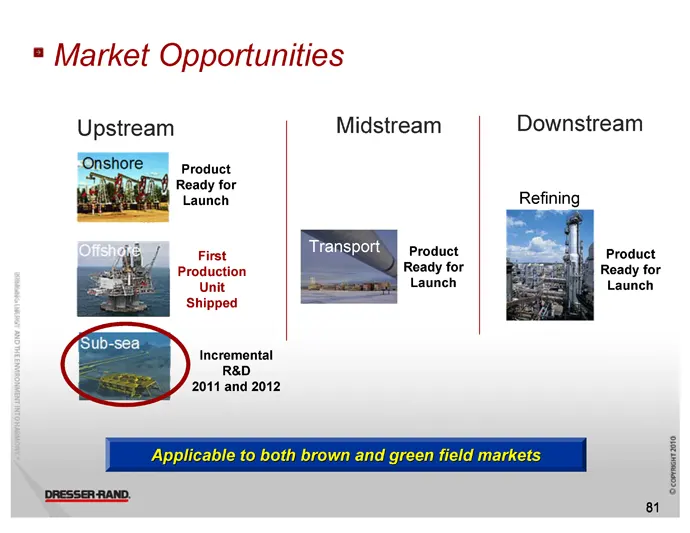
Future Growth Platform - ICS Value Proposition Offshore jicati Gas Lift C ion Module for ‘Conventional Module Design : # ICS Savings vs Conventional 3-train C ICS Savings tit Module Design a 3-train Compression Module = ~15,000 f? deck space ‘2 ~ 68% reduction 1+ ~10,000#? of deck space 2 ~ 50% redu
Slide 81
Slide 82
Slide 83
Slide 84
Slide 85
Slide 86
Slide 87
Slide 88
Slide 89
Slide 90
Slide 91
Slide 92
Slide 93
Slide 94
Slide 95
Slide 96
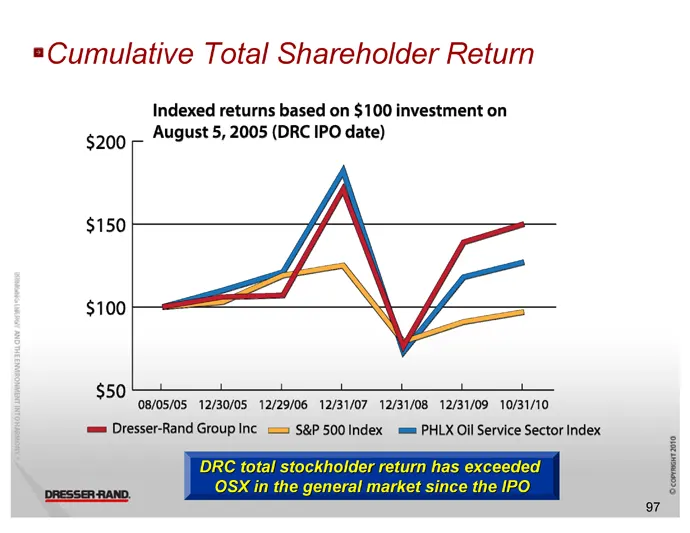
Slide 97
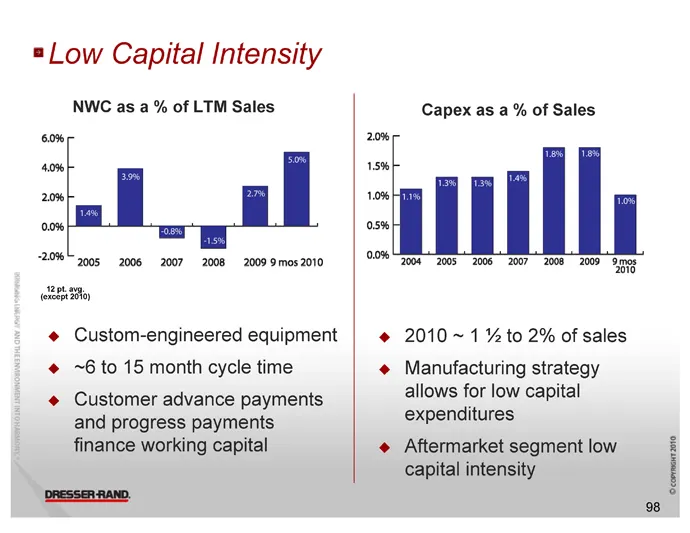
Slide 98
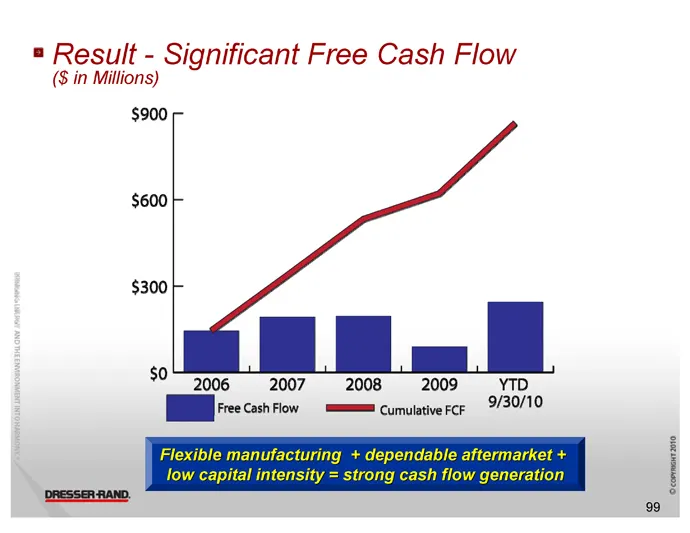
Slide 99
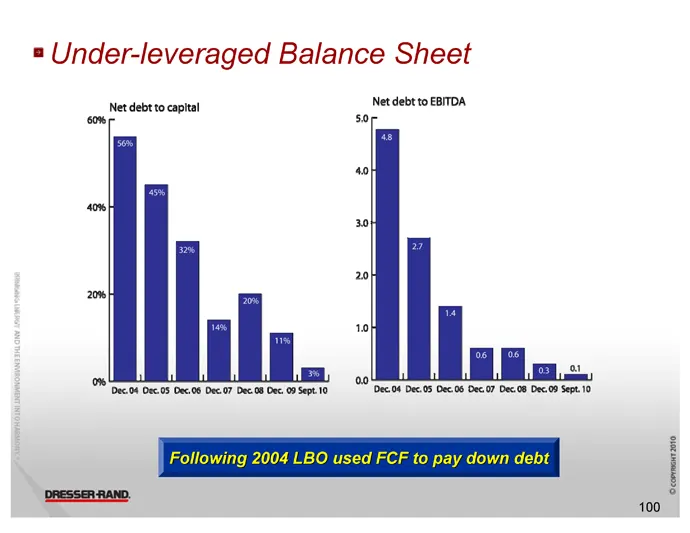
Slide 100
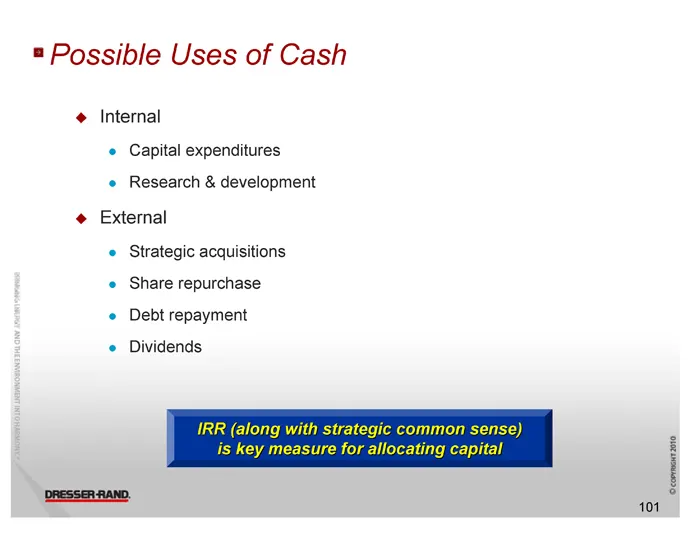
Slide 101
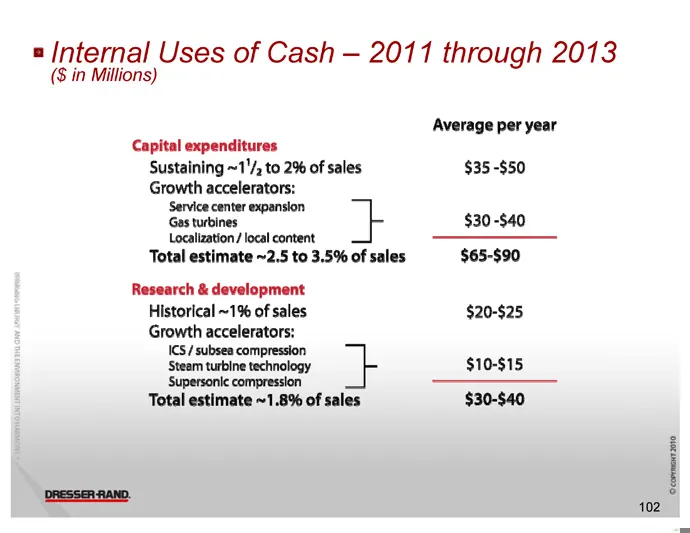
Slide 102
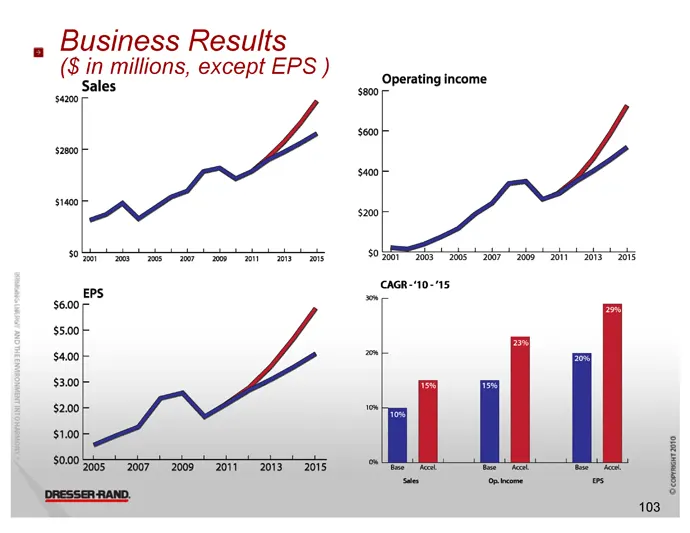
Slide 103
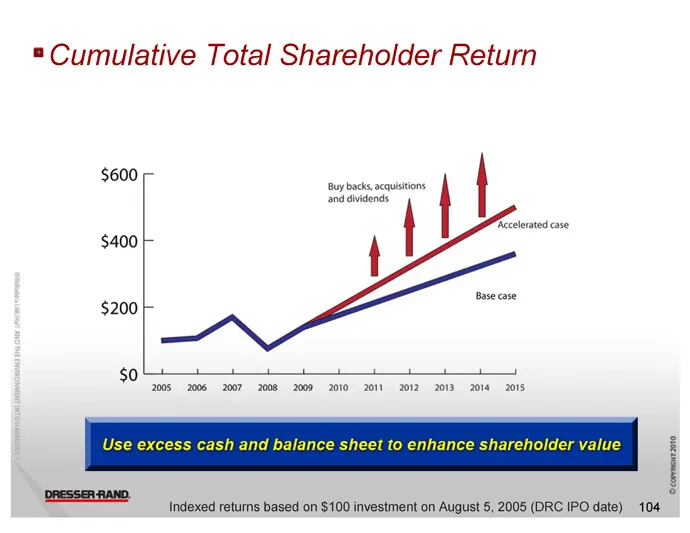
Slide 104
Slide 105
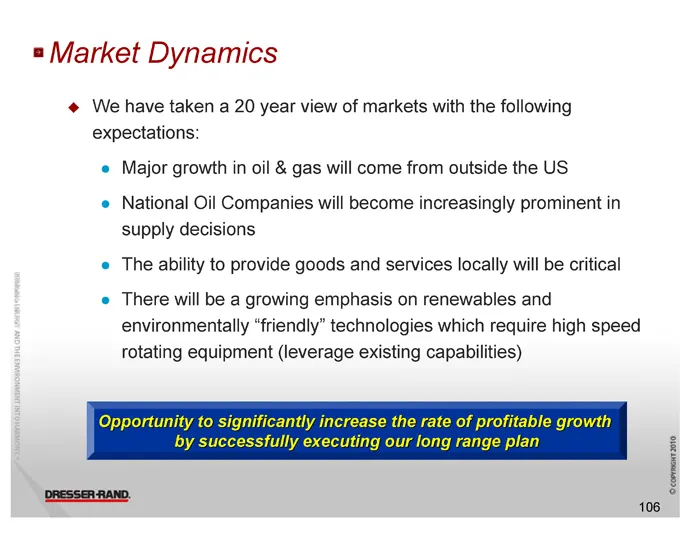
Slide 106
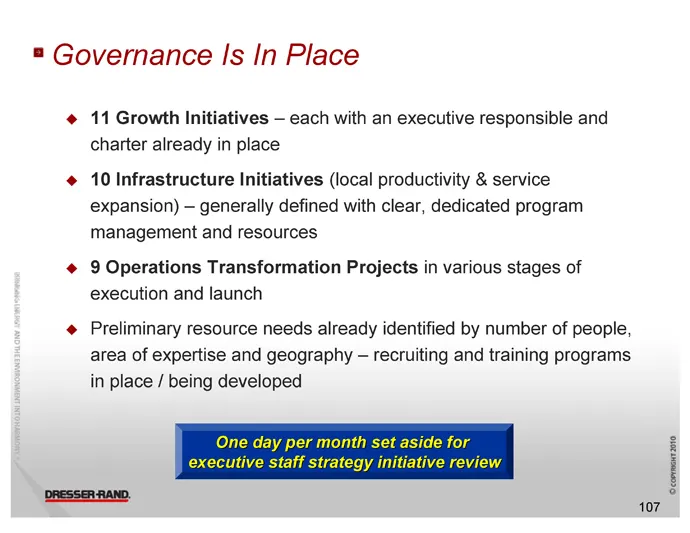
Slide 107
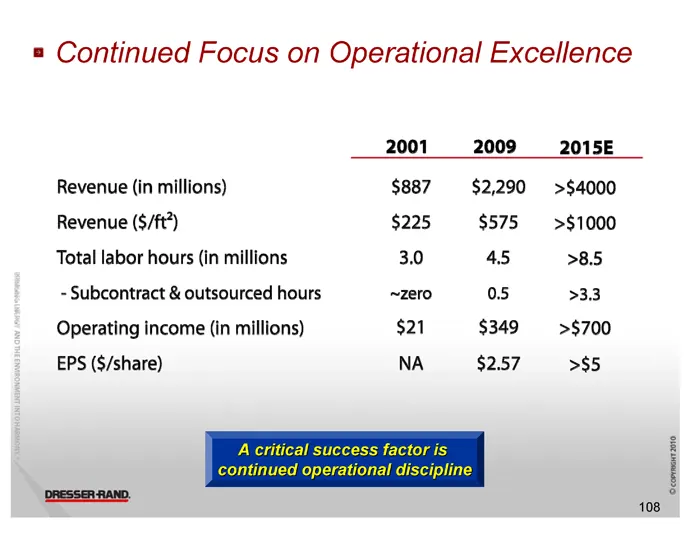
Slide 108
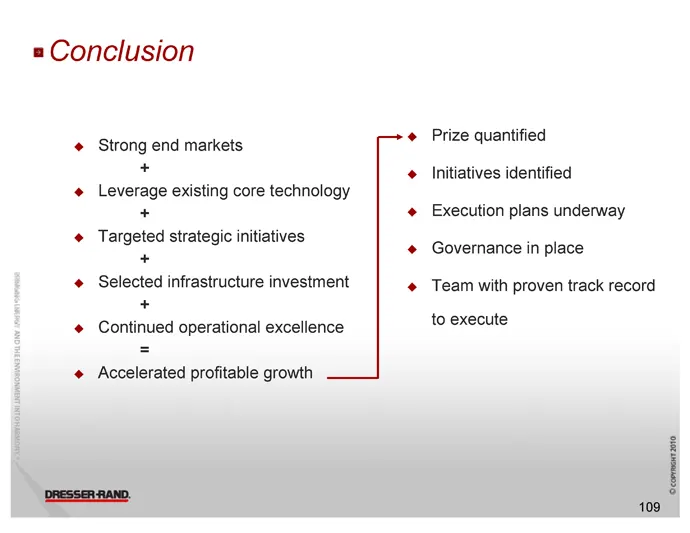
Slide 109
Slide 110
Slide 111
Source: SEC EDGAR · 8-K filed Nov 10, 2010
More decks from Dresser-Rand Group Inc
 Merger or Acquisition (September 2014)16 slides · Sep 23, 2014
 Merger or Acquisition (March 2011)32 slides · Mar 7, 2011
 Credit Suisse Energy Summit 201128 slides · Feb 7, 2011
 Howard Weil 2010 Energy Conference24 slides · Mar 19, 2010
 Pritchard Capital Partners – Energize 201022 slides · Jan 5, 2010
 Annual Small / Mid Cap Conference (November 2009)23 slides · Nov 19, 2009