Dresser-Rand — Annual Small / Mid Cap Conference (November 2009)
23 slides from Dresser-Rand's conference presentation, Nov 19, 2009
Slide 1: Annual Small / Mid Cap Conference
Annual Small / Mid Cap Conference
Slide 2: Disclosure
Disclosure The Private Securities Litigation Reform Act of 1995 provides a “safe harbor” for certain forward-looking statements so long as such information is identified as forward-looking and is accompanied by meaningful cautionary statements identifying important factors that could cause actual re
Slide 3: Company Overview
Company Overview
Slide 4: Global Supplier of Energy Solutions
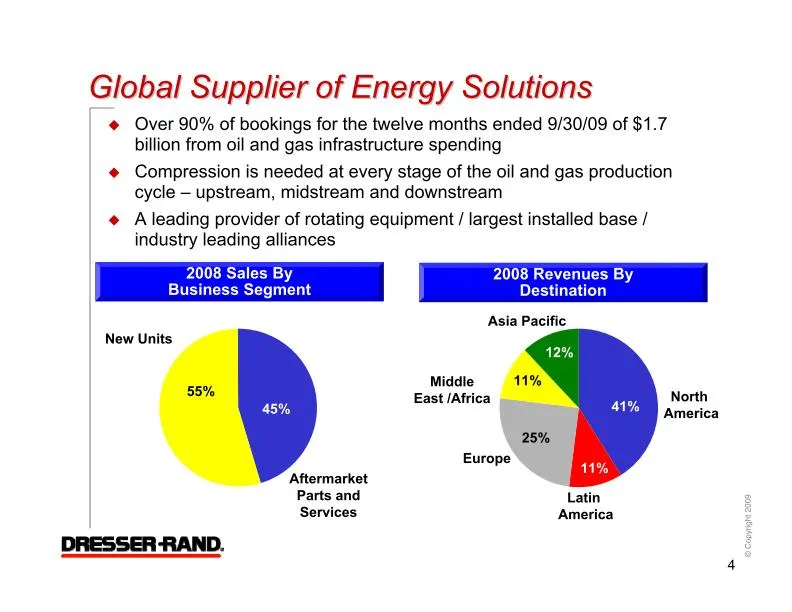
Global Supplier of Energy Solutions Over 90% of bookings for the twelve months ended 9/30/09 of $1.7 billion from oil and gas infrastructure spending Compression is needed at every stage of the oil and gas production cycle – upstream, midstream and downstream A leading provider of rotating equipment
Slide 5: Extensive Global Presence
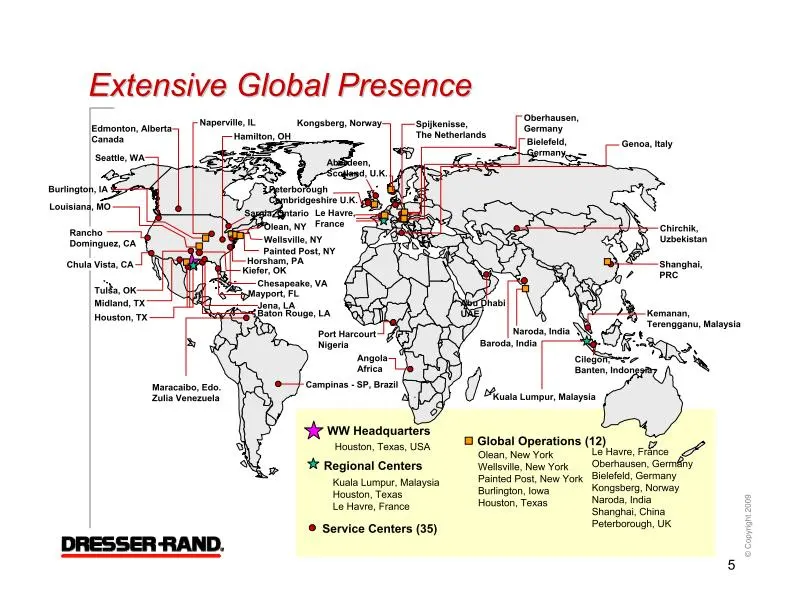
Extensive Global Presence Shanghai, PRC Kemanan, Terengganu, Malaysia Cilegon, Banten, Indonesia Naroda, India Kongsberg, Norway Spijkenisse, The Netherlands Oberhausen, Germany Peterborough Cambridgeshire U.K. Le Havre, France Genoa, Italy Campinas - SP, Brazil Maracaibo, Edo. Zulia Venezuela Edmon
Slide 6: Most Client Alliances in Industry
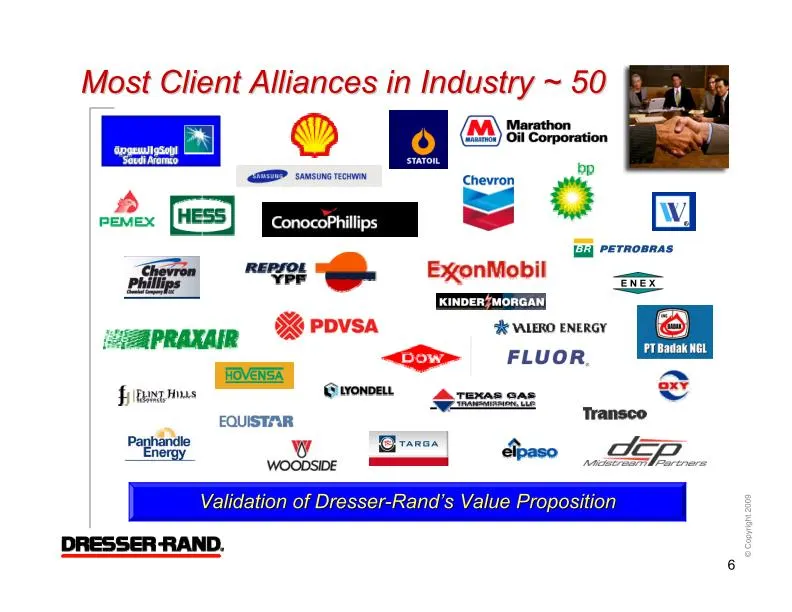
Most Client Alliances in Industry ~ 50 Validation of Dresser-Rand’s Value Proposition 6
Slide 7: Solid Revenue and Income Growth
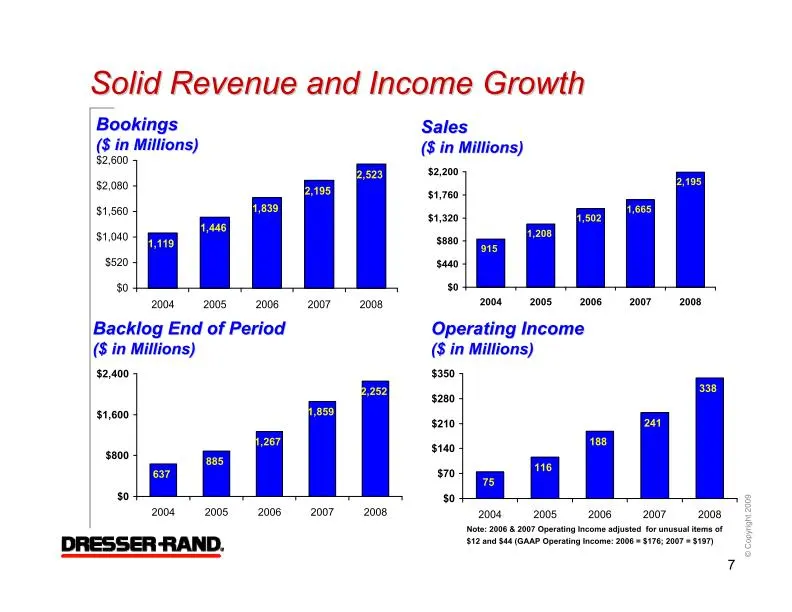
Solid Revenue and Income Growth 2008 2007 2006 2005 2004 $2,600 $2,080 $1,560 $1,040 $520 $0 2,523 2,195 1,839 1,446 1,119 2008 2007 2006 2005 2004 $2,400 $1,600 $800 $0 2,252 1,859 1,267 885 637 ($ in Millions) ($ in Millions) 915 1,208 1,502 1,665 2,195 $0 $440 $880 $1,320 $1,760 $2,200 2004 2005
Slide 8: Nine Months Results by Segment
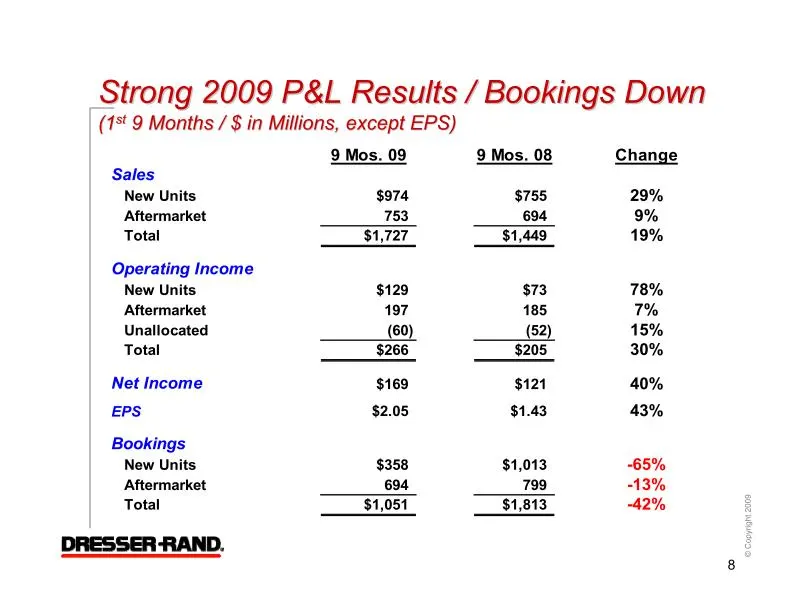
(1 9 Months / $ in Millions, except EPS) 9 Mos. 09 9 Mos. 08 Change Sales New Units $974 $755 29% Aftermarket 753 694 9% Total $1,727 $1,449 19% Operating Income New Units $129 $73 78% Aftermarket 197 185 7% Unallocated (60) (52) 15% Total $266 $205 30% Net Income $169 $121 40% EPS $2.05 $1.43 43% B
Slide 9: Business Model Characteristics
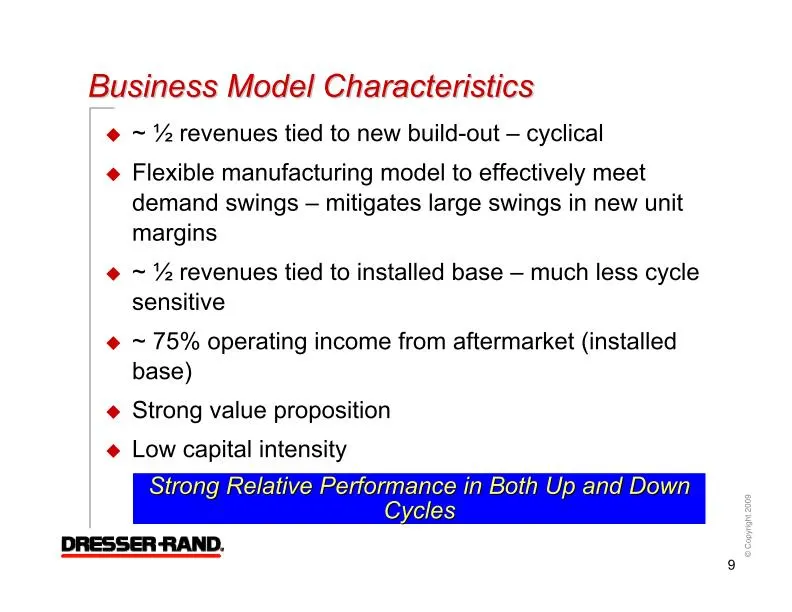
Business Model Characteristics ~ ½ revenues tied to new build-out – cyclical Flexible manufacturing model to effectively meet demand swings – mitigates large swings in new unit margins ~ ½ revenues tied to installed base – much less cycle sensitive ~ 75% operating income from aftermarket (installed
Slide 10: New Units - Flexible Manufacturing Model
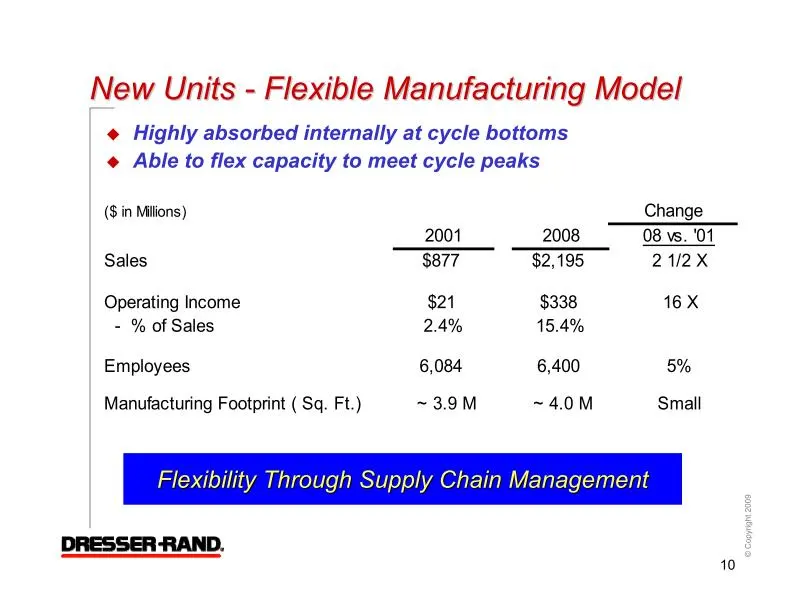
New Units - Flexible Manufacturing Model Highly absorbed internally at cycle bottoms Able to flex capacity to meet cycle peaks Flexibility Through Supply Chain Management ($ in Millions) 2001 2008 08 vs. '01 Sales $877 $2,195 2 1/2 X Operating Income $21 $338 16 X - % of Sales 2.4% 15.4% Employees 6
Slide 11: Growth Strategy and Key Initiatives
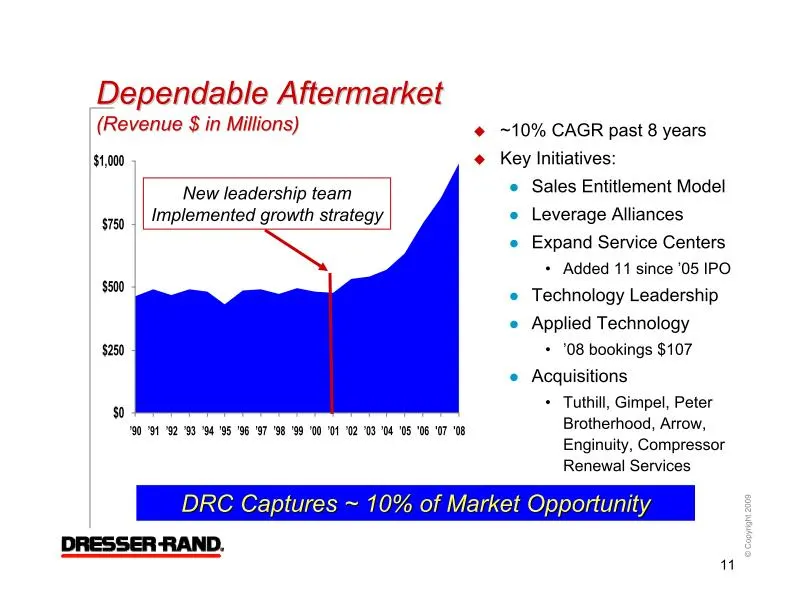
New leadership team Implemented growth strategy ~10% CAGR past 8 years Key Initiatives: Sales Entitlement Model Leverage Alliances Expand Service Centers Added 11 since ’05 IPO Technology Leadership Applied Technology ’08 bookings $107 Acquisitions Tuthill, Gimpel, Peter Brotherhood, Arrow, Enginuit
Slide 12: Resilient Aftermarket Business Model
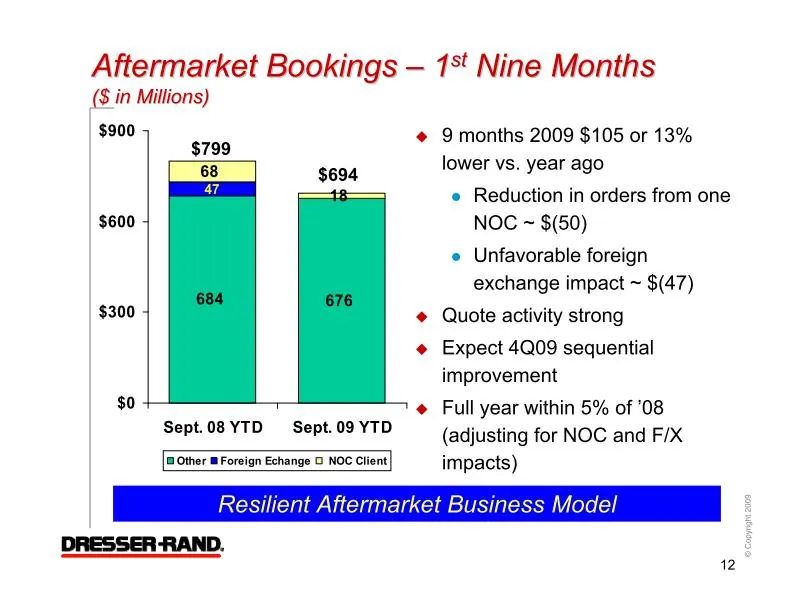
Nine Months ($ in Millions) Resilient Aftermarket Business Model $694 $799 9 months 2009 $105 or 13% lower vs. year ago Reduction in orders from one NOC ~ $(50) Unfavorable foreign exchange impact ~ $(47) Quote activity strong Expect 4Q09 sequential improvement Full year within 5% of ’08 (adjusting
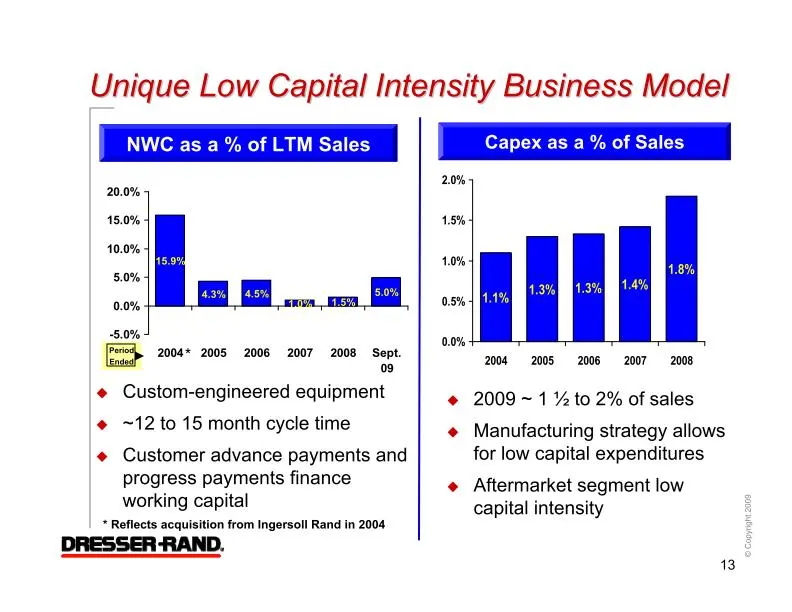
Slide 13: Unique Low Capital Intensity Business Model
Unique Low Capital Intensity Business Model NWC as a % of LTM Sales 09 Sept. 2008 2007 2006 2005 2004 20.0% 15.0% 10.0% 5.0% 0.0% -5.0% 5.0% 1.5% 1.0% 4.5% 4.3% 15.9% * Period Ended * Reflects acquisition from Ingersoll Rand in 2004 Capex as a % of Sales 2009 ~ 1 ½ to 2% of sales Manufacturing strat
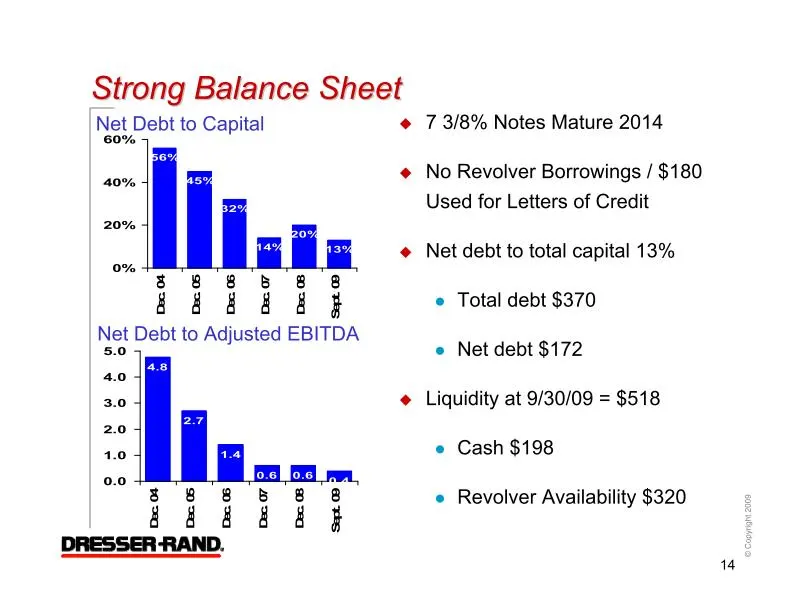
Slide 14: Strong Balance Sheet
Strong Balance Sheet Net Debt to Capital Net Debt to Adjusted EBITDA 60% 40% 20% 0% 13% 20% 14% 32% 45% 56% 7 3/8% Notes Mature 2014 No Revolver Borrowings / $180 Used for Letters of Credit Net debt to total capital 13% Total debt $370 Net debt $172 Liquidity at 9/30/09 = $518 Cash $198 Revolver Ava
Slide 15: Outlook
Outlook
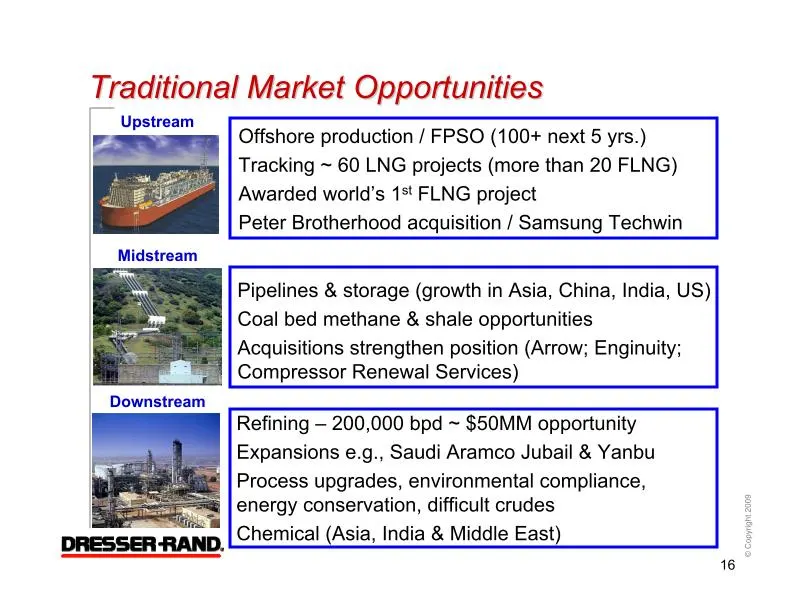
Slide 16: Traditional Market Opportunities
Traditional Market Opportunities Offshore production / FPSO (100+ next 5 yrs.) Tracking ~ 60 LNG projects (more than 20 FLNG) FLNG project Peter Brotherhood acquisition / Samsung Techwin Upstream Midstream Downstream Pipelines & storage (growth in Asia, China, India, US) Coal bed methane & shale opp
Slide 17: Emerging Market Opportunities
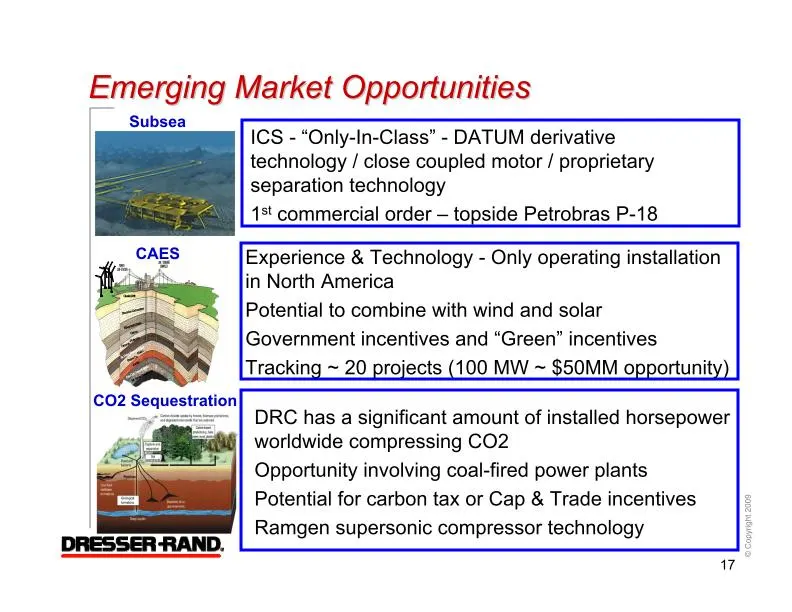
Emerging Market Opportunities ICS - “Only-In-Class” - DATUM derivative technology / close coupled motor / proprietary separation technology commercial order – topside Petrobras P-18 Subsea CAES CO2 Sequestration Experience & Technology - Only operating installation in North America Potential to comb
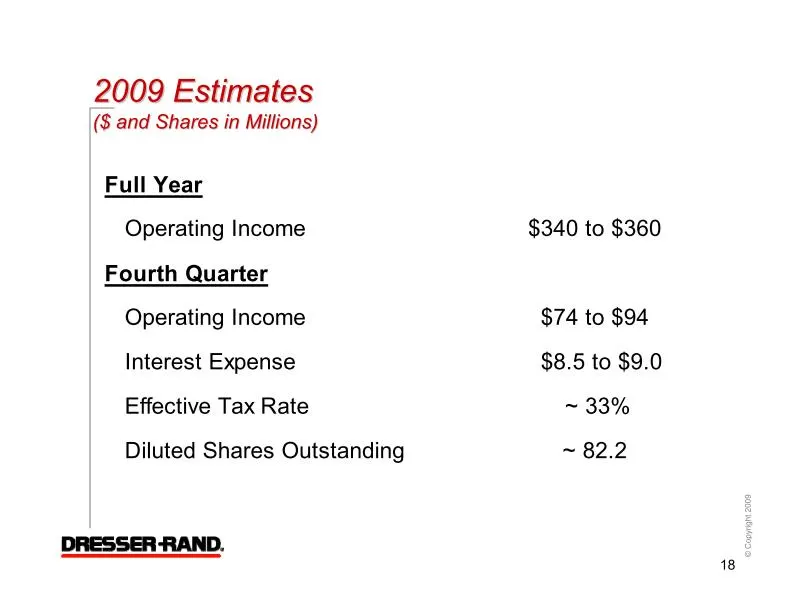
Slide 18: Full Year and Fourth Quarter Outlook
($ and Shares in Millions) Full Year Operating Income $340 to $360 Fourth Quarter Operating Income $74 to $94 Interest Expense $8.5 to $9.0 Effective Tax Rate ~ 33% Diluted Shares Outstanding ~ 82.2 18
Slide 19: 2010 New Units Outlook
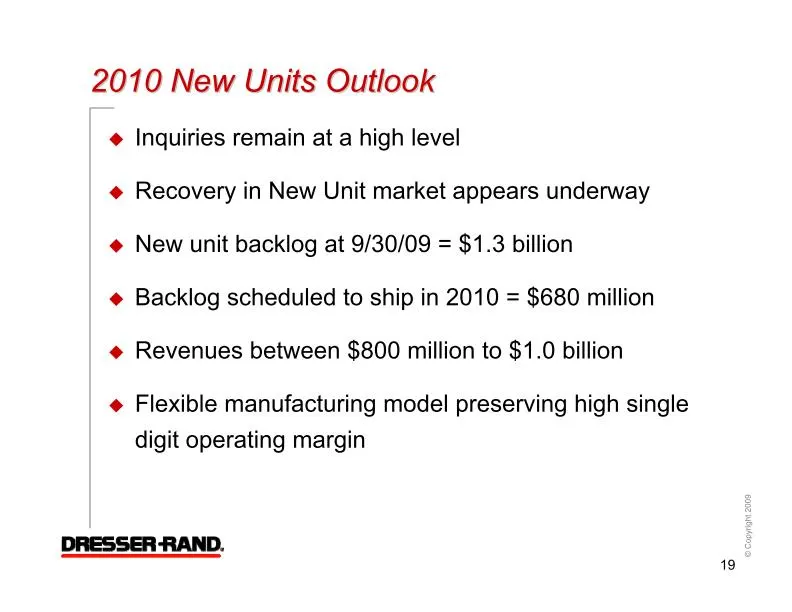
2010 New Units Outlook Inquiries remain at a high level Recovery in New Unit market appears underway New unit backlog at 9/30/09 = $1.3 billion Backlog scheduled to ship in 2010 = $680 million Revenues between $800 million to $1.0 billion Flexible manufacturing model preserving high single digit ope
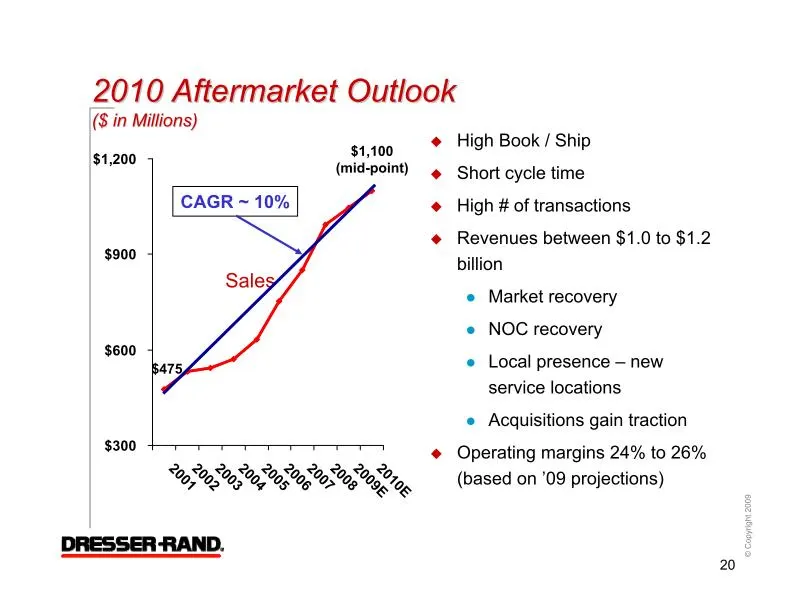
Slide 20: 2010 Aftermarket Outlook
($ in Millions) CAGR ~ 10% Sales $1,100 (mid-point) $475 High Book / Ship Short cycle time High # of transactions Revenues between $1.0 to $1.2 billion Market recovery NOC recovery Local presence – new service locations Acquisitions gain traction $300 $600 $900 $1,200 20
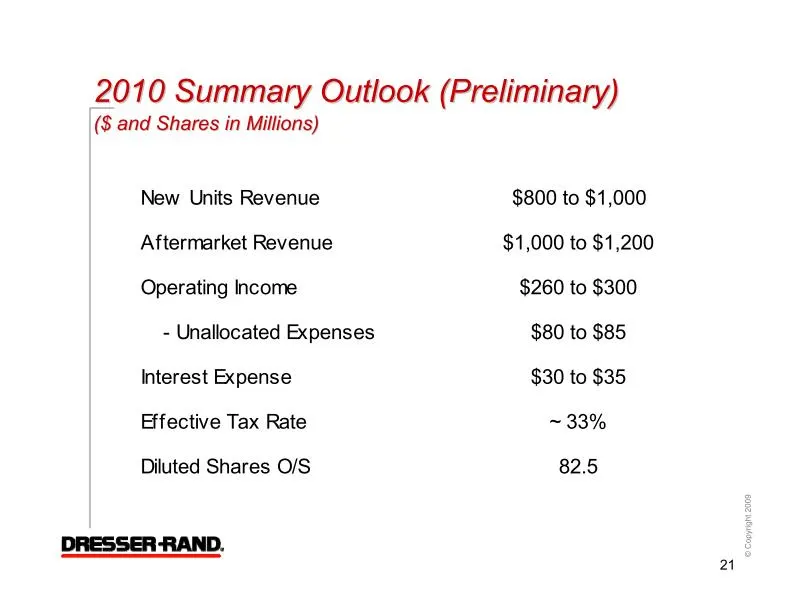
Slide 21: 2010 Summary Outlook
2010 Summary Outlook ($ and Shares in Millions) New Units Revenue $800 to $1,000 Aftermarket Revenue $1,000 to $1,200 Operating Income $260 to $300 - Unallocated Expenses $80 to $85 Interest Expense $30 to $35 Effective Tax Rate ~ 33% Diluted Shares O/S 82.5 21
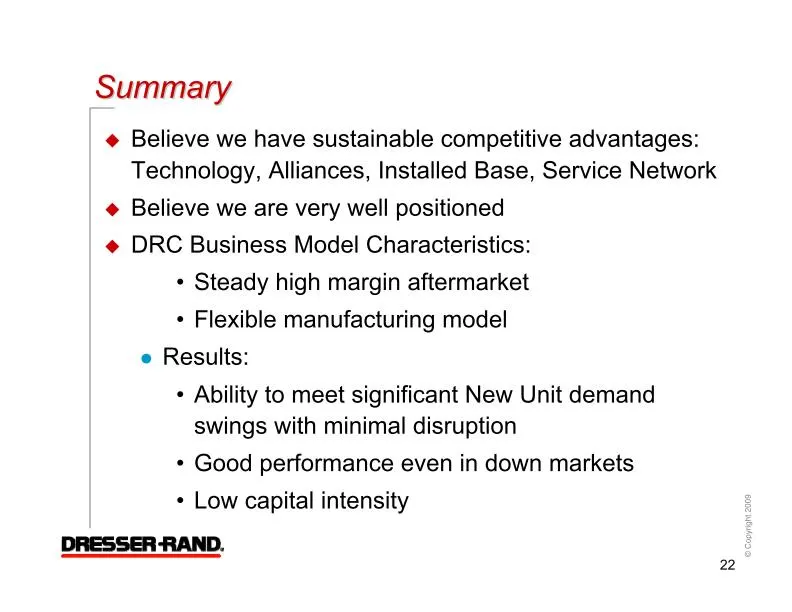
Slide 22: Summary
Summary Believe we have sustainable competitive advantages: Technology, Alliances, Installed Base, Service Network Believe we are very well positioned DRC Business Model Characteristics: Steady high margin aftermarket Flexible manufacturing model Results: Ability to meet significant New Unit demand
Slide 23: www.dresser-rand.com [email protected]
www.dresser-rand.com [email protected]
Source: SEC EDGAR · 8-K filed Nov 19, 2009
More decks from Dresser-Rand Group Inc
 Merger or Acquisition (September 2014)16 slides · Sep 23, 2014
 Merger or Acquisition (March 2011)32 slides · Mar 7, 2011
 Credit Suisse Energy Summit 201128 slides · Feb 7, 2011
 Investor Day (November 2010)111 slides · Nov 10, 2010
 Howard Weil 2010 Energy Conference24 slides · Mar 19, 2010
 Pritchard Capital Partners – Energize 201022 slides · Jan 5, 2010