Centrue Financial — Q1 2017 Earnings Presentation
18 slides from Centrue Financial's earnings presentation, Apr 27, 2017

Slide 1: Forward-Looking Statements
Forward-Looking Statements. This presentation may contain forward-looking statements within the meaning of the federal securities laws. Forward-looking statements express management’s current expectations, forecasts of future events or long-term goals, and may be based upon beliefs, expectations and
Slide 2: First Quarter 2017 Summary
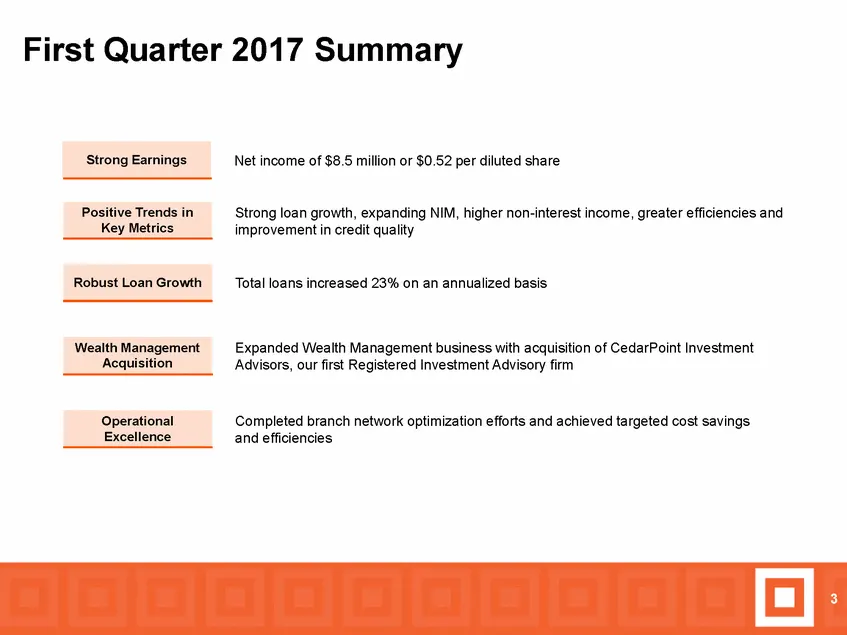
First Quarter 2017 Summary Net income of $8.5 million or $0.52 per diluted share Strong loan growth, expanding NIM, higher non-interest income, greater efficiencies and improvement in credit quality Total loans increased 23% on an annualized basis Expanded Wealth Management business with acquisition
Slide 3: Business Unit Review - Love Funding
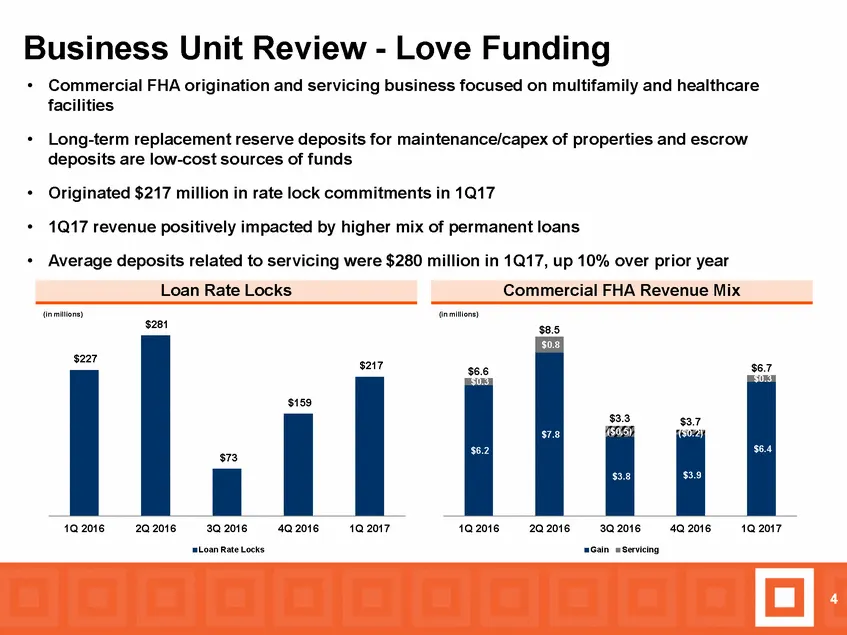
Business Unit Review - Love Funding facilities • Commercial FHA origination and servicing business focused on multifamily and healthcare • Long-term replacement reserve deposits for maintenance/capex of properties and escrow deposits are low-cost sources of funds Originated $217 million in rate lock
Slide 4: Business Unit Review - Residential Mortgage
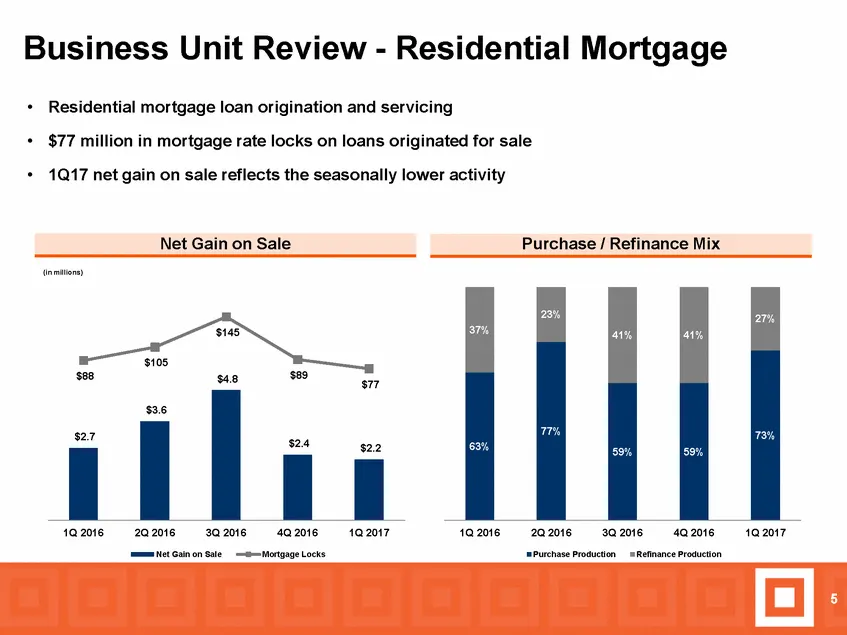
Business Unit Review - Residential Mortgage • • Residential mortgage loan origination and servicing $77 million in mortgage rate locks on loans originated for sale • 1Q17 net gain on sale reflects the seasonally lower activity (in millions) $145 $105 $89 $88 $4.8 $77 1Q 2016 2Q 2016 3Q 2016 4Q 2016
Slide 5: Business Unit Review - Heartland Business Credit
Business Unit Review - Heartland Business Credit • Equipment leasing sourced from a network of equipment manufacturers and brokers • • Strong production with $22 million in originations Attractive yields – average rate (ex. accretion) on lease finance portfolio was 5.44% • 25% portfolio growth vs. 1
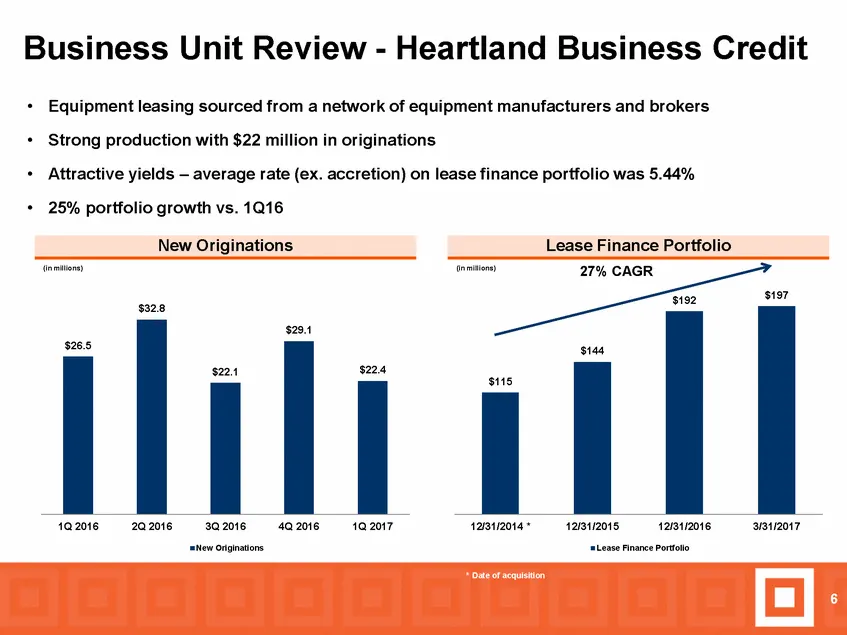
Slide 6: Business Unit Review - Wealth Management
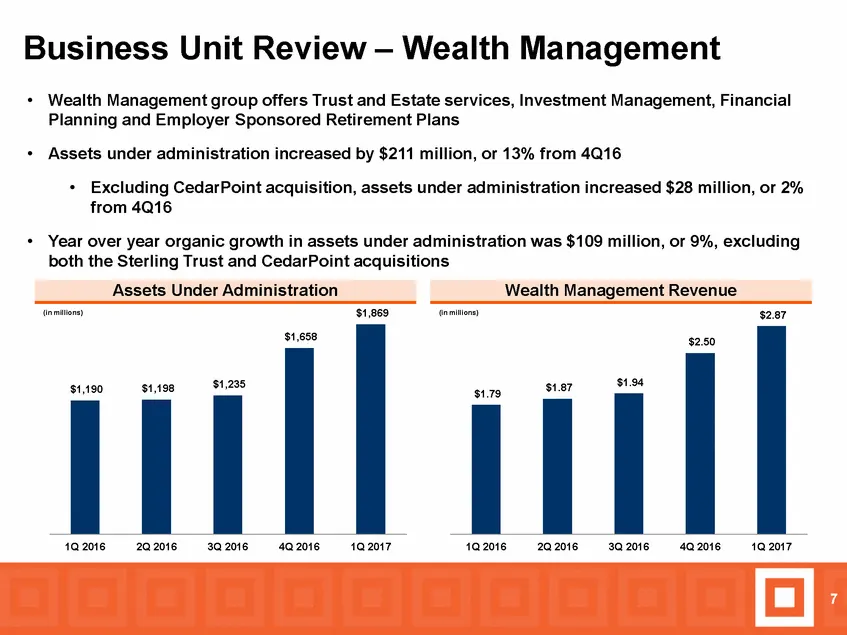
Business Unit Review – Wealth Management • Wealth Management group offers Trust and Estate services, Investment Management, Financial Planning and Employer Sponsored Retirement Plans • Assets under administration increased by $211 million, or 13% from 4Q16 • Excluding CedarPoint acquisition, assets
Slide 7: Net Interest Income/Margin
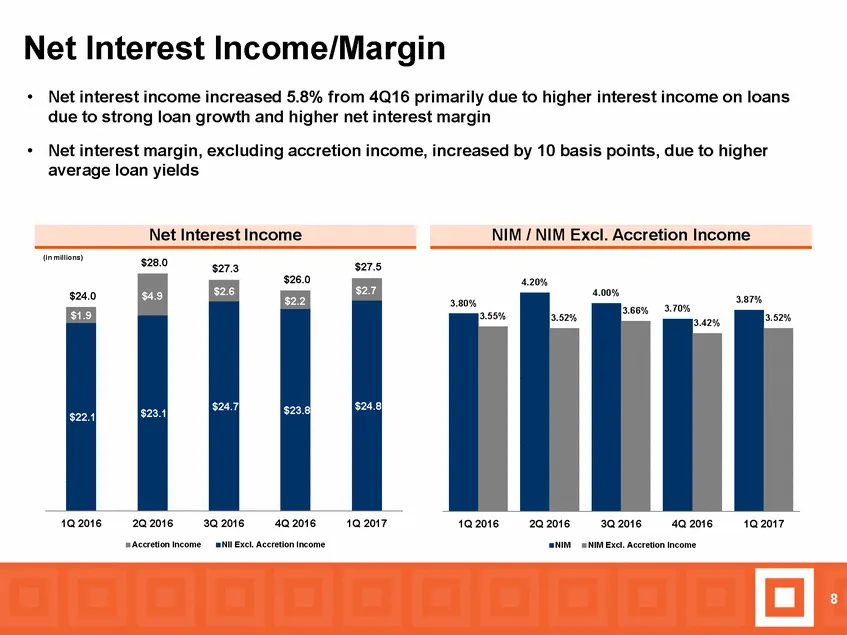
Net Interest Income/Margin • Net interest income increased 5.8% from 4Q16 primarily due to higher interest income on loans due to strong loan growth and higher net interest margin Net interest margin, excluding accretion income, increased by 10 basis points, due to higher average loan yields • (in m
Slide 8: Non-Interest Income
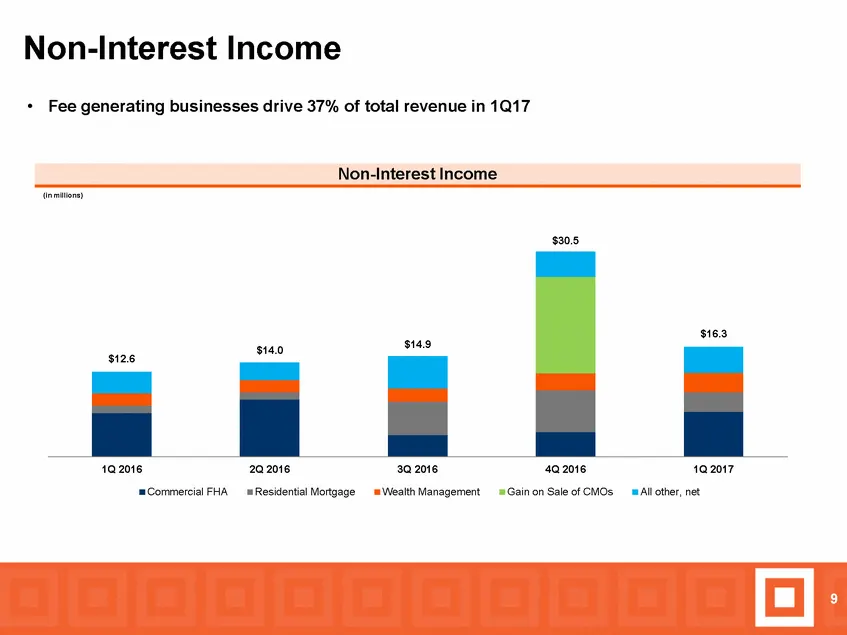
Non-Interest Income • Fee generating businesses drive 37% of total revenue in 1Q17 (in millions) $30.5 $16.3 1Q 2016 2Q 2016 3Q 2016 4Q 2016 1Q 2017 Commercial FHA Residential Mortgage Wealth Management Gain on Sale of CMOs All other, net 9 $14.0$14.9 $12.6 Non-Interest Income
Slide 9: Non-Interest Expense and Operating Efficiency
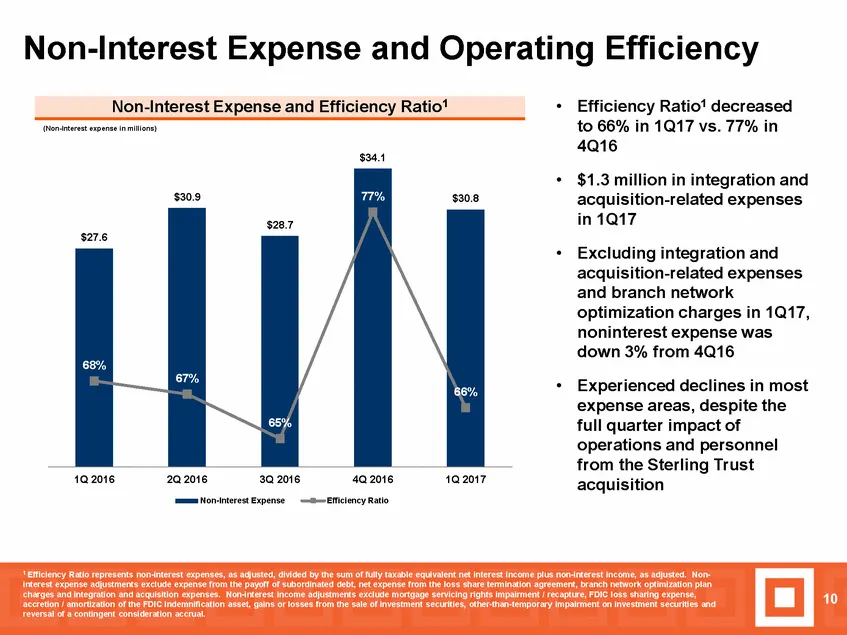
Non-Interest Expense and Operating Efficiency Efficiency Ratio1 decreased to 66% in 1Q17 vs. 77% in 4Q16 • (Non-Interest expense in millions) $34.1 • $1.3 million in integration and acquisition-related expenses in 1Q17 • Excluding integration and acquisition-related expenses and branch network optim
Slide 10: Loan Portfolio
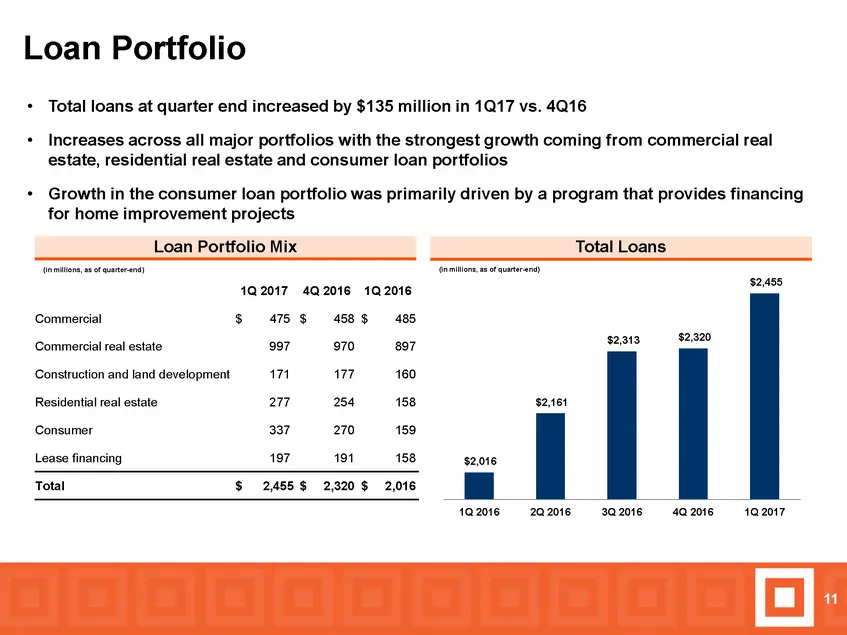
Loan Portfolio • Total loans at quarter end increased by $135 million in 1Q17 vs. 4Q16 • Increases across all major portfolios with the strongest growth coming from commercial real estate, residential real estate and consumer loan portfolios • Growth in the consumer loan portfolio was primarily driv
Slide 11: Total Deposits
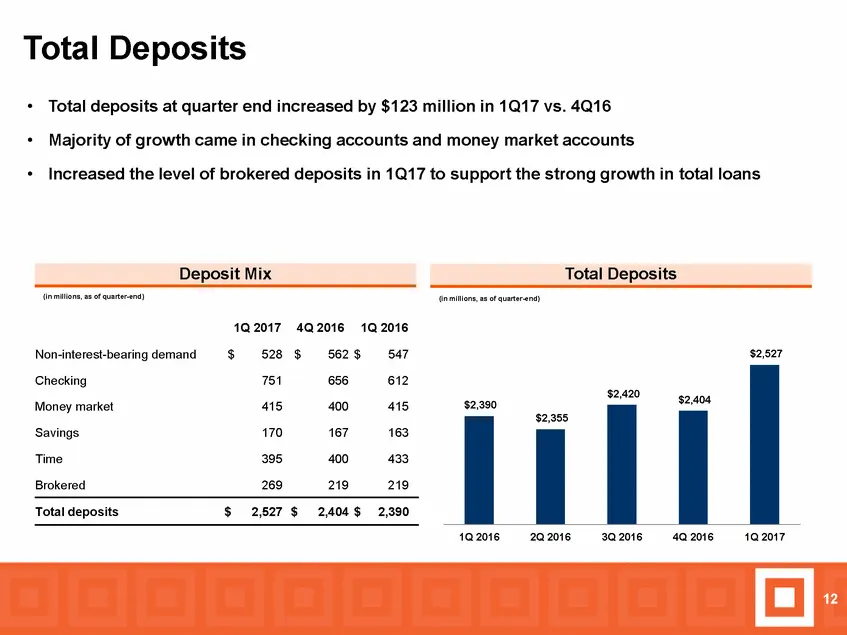
Total Deposits • Total deposits at quarter end increased by $123 million in 1Q17 vs. 4Q16 • • Majority of growth came in checking accounts and money market accounts Increased the level of brokered deposits in 1Q17 to support the strong growth in total loans (in millions, as of quarter-end) (in milli
Slide 12: Asset Quality
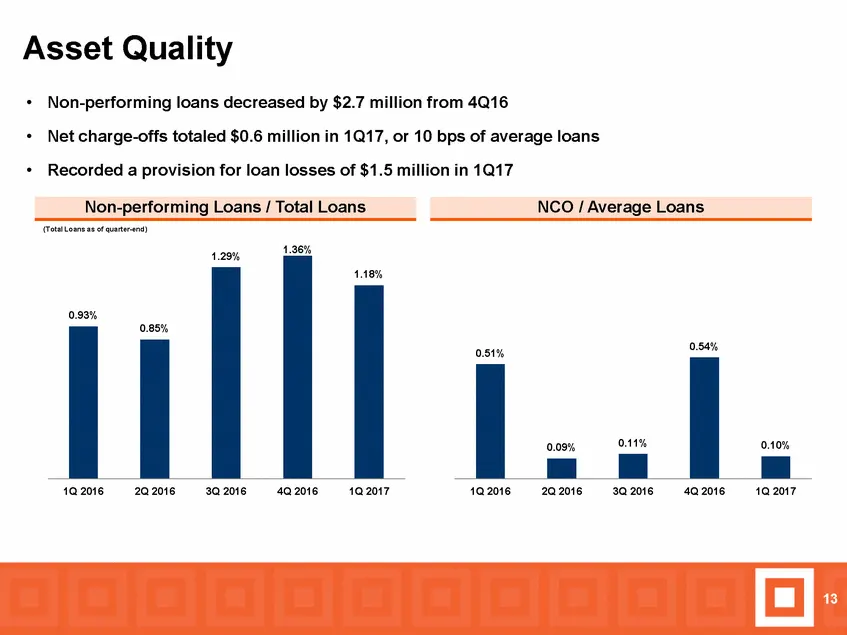
Asset Quality • Non-performing loans decreased by $2.7 million from 4Q16 • Net charge-offs totaled $0.6 million in 1Q17, or 10 bps of average loans • Recorded a provision for loan losses of $1.5 million in 1Q17 (Total Loans as of quarter-end) 1.36% 1.29% 0.54% 0.51% 1Q 2016 2Q 2016 3Q 2016 4Q 2016 1
Slide 13: Outlook
Outlook • Economic conditions in our markets remain healthy • Expect continuation of positive trends in revenue growth and credit quality • Centrue acquisition on track to close in mid-2017 • Investment in resources needed to execute the Centrue integration will result in higher expense levels until
Slide 14: Outlook
Outlook + Economic conditions in our markets remain healthy + Expect continuation of positive trends in revenue growth and credit quality + Centrue acquisition on track to close in mid-2017 + Investment in resources needed to execute the Centrue integration will result in higher expense levels until
Slide 15: Reconciliations of Non-GAAP Financial Measures
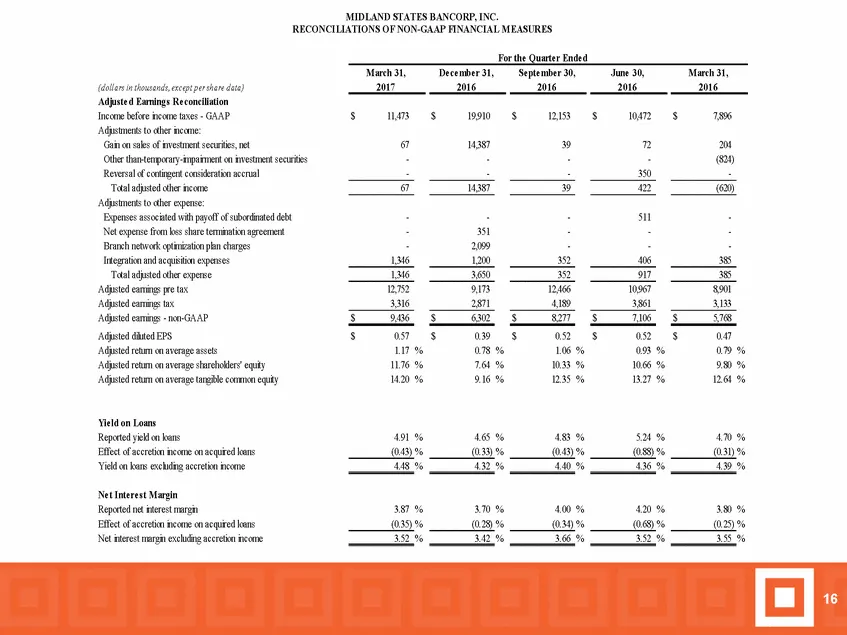
MIDLAND STATES BANCORP, INC. RECONCILIATIONS OF NON-GAAP FINANCIAL MEASURES For the Quarte r Ende d March 31, De ce mbe r 31, Se pte mbe r 30, June 30, March 31, 2017 2016 2016 2016 2016 (dollars in thousands, except per share data) Adjus te d Earnings Re conciliation Income before income taxes - GA
Slide 16: Reconciliations of Non-GAAP Financial Measures: Tangible Common Equity
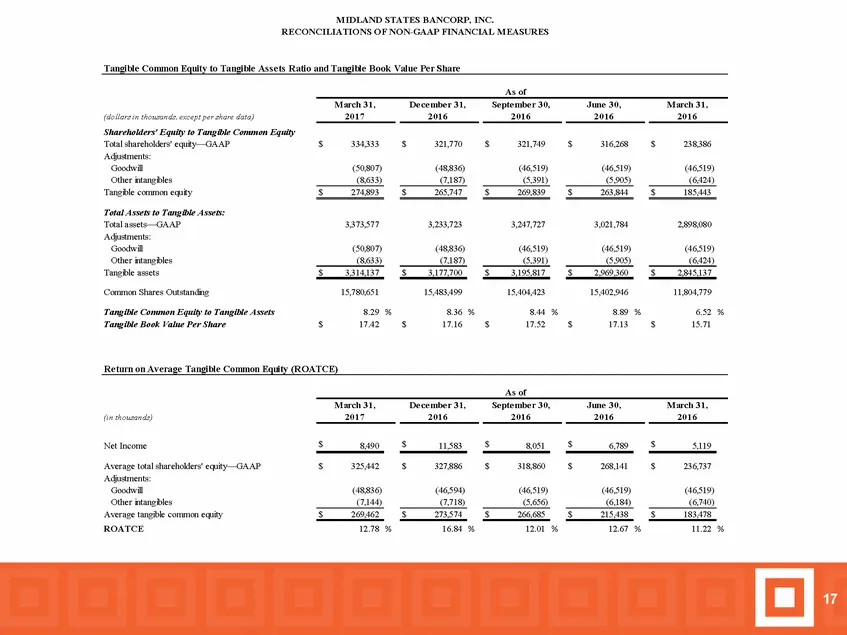
MIDLAND STATES B ANCORP, INC. RECONCILIATIONS OF NON-GAAP FINANCIAL MEASURES Tangible Common Equity to Tangible Assets Ratio and Tangible Book Value Per Share As of March 31, 2017 De ce mbe r 31, 2016 Se pte mbe r 30, 2016 June 30, 2016 March 31, 2016 (dollars in thousands, except per share data) Sh
Slide 17: Additional Information
Additional Information. Midland has filed a registration statement on Form S-4 with the Securities and Exchange Commission (SEC) in connection with its proposed acquisition of Centrue. The registration statement includes a proxy statement of Midland and Centrue that also constitutes a prospectus of
Slide 18: Additional Information
Additional Information. Midland has filed a registration statement on Form $-4 with the Securities and Exchange Commission (SEC) in connection with its proposed acquisition of Centrue. The registration statement includes a proxy statement of Midland and Centrue that also constitutes a prospectus of
Source: SEC EDGAR · 425 filed Apr 27, 2017