Centrue Financial — Q1 2016 Earnings Presentation
21 slides from Centrue Financial's earnings presentation, May 2, 2016
Slide 1: Centrue Financial Corporation Earnings Presentation March 31, 2016
Centrue Financial Corporation Earnings Presentation March 31, 2016 NASDAQ: CFCB 1
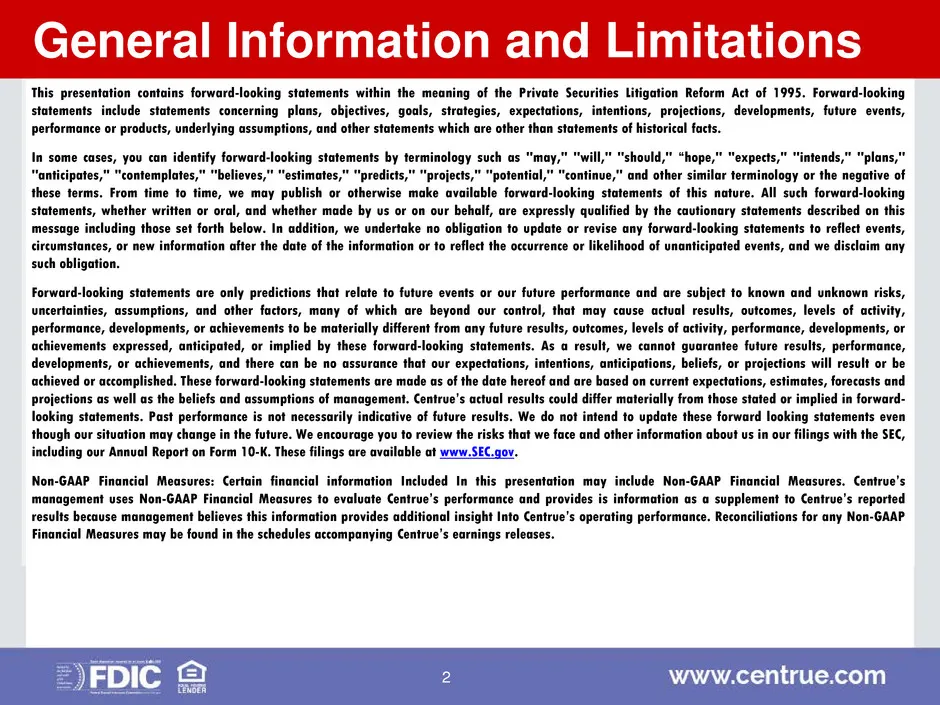
Slide 2: Forward-Looking Statements
This presentation contains forward-looking statements within the meaning of the Private Securities Litigation Reform Act of 1995. Forward-looking statements include statements concerning plans, objectives, goals, strategies, expectations, intentions, projections, developments, future events, perform
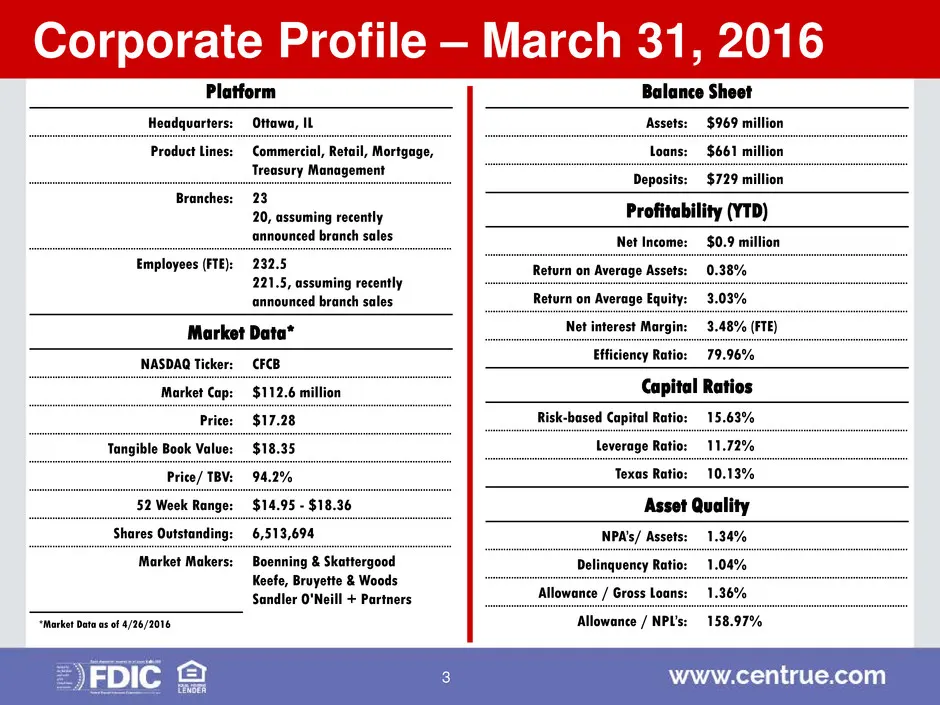
Slide 3: Corporate Profile – March 31, 2016
Corporate Profile – March 31, 2016 Platform Headquarters: Ottawa, IL Product Lines: Commercial, Retail, Mortgage, Treasury Management Branches: 23 20, assuming recently announced branch sales Employees (FTE): 232.5 221.5, assuming recently announced branch sales Market Data* NASDAQ Ticker: CFCB Mark
Slide 4: Franchise Value
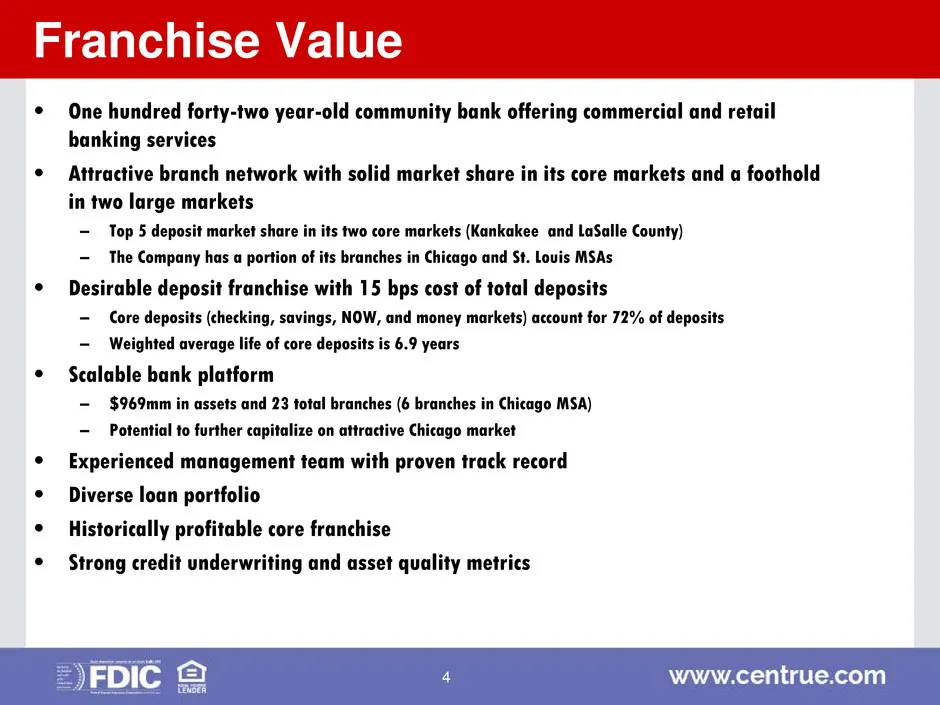
Franchise Value • One hundred forty-two year-old community bank offering commercial and retail banking services • Attractive branch network with solid market share in its core markets and a foothold in two large markets – Top 5 deposit market share in its two core markets (Kankakee and LaSalle Count
Slide 5: First Quarter Highlights
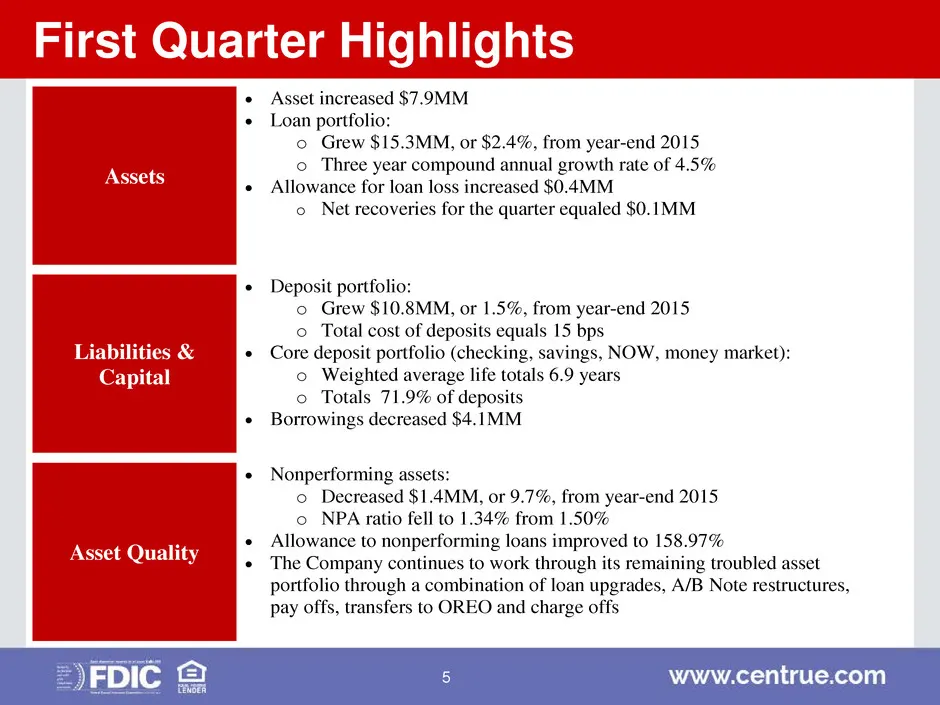
First Quarter Highlights Assets • Asset increased $7.9MM • Loan portfolio: o Grew $15.3MM, or $2.4%, from year-end 2015 o Three year compound annual growth rate of 4.5% • Allowance for loan loss increased $0.4MM o Net recoveries for the quarter equaled $0.1MM Liabilities & Capital • Deposit portfoli
Slide 6: First Quarter Highlights
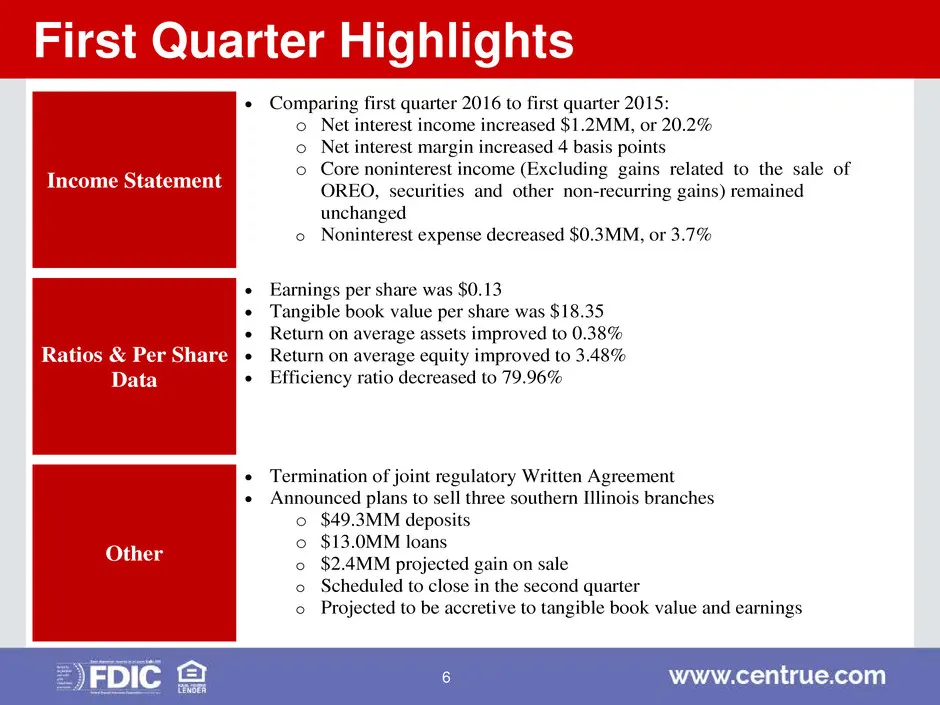
First Quarter Highlights Income Statement • Comparing first quarter 2016 to first quarter 2015: o Net interest income increased $1.2MM, or 20.2% o Net interest margin increased 4 basis points o Core noninterest income (Excluding gains related to the sale of OREO, securities and other non-recurring g
Slide 7: 2014-2016 Quarterly Financial Summary (Unaudited)
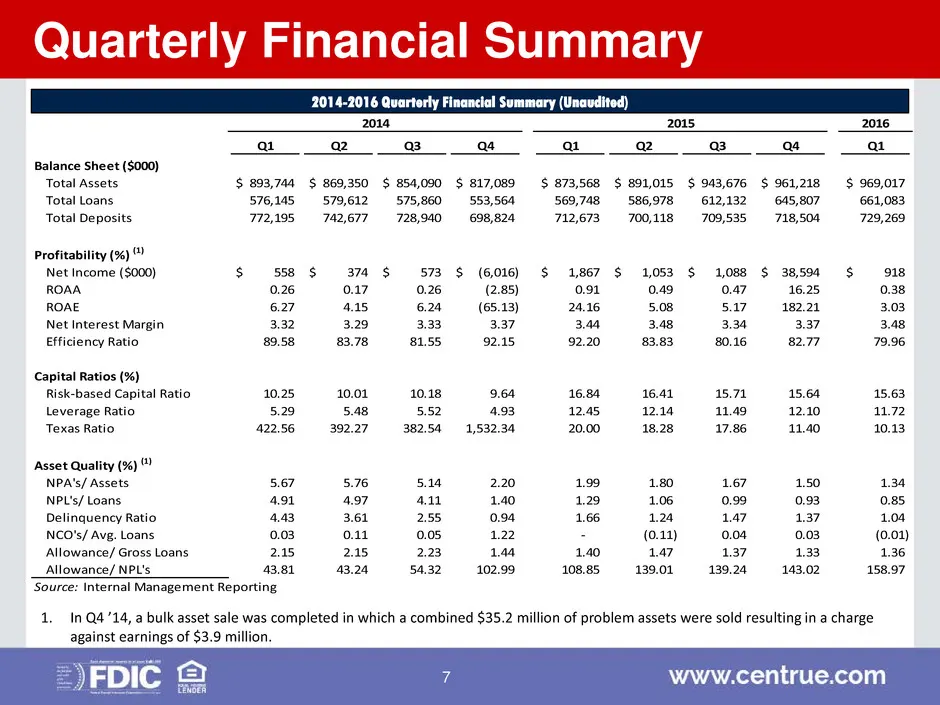
2014-2016 Quarterly Financial Summary (Unaudited) Quarterly Financial Summary 2016 Q1 Q2 Q3 Q4 Q1 Q2 Q3 Q4 Q1 Balance Sheet ($000) Total Assets 893,744$ 869,350$ 854,090$ 817,089$ 873,568$ 891,015$ 943,676$ 961,218$ 969,017$ Total Loans 576,145 579,612 575,860 553,564 569,748 586,978 612,132 645,807
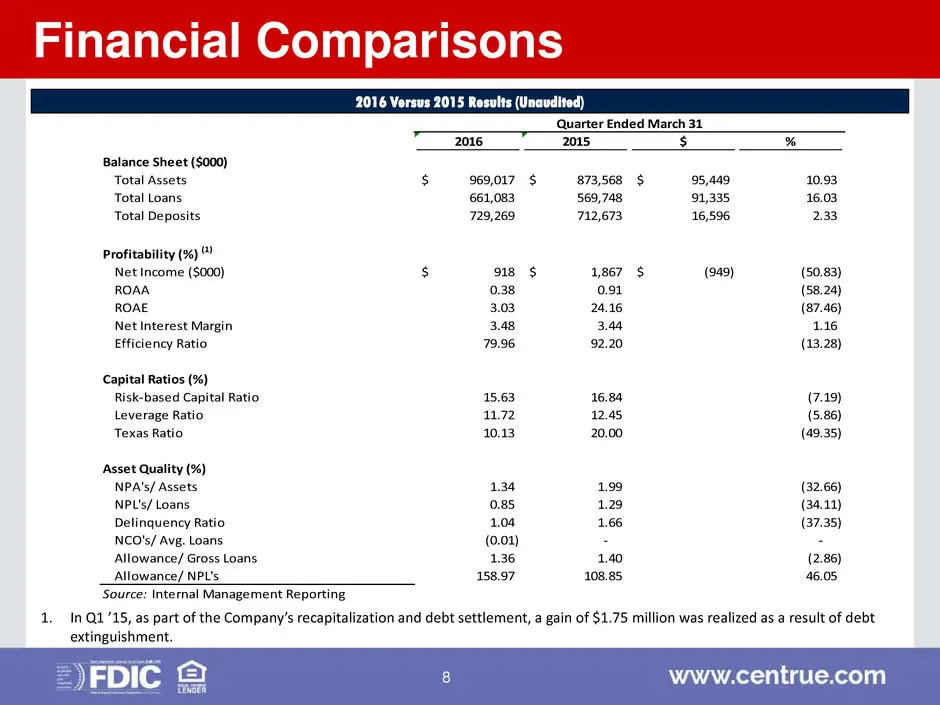
Slide 8: 2016 Versus 2015 Results (Unaudited)
2016 Versus 2015 Results (Unaudited) Financial Comparisons 2016 2015 $ % Balance Sheet ($000) Total Assets 969,017$ 873,568$ 95,449$ 10.93 Total Loans 661,083 569,748 91,335 16.03 Total Deposits 729,269 712,673 16,596 2.33 Profitability (%) (1) Net Income ($000) 918$ 1,867$ (949)$ (50.83) ROAA 0.38
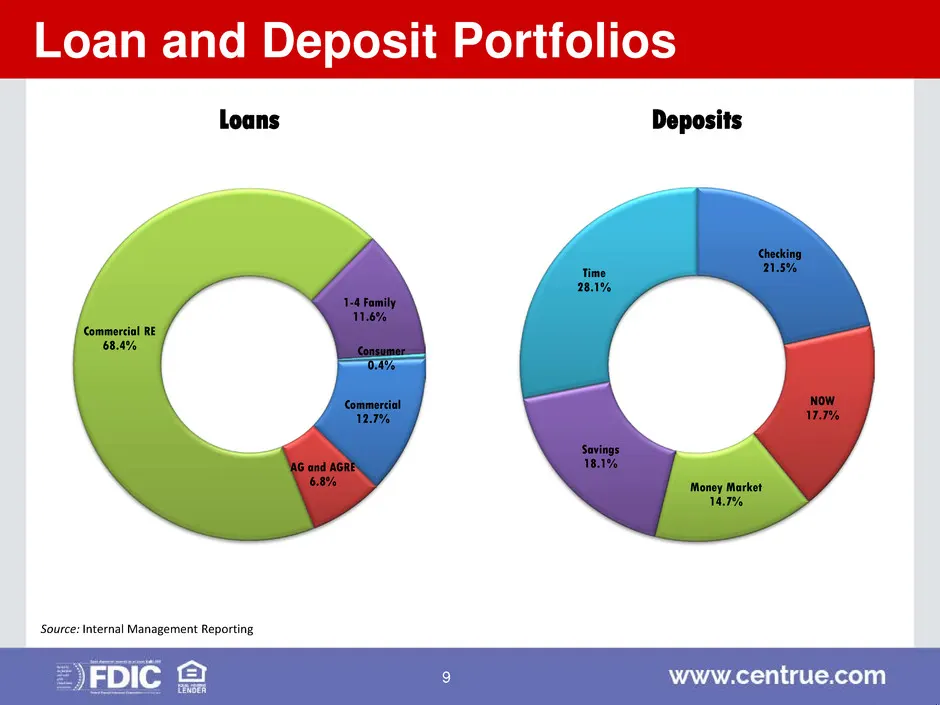
Slide 9: Loan and Deposit Portfolios
Commercial 12.7% AG and AGRE 6.8% Commercial RE 68.4% 1-4 Family 11.6% Consumer 0.4% Loans Loan and Deposit Portfolios Source: Internal Management Reporting Checking 21.5% NOW 17.7% Money Market 14.7% Savings 18.1% Time 28.1% Deposits 9
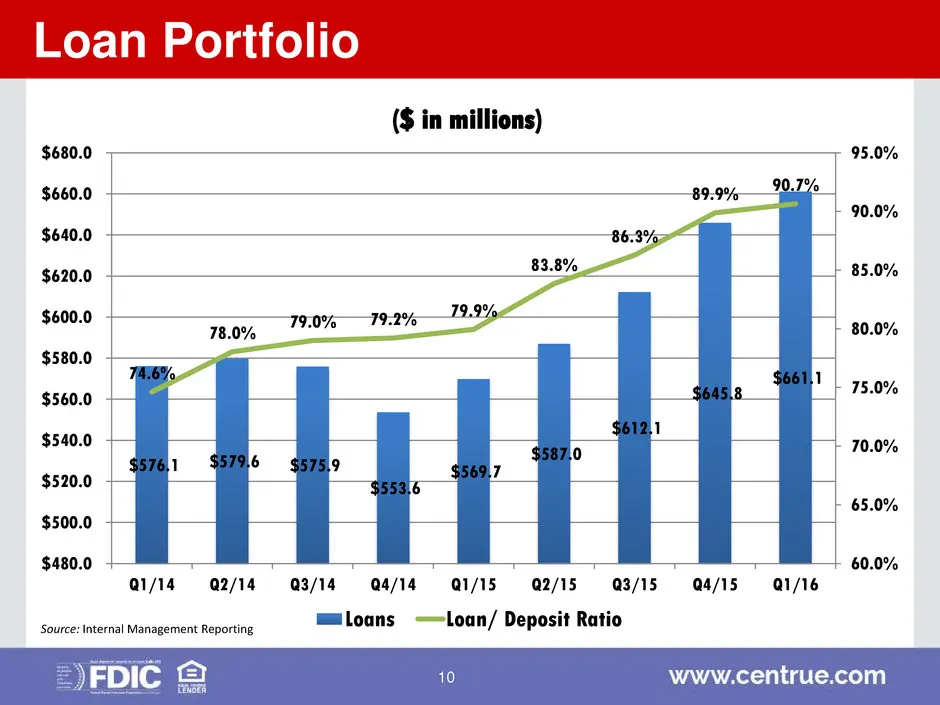
Slide 10: Loan Portfolio
Loan Portfolio Source: Internal Management Reporting $576.1 $579.6 $575.9 $553.6 $569.7 $587.0 $612.1 $645.8 $661.1 74.6% 78.0% 79.0% 79.2% 79.9% 83.8% 86.3% 89.9% 90.7% 60.0% 65.0% 70.0% 75.0% 80.0% 85.0% 90.0% 95.0% $480.0 $500.0 $520.0 $540.0 $560.0 $580.0 $600.0 $620.0 $640.0 $660.0 $680.0 Q1/14
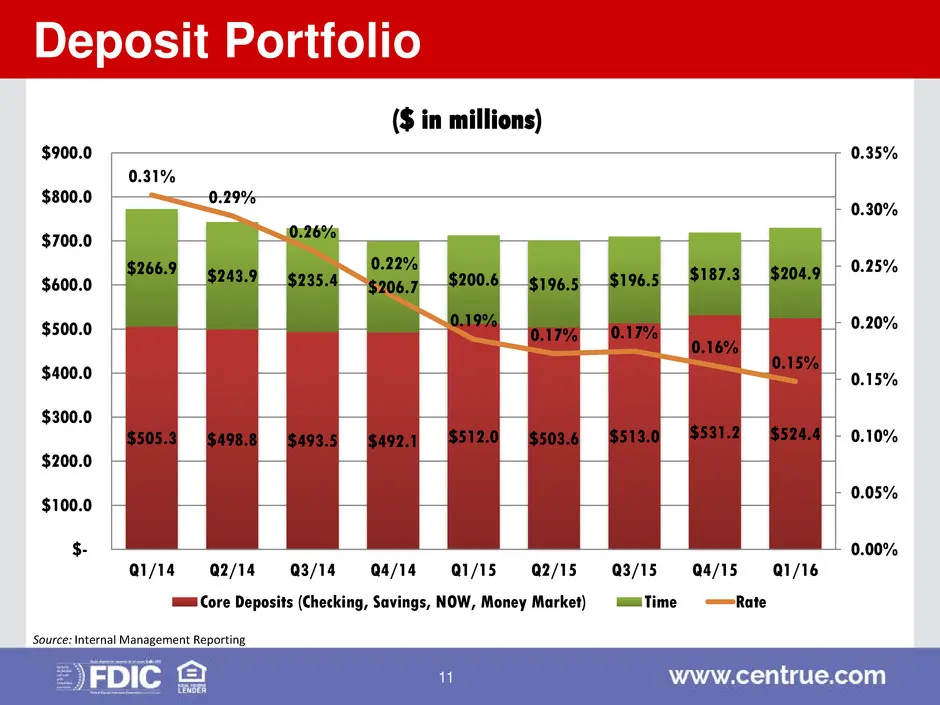
Slide 11: Deposit Portfolio
Deposit Portfolio $505.3 $498.8 $493.5 $492.1 $512.0 $503.6 $513.0 $531.2 $524.4 $266.9 $243.9 $235.4 $206.7 $200.6 $196.5 $196.5 $187.3 $204.9 0.31% 0.29% 0.26% 0.22% 0.19% 0.17% 0.17% 0.16% 0.15% 0.00% 0.05% 0.10% 0.15% 0.20% 0.25% 0.30% 0.35% $- $100.0 $200.0 $300.0 $400.0 $500.0 $600.0 $700.0 $8
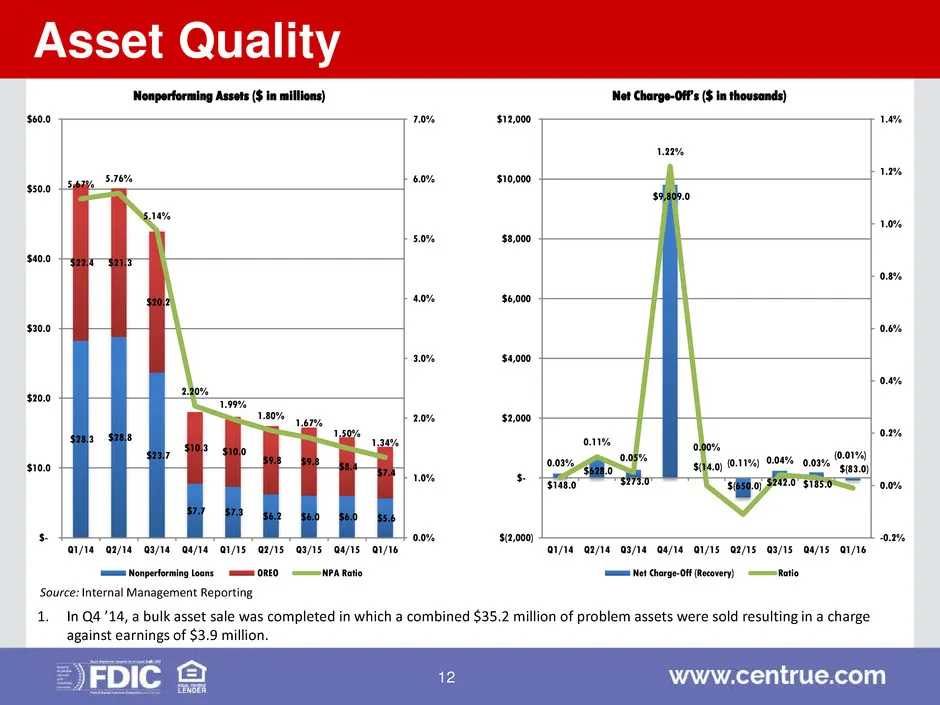
Slide 12: Asset Quality
Asset Quality Source: Internal Management Reporting $28.3 $28.8 $23.7 $7.7 $7.3 $6.2 $6.0 $6.0 $5.6 $22.4 $21.3 $20.2 $10.3 $10.0 $9.8 $9.8 $8.4 $7.4 5.67% 5.76% 5.14% 2.20% 1.99% 1.80% 1.67% 1.50% 1.34% 0.0% 1.0% 2.0% 3.0% 4.0% 5.0% 6.0% 7.0% $- $10.0 $20.0 $30.0 $40.0 $50.0 $60.0 Q1/14 Q2/14 Q3/14
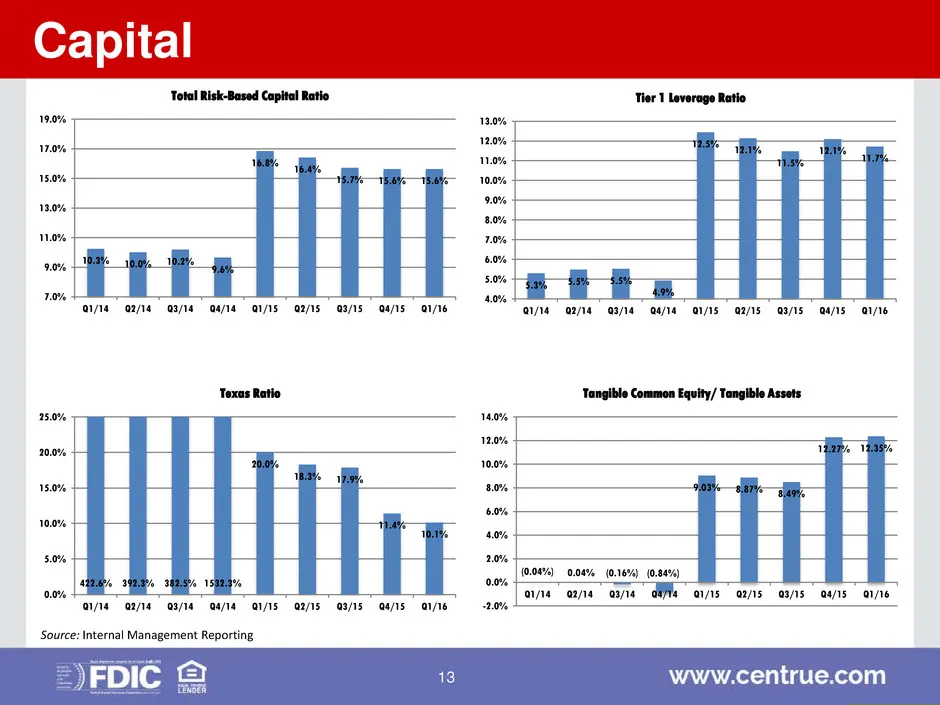
Slide 13: Capital
Capital 10.3% 10.0% 10.2% 9.6% 16.8% 16.4% 15.7% 15.6% 15.6% 7.0% 9.0% 11.0% 13.0% 15.0% 17.0% 19.0% Q1/14 Q2/14 Q3/14 Q4/14 Q1/15 Q2/15 Q3/15 Q4/15 Q1/16 Total Risk-Based Capital Ratio 5.3% 5.5% 5.5% 4.9% 12.5% 12.1% 11.5% 12.1% 11.7% 4.0% 5.0% 6.0% 7.0% 8.0% 9.0% 10.0% 11.0% 12.0% 13.0% Q1/14 Q2/1
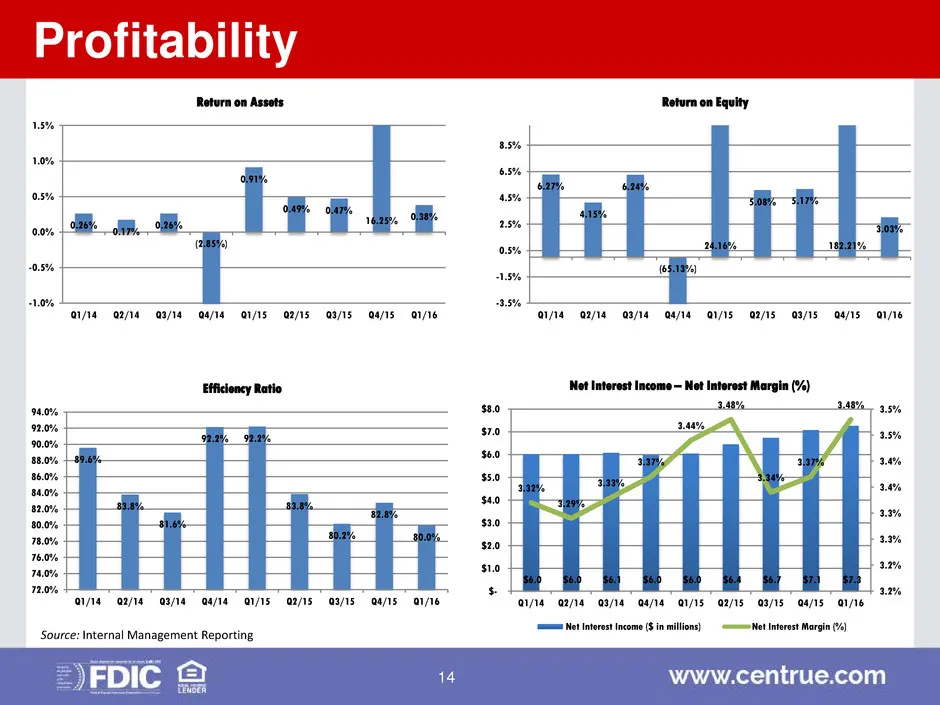
Slide 14: Profitability
Profitability 0.26% 0.17% 0.26% (2.85%) 0.91% 0.49% 0.47% 16.25% 0.38% -1.0% -0.5% 0.0% 0.5% 1.0% 1.5% Q1/14 Q2/14 Q3/14 Q4/14 Q1/15 Q2/15 Q3/15 Q4/15 Q1/16 Return on Assets 89.6% 83.8% 81.6% 92.2% 92.2% 83.8% 80.2% 82.8% 80.0% 72.0% 74.0% 76.0% 78.0% 80.0% 82.0% 84.0% 86.0% 88.0% 90.0% 92.0% 94.0%
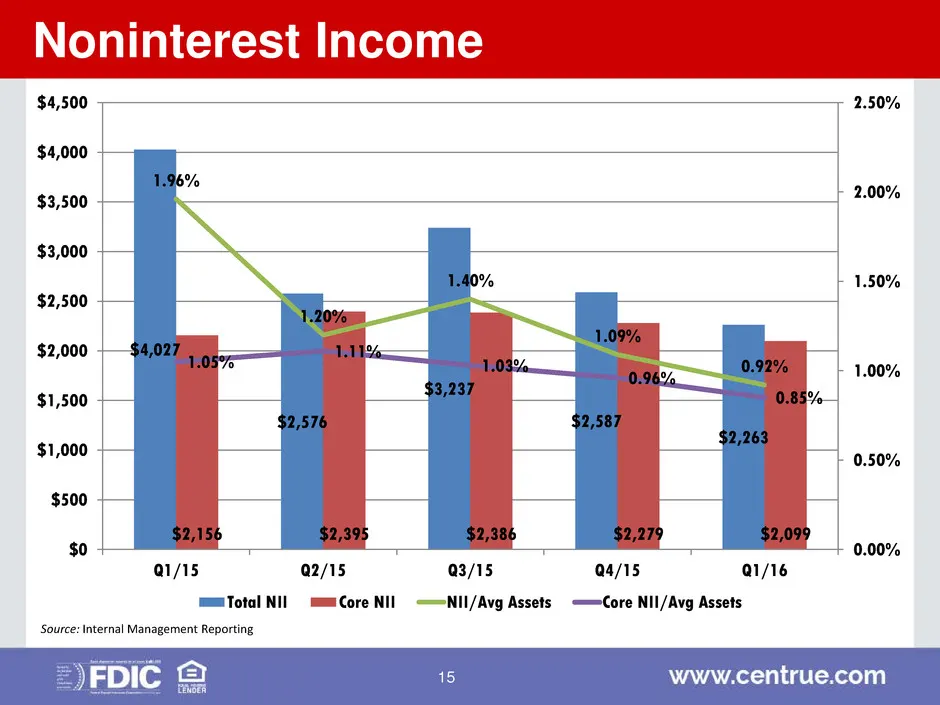
Slide 15: Noninterest Income
Noninterest Income Source: Internal Management Reporting $4,027 $2,576 $3,237 $2,587 $2,263 $2,156 $2,395 $2,386 $2,279 $2,099 1.96% 1.20% 1.40% 1.09% 0.92% 1.05% 1.11% 1.03% 0.96% 0.85% 0.00% 0.50% 1.00% 1.50% 2.00% 2.50% $0 $500 $1,000 $1,500 $2,000 $2,500 $3,000 $3,500 $4,000 $4,500 Q1/15 Q2/15 Q
Slide 16: Noninterest Expense
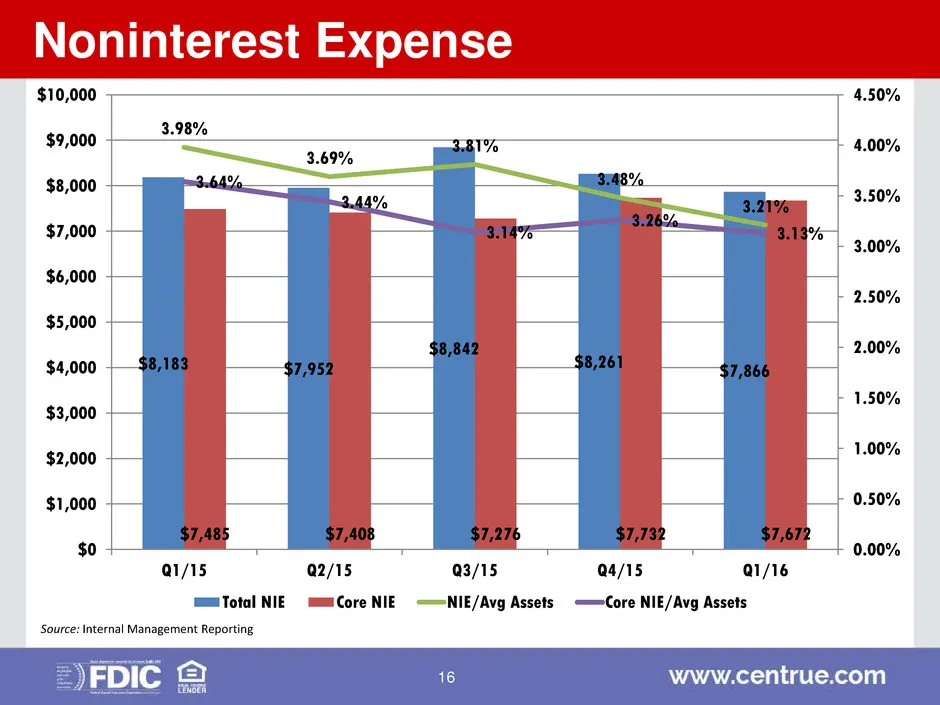
Noninterest Expense Source: Internal Management Reporting $8,183 $7,952 $8,842 $8,261 $7,866 $7,485 $7,408 $7,276 $7,732 $7,672 3.98% 3.69% 3.81% 3.48% 3.21% 3.64% 3.44% 3.14% 3.26% 3.13% 0.00% 0.50% 1.00% 1.50% 2.00% 2.50% 3.00% 3.50% 4.00% 4.50% $0 $1,000 $2,000 $3,000 $4,000 $5,000 $6,000 $7,000
Slide 17: Stock Price
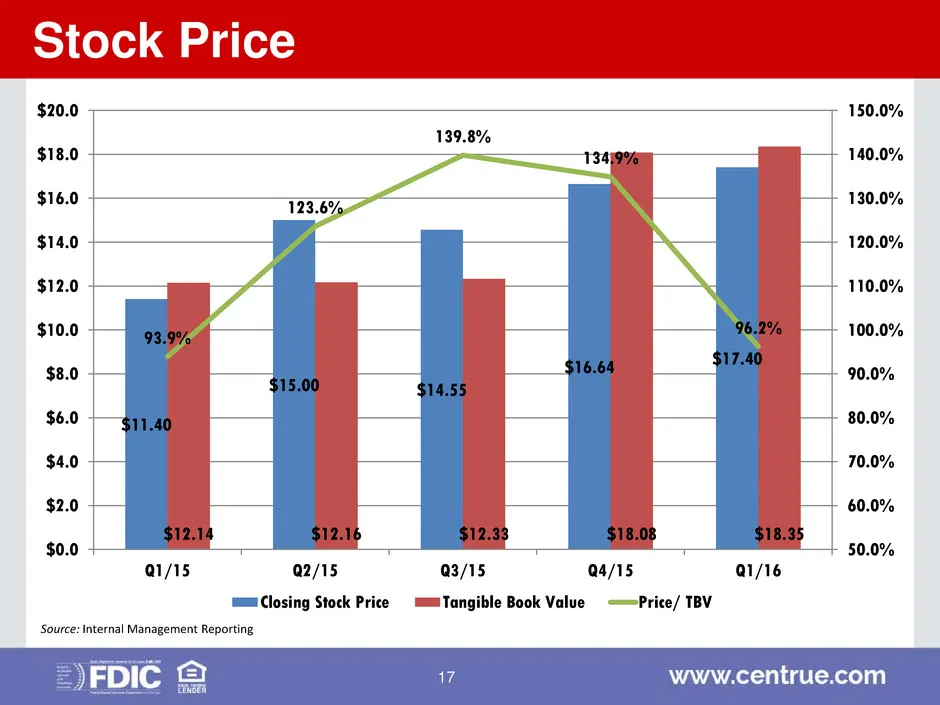
Stock Price $11.40 $15.00 $14.55 $16.64 $17.40 $12.14 $12.16 $12.33 $18.08 $18.35 93.9% 123.6% 139.8% 134.9% 96.2% 50.0% 60.0% 70.0% 80.0% 90.0% 100.0% 110.0% 120.0% 130.0% 140.0% 150.0% $0.0 $2.0 $4.0 $6.0 $8.0 $10.0 $12.0 $14.0 $16.0 $18.0 $20.0 Q1/15 Q2/15 Q3/15 Q4/15 Q1/16 Closing Stock Price Ta
Slide 18: Review of Branch Footprint
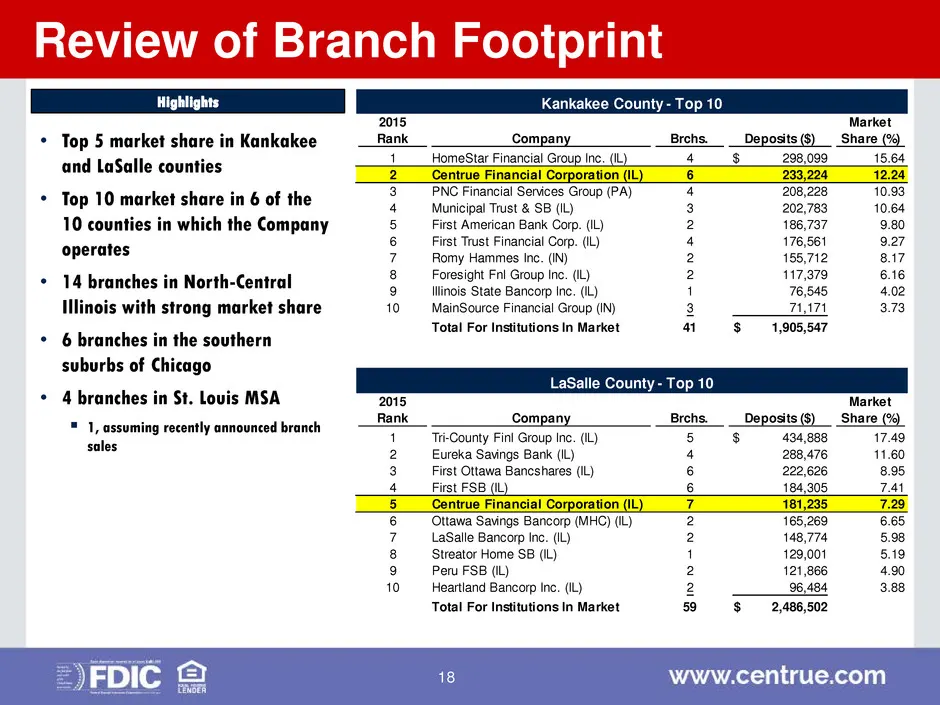
Review of Branch Footprint • Top 5 market share in Kankakee and LaSalle counties • Top 10 market share in 6 of the 10 counties in which the Company operates • 14 branches in North-Central Illinois with strong market share • 6 branches in the southern suburbs of Chicago • 4 branches in St. Louis MSA
Slide 19: Branch Franchise
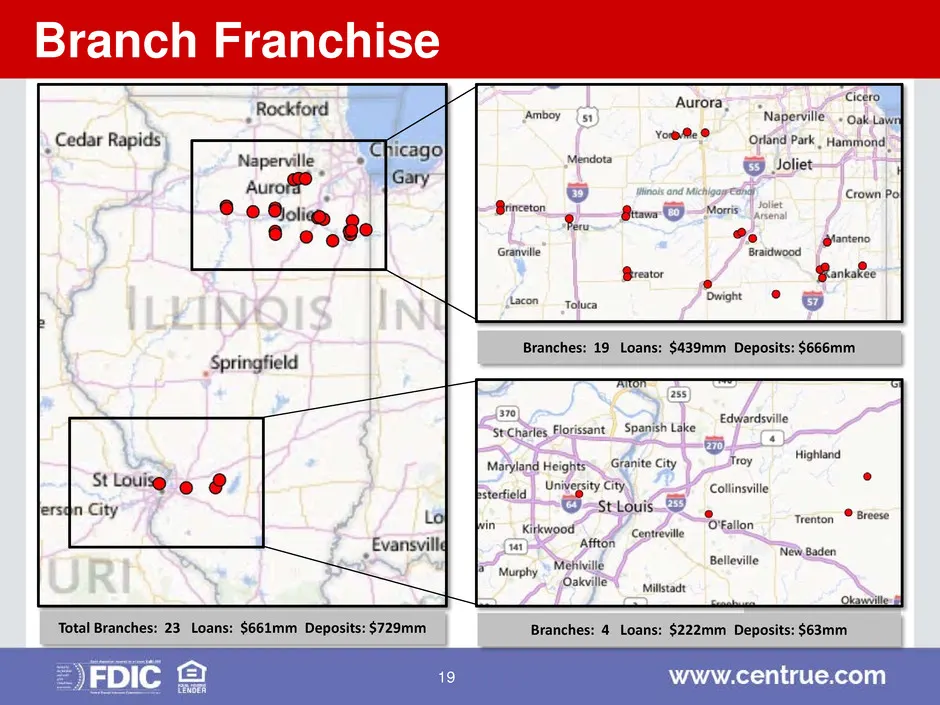
Branches: 19 Loans: $439mm Deposits: $666mm Branches: 4 Loans: $222mm Deposits: $63mm Total Branches: 23 Loans: $661mm Deposits: $729mm Branch Franchise 19
Slide 20: Scorecard – Previous Two Years
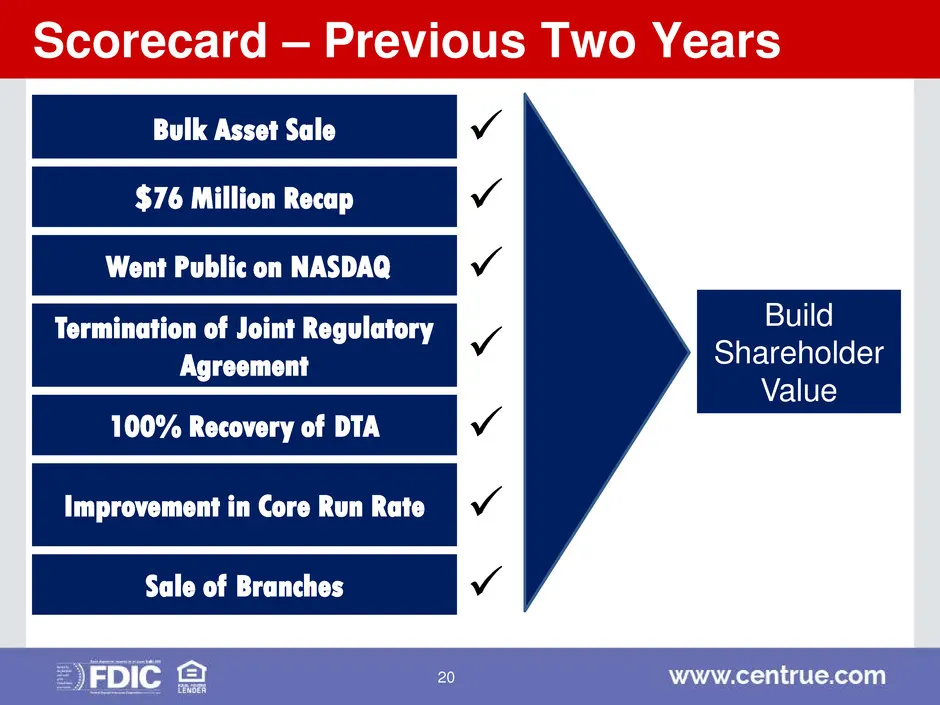
Scorecard – Previous Two Years Bulk Asset Sale $76 Million Recap Went Public on NASDAQ Termination of Joint Regulatory Agreement 100% Recovery of DTA Improvement in Core Run Rate Sale of Branches Build Shareholder Value 20
Slide 21: Strategic Priorities
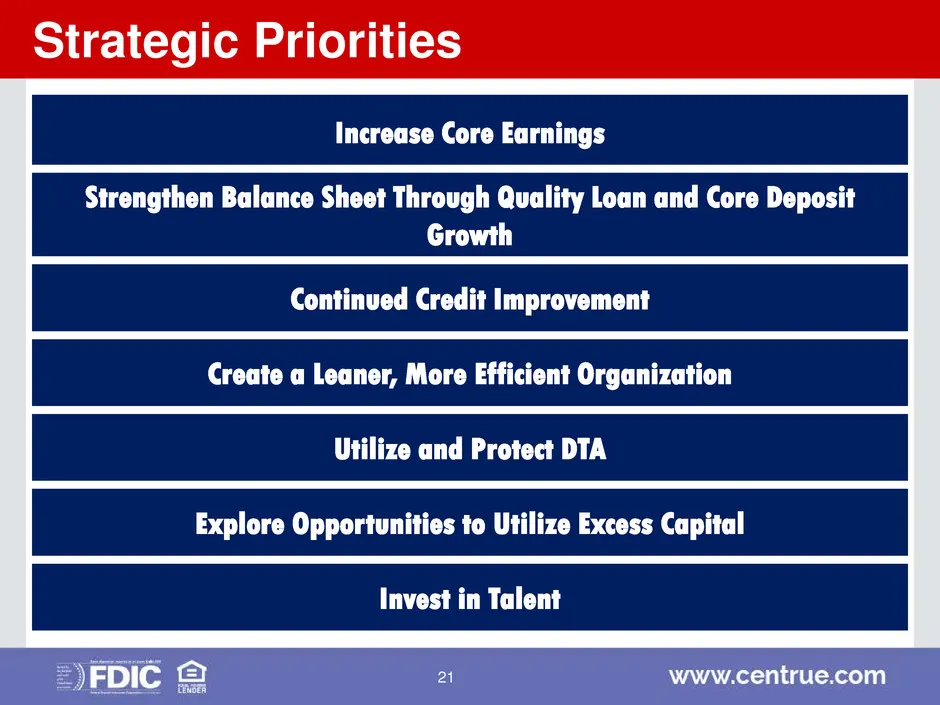
Strategic Priorities Increase Core Earnings Strengthen Balance Sheet Through Quality Loan and Core Deposit Growth Continued Credit Improvement Create a Leaner, More Efficient Organization Utilize and Protect DTA Explore Opportunities to Utilize Excess Capital Invest in Talent 21
Source: SEC EDGAR · 8-K filed May 2, 2016