The Pantry — Pantry — William Blair & Co. Growth Stock Conference 2009
22 slides from The Pantry's conference presentation, Jun 9, 2009
Slide 1: William Blair & Co. Growth Stock Conference
William Blair & Co. Growth Stock Conference Frank G. Paci, EVP, Business Operations and CFO June 9, 2009 0

Slide 2: Safe Harbor Statement
Safe Harbor Statement Some of the statements in this presentation constitute “forward-looking statements” within the meaning of the Private Securities Litigation Reform Act of 1995. All statements other than those of historical facts included herein, including those related to the company’s financia
Slide 3: Key Investment Highlights
Leading market positions in attractive Southeastern markets Significant scale advantages vs. primary competitors Leveraging infrastructure to drive profitability and future growth Attractive sector growth and consolidation potential Key Investment Highlights Strong Cash Flow Generation to Reinvest i
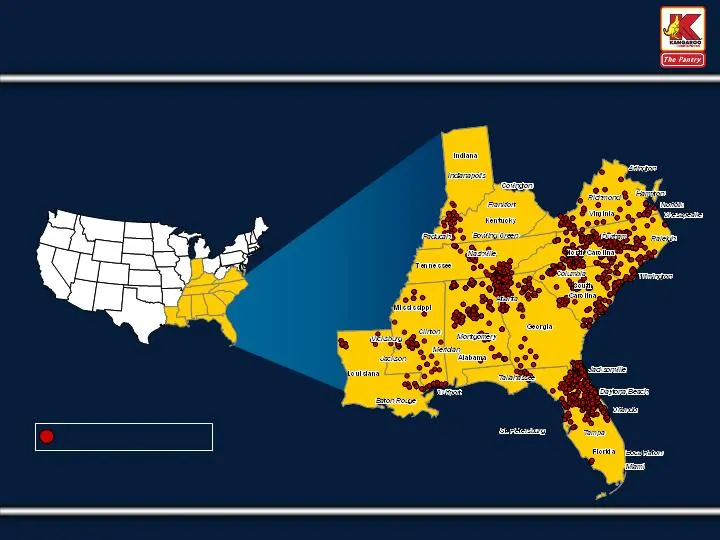
Slide 4: Leading Convenience Store Retailer Concentrated in the Southeastern United States
1,643 Stores Located in Eleven Southeastern States as of June 2, 2009 Leading Convenience Store Retailer Concentrated in the Southeastern United States Pantry Store Locations _____________________ Note: Map as of fiscal year ended September 25, 2008. 3 PA0021GM_1.WOR NY0010DP_1.WOR
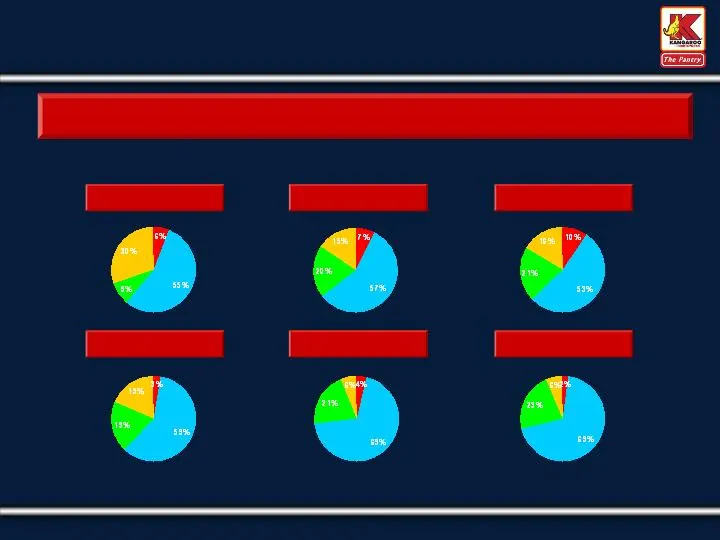
Slide 5: High Degree of Fragmentation Provides Continued Consolidation Opportunities
High Degree of Fragmentation Provides Continued Consolidation Opportunities _____________________ (1) Source: U.S. Convenience 2008 Store Count (Gas Only) from NACS/TDLinx (2) Pantry store counts as of June 2, 2009. More than 50% of the stores in key markets are single store operators Pantry 1 Store
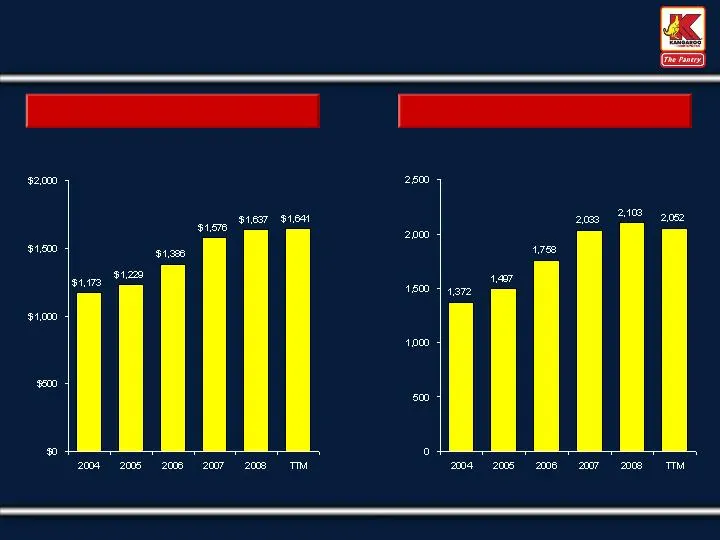
Slide 6: Strong Track Record of Growth
Merchandise Revenue ($ in mm) (Gallons in mm) Fiscal Year Fiscal Year _____________________ Note: Trailing twelve months (TTM) as of March 26, 2009. Retail Gas Gallons Sold Strong Track Record of Growth… 5
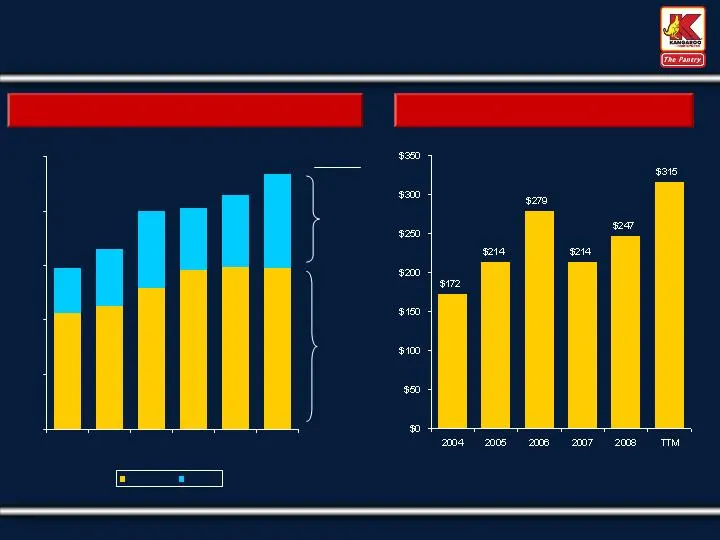
Slide 7: And Substantial EBITDA Generation
Reported EBITDA Gross Profit Fiscal Year Fiscal Year _____________________ Note: Trailing twelve months (TTM) as of March 26, 2009. ($ in mm) ($ in mm) …And Substantial EBITDA Generation ’04-’08 CAGR 12.3% 8.8% Merchandise Gasoline $591 $663 $799 $811 $858 $935 $0 $200 $400 $600 $800 $1,000 2004 200
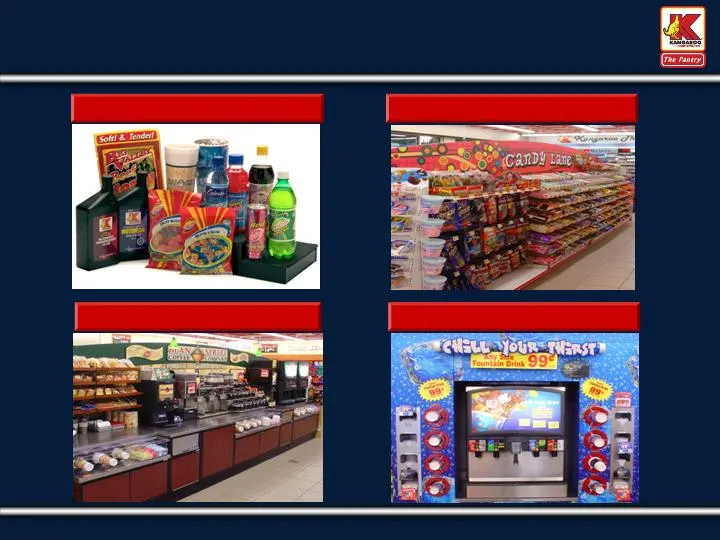
Slide 8: Proprietary Merchandise and Beverage Concepts Drive Revenue and Margins
Private Label Bean Street Coffee Proprietary Merchandise and Beverage Concepts Drive Revenue and Margins Candy Lane The Chill Zone 7
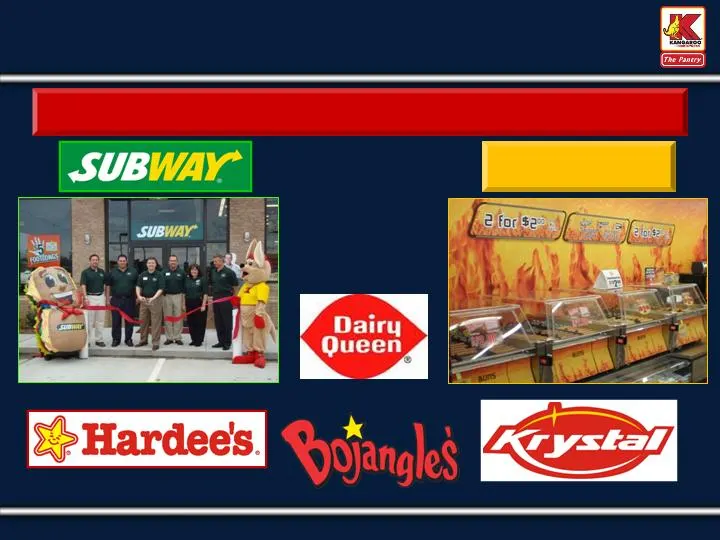
Slide 9: Food Service Offering Drives Traffic and Margins
We are Targeting to Improve the Contribution from Food Service in our Stores Food Service Offering Drives Traffic and Margins Grill Depot 8
Slide 10: Superior Merchandise Offering Leads to Above Average Margins
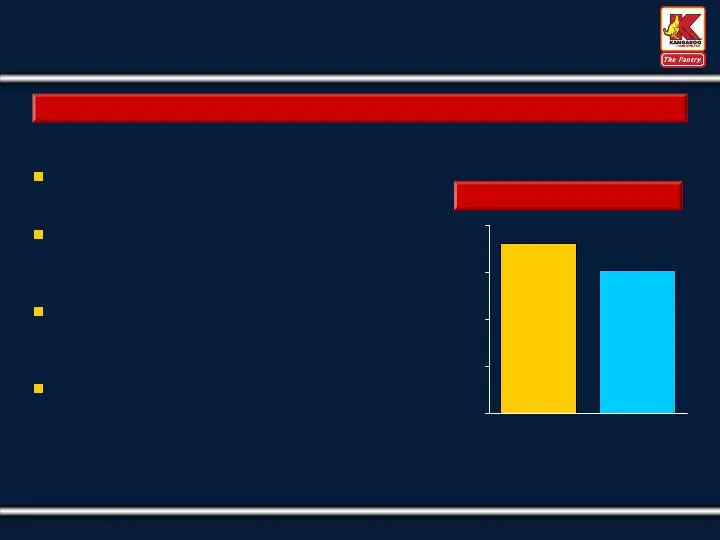
Superior Merchandise Offering Leads to Above Average Margins _____________________ Note: Trailing twelve months (TTM) as of March 26, 2009. (1) Industry average for 2007 based on the 2008 NACS State of the Industry Report. Consistently Strong Merchandise Margins Proprietary branded offerings Private
Slide 11: Gasoline Strategy Maximizes Fuel Gross Profit Dollars
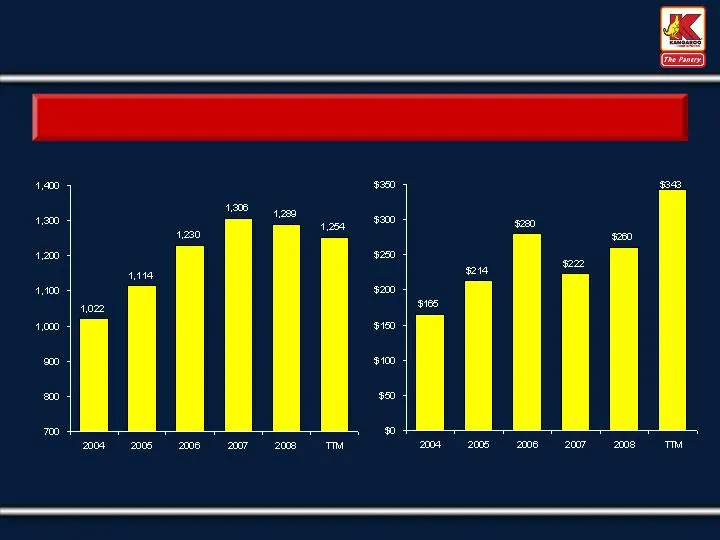
We Balance Average Gallons Sold Per Store and Gasoline Margins to Maximize Overall Gross Profit Dollars Gasoline Strategy Maximizes Fuel Gross Profit Dollars Average Gallons Sold per Store Retail Gasoline Gross Profit $ Fiscal Year Fiscal Year _____________________ Note: Trailing twelve months (TTM)
Slide 12: Volatility in Oil and Gas Prices Continues
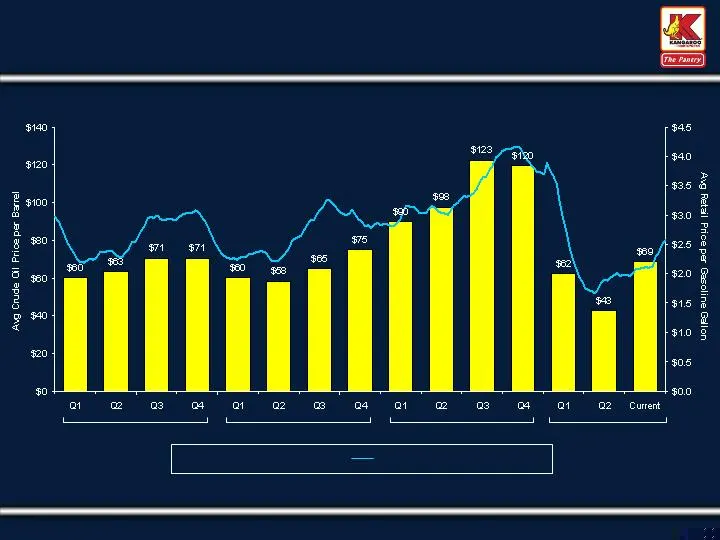
Note: Fiscal year ends in September. Source: Energy Information Administration. Data represents daily average futures contract price per barrel of light sweet crude (contract 1) and national weekly average retail price per gasoline gallon (excluding diesel). Current for the crude price is 6/2/09 and
Slide 13: Gasoline CPG Can Be Volatile on a Quarterly Basis
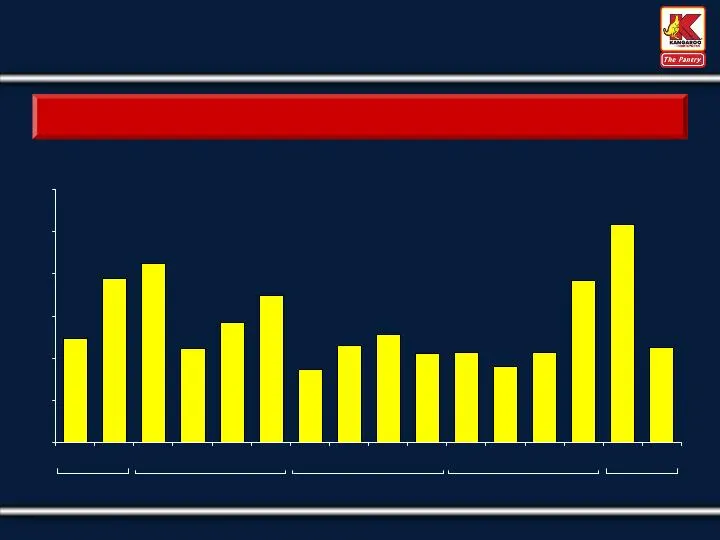
Energy Market Volatility Impacts Margin Our Quarterly Retail Gasoline CPG (Net of Credit Card Fees and Repairs and Maintenance) FY2005 FY2006 Gasoline CPG Can Be Volatile on a Quarterly Basis… FY2007 FY2008 FY2009 12.3 ¢ 19.4 ¢ 21.2 ¢ 11.1 ¢ 14.1 ¢ 17.4 ¢ 8.7 ¢ 11.5 ¢ 12.8 ¢ 10.5 ¢ 10.6 ¢ 9.0 ¢ 10.7
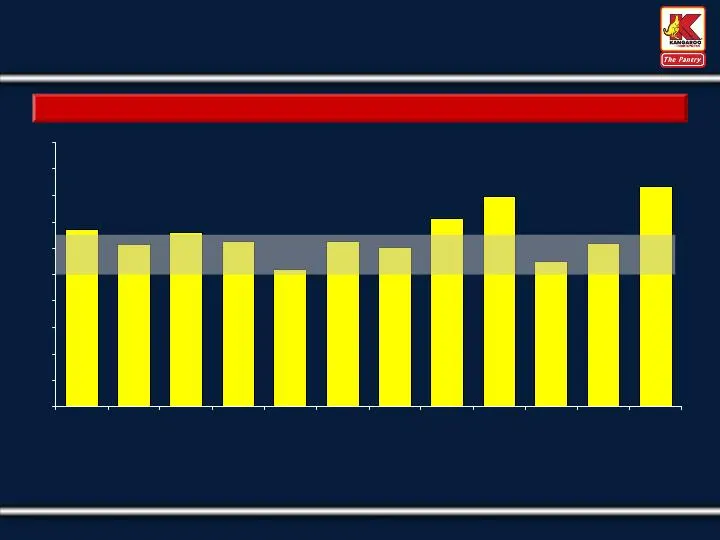
Slide 14: But Annual CPG Tends to Remain Relatively Stable
13.4 ¢ 12.3 ¢ 13.2 ¢ 12.5 ¢ 10.4 ¢ 12.5 ¢ 12.0 ¢ 14.3 ¢ 15.9 ¢ 10.9 ¢ 12.4 ¢ 16.7 ¢ 0 ¢ 2 ¢ 4 ¢ 6 ¢ 8 ¢ 10 ¢ 12 ¢ 14 ¢ 16 ¢ 18 ¢ 20 ¢ 1998 1999 2000 2001 2002 2003 2004 2005 2006 2007 2008 TTM Fiscal Year _____________________ Note: Trailing twelve months (TTM) as of March 26, 2009. Shaded area repr
Slide 15: Current Operating Initiatives Intended to Address Challenging Environment
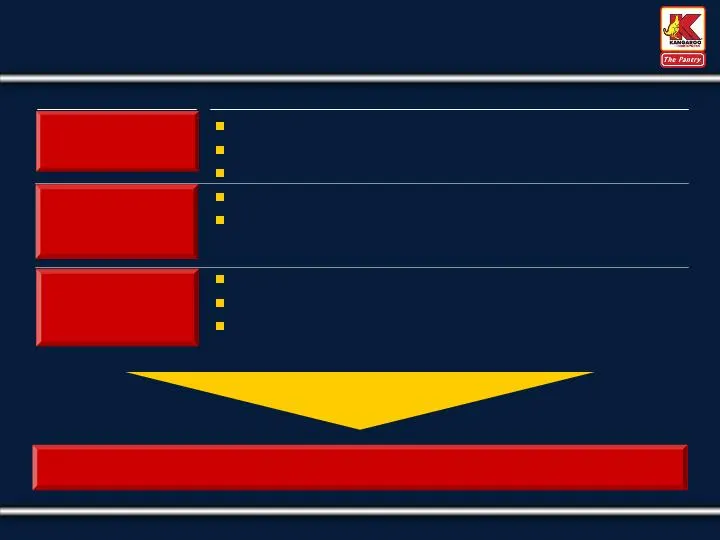
Current Operating Initiatives Intended to Address Challenging Environment and Improve Strategic Flexibility Return to Growth Focus We Believe These Actions Have Better Positioned Us to Leverage Our Operating Model and Drive Top-line and Earnings Growth when the Market Environment Improves Consumer H

Slide 16: Financial Flexibility
Meaningful liquidity $243 million in cash-on-hand $225 million revolver – $0 drawn, over $145 million available after LOCs Long-term debt profile; earliest maturity is the convertible debt in November 2012 Covenant-light bank facility (1) 6.5x Adj. Net Debt / EBITDAR Leverage – Currently 4.06x 2.25x

Slide 17: A Balanced Strategy
A Balanced Strategy... Announced agreement to purchase 39 stores from Herndon Oil Corp. Represents Company’s initial entry into Mobile, AL market 32 stores include the underlying real estate Stores operate under a variety of names, including the Flamingo banner $189 million in revenue for fiscal yea

Slide 18: Fiscal 2009 Guidance Ranges
Merchandise revenues – Between 1.62 and 1.66 billion Merchandise gross margin – Between 35.4% and 36.0% Retail gas gallons – Approximately 2.02 to 2.05 billion gallons Retail gas margin – 14 to 15.5 cents per gallon Operating, general and administrative expenses - $617 to $623 million Depreciation &
Slide 19: Key Investment Highlights
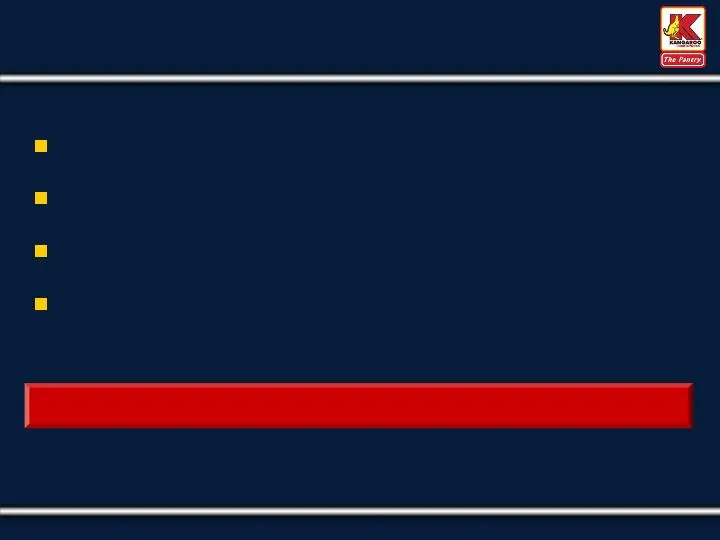
Leading market positions in attractive Southeastern markets Significant scale advantages vs. primary competitors Leveraging infrastructure to drive profitability and future growth Attractive sector growth and consolidation potential Key Investment Highlights Strong Cash Flow Generation to Reinvest i
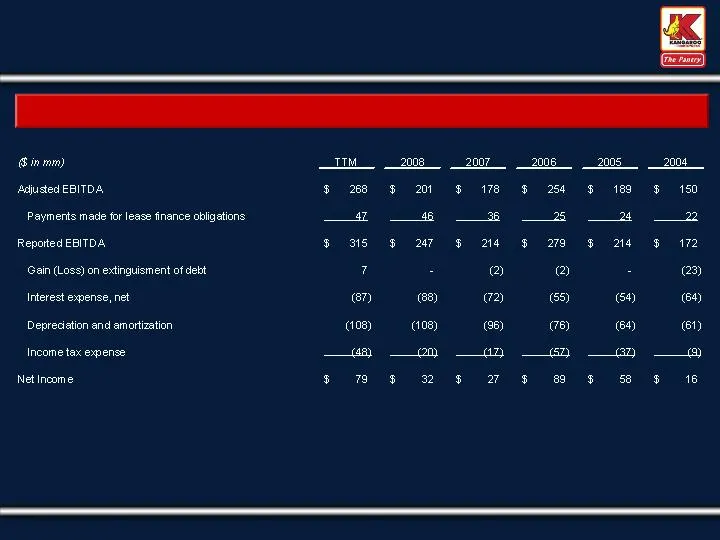
Slide 20: Adjusted EBITDA/EBITDA Reconciled to Net Income
Adjusted EBITDA/EBITDA Reconciled to Net Income Reconciliation of Non-GAAP Measures _____________________ Note: Trailing twelve months (TTM) as of March 26, 2009. 19
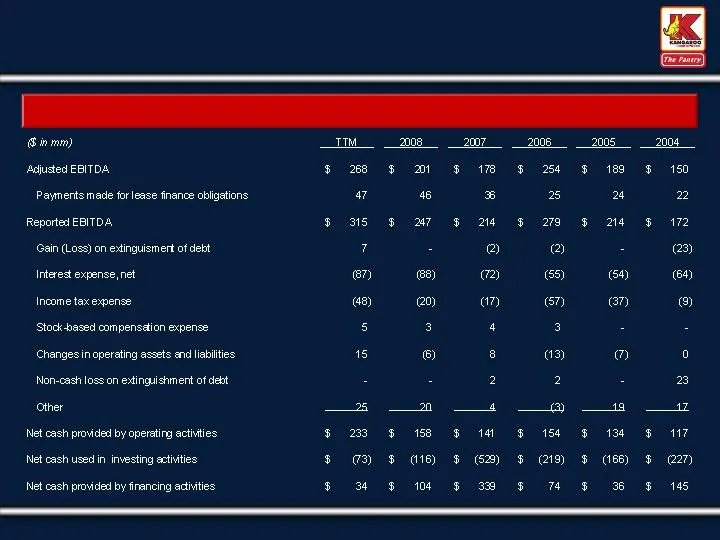
Slide 21: Adjusted EBITDA/EBITDA Reconciled to Cash Flows
Adjusted EBITDA/EBITDA Reconciled to Cash Flows Reconciliation of Non-GAAP Measures _____________________ Note: Trailing twelve months (TTM) as of March 26, 2009. 20
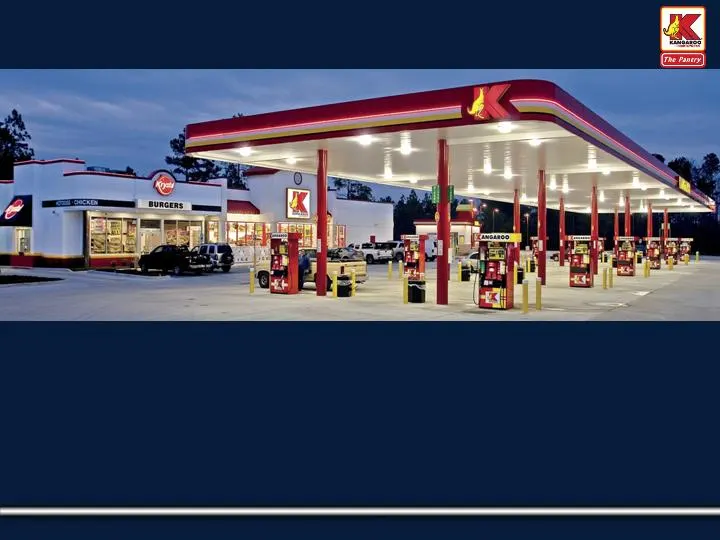
Slide 22: The Pantry, Inc.
The Pantry, Inc. 21
Source: SEC EDGAR · 8-K filed Jun 9, 2009
More decks from The Pantry Inc
 Q4 FY2014 Earnings Presentation25 slides · Dec 9, 2014
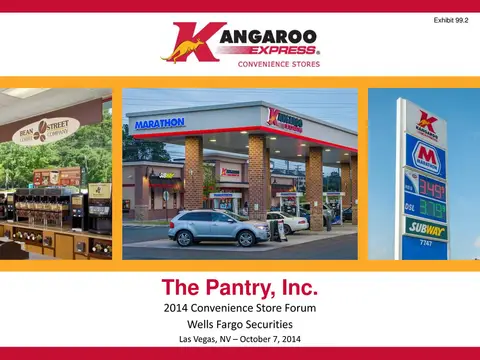 2014 Convenience Store Forum (Wells Fargo Securities)21 slides · Oct 7, 2014
 Q3 FY2014 Earnings Presentation25 slides · Jul 30, 2014
 Q2 FY2014 Earnings Presentation24 slides · May 1, 2014
 Proxy Contest (February 2014)44 slides · Feb 20, 2014
 Proxy Contest (February 2014)49 slides · Feb 19, 2014