Spirit Realty Capital — Q3 2020 Earnings Presentation
20 slides from Spirit Realty Capital's earnings presentation, Nov 2, 2020
Slide 1: Supplemental Financial & Operating Information, Third Quarter Ended September 30, 2020
Supplemental Financial & Operating Information third QUARTER ENDED September 30, 2020 Exhibit 99.2
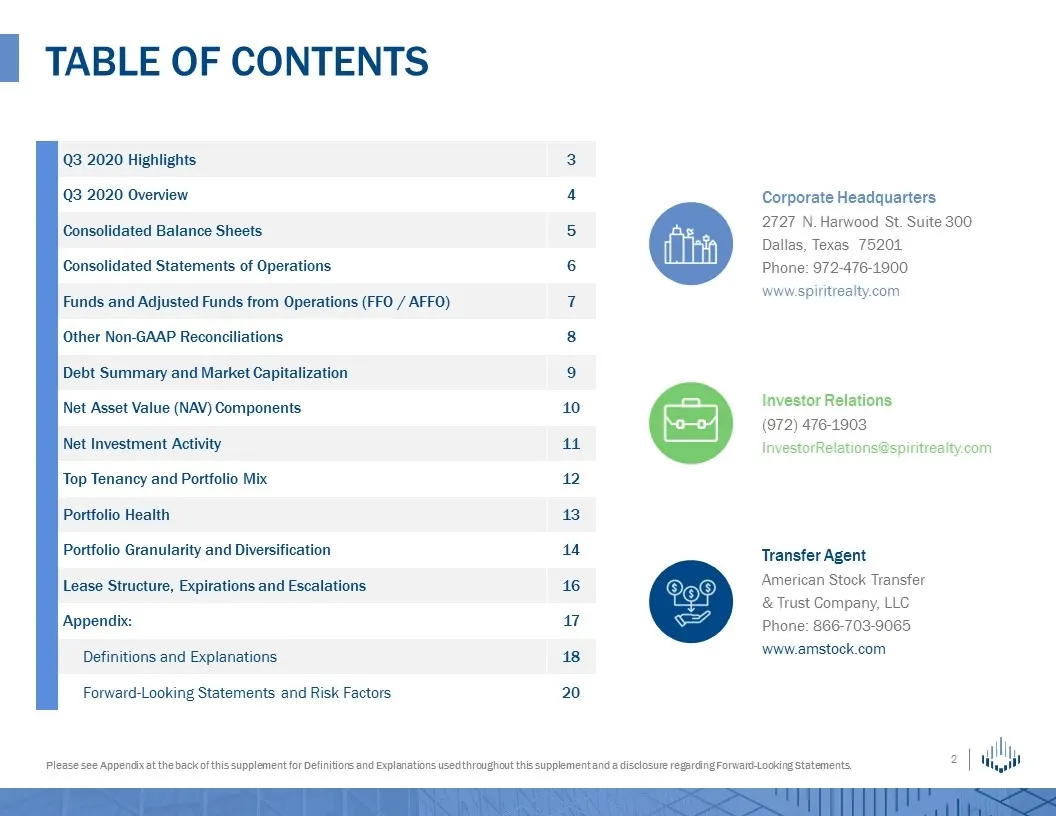
Slide 2: Table of Contents
Q3 2020 Highlights 3 Q3 2020 Overview 4 Consolidated Balance Sheets 5 Consolidated Statements of Operations 6 Funds and Adjusted Funds from Operations (FFO / AFFO) 7 Other Non-GAAP Reconciliations 8 Debt Summary and Market Capitalization 9 Net Asset Value (NAV) Components 10 Net Investment Activity
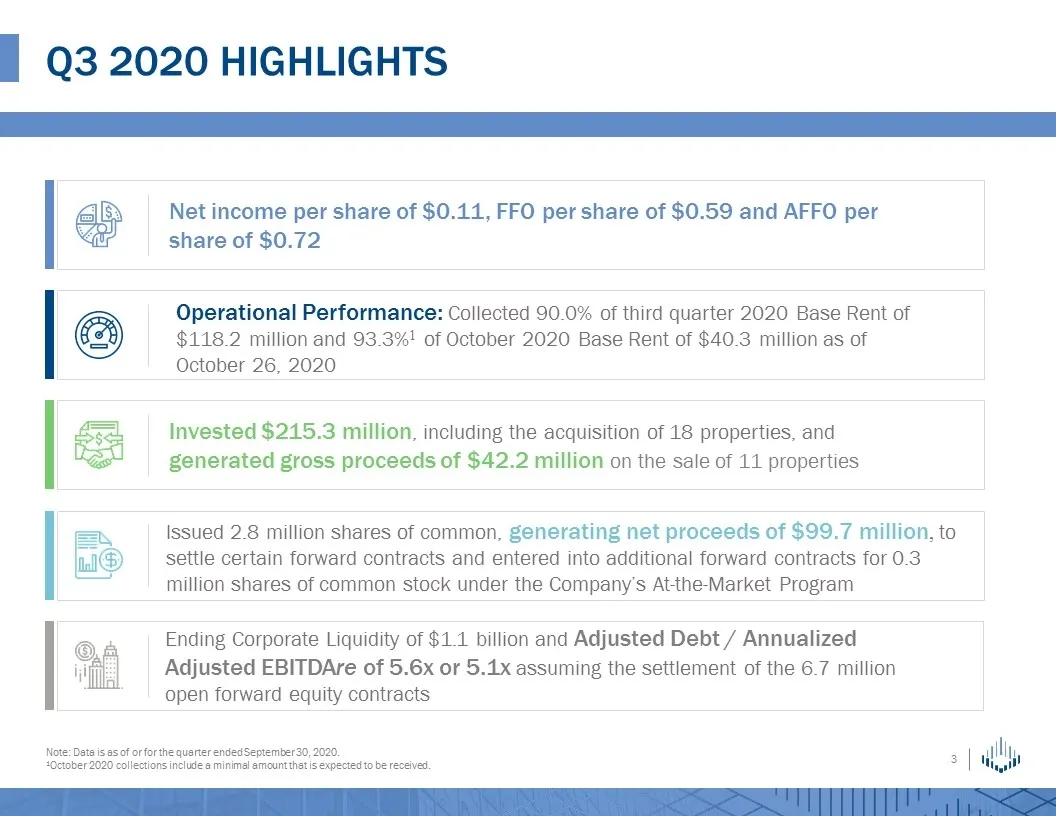
Slide 3: Q3 2020 Highlights
Q3 2020 highlights Net income per share of $0.11, FFO per share of $0.59 and AFFO per share of $0.72 Operational Performance: Collected 90.0% of third quarter 2020 Base Rent of $118.2 million and 93.3%1 of October 2020 Base Rent of $40.3 million as of October 26, 2020 Invested $215.3 million, includ
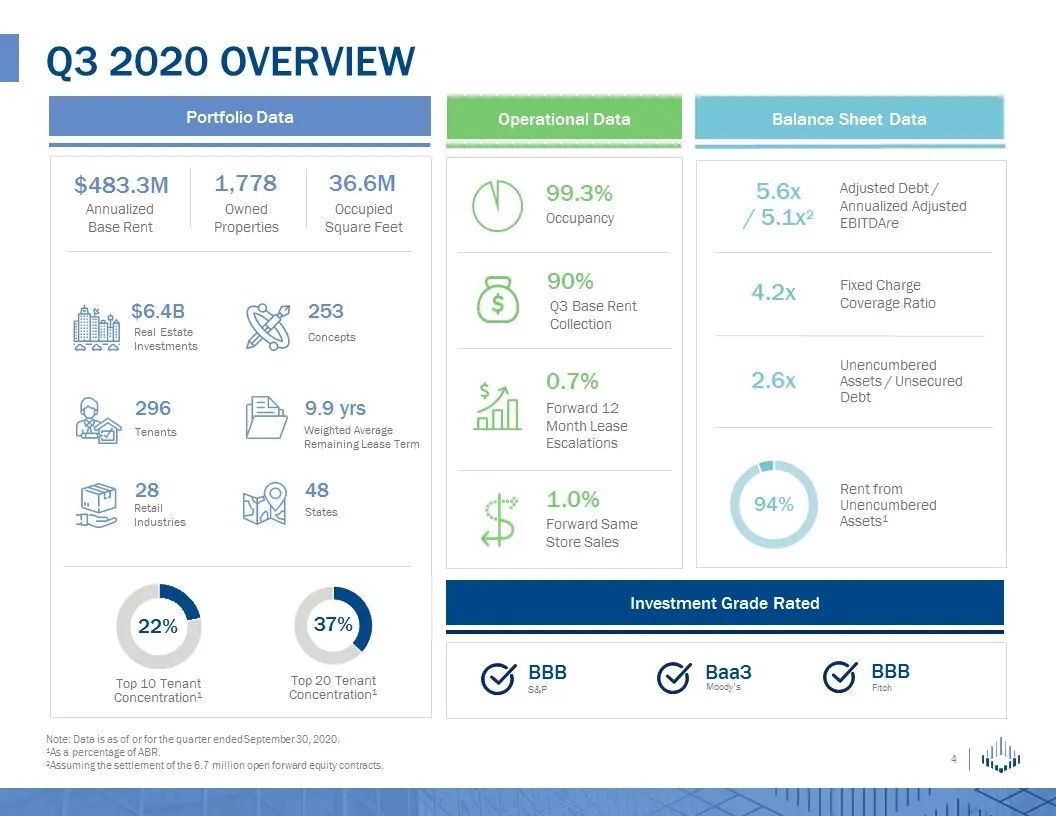
Slide 4: Q3 2020 Overview
Q3 2020 Overview Portfolio Data Operational Data Balance Sheet Data $483.3M 1,778 Owned Properties 296 Tenants 28 Retail Industries 37% Top 10 Tenant Concentration1 BBB S&P BBB Fitch 22% Investment Grade Rated Baa3 Moody’s 1.0% Forward Same Store Sales Annualized Base Rent Top 20 Tenant Concentratio
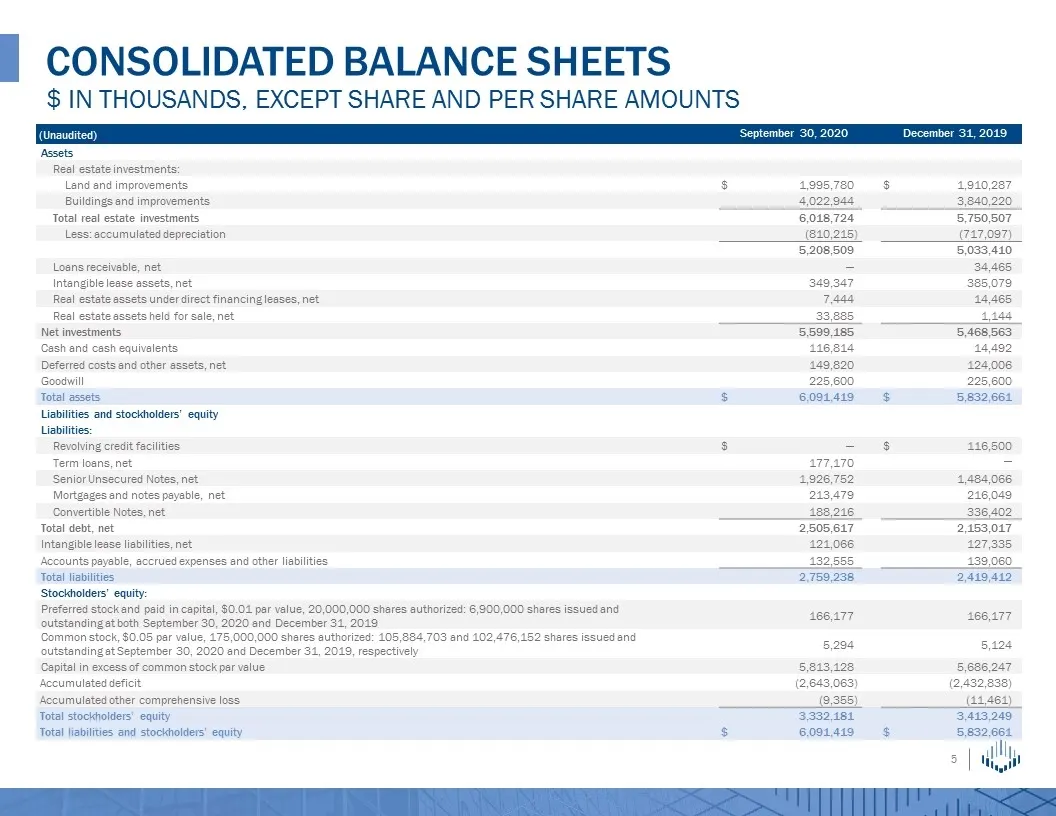
Slide 5: Consolidated Balance Sheets
(Unaudited) September 30, 2020 March 31, 2019 December 31, 2019 December 31, 2018 Assets Real estate investments: Land and improvements $ 1,995,780 $ 1,910,287 Buildings and improvements 4,022,944 3,840,220 Total real estate investments 6,018,724 5,750,507 Less: accumulated depreciation (810,215 ) (
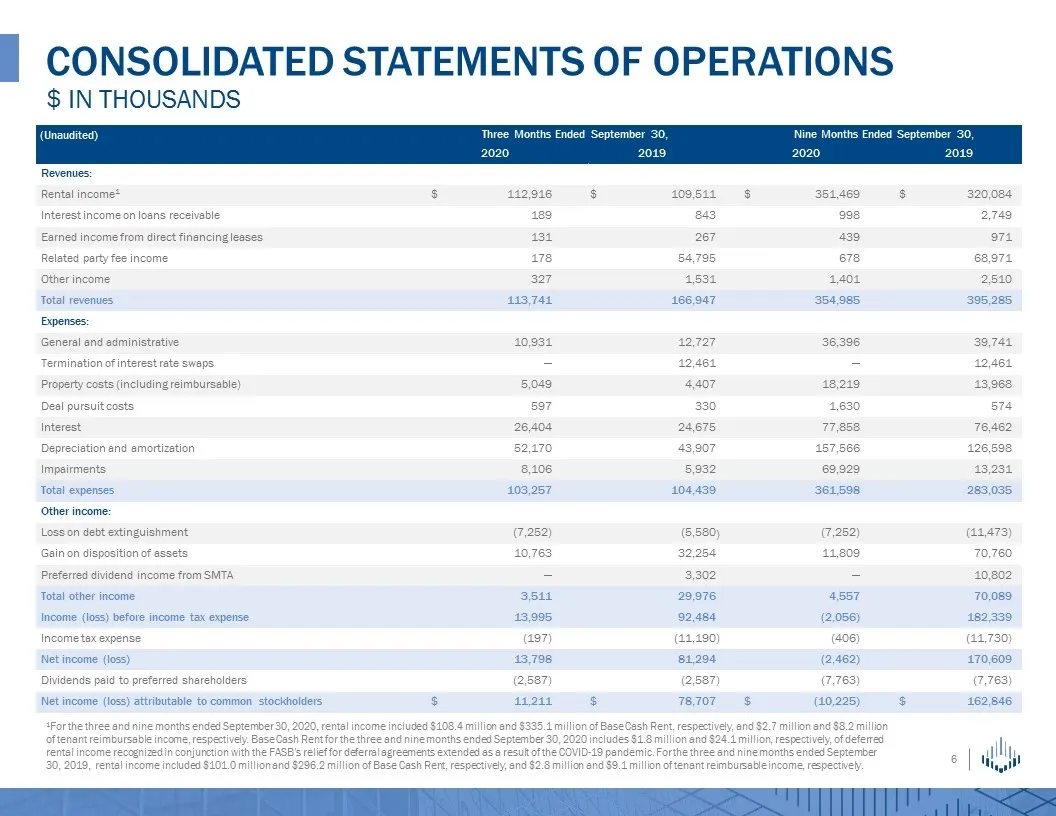
Slide 6: Consolidated Statements of Operations
(Unaudited) Three Months Ended September 30, Three Months Ended March 31, Nine Months Ended September 30, Three Months Ended March 31, 2020 2019 2019 2018 2020 2019 2019 2018 Revenues: Rental income1 $ 104,067 112,916 $ 98,236 109,511 $ 104,067 351,469 $ 98,236 320,084 Interest income on loans recei
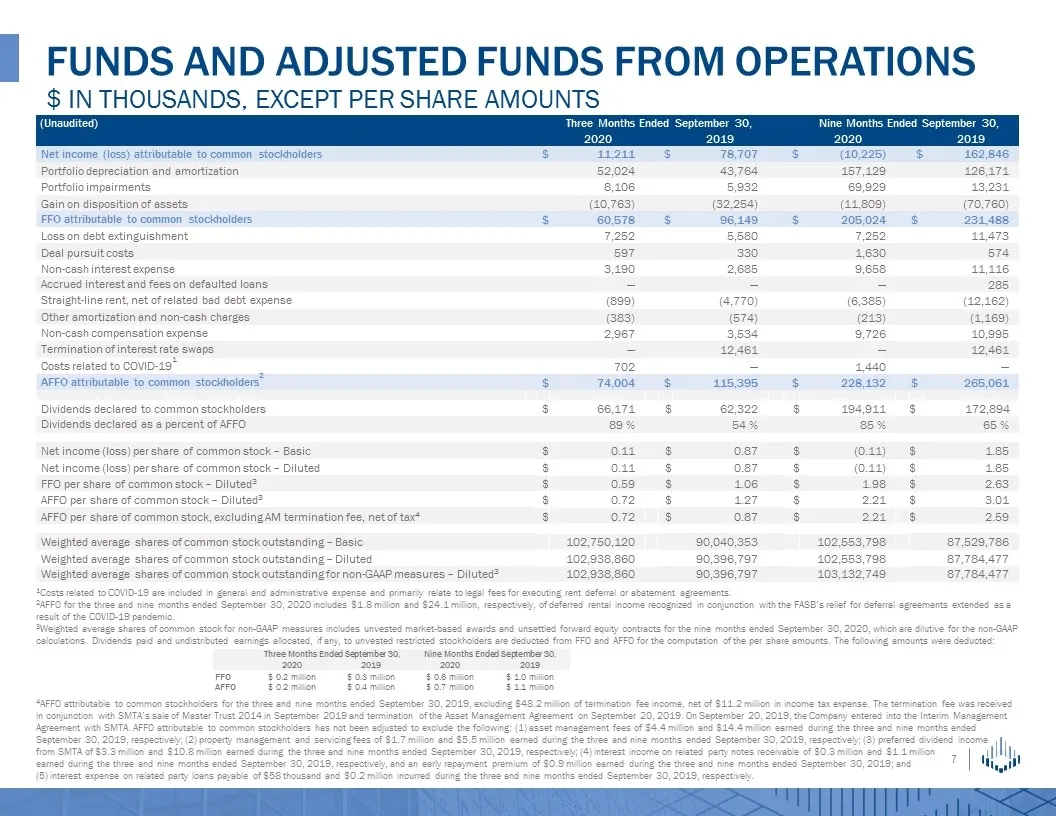
Slide 7: Funds and Adjusted Funds from Operations (FFO / AFFO)
(Unaudited) Three Months Ended September 30, Nine Months Ended September 30, 2020 2019 2020 2019 Net income (loss) attributable to common stockholders $ 11,211 $ 78,707 $ (10,225) $ 162,846 Portfolio depreciation and amortization 52,024 43,764 157,129 126,171 Portfolio impairments 8,106 5,932 69,929
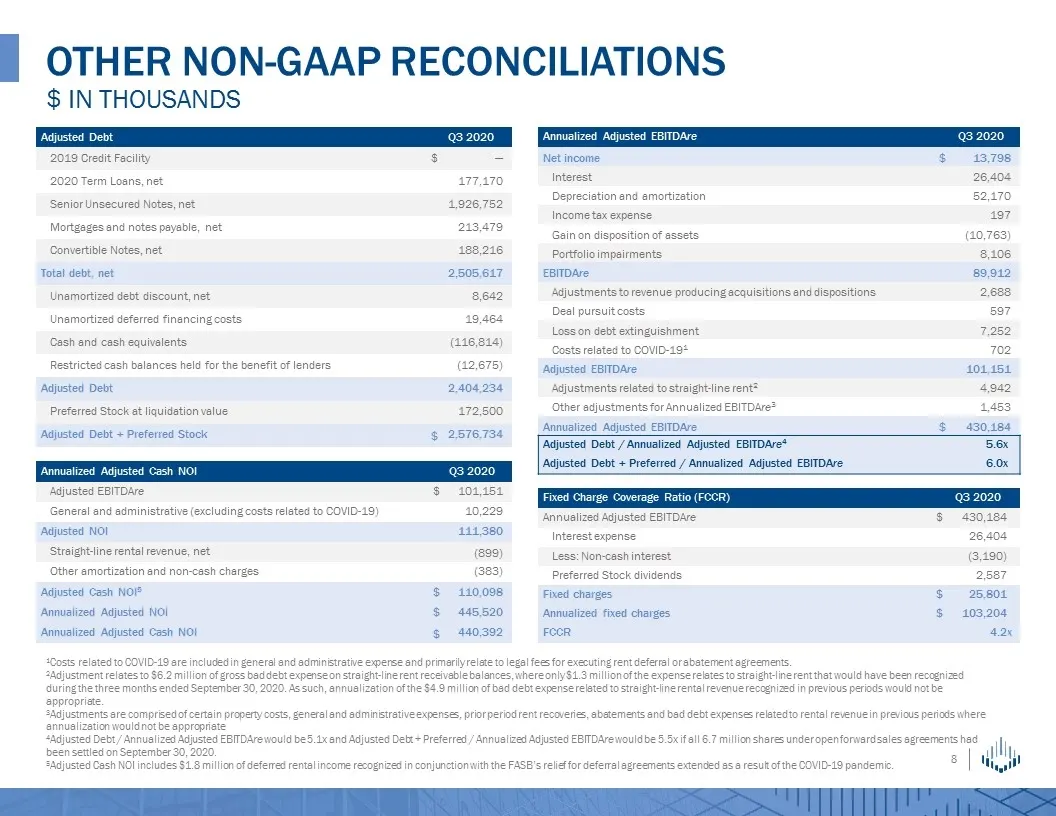
Slide 8: Other Non-GAAP Reconciliations
Annualized Adjusted EBITDAre Q3 2020 Q1 2019 Net income $ 13,798 Interest 26,404 Depreciation and amortization 52,170 Income tax expense 197 Gain on disposition of assets (10,763) Portfolio impairments 8,106 EBITDAre 89,912 Adjustments to revenue producing acquisitions and dispositions 2,688 Deal pu
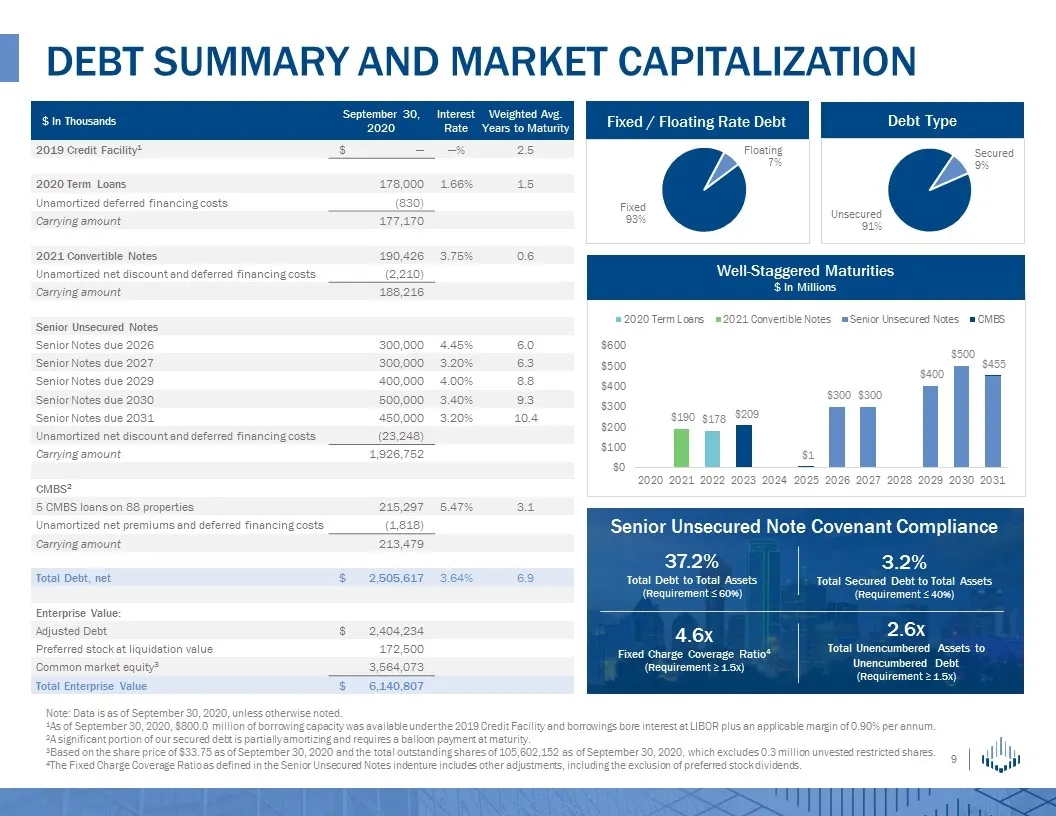
Slide 9: Debt Summary and Market Capitalization
Debt Summary and Market Capitalization Note: Data is as of September 30, 2020, unless otherwise noted. 1As of September 30, 2020, $800.0 million of borrowing capacity was available under the 2019 Credit Facility and borrowings bore interest at LIBOR plus an applicable margin of 0.90% per annum. 2A s
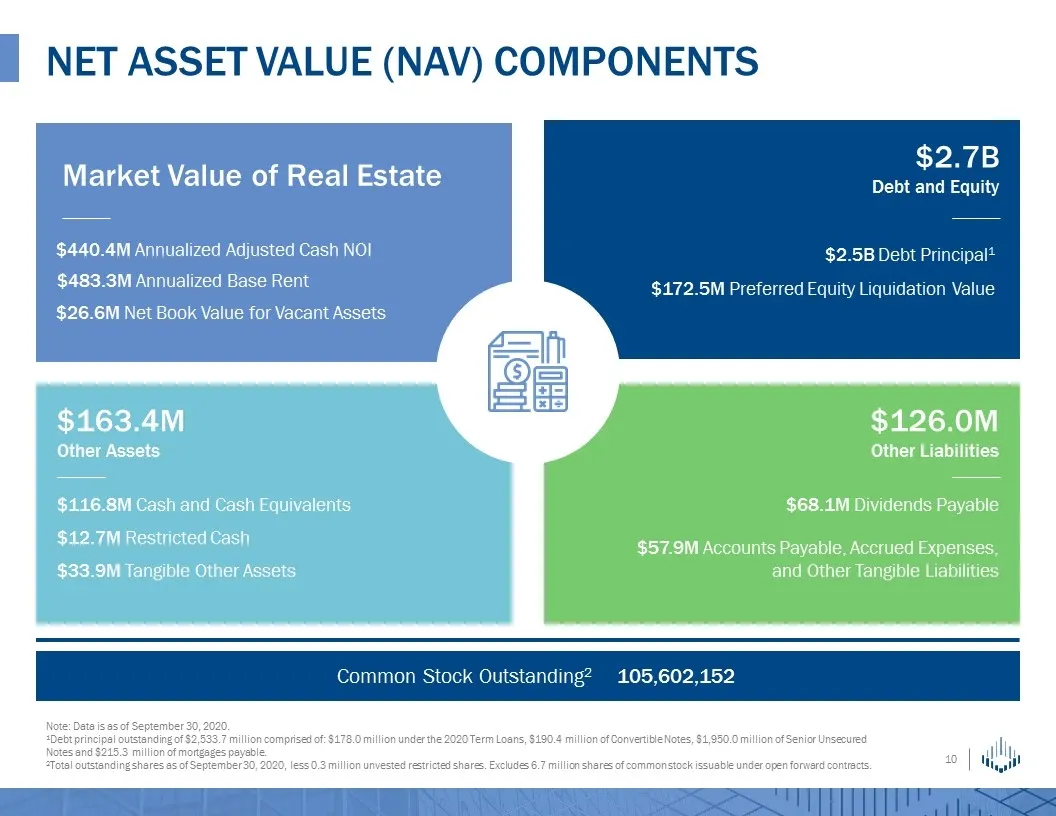
Slide 10: Net Asset Value (NAV) Components
Net Asset Value (NAV) Components Common Stock Outstanding2 105,602,152 Market Value of Real Estate $2.7B Debt and Equity $163.4M Other Assets $126.0M Other Liabilities $483.3M Annualized Base Rent $26.6M Net Book Value for Vacant Assets $2.5B Debt Principal1 $172.5M Preferred Equity Liquidation Valu
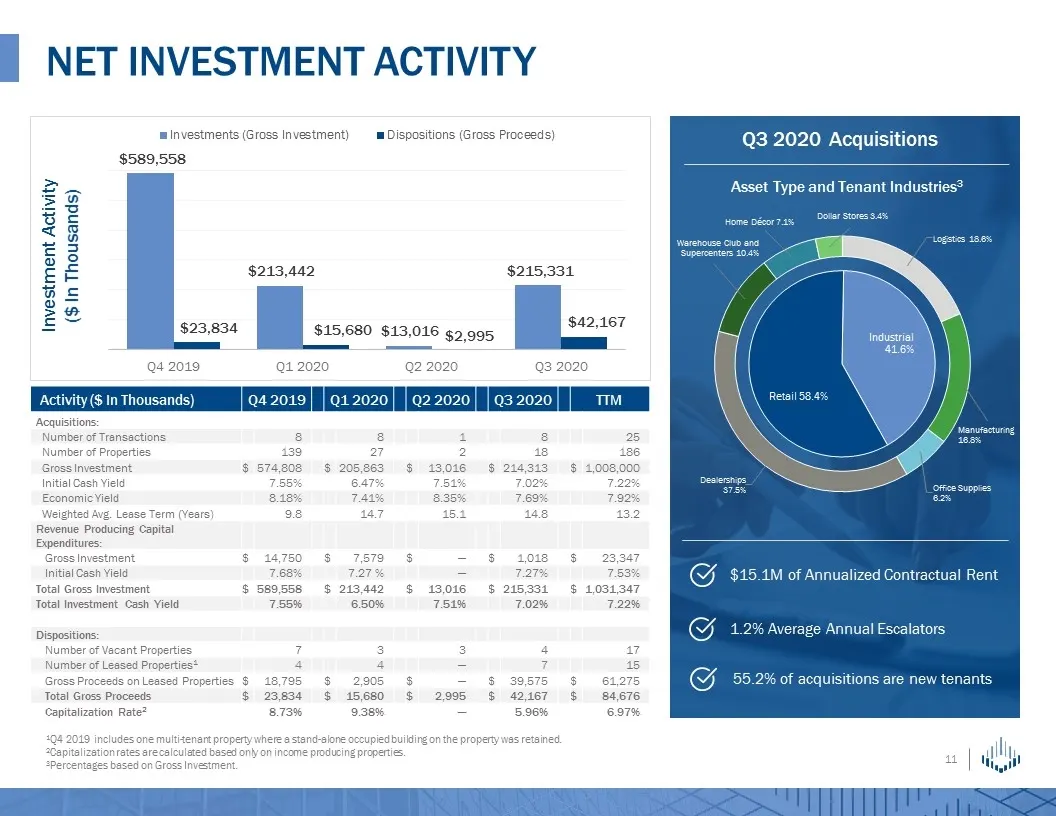
Slide 11: Net Investment Activity
NET INVESTMENT ACTIVITY Investment Activity ($ In Thousands) Activity ($ In Thousands) Q4 2019 Q1 2020 Q2 2020 Q3 2020 TTM Acquisitions: Number of Transactions 8 8 1 8 25 Number of Properties 139 27 2 18 186 Gross Investment $ 574,808 $ 205,863 $ 13,016 $ 214,313 $ 1,008,000 Initial Cash Yield 7.55%
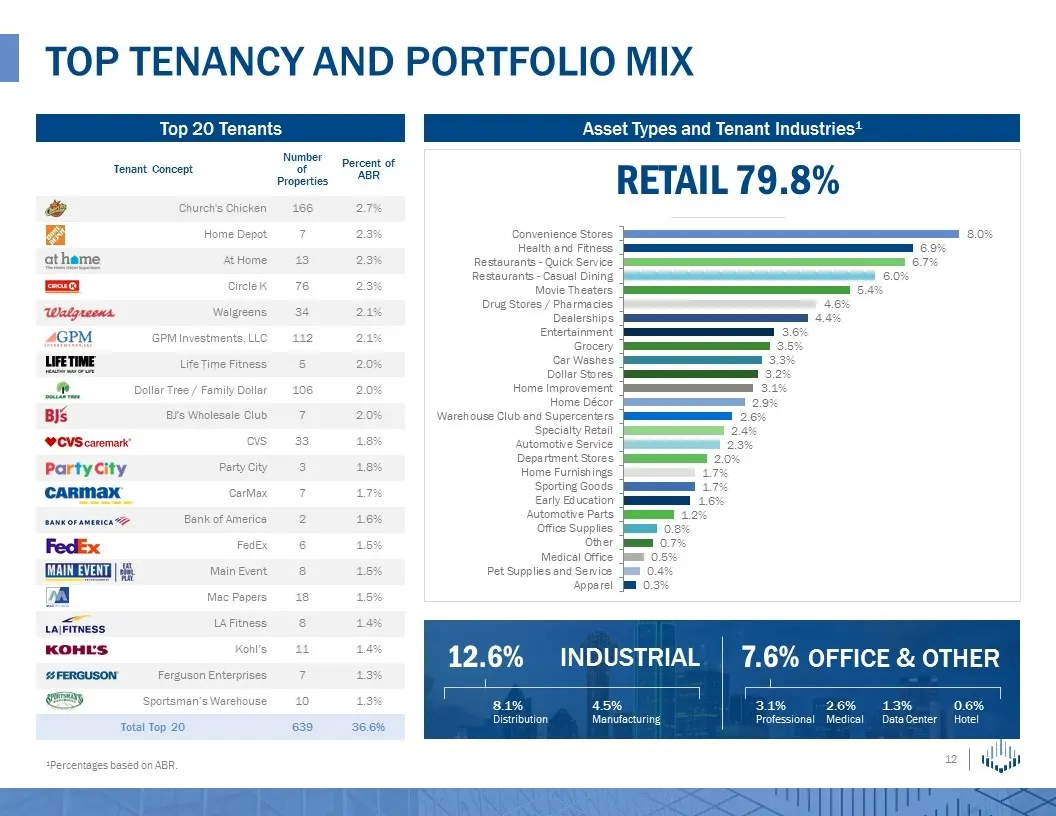
Slide 12: Top Tenancy and Portfolio Mix
Tenant Concept Number of Properties Percent of ABR Church's Chicken 166 2.7% Home Depot 7 2.3% At Home 13 2.3% Circle K 76 2.3% Walgreens 34 2.1% GPM Investments, LLC 112 2.1% Life Time Fitness 5 2.0% Dollar Tree / Family Dollar 106 2.0% BJ's Wholesale Club 7 2.0% CVS 33 1.8% Party City 3 1.8% CarMa
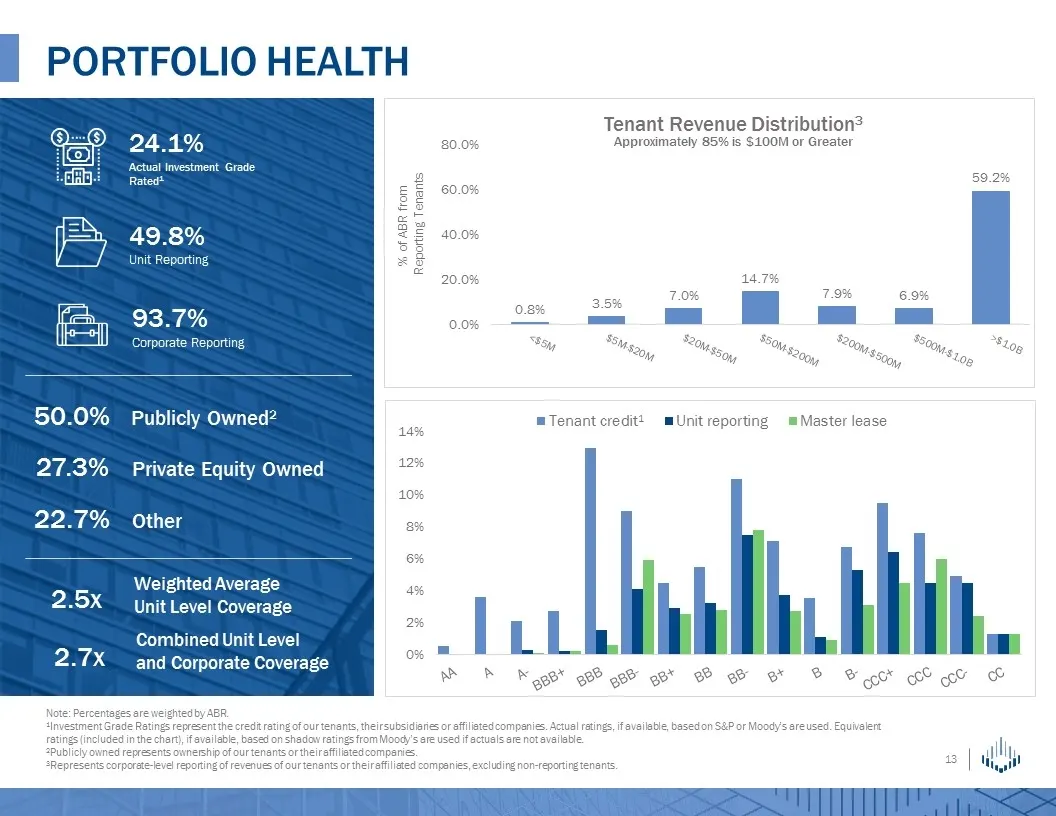
Slide 13: Portfolio Health
Portfolio Health Actual Investment Grade Rated1 24.1% 49.8% Unit Reporting 93.7% Corporate Reporting Combined Unit Level and Corporate Coverage 2.7x Weighted Average Unit Level Coverage 2.5x Other 22.7% Publicly Owned2 50.0% Private Equity Owned 27.3% % of ABR from Reporting Tenants Note: Percentage
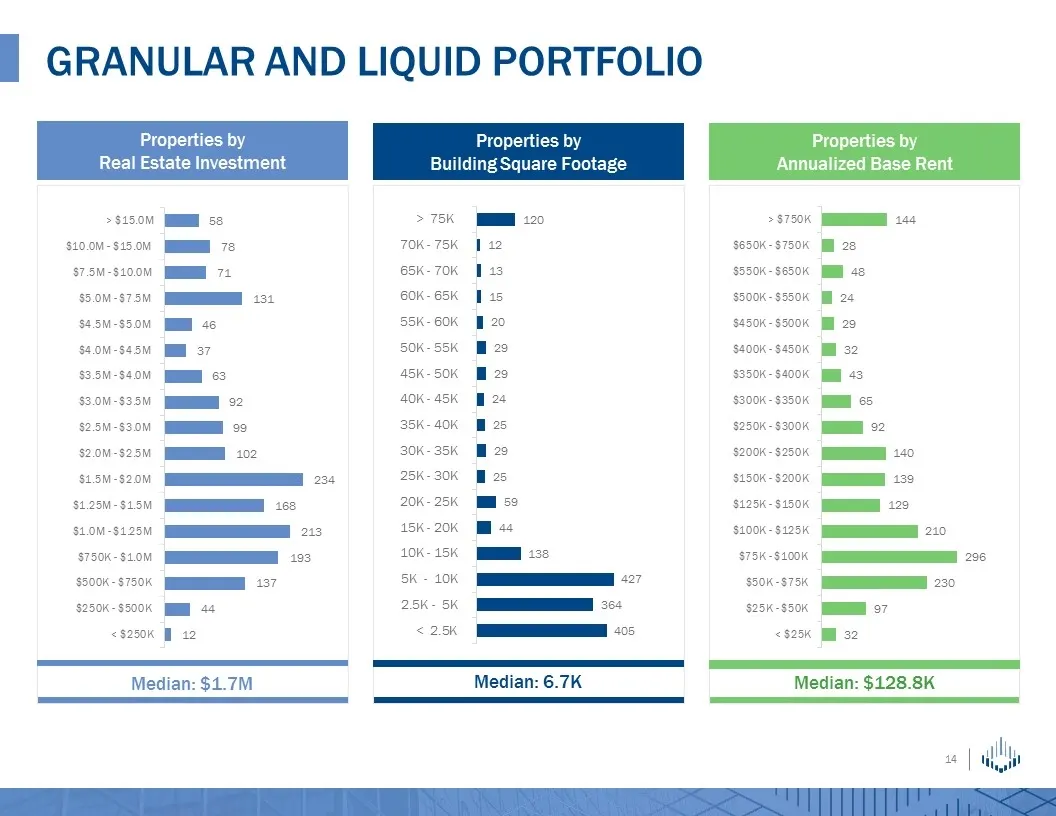
Slide 14: Granular and Liquid Portfolio
Granular and Liquid Portfolio Properties by Real Estate Investment Properties by Building Square Footage Properties by Annualized Base Rent Median: 6.7K Median: $128.8K Median: $1.7M
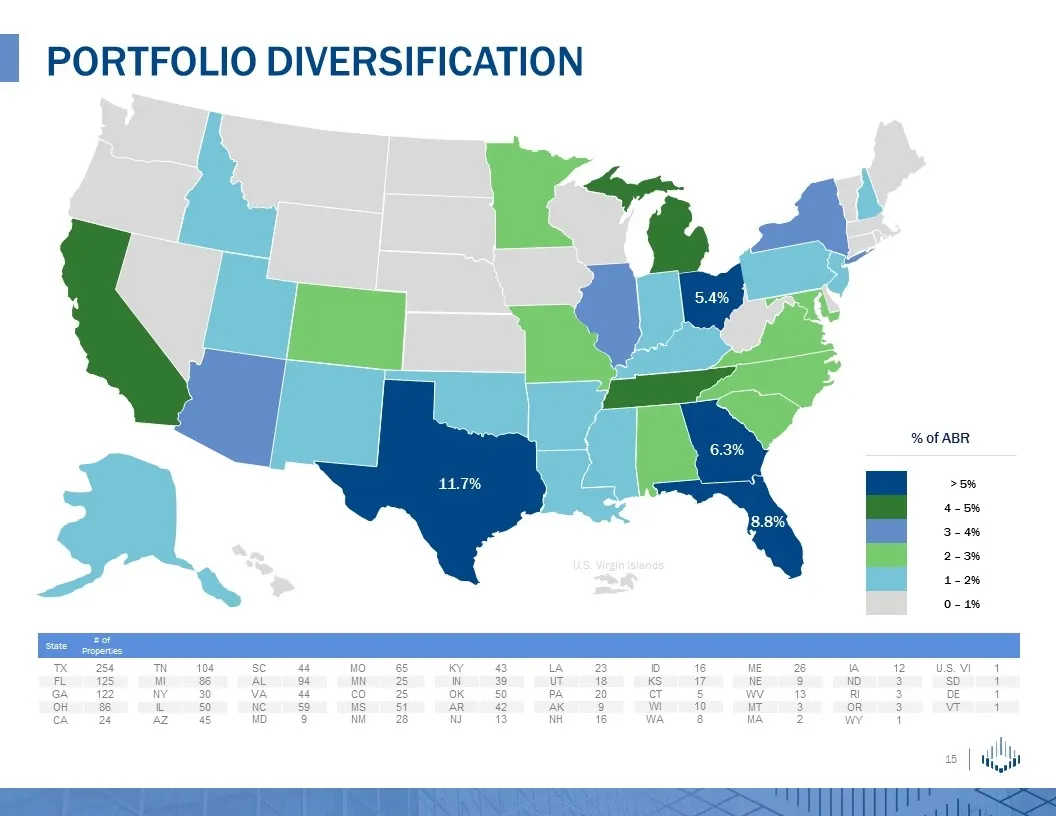
Slide 15: Portfolio Diversification
PORTFOLIO DIVERSIFICATION U.S. VI 1 SD 1 DE 1 VT 1 IA 12 ND 3 RI 3 OR 3 WY 1 ME 26 NE 9 WV 13 MT 3 MA 2 ID 16 KS 17 CT 5 WI 10 WA 8 LA 23 UT 18 PA 20 AK 9 NH 16 KY 43 IN 39 OK 50 AR 42 NJ 13 MO 65 MN 25 CO 25 MS 51 NM 28 SC 44 AL 94 VA 44 NC 59 MD 9 TN 104 MI 86 NY 30 IL 50 AZ 45 TX 254 FL 125 GA 12
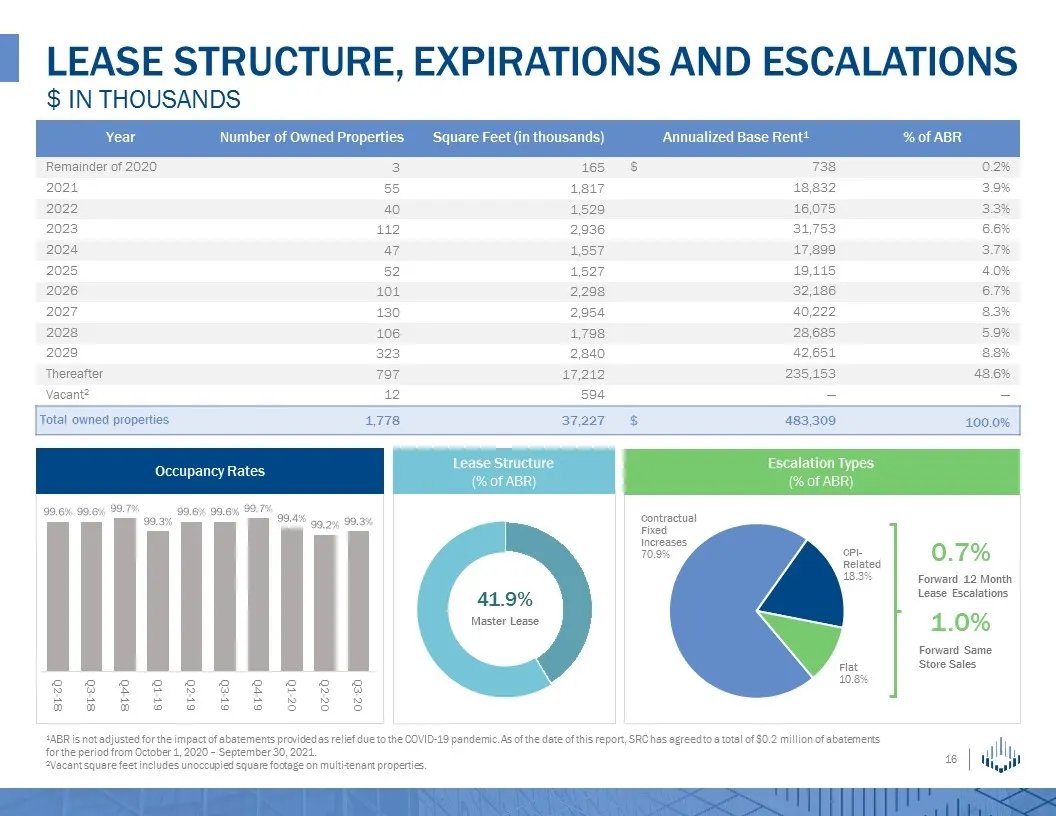
Slide 16: Lease Structure, Expirations and Escalations
LEASE STRUCTURE, EXPIRATIONS AND ESCALATIONS $ in thousands Year Number of Owned Properties Square Feet (in thousands) Annualized Base Rent1 Contractual Rent Annualized (1) % of ABR Remainder of 2020 3 165 $ 738 0.2% 2021 55 1,817 18,832 3.9% 2022 40 1,529 16,075 3.3% 2023 112 2,936 31,753 6.6% 2024
Slide 17: Appendix
REALTY “ry iS OUR RECIPE Appendi en e - Me Nix <-> §
Slide 18: Definitions and Explanations: FFO and AFFO
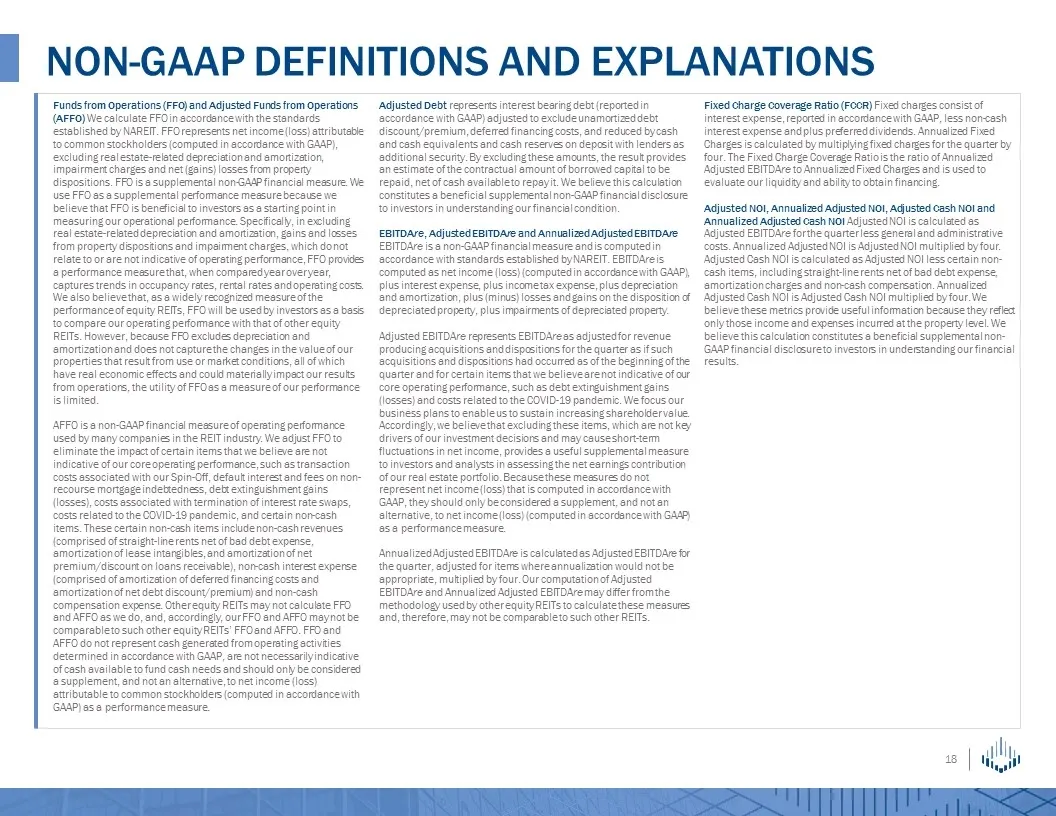
Funds from Operations (FFO) and Adjusted Funds from Operations (AFFO) We calculate FFO in accordance with the standards established by NAREIT. FFO represents net income (loss) attributable to common stockholders (computed in accordance with GAAP), excluding real estate-related depreciation and amort
Slide 19: Definitions and Explanations
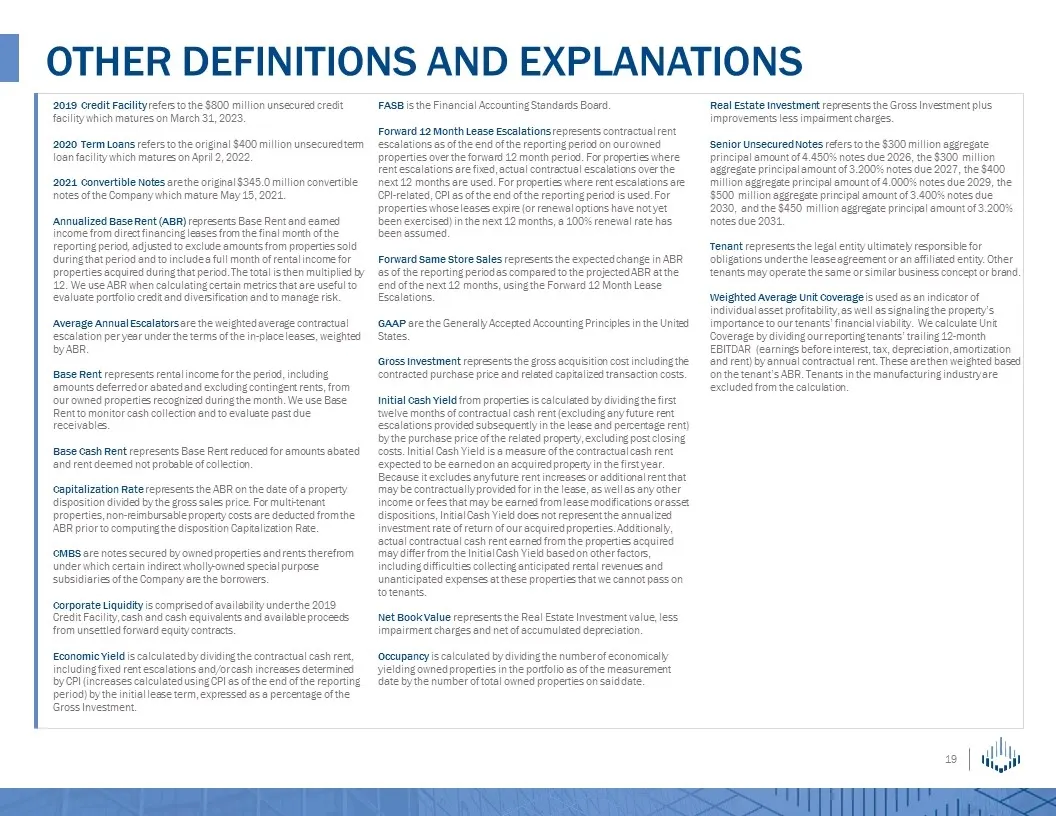
2019 Credit Facility refers to the $800 million unsecured credit facility which matures on March 31, 2023. 2020 Term Loans refers to the original $400 million unsecured term loan facility which matures on April 2, 2022. 2021 Convertible Notes are the original $345.0 million convertible notes of the
Slide 20: Forward-Looking Statements and Risk Factors
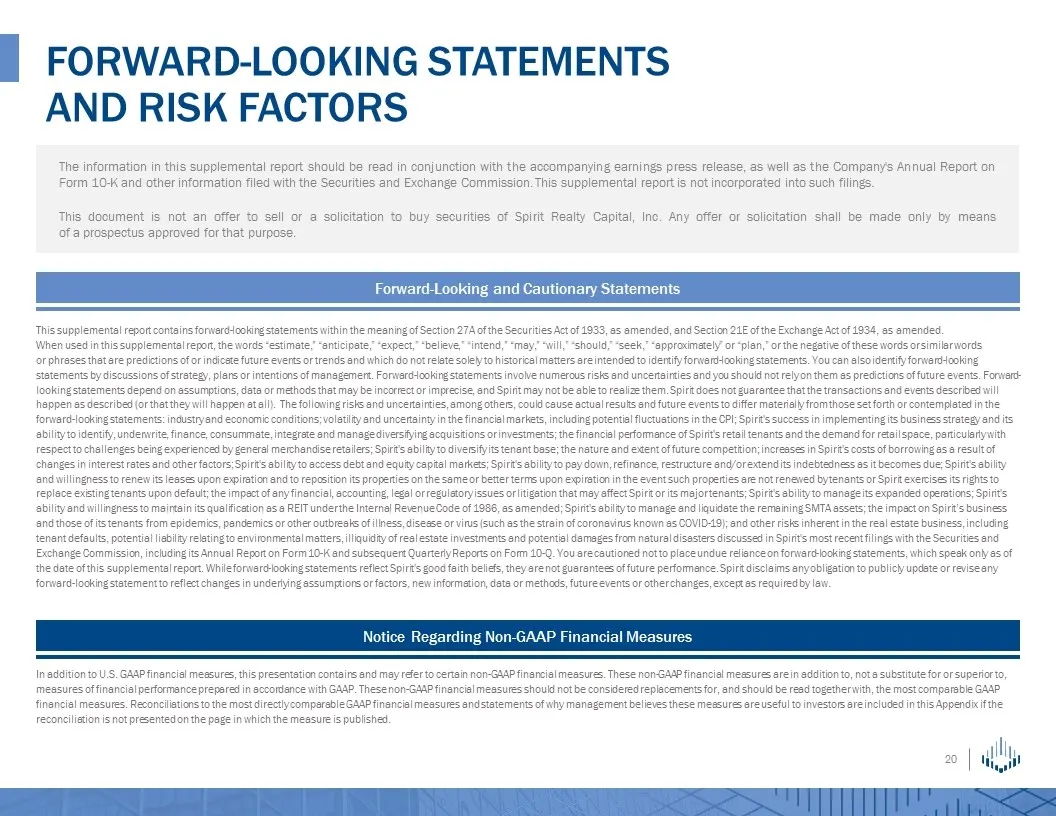
FORWARD-LOOKING STATEMENTS AND RISK FACTORS The information in this supplemental report should be read in conjunction with the accompanying earnings press release, as well as the Company's Annual Report on Form 10-K and other information filed with the Securities and Exchange Commission. This supple
Source: SEC EDGAR · 8-K filed Nov 2, 2020
More decks from Spirit Realty Capital Inc
 Q3 2023 Earnings Presentation28 slides · Nov 2, 2023
 Merger or Acquisition (October 2023)20 slides · Oct 30, 2023
 Q2 2023 Earnings Presentation26 slides · Aug 7, 2023
 Q2 2023 Earnings Presentation26 slides · August 2023
 Q1 2023 Earnings Presentation27 slides · May 3, 2023
 Q4 2022 Earnings Presentation31 slides · Feb 28, 2023