Spirit Realty Capital — Q1 2023 Earnings Presentation
27 slides from Spirit Realty Capital's earnings presentation, May 3, 2023
Slide 1: Supplemental Investor Presentation Q1 2023
Supplemental Investor Presentation MAY 2023 Q1 2023 Exhibit 99.2
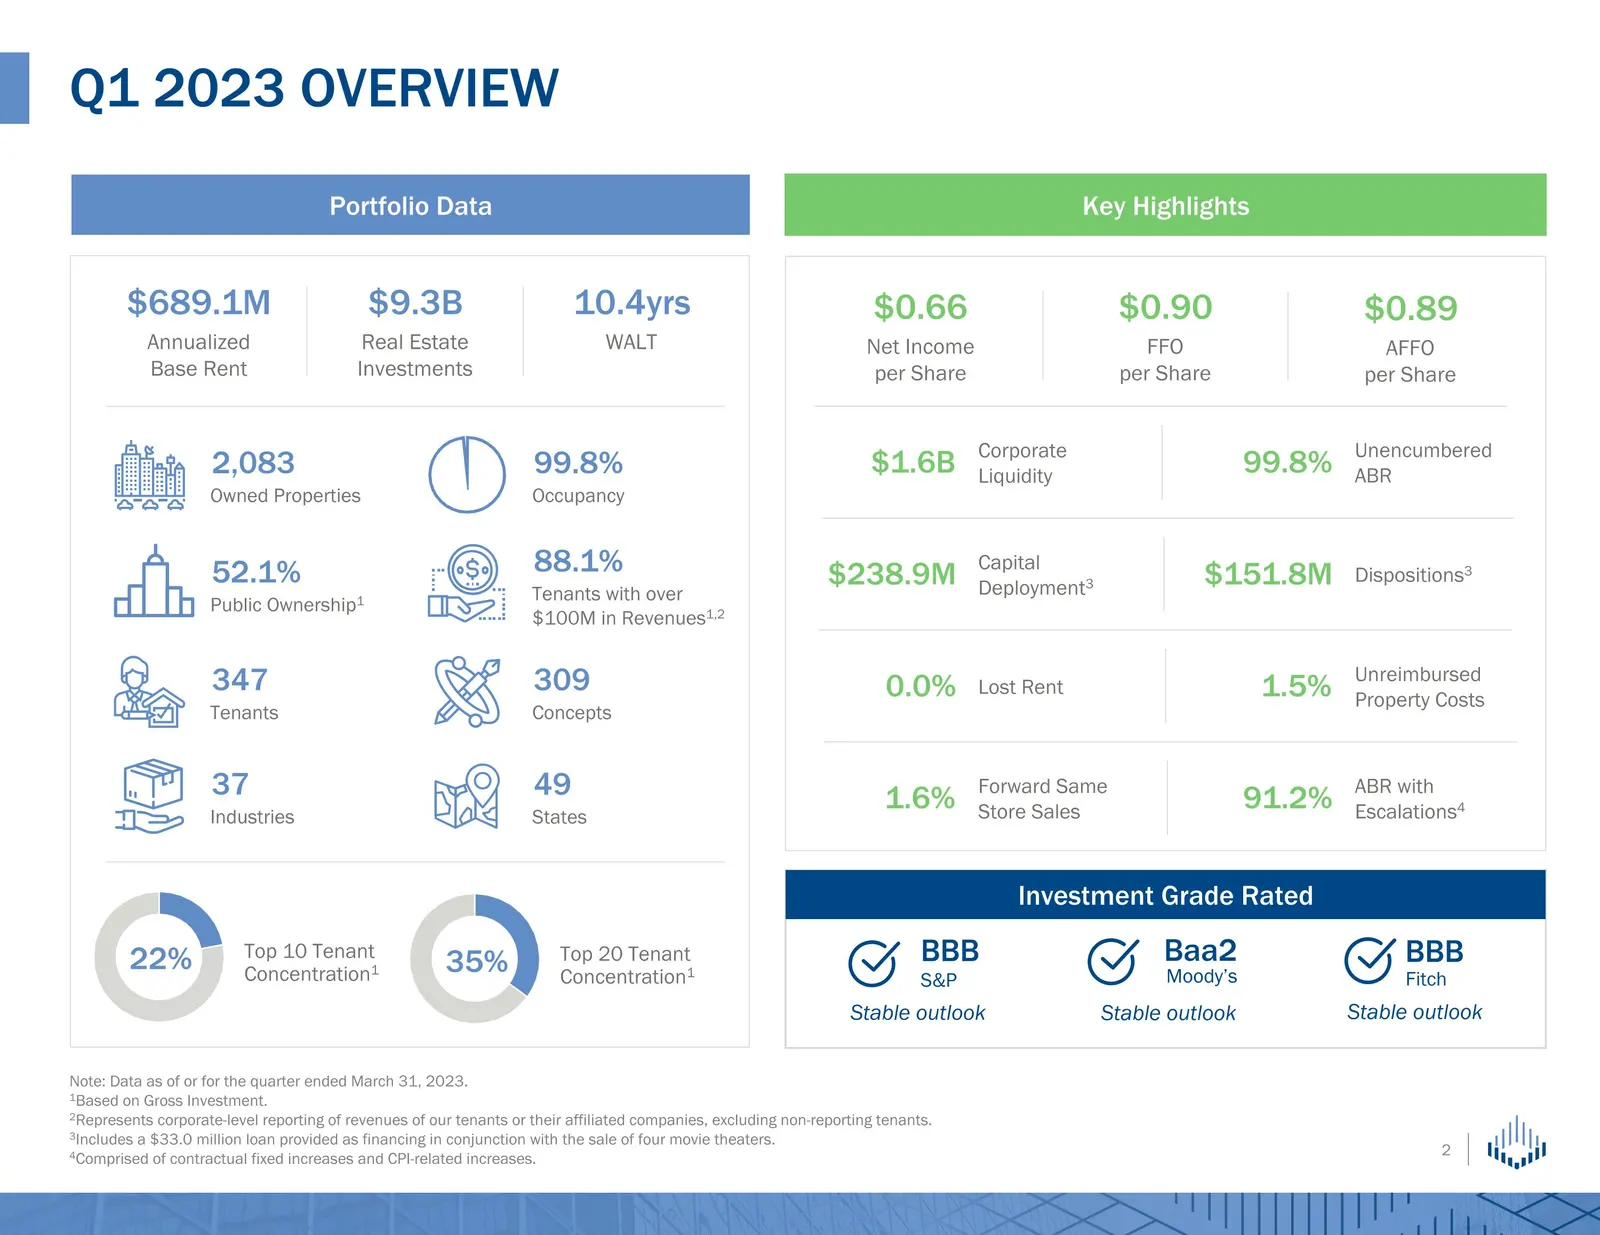
Slide 2: Q1 2023 Overview
35% Top 20 Tenant Concentration1 Note: Data as of or for the quarter ended March 31, 2023. 1Based on Gross Investment. 2Represents corporate-level reporting of revenues of our tenants or their affiliated companies, excluding non-reporting tenants. 3Includes a $33.0 million loan provided as financing
Slide 3: Spirit's underwriting approach
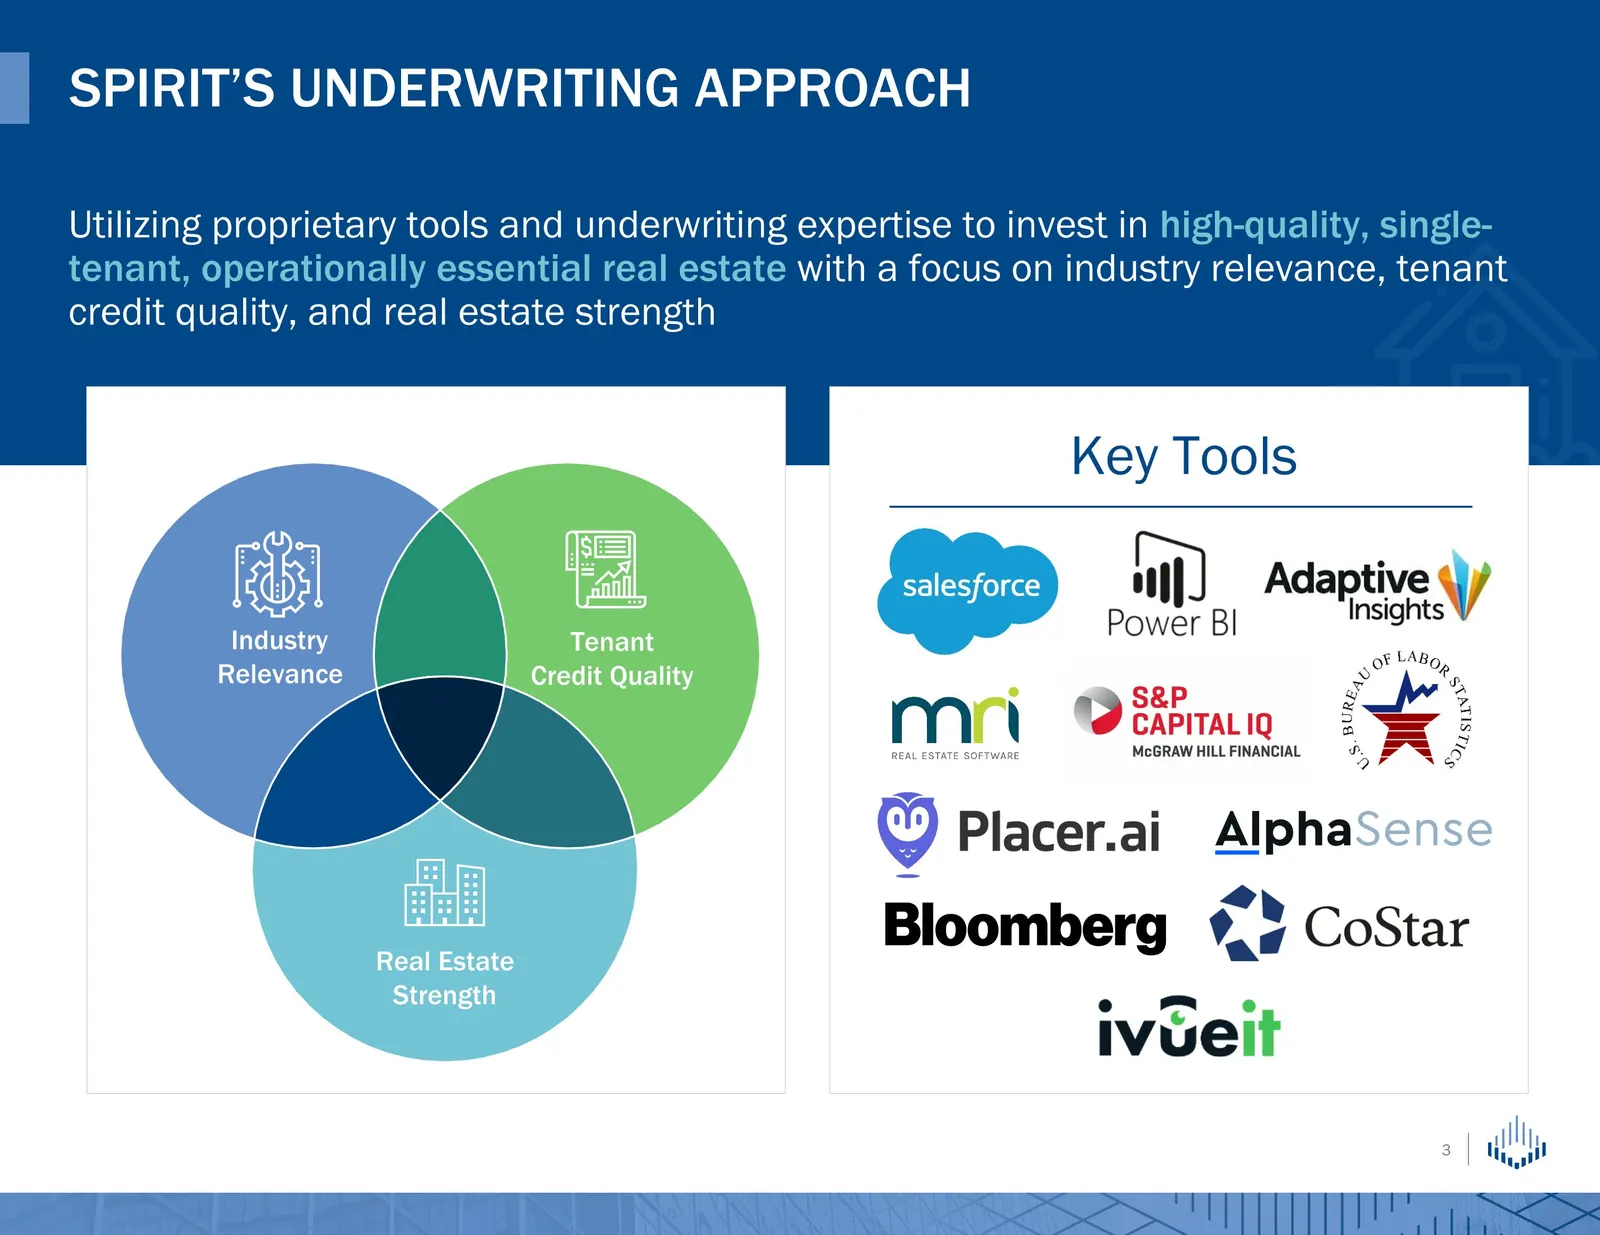
Spirit’s underwriting approach Utilizing proprietary tools and underwriting expertise to invest in high-quality, single-tenant, operationally essential real estate with a focus on industry relevance, tenant credit quality, and real estate strength Industry Relevance Tenant Credit Quality Real Estate
Slide 4: Progress at Spirit — portfolio and balance sheet
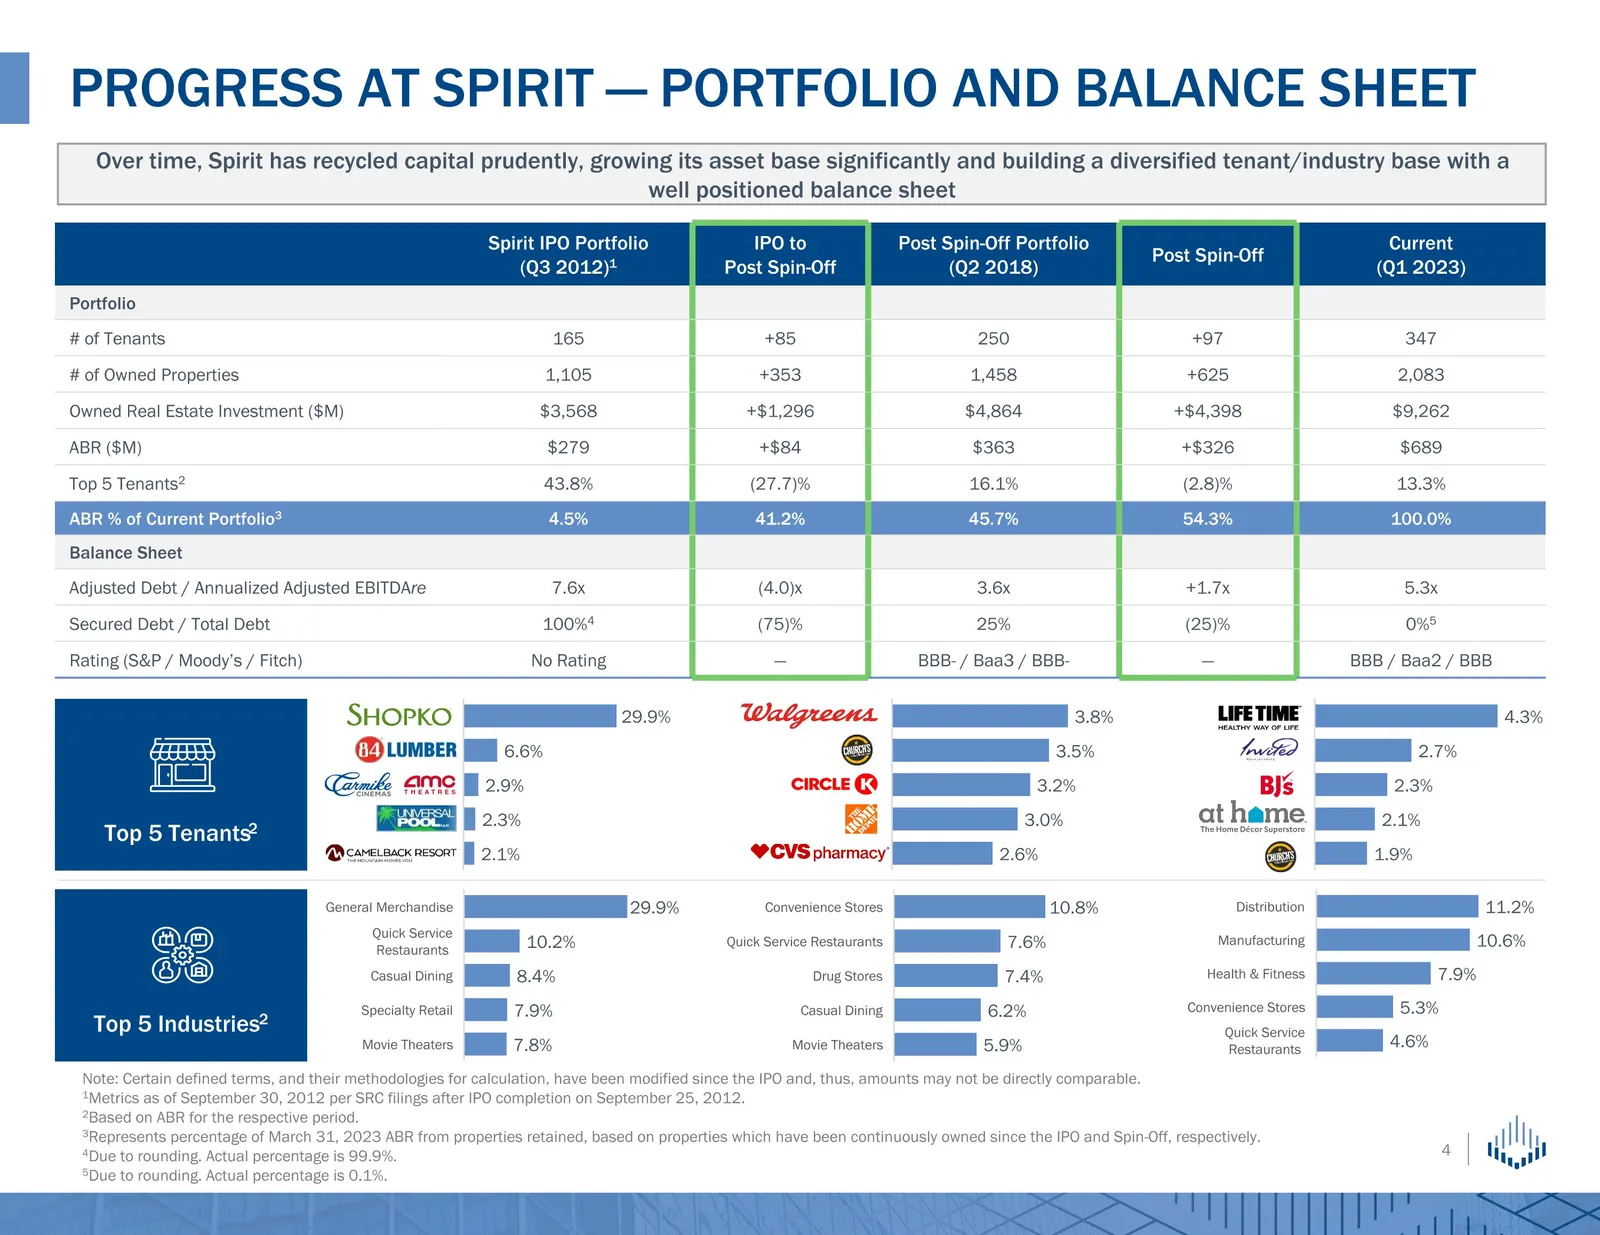
Progress at Spirit — portfolio and balance sheet Spirit IPO Portfolio (Q3 2012)1 IPO to Post Spin-Off Post Spin-Off Portfolio (Q2 2018) Post Spin-Off Current (Q1 2023) Portfolio # of Tenants 165 +85 250 +97 347 # of Owned Properties 1,105 +353 1,458 +625 2,083 Owned Real Estate Investment ($M) $3,56
Slide 5: Capital Deployment Highlights
Capital Deployment Highlights
Slide 6: Capital deployment activity
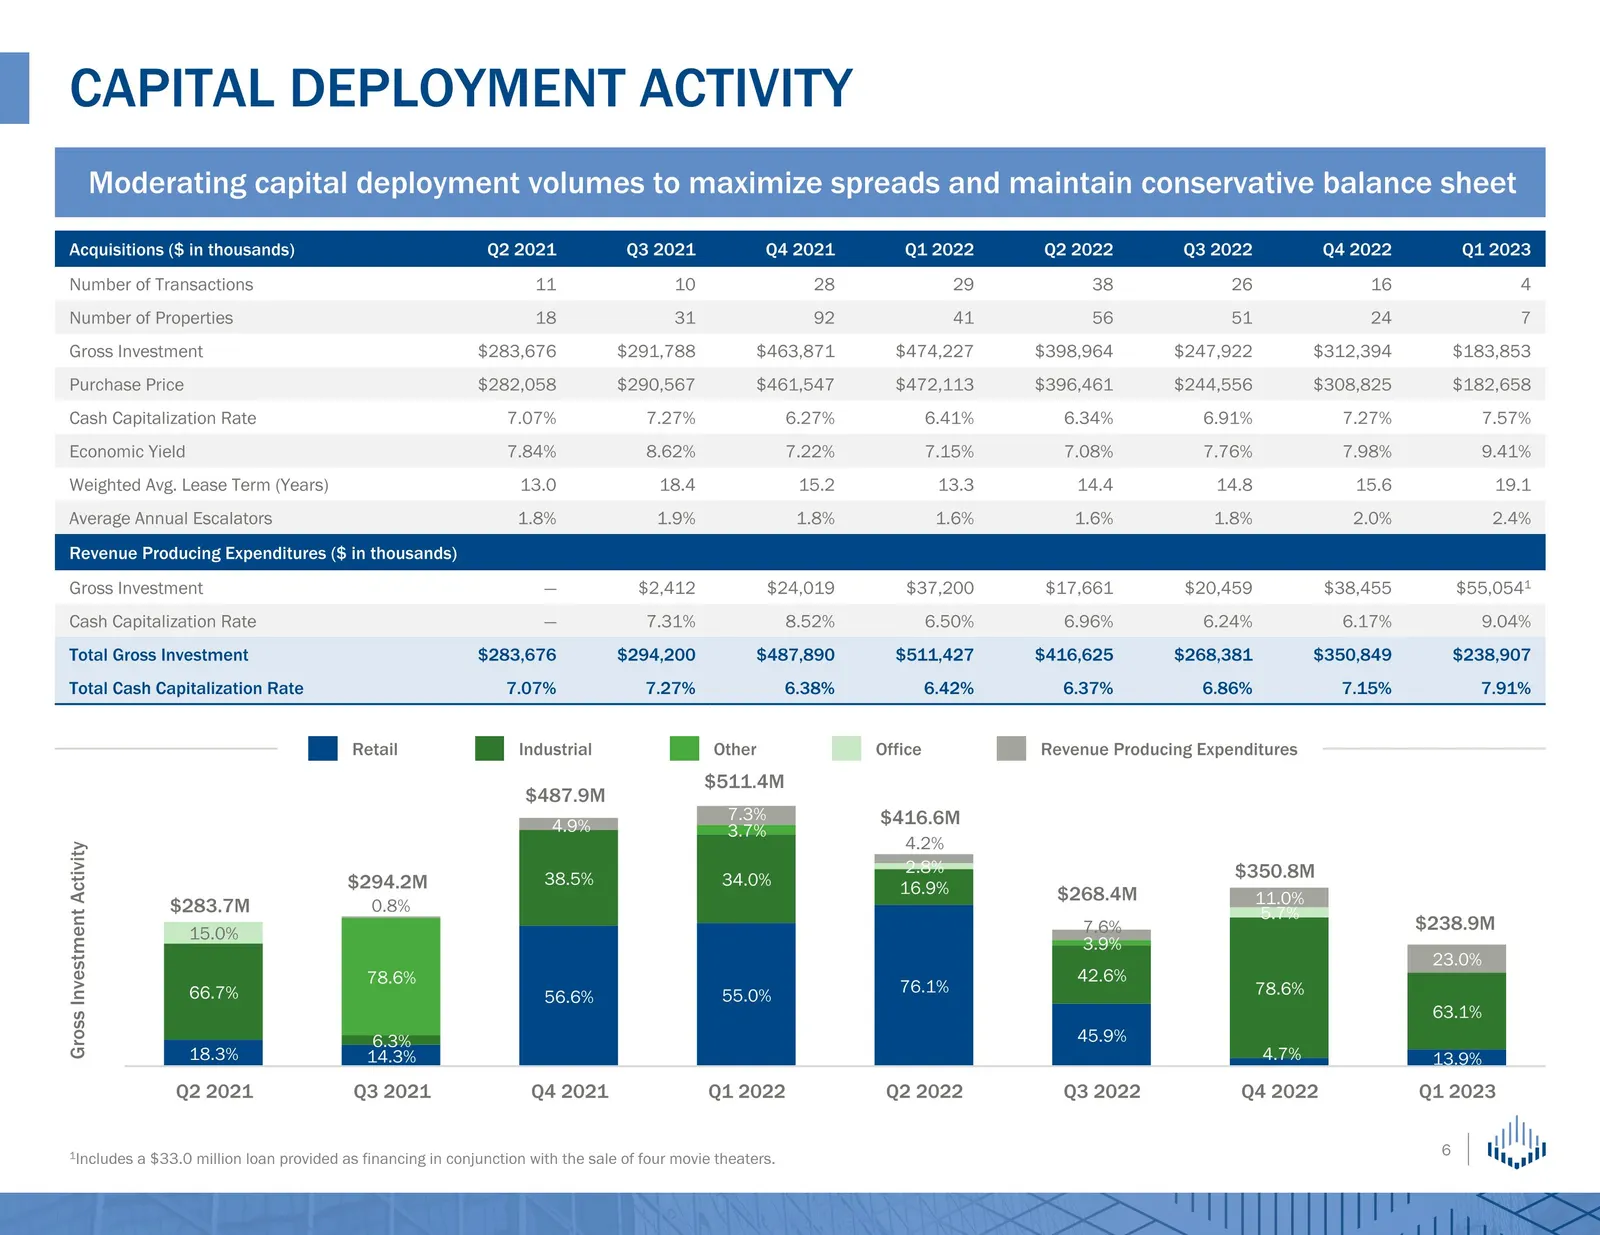
1Includes a $33.0 million loan provided as financing in conjunction with the sale of four movie theaters. Capital deployment Activity Moderating capital deployment volumes to maximize spreads and maintain conservative balance sheet Gross Investment Activity $283.7M $294.2M Acquisitions ($ in thousan
Slide 7: Trailing four-quarter capital deployment
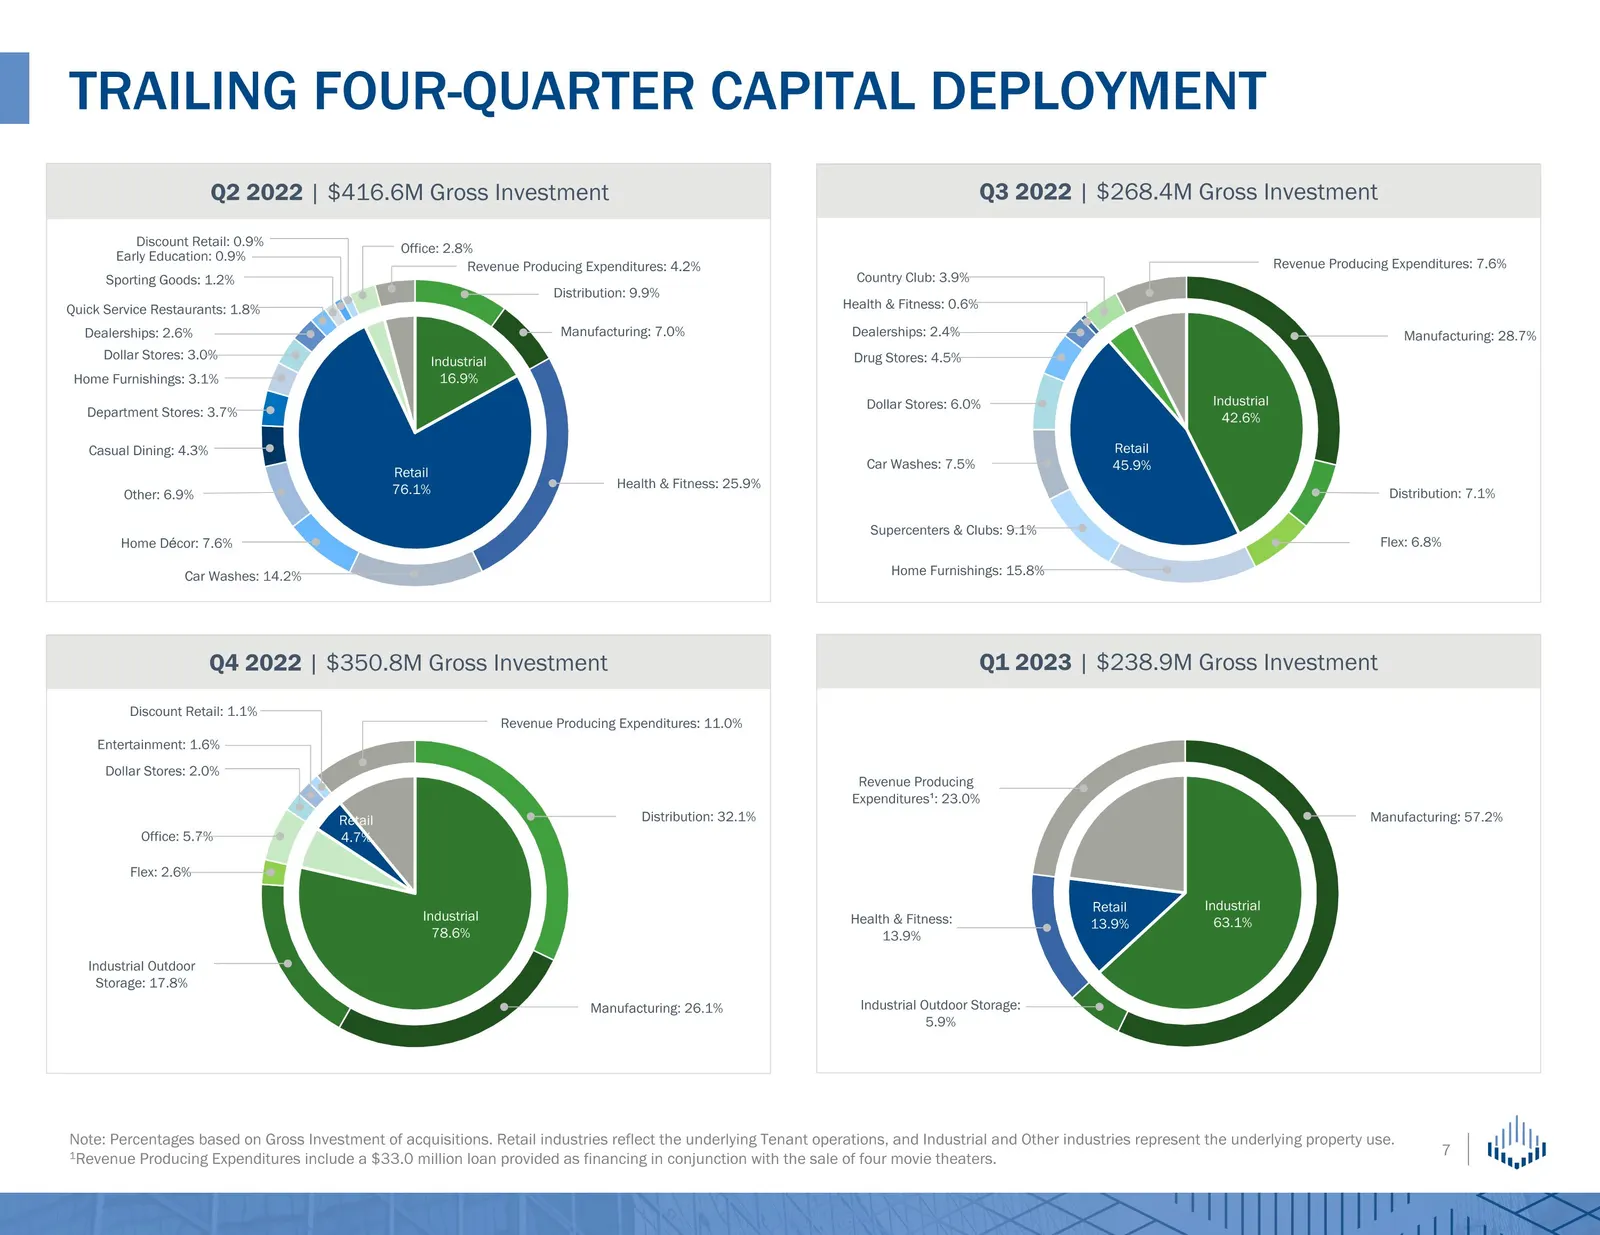
Trailing four-quarter capital deployment Note: Percentages based on Gross Investment of acquisitions. Retail industries reflect the underlying Tenant operations, and Industrial and Other industries represent the underlying property use. 1Revenue Producing Expenditures include a $33.0 million loan pr
Slide 8: Disposition activity
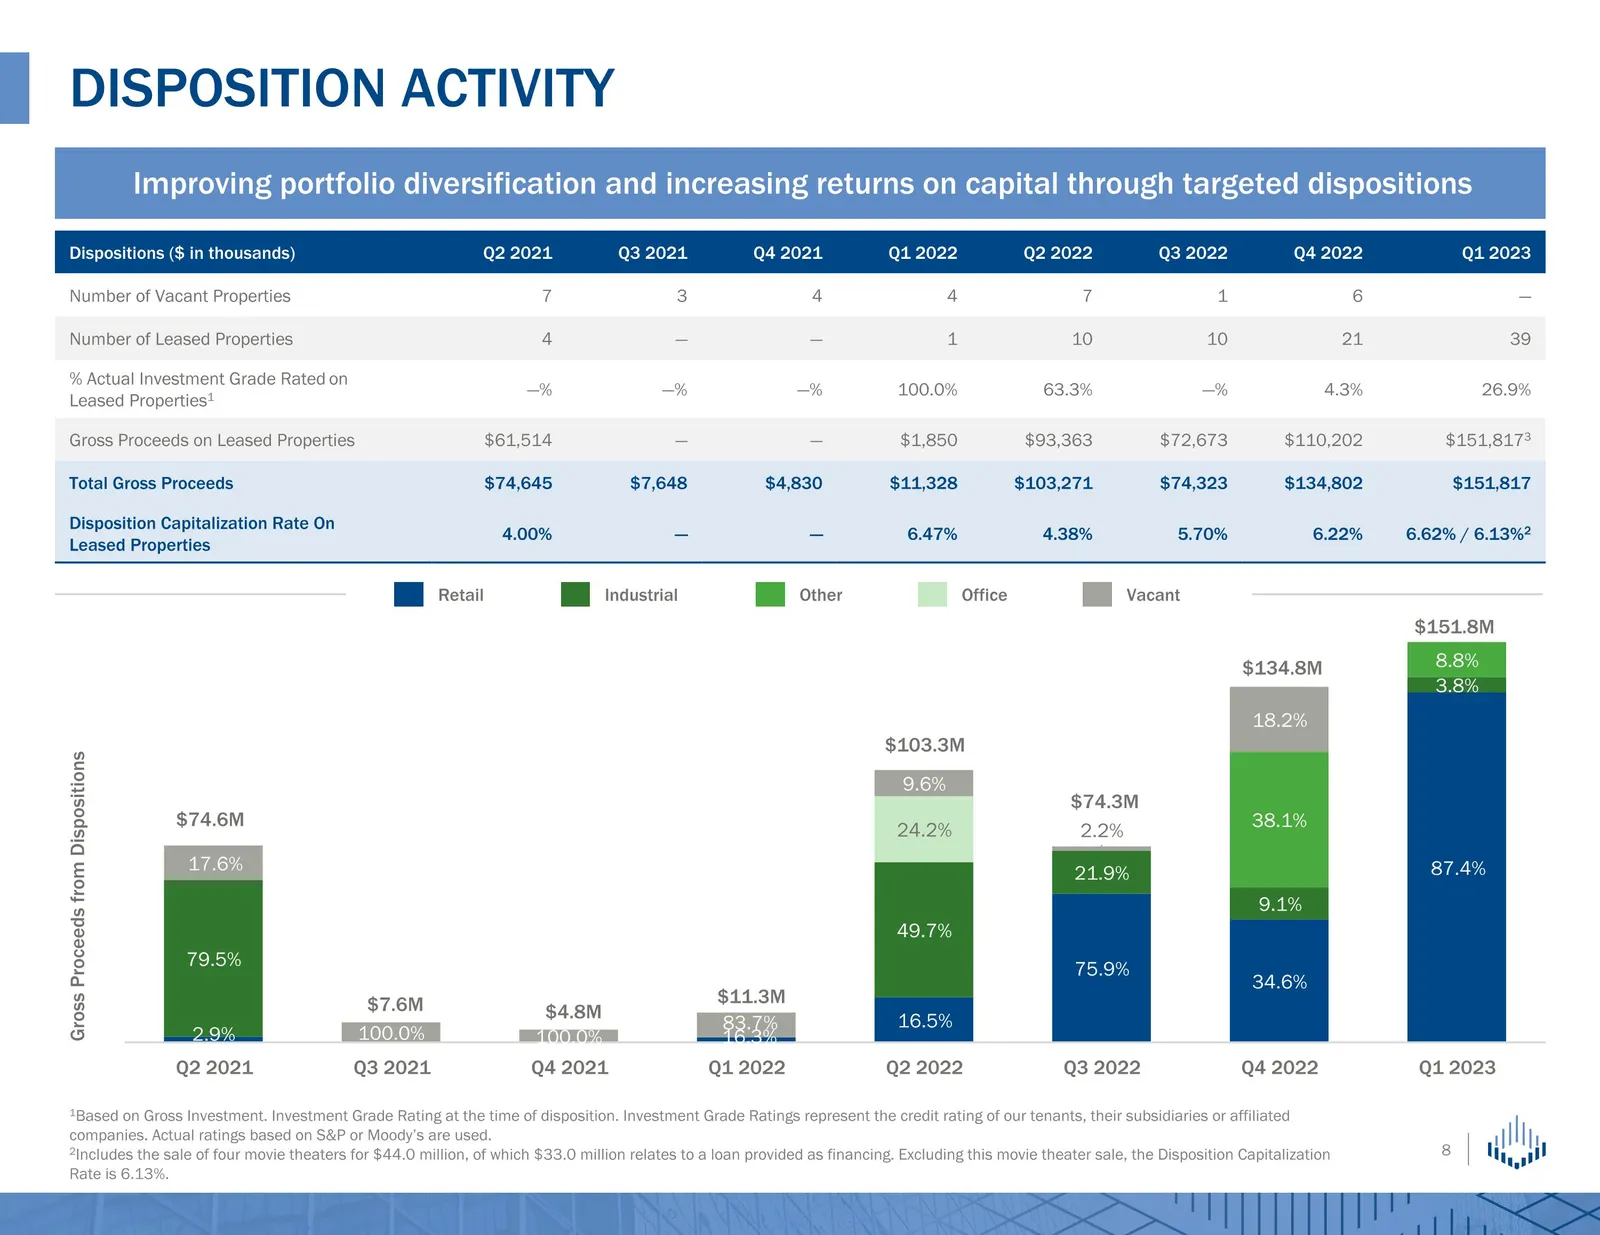
1Based on Gross Investment. Investment Grade Rating at the time of disposition. Investment Grade Ratings represent the credit rating of our tenants, their subsidiaries or affiliated companies. Actual ratings based on S&P or Moody’s are used. 2Includes the sale of four movie theaters for $44.0 millio
Slide 9: Portfolio Composition
Portfolio Composition
Slide 10: Top 20 Tenants and Current Portfolio composition
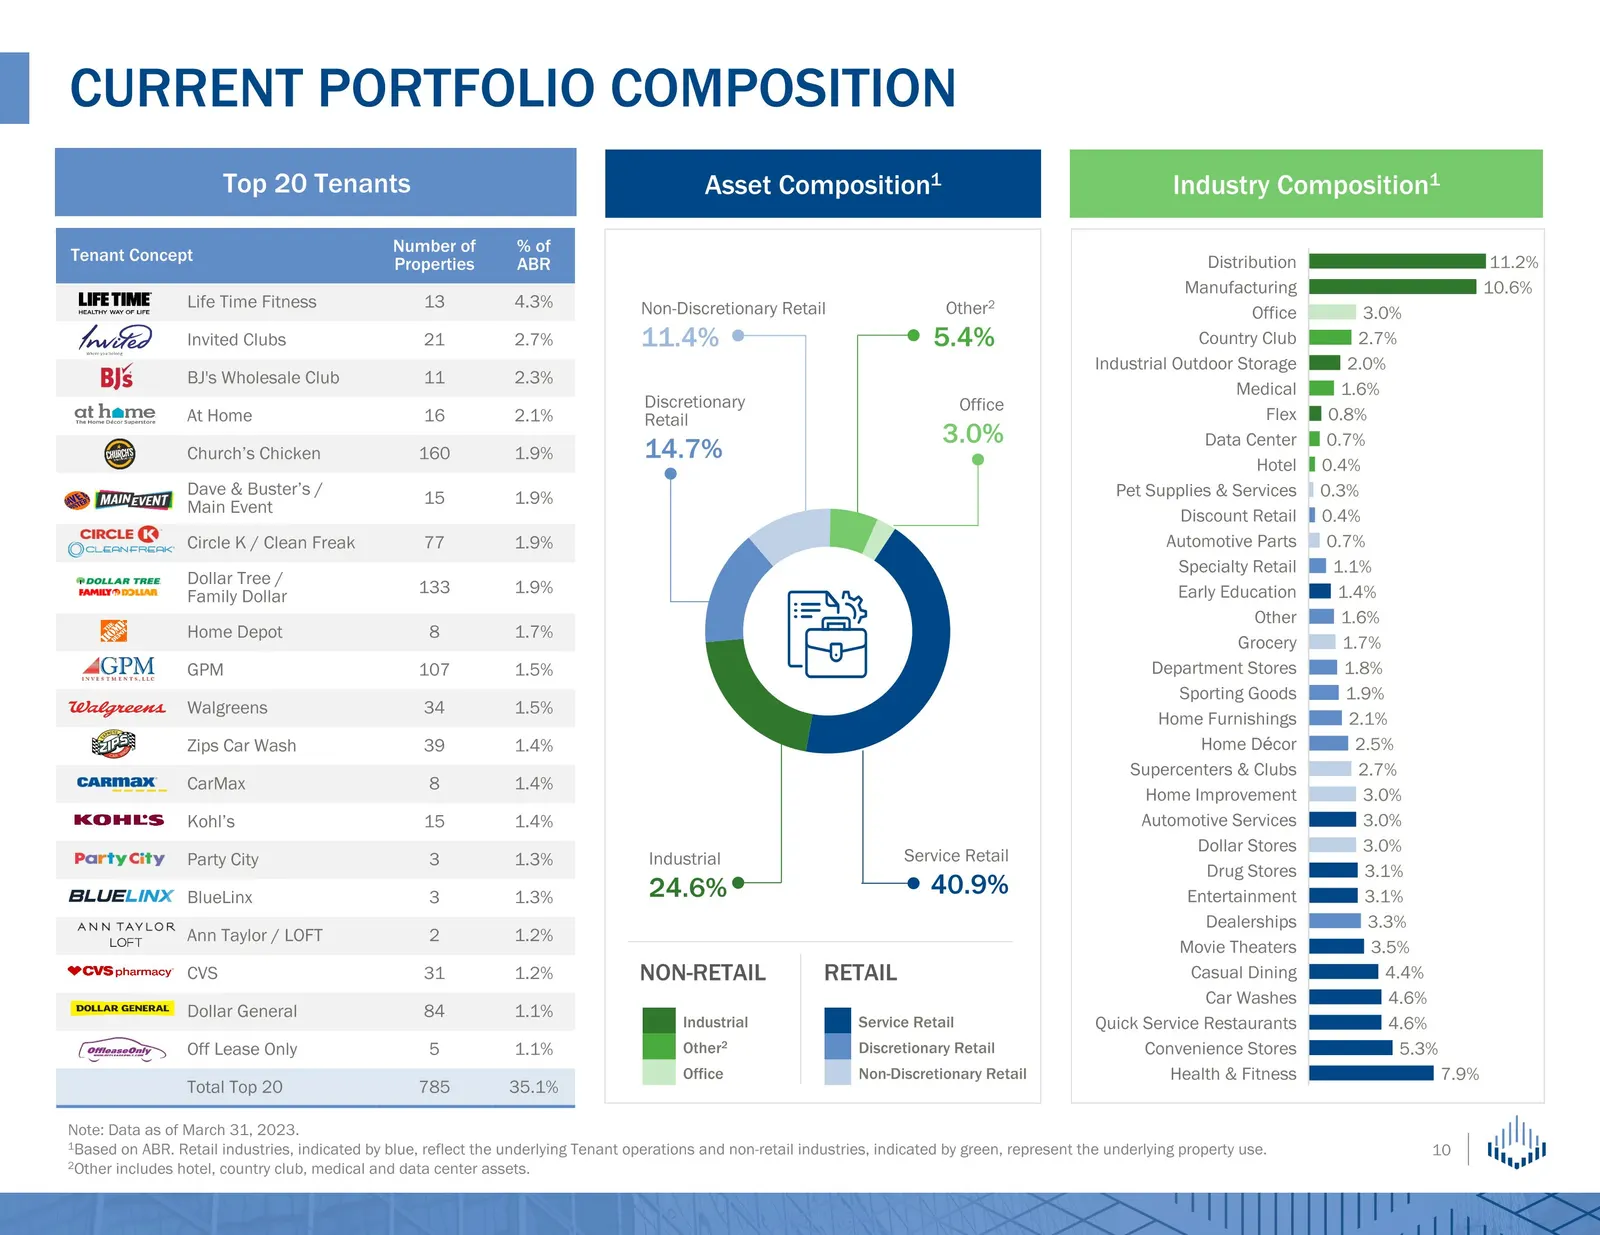
Tenant Concept Number of Properties % of ABR Life Time Fitness 13 4.3% Invited Clubs 21 2.7% BJ's Wholesale Club 11 2.3% At Home 16 2.1% Church’s Chicken 160 1.9% Dave & Buster’s / Main Event 15 1.9% Circle K / Clean Freak 77 1.9% Dollar Tree / Family Dollar 133 1.9% Home Depot 8 1.7% GPM 107 1.5% W
Slide 11: Industrial portfolio highlights
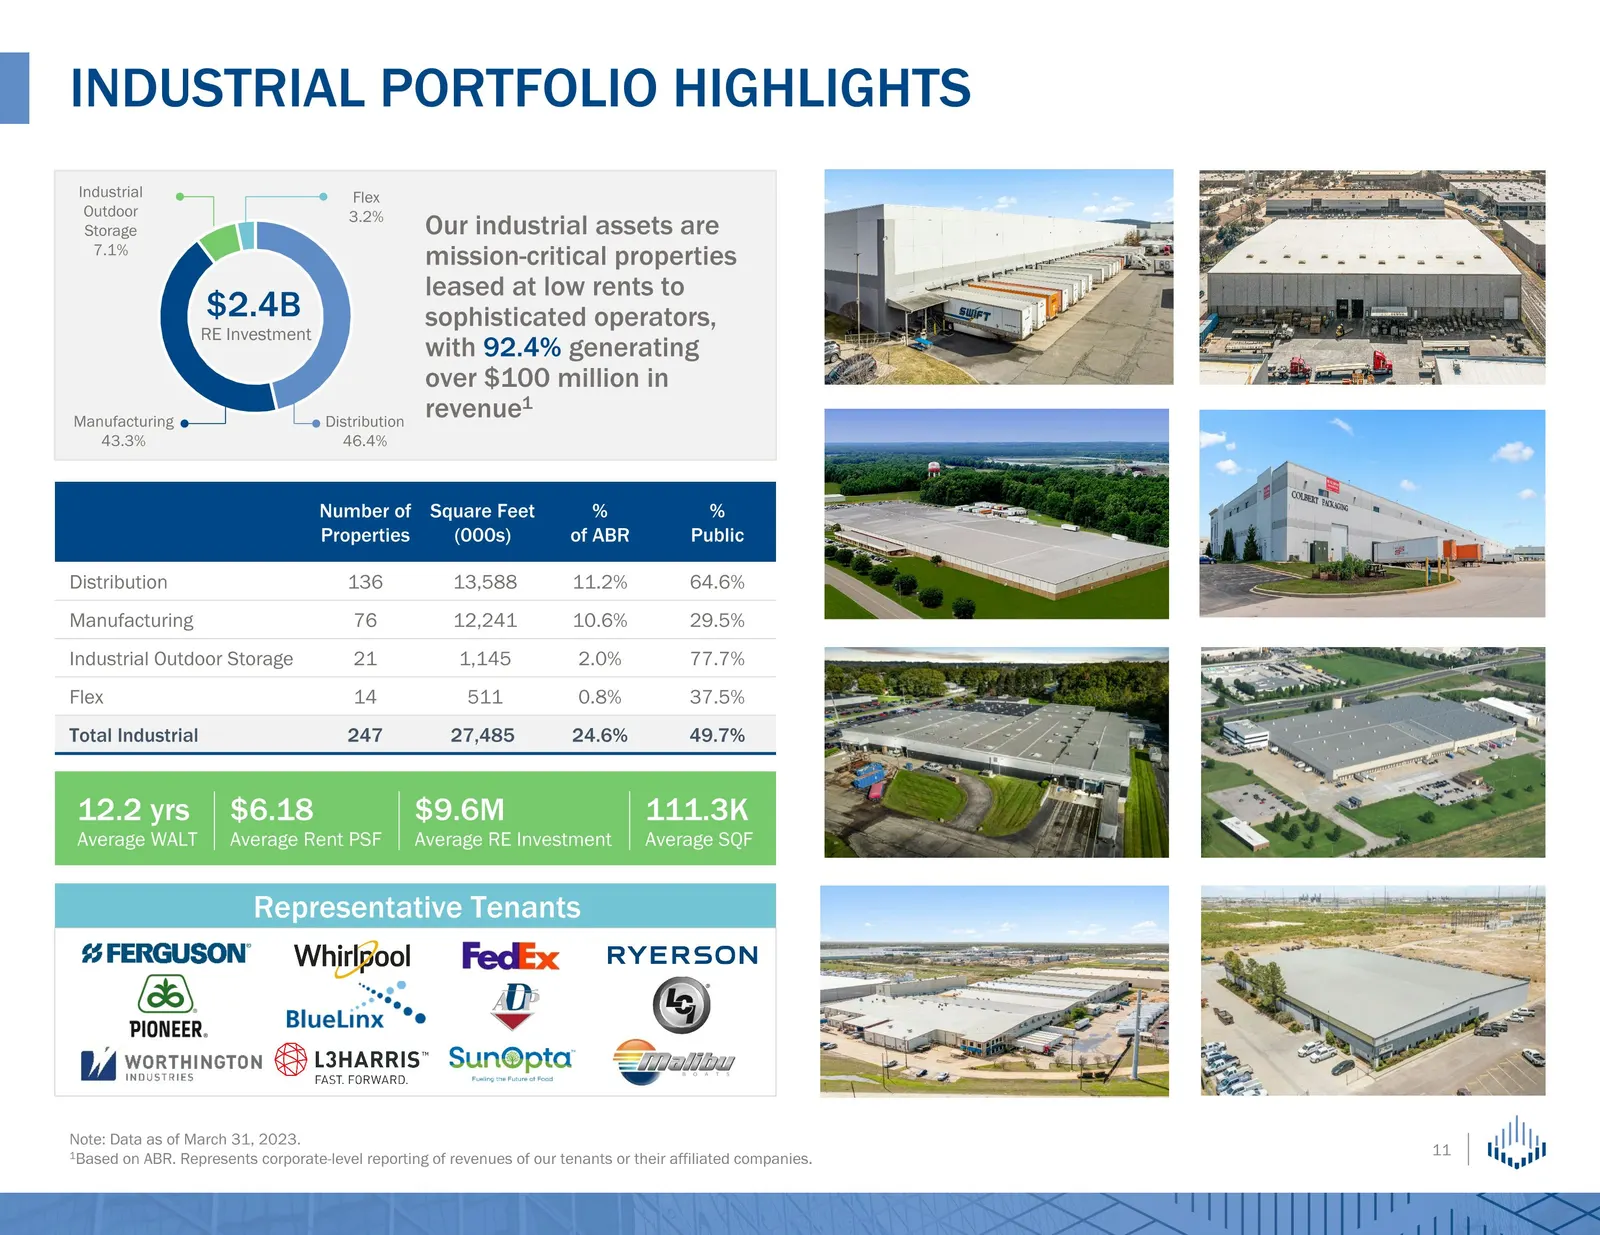
Industrial portfolio highlights Note: Data as of March 31, 2023. 1Based on ABR. Represents corporate-level reporting of revenues of our tenants or their affiliated companies. Number of Properties Square Feet (000s) % of ABR % Public Distribution 136 13,588 11.2% 64.6% Manufacturing 76 12,241 10.6% 2
Slide 12: During the First Quarter, Spirit Sold Four Former Goodrich Theaters
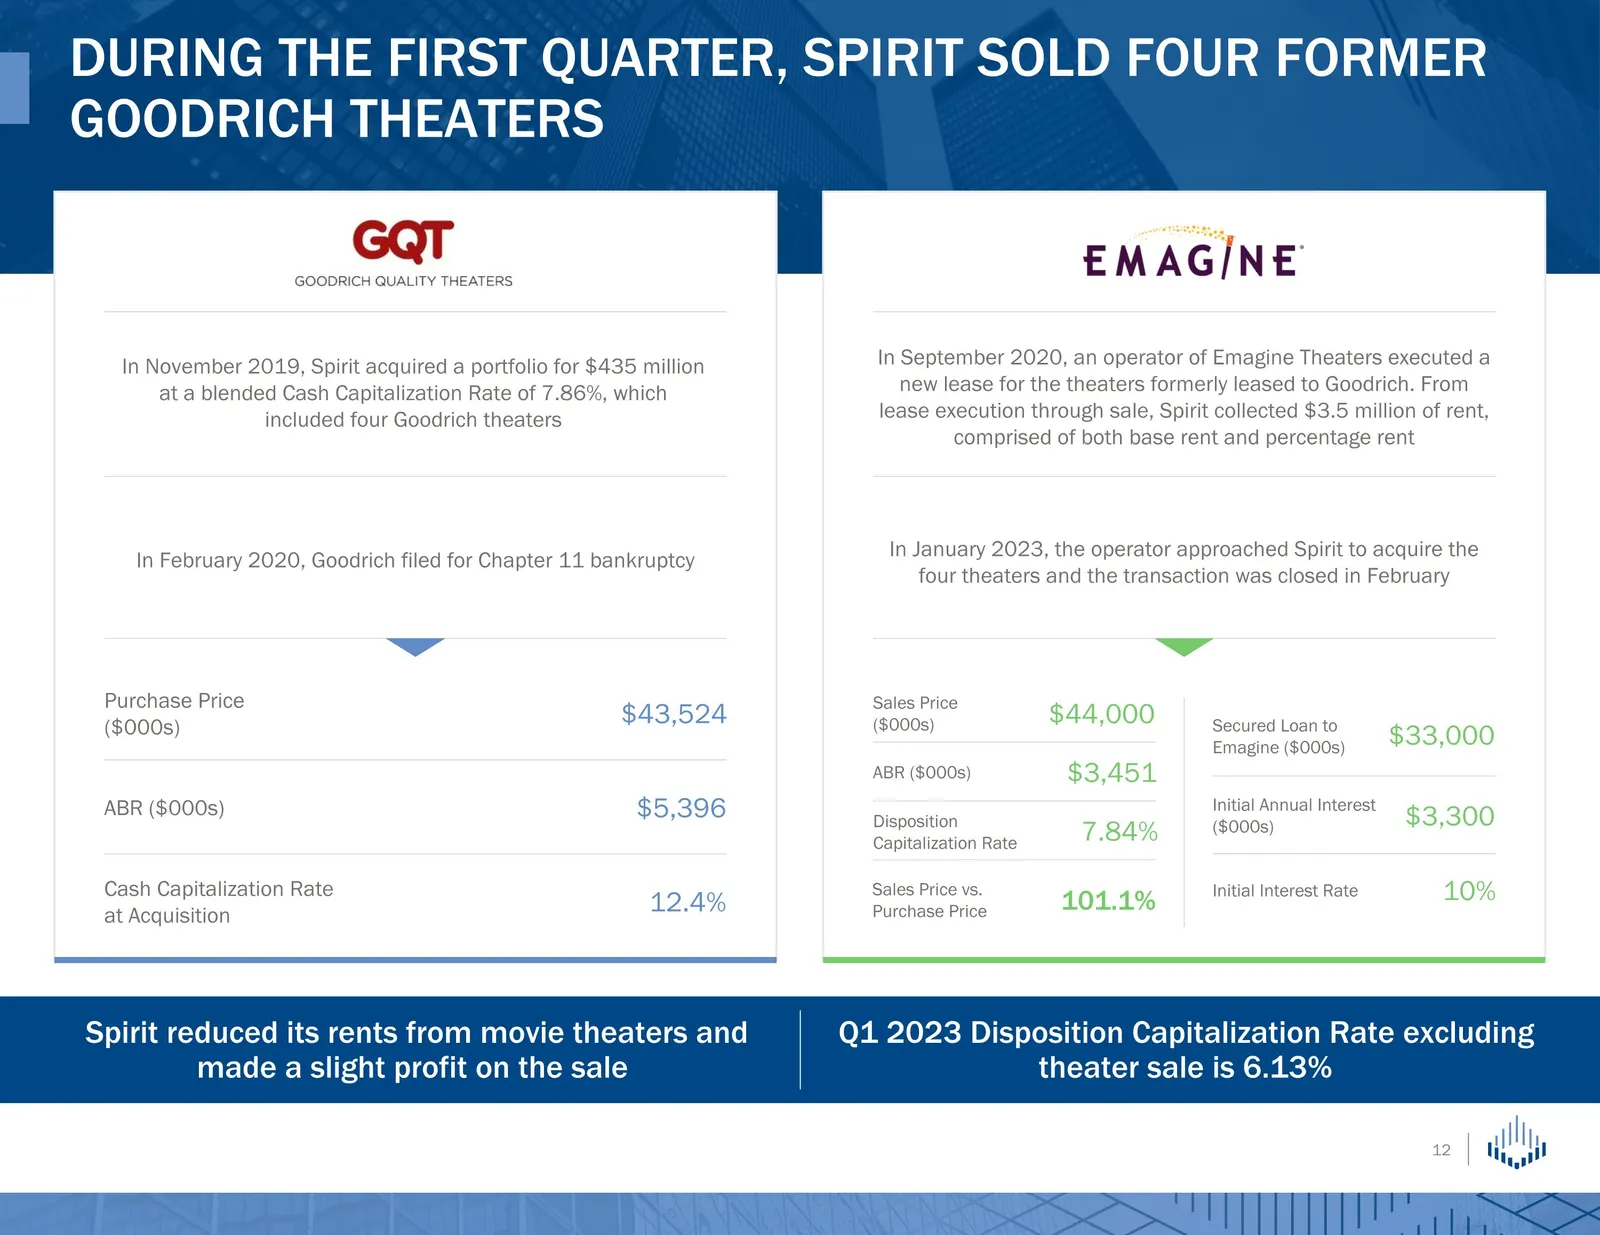
During the First Quarter, Spirit Sold Four Former Goodrich Theaters In November 2019, Spirit acquired a portfolio for $435 million at a blended Cash Capitalization Rate of 7.86%, which included four Goodrich theaters In February 2020, Goodrich filed for Chapter 11 bankruptcy In September 2020, an op
Slide 13: Retail portfolio highlights
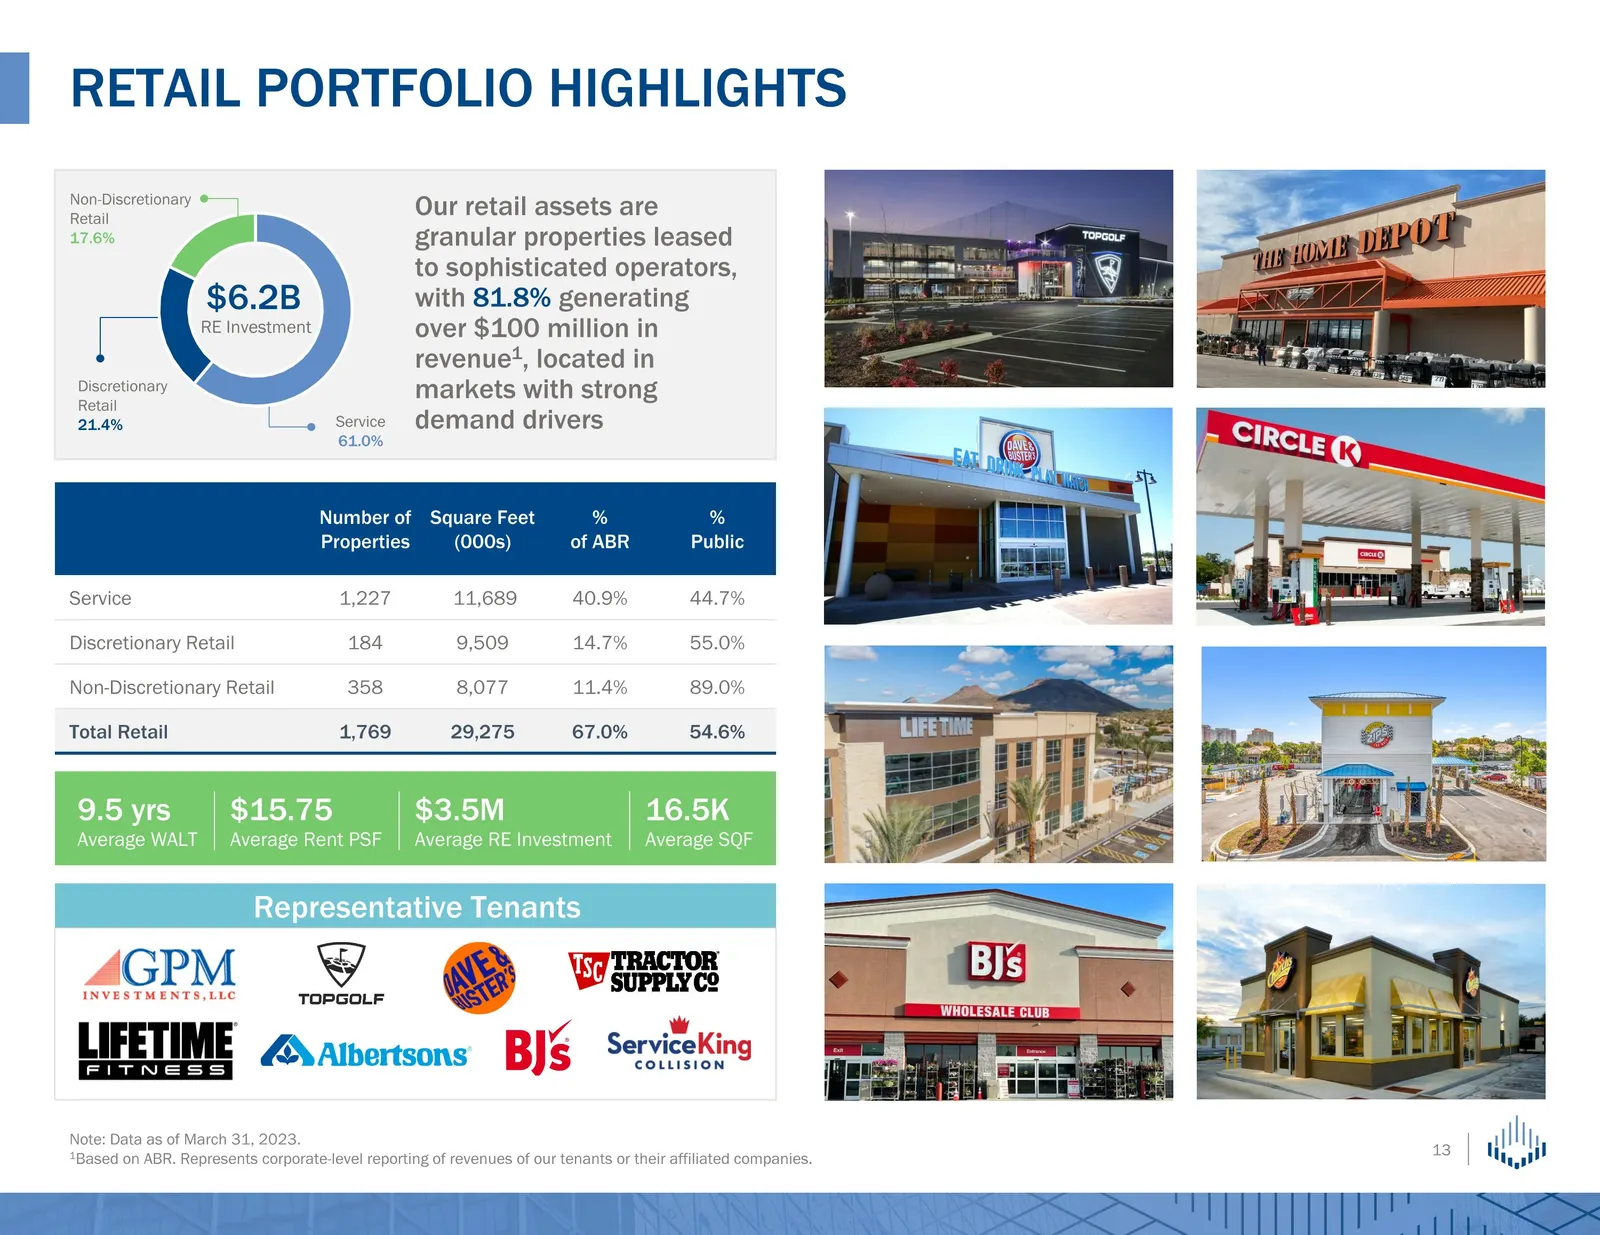
Retail portfolio highlights $6.2B RE Investment Our retail assets are granular properties leased to sophisticated operators, with 81.8% generating over $100 million in revenue1, located in markets with strong demand drivers Note: Data as of March 31, 2023. 1Based on ABR. Represents corporate-level r
Slide 14: Portfolio Health
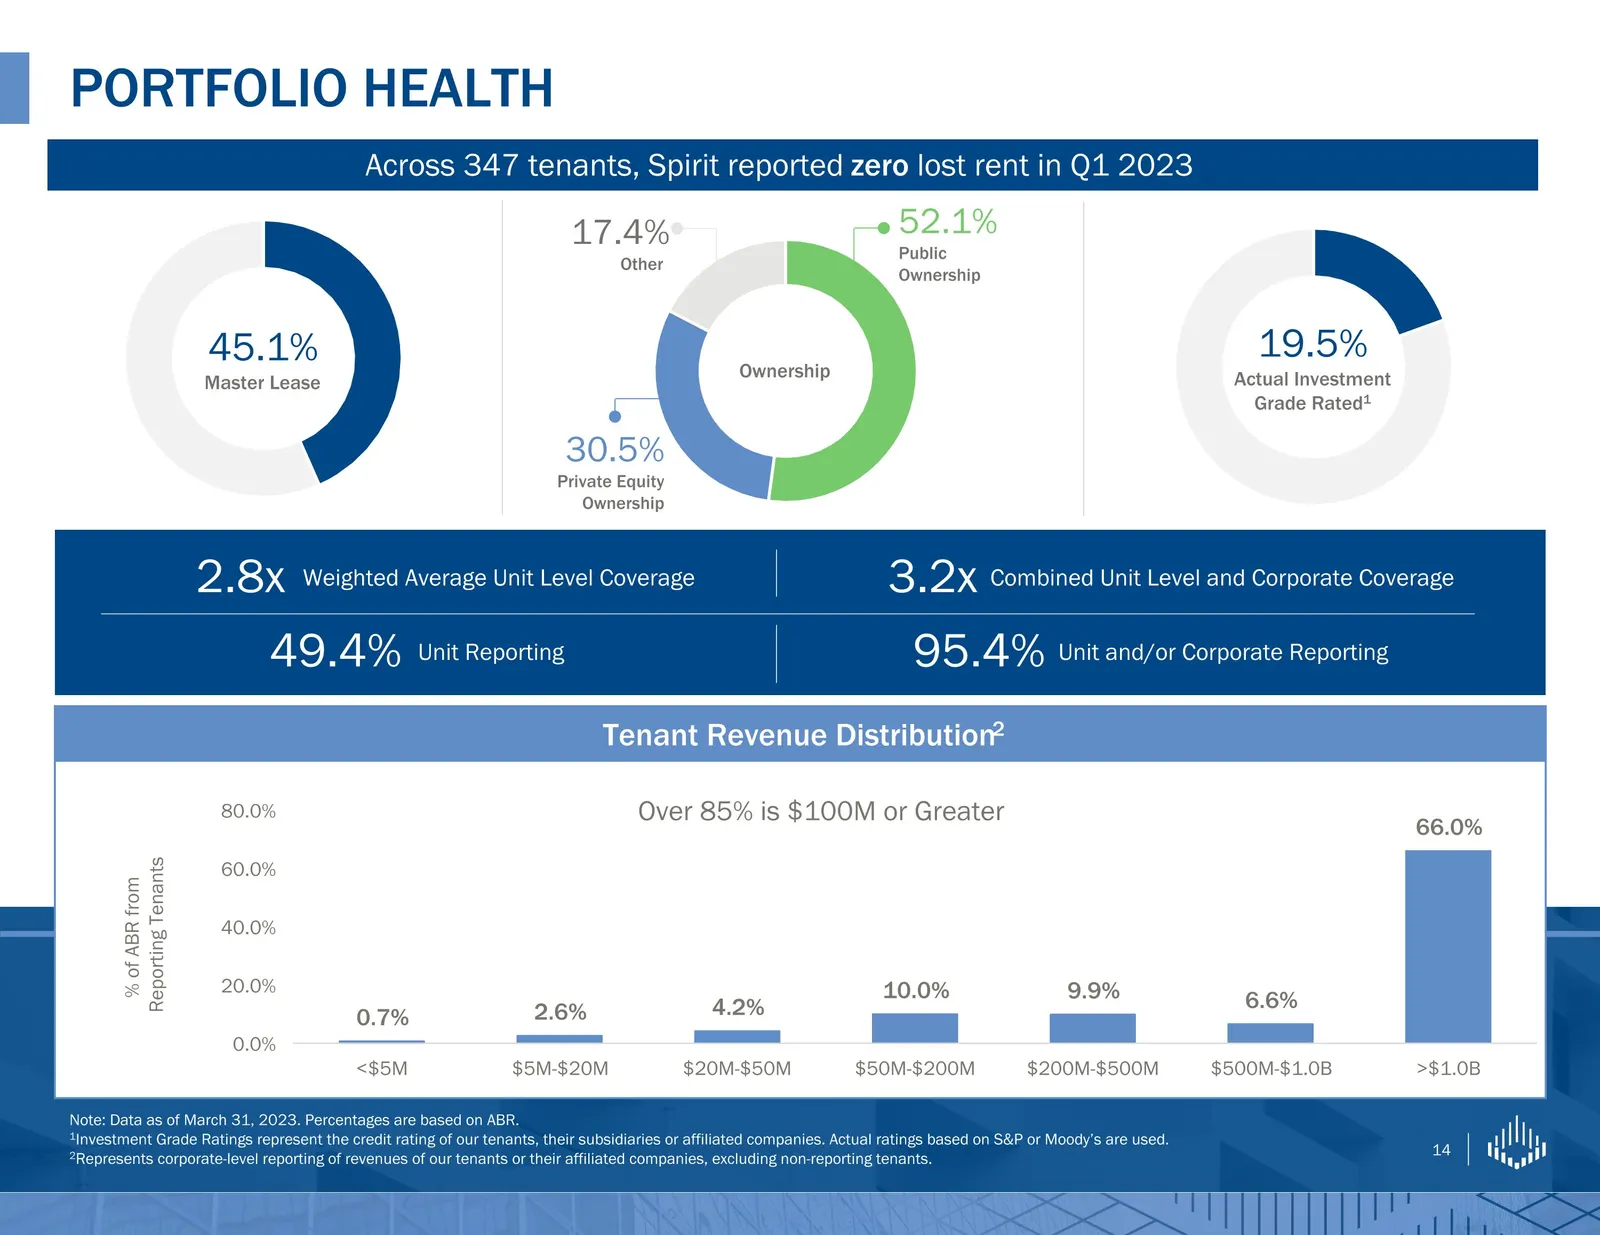
19.5% Actual Investment Grade Rated1 Note: Data as of March 31, 2023. Percentages are based on ABR. 1Investment Grade Ratings represent the credit rating of our tenants, their subsidiaries or affiliated companies. Actual ratings based on S&P or Moody’s are used. 2Represents corporate-level reporting
Slide 15: Lease structure, expirations and escalations
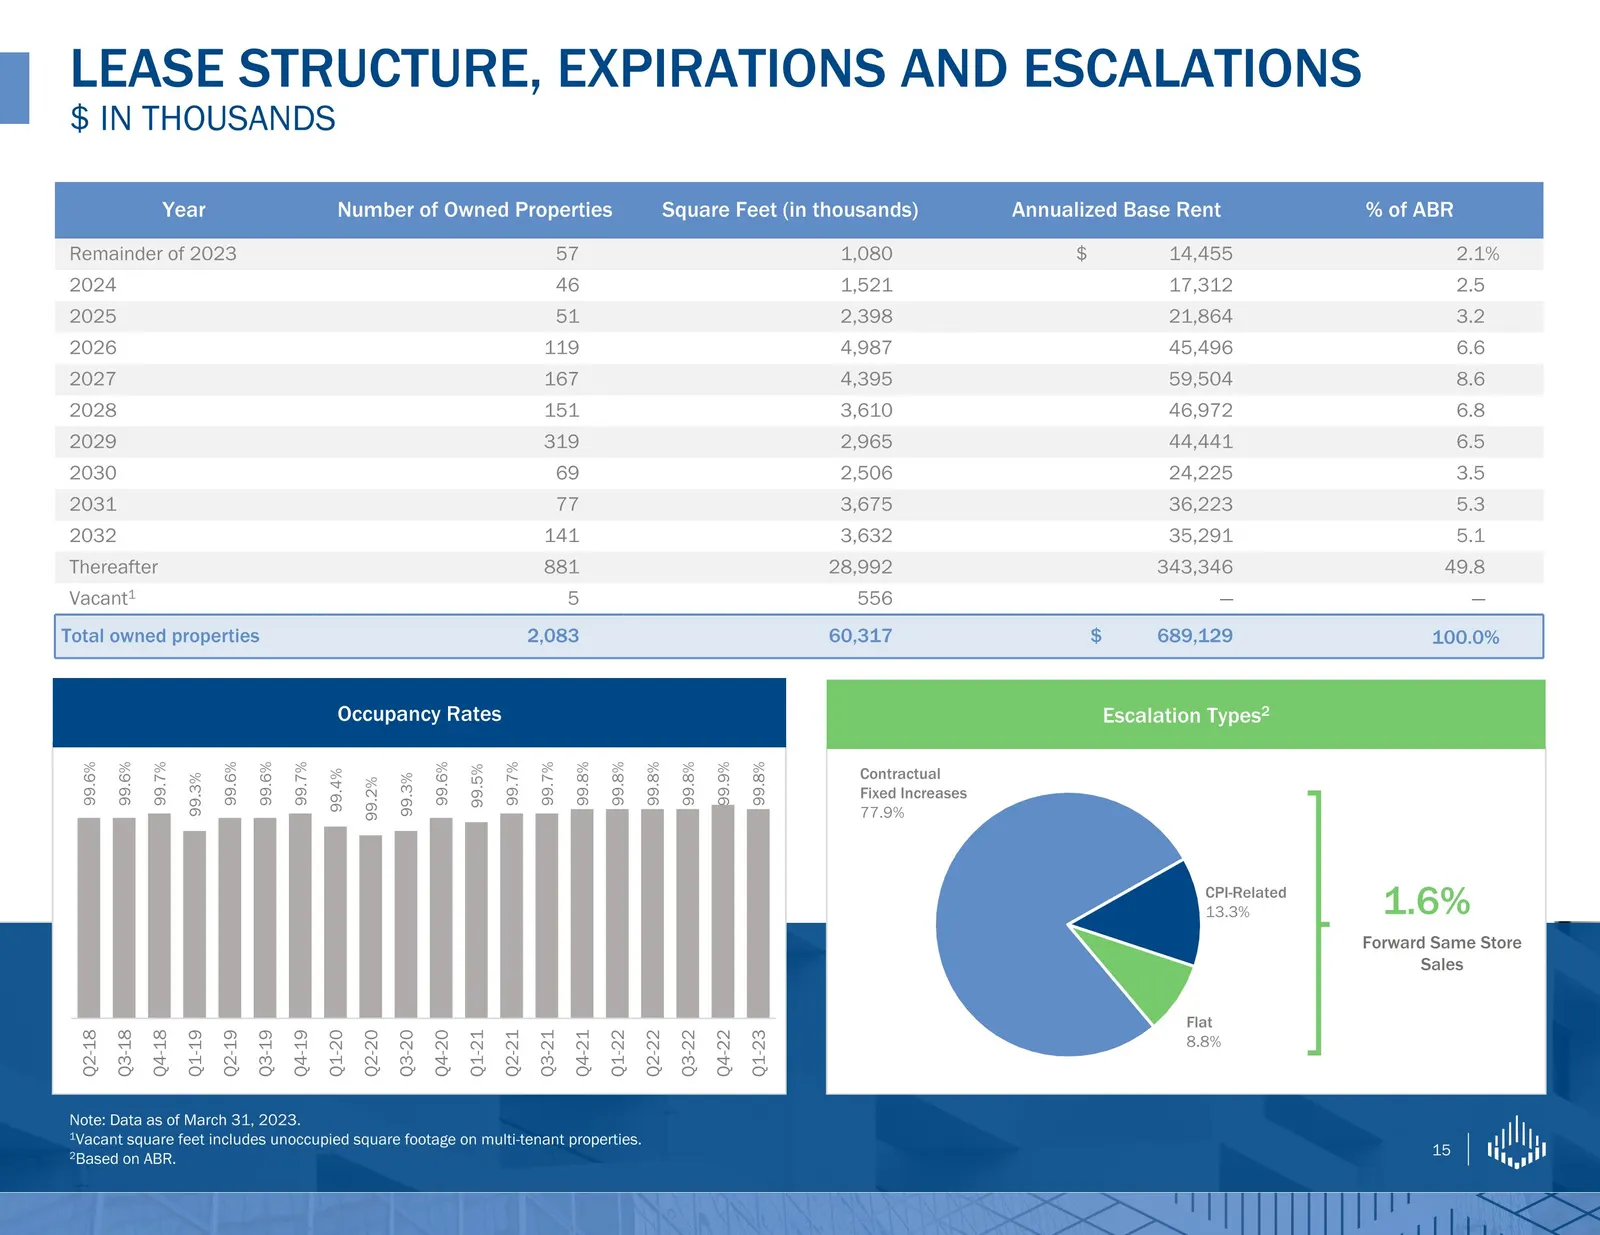
LEASE STRUCTURE, EXPIRATIONS AND ESCALATIONS $ in thousands Year Number of Owned Properties Square Feet (in thousands) Annualized Base Rent Contractual Rent Annualized (1) % of ABR Remainder of 2023 57 1,080 $ 14,455 2.1% 2024 46 1,521 17,312 2.5 2025 51 2,398 21,864 3.2 2026 119 4,987 45,496 6.6 20
Slide 16: Portfolio diversification
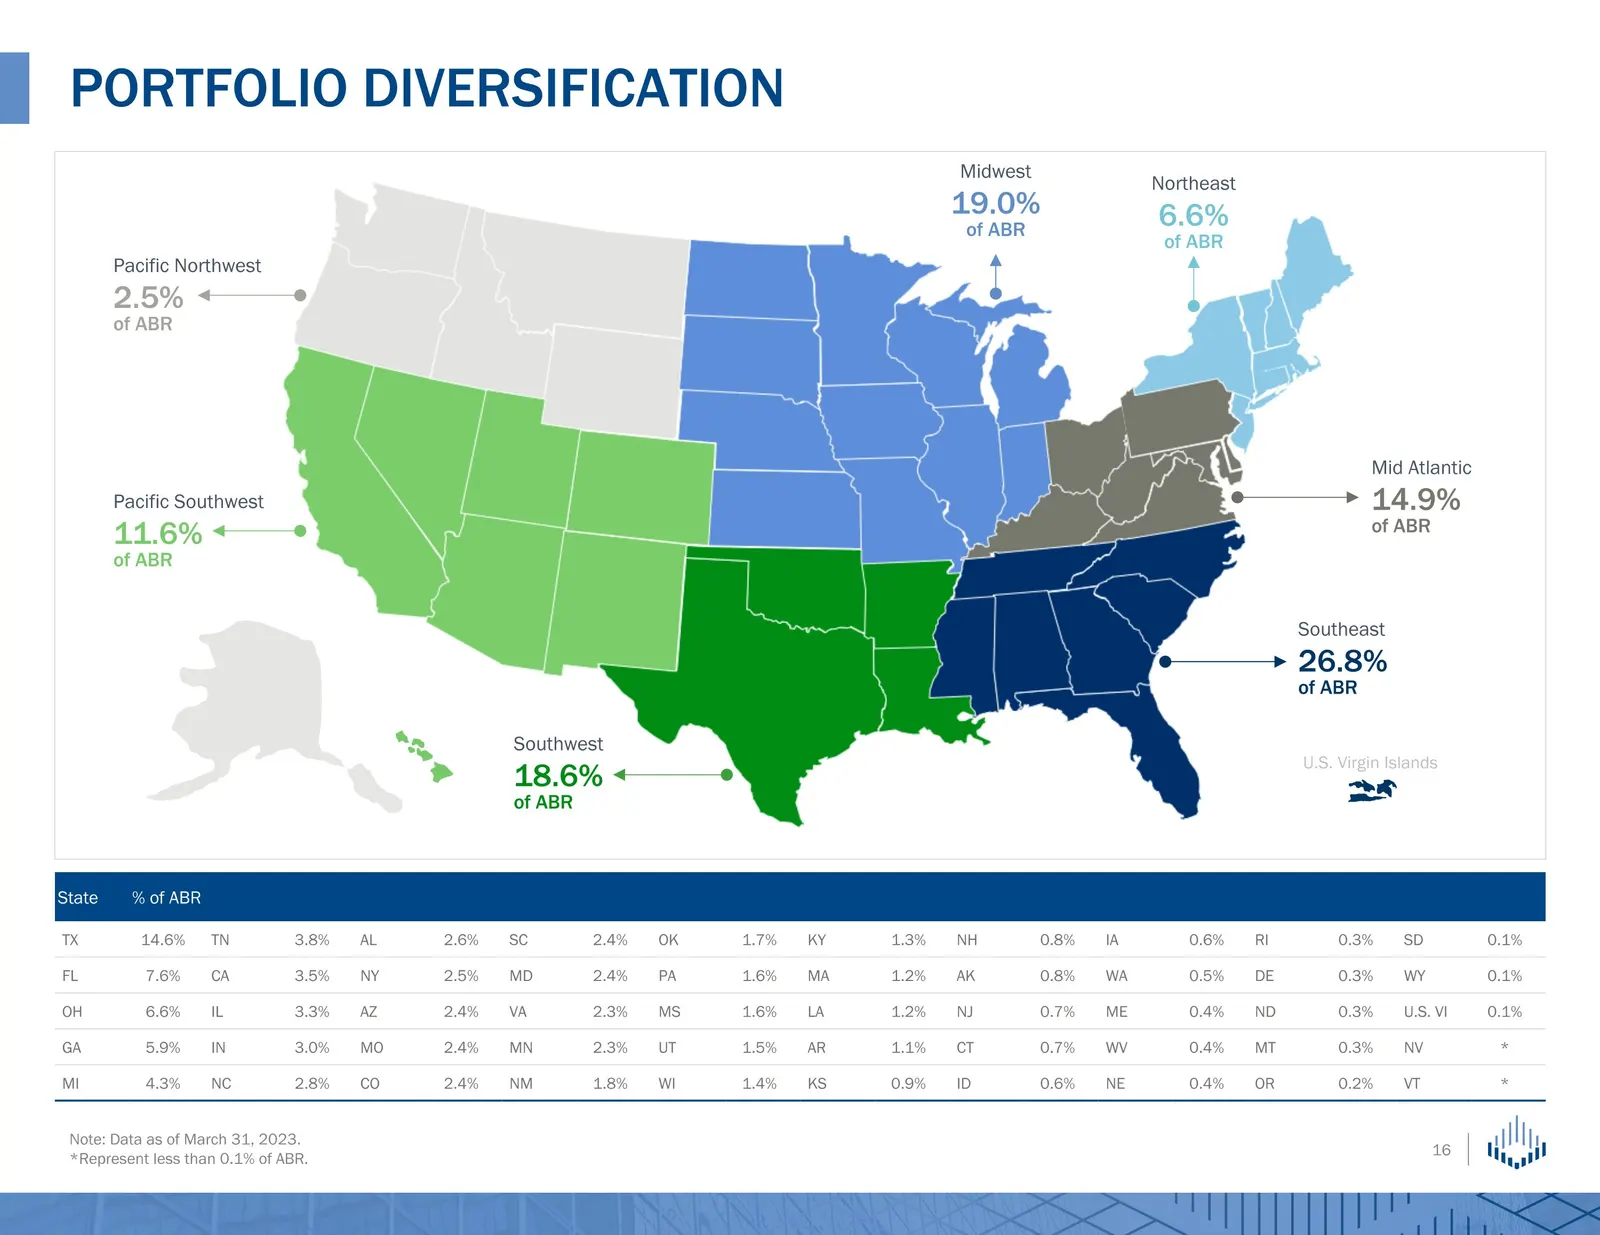
Note: Data as of March 31, 2023. *Represent less than 0.1% of ABR. PORTFOLIO DIVERSIFICATION Pacific Northwest 2.5% of ABR Mid Atlantic 14.9% of ABR Southeast 26.8% of ABR Midwest 19.0% of ABR Southwest 18.6% of ABR Northeast 6.6% of ABR Pacific Southwest 11.6% of ABR State % of ABR TX 14.6% TN 3.8%
Slide 17: Financial Information and Non-GAAP Reconciliations
Financial Information and Non-GAAP Reconciliations
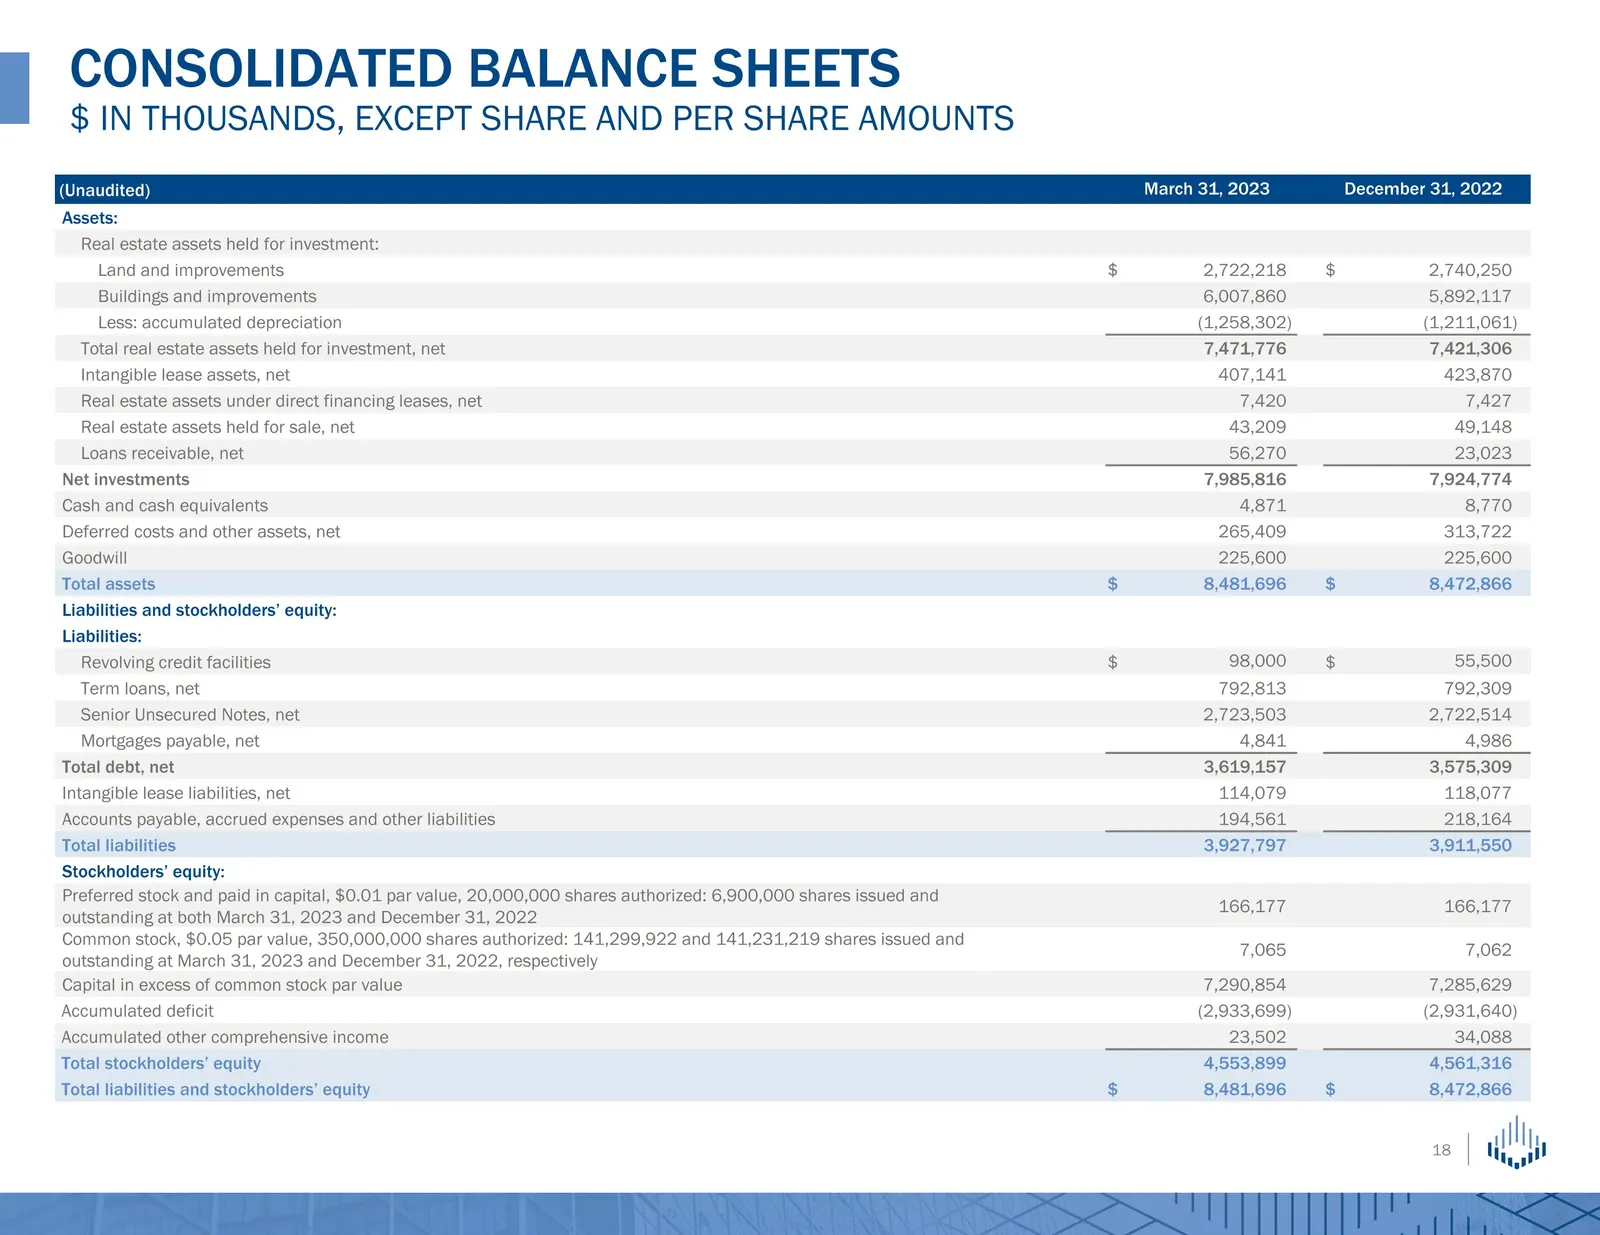
Slide 18: Consolidated Balance Sheets
(Unaudited) March 31, 2023 March 31, 2019 December 31, 2022 December 31, 2018 Assets: Real estate assets held for investment: Land and improvements $ 2,722,218 $ 2,740,250 Buildings and improvements 6,007,860 5,892,117 Less: accumulated depreciation (1,258,302 ) (1,211,061 ) Total real estate assets
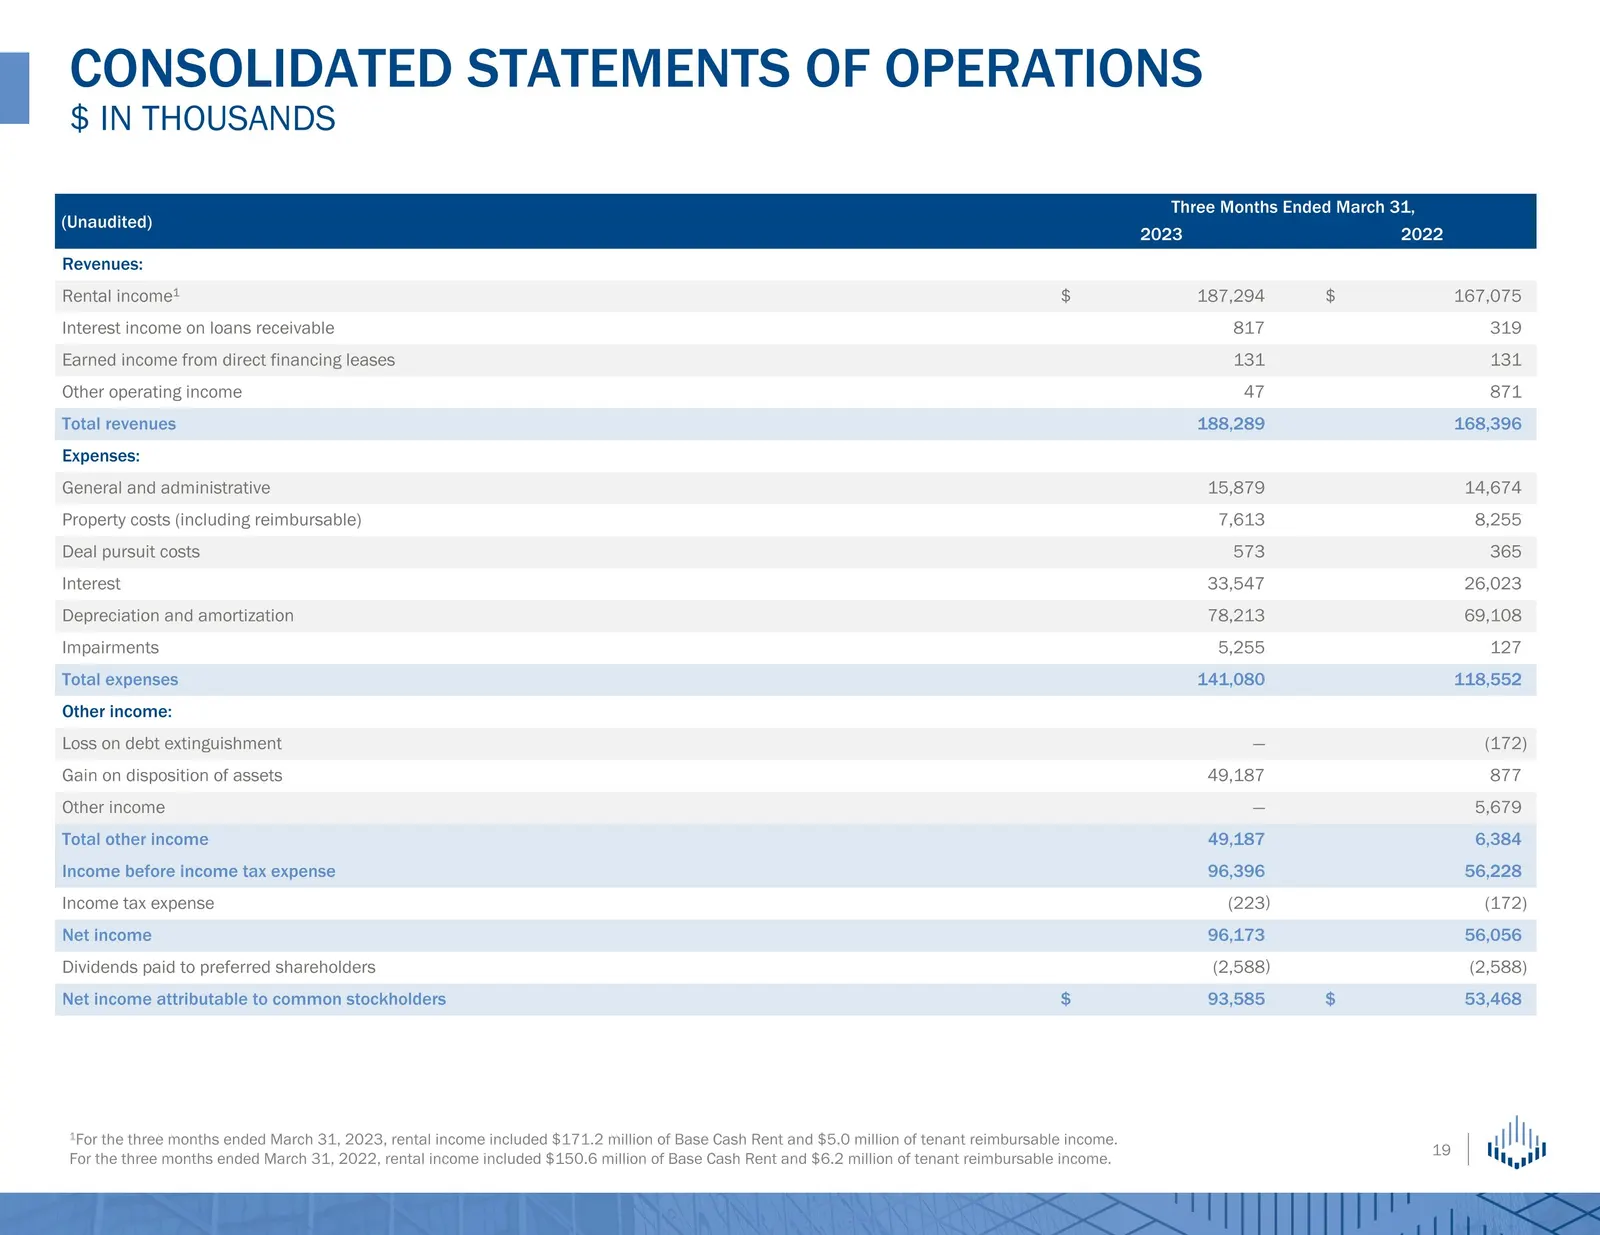
Slide 19: Consolidated Statements of Operations
(Unaudited) Three Months Ended March 31, Three Months Ended March 31, 2023 2019 2022 2018 Revenues: Rental income1 $ 104,067 187,294 $ 98,236 167,075 Interest income on loans receivable 986 817 294 319 Earned income from direct financing leases 396 131 465 131 Other operating income 217 47 1,245 871
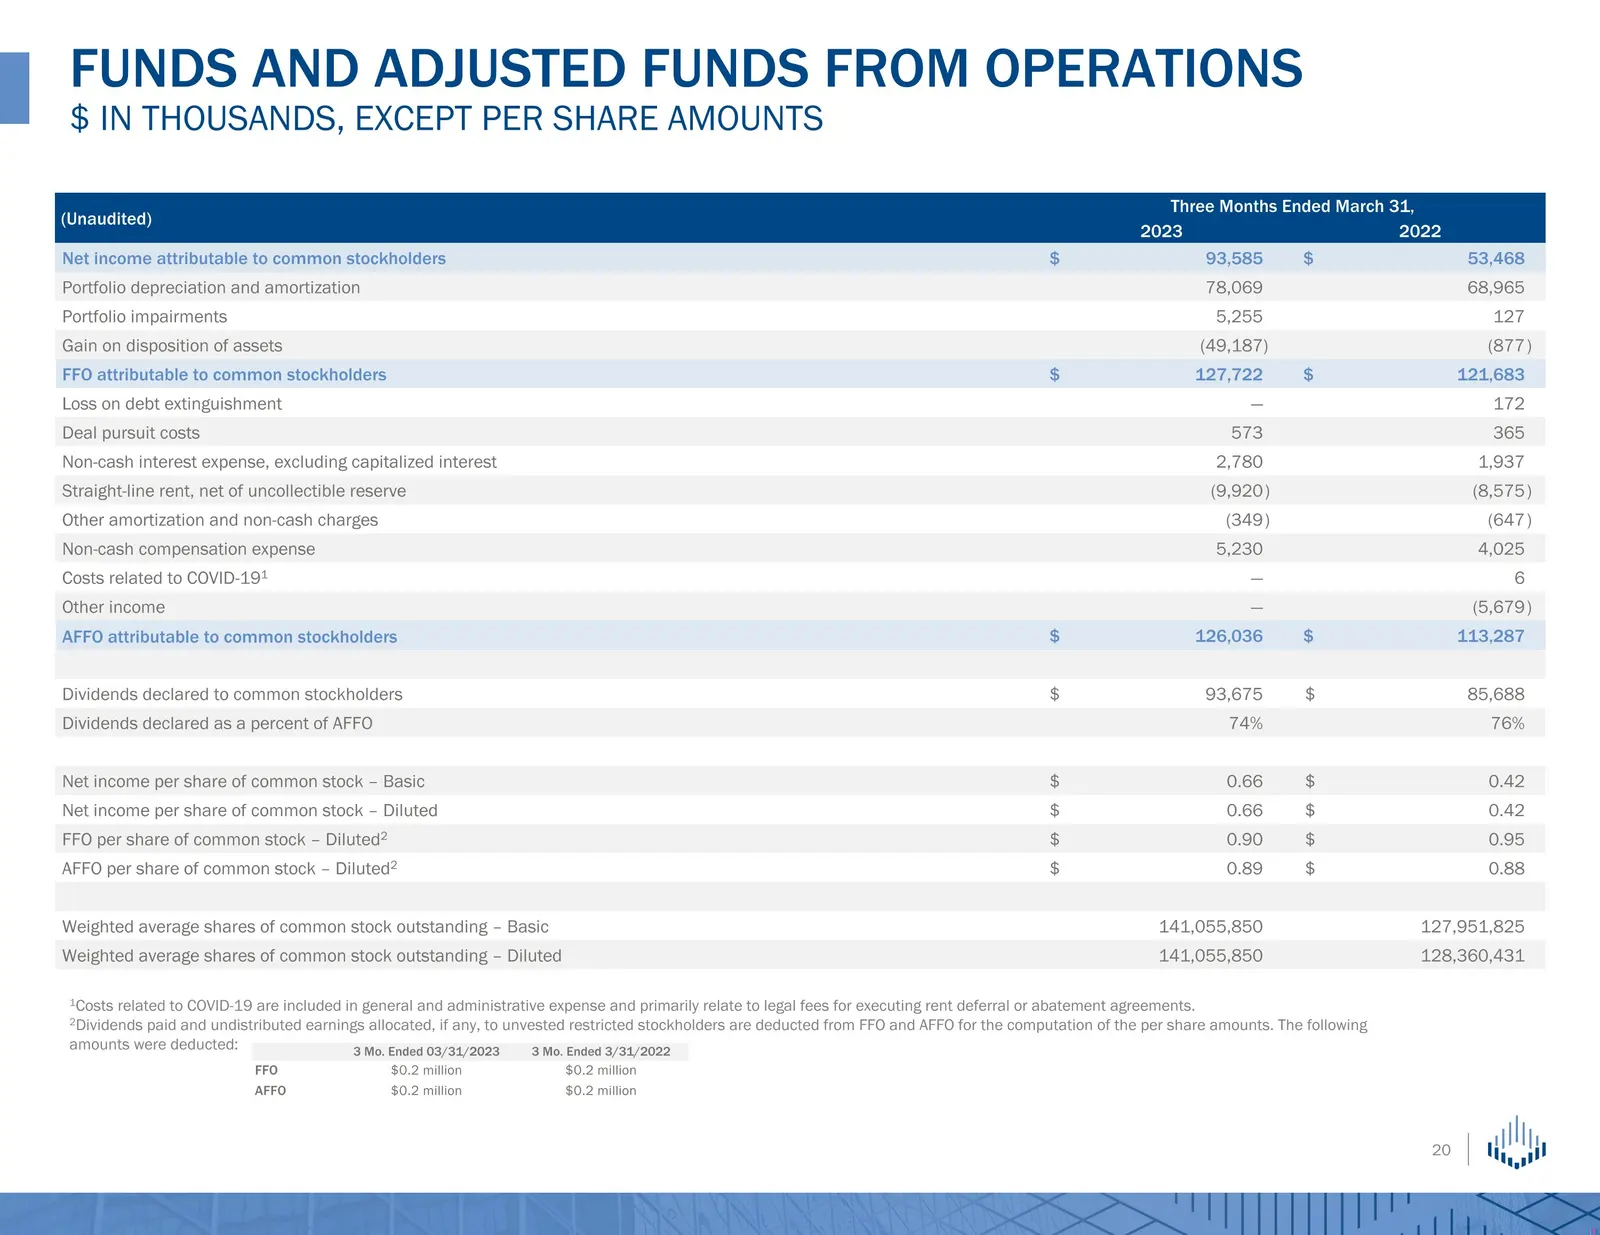
Slide 20: FFO and AFFO reconciliation
1Costs related to COVID-19 are included in general and administrative expense and primarily relate to legal fees for executing rent deferral or abatement agreements. 2Dividends paid and undistributed earnings allocated, if any, to unvested restricted stockholders are deducted from FFO and AFFO for t
Slide 21: Annualized Adjusted EBITDAre and coverage
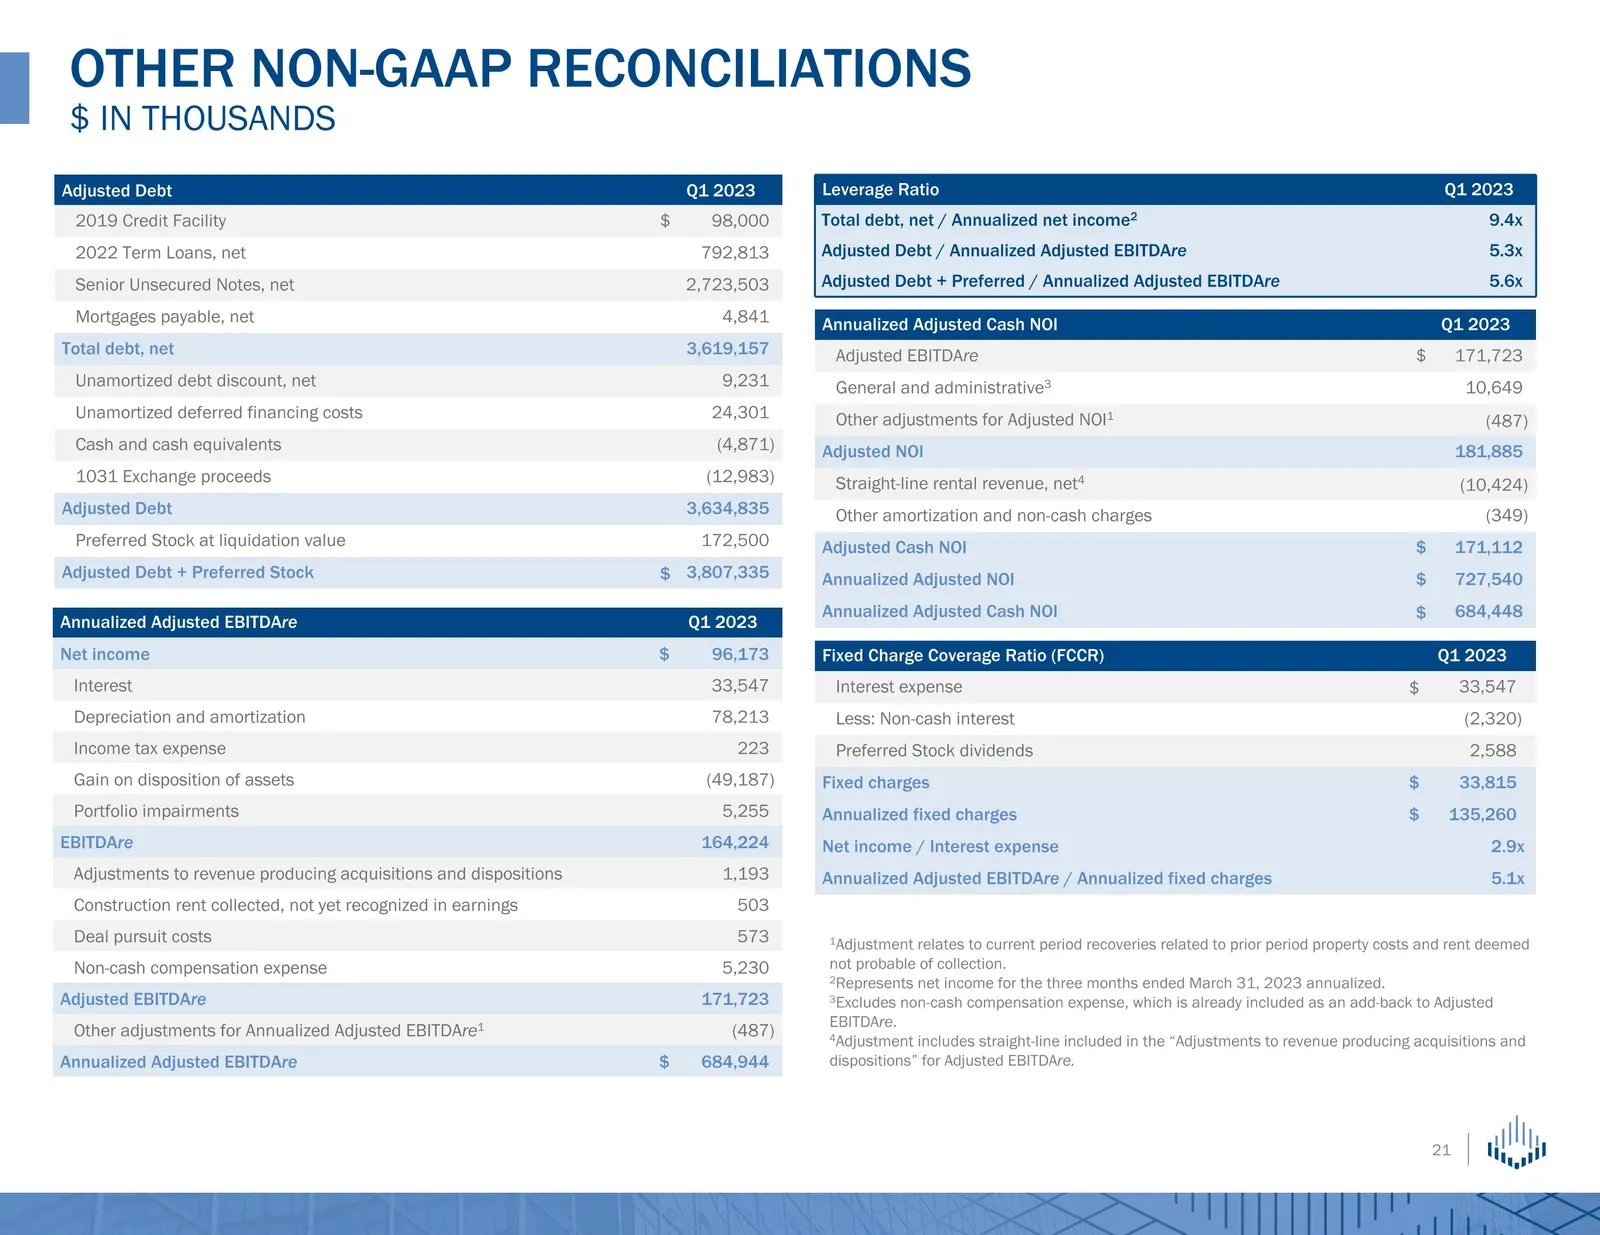
Annualized Adjusted EBITDAre Q1 2023 Q1 2019 Net income $ 96,173 Interest 33,547 Depreciation and amortization 78,213 Income tax expense 223 Gain on disposition of assets (49,187 ) Portfolio impairments 5,255 EBITDAre 164,224 Adjustments to revenue producing acquisitions and dispositions 1,193 Const
Slide 22: Capital structure and liquidity
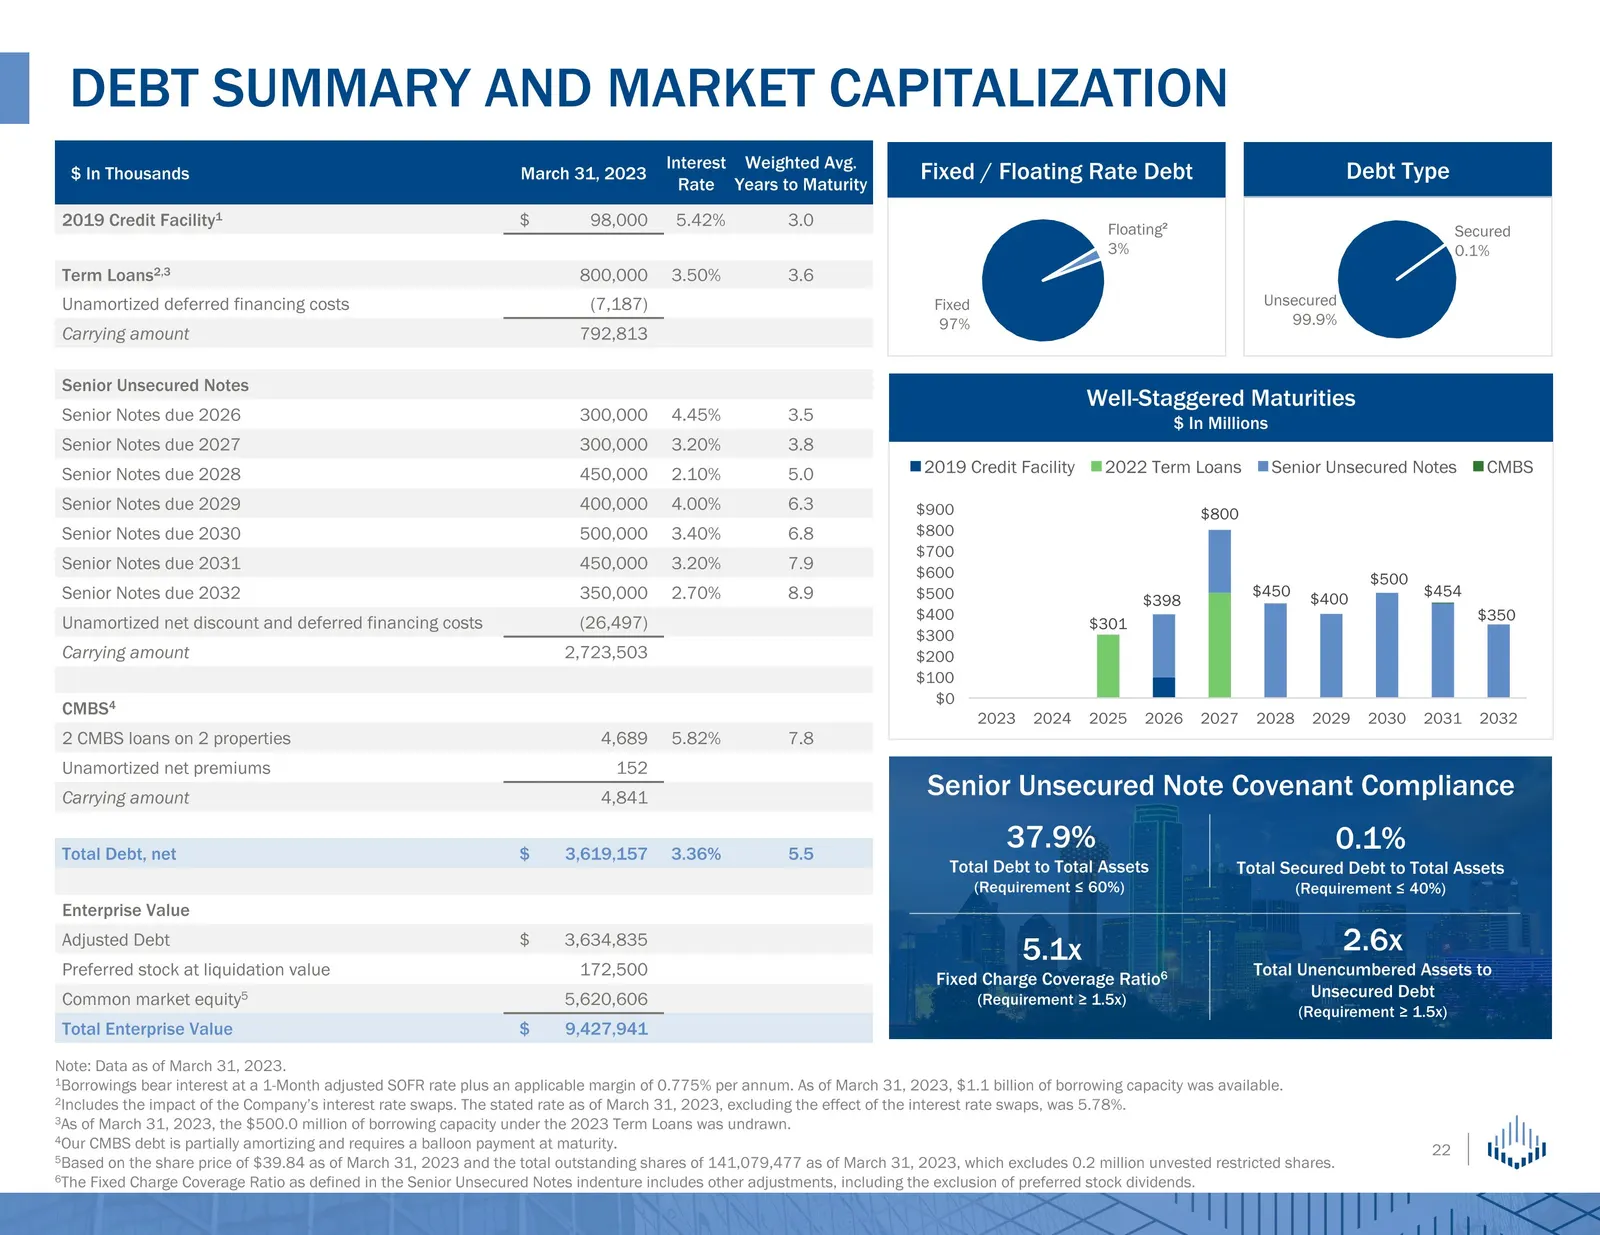
Note: Data as of March 31, 2023. 1Borrowings bear interest at a 1-Month adjusted SOFR rate plus an applicable margin of 0.775% per annum. As of March 31, 2023, $1.1 billion of borrowing capacity was available. 2Includes the impact of the Company’s interest rate swaps. The stated rate as of March 31,
Slide 23: Net Asset Value (NAV) Components
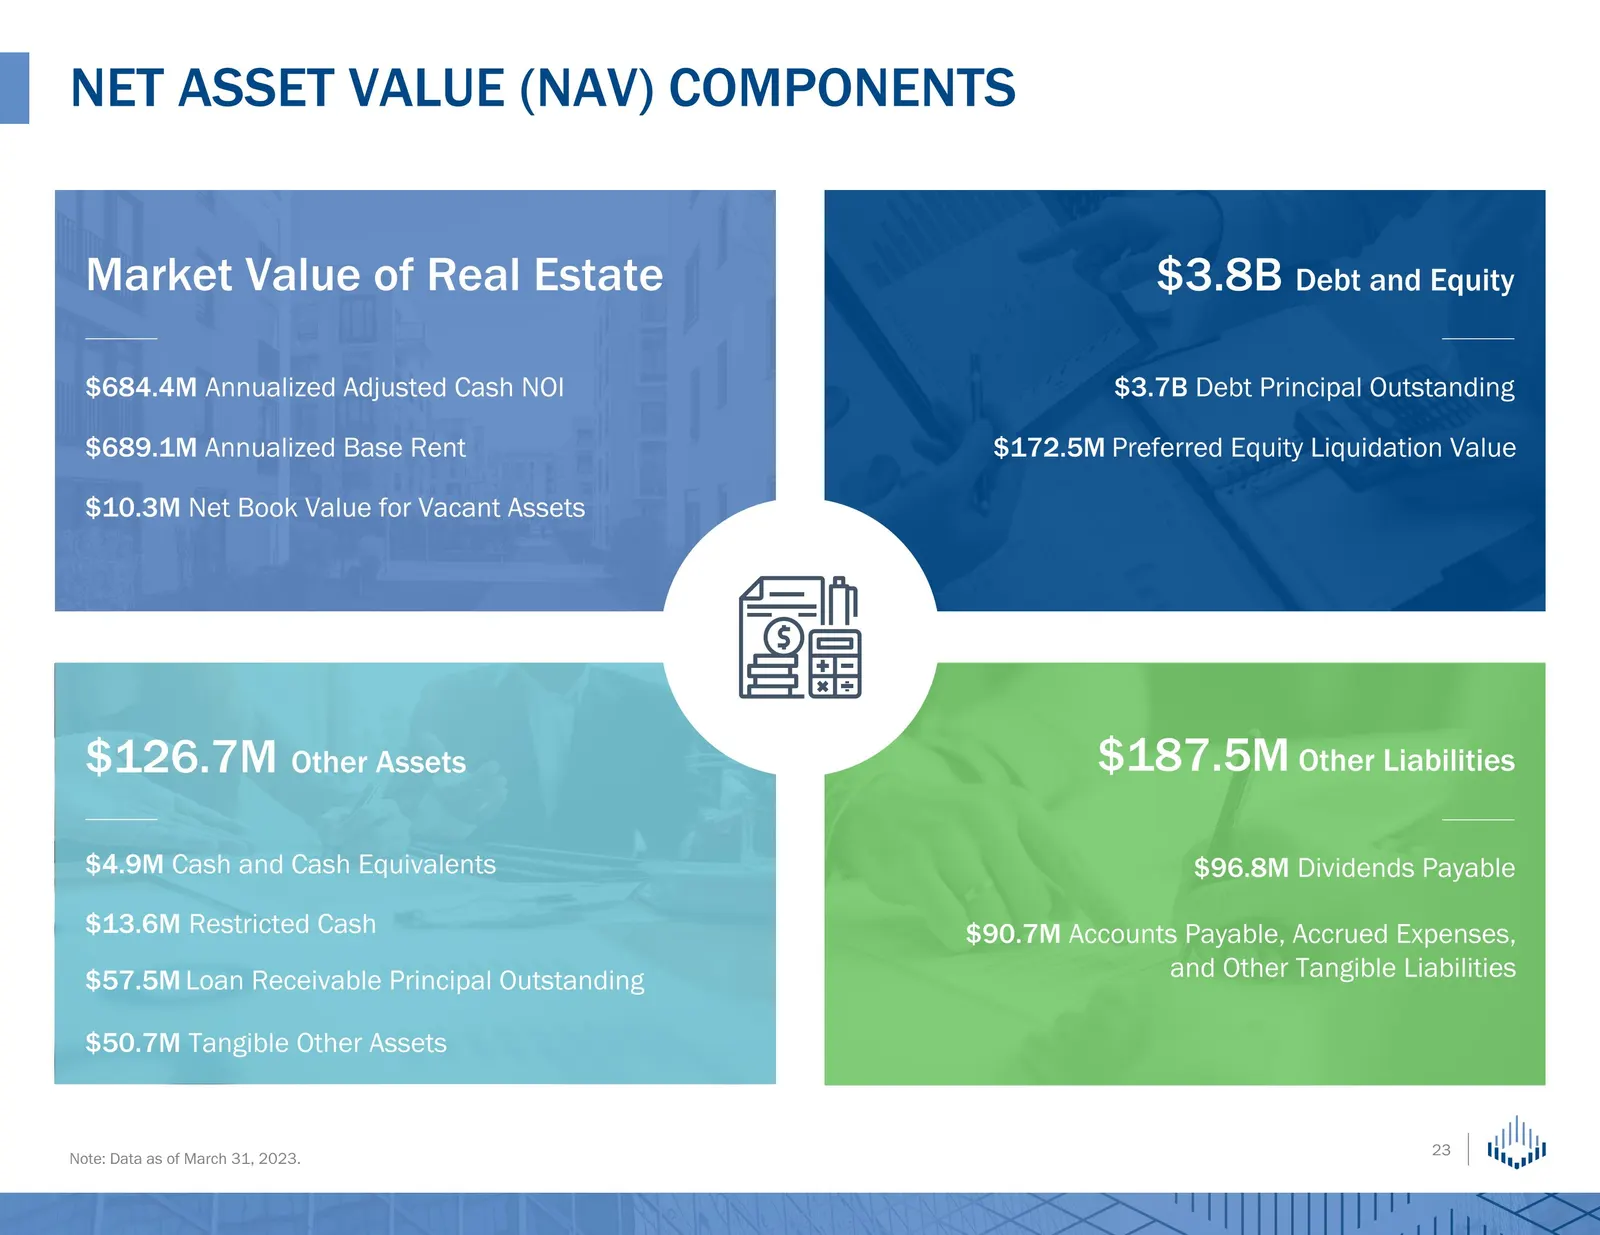
Net Asset Value (NAV) Components Note: Data as of March 31, 2023. Market Value of Real Estate $3.8B Debt and Equity $126.7M Other Assets $187.5M Other Liabilities $689.1M Annualized Base Rent $10.3M Net Book Value for Vacant Assets $3.7B Debt Principal Outstanding $172.5M Preferred Equity Liquidatio

Slide 24: Appendix
Appendix
Slide 25: Funds from Operations (FFO) and Adjusted Funds from Operations (AFFO)
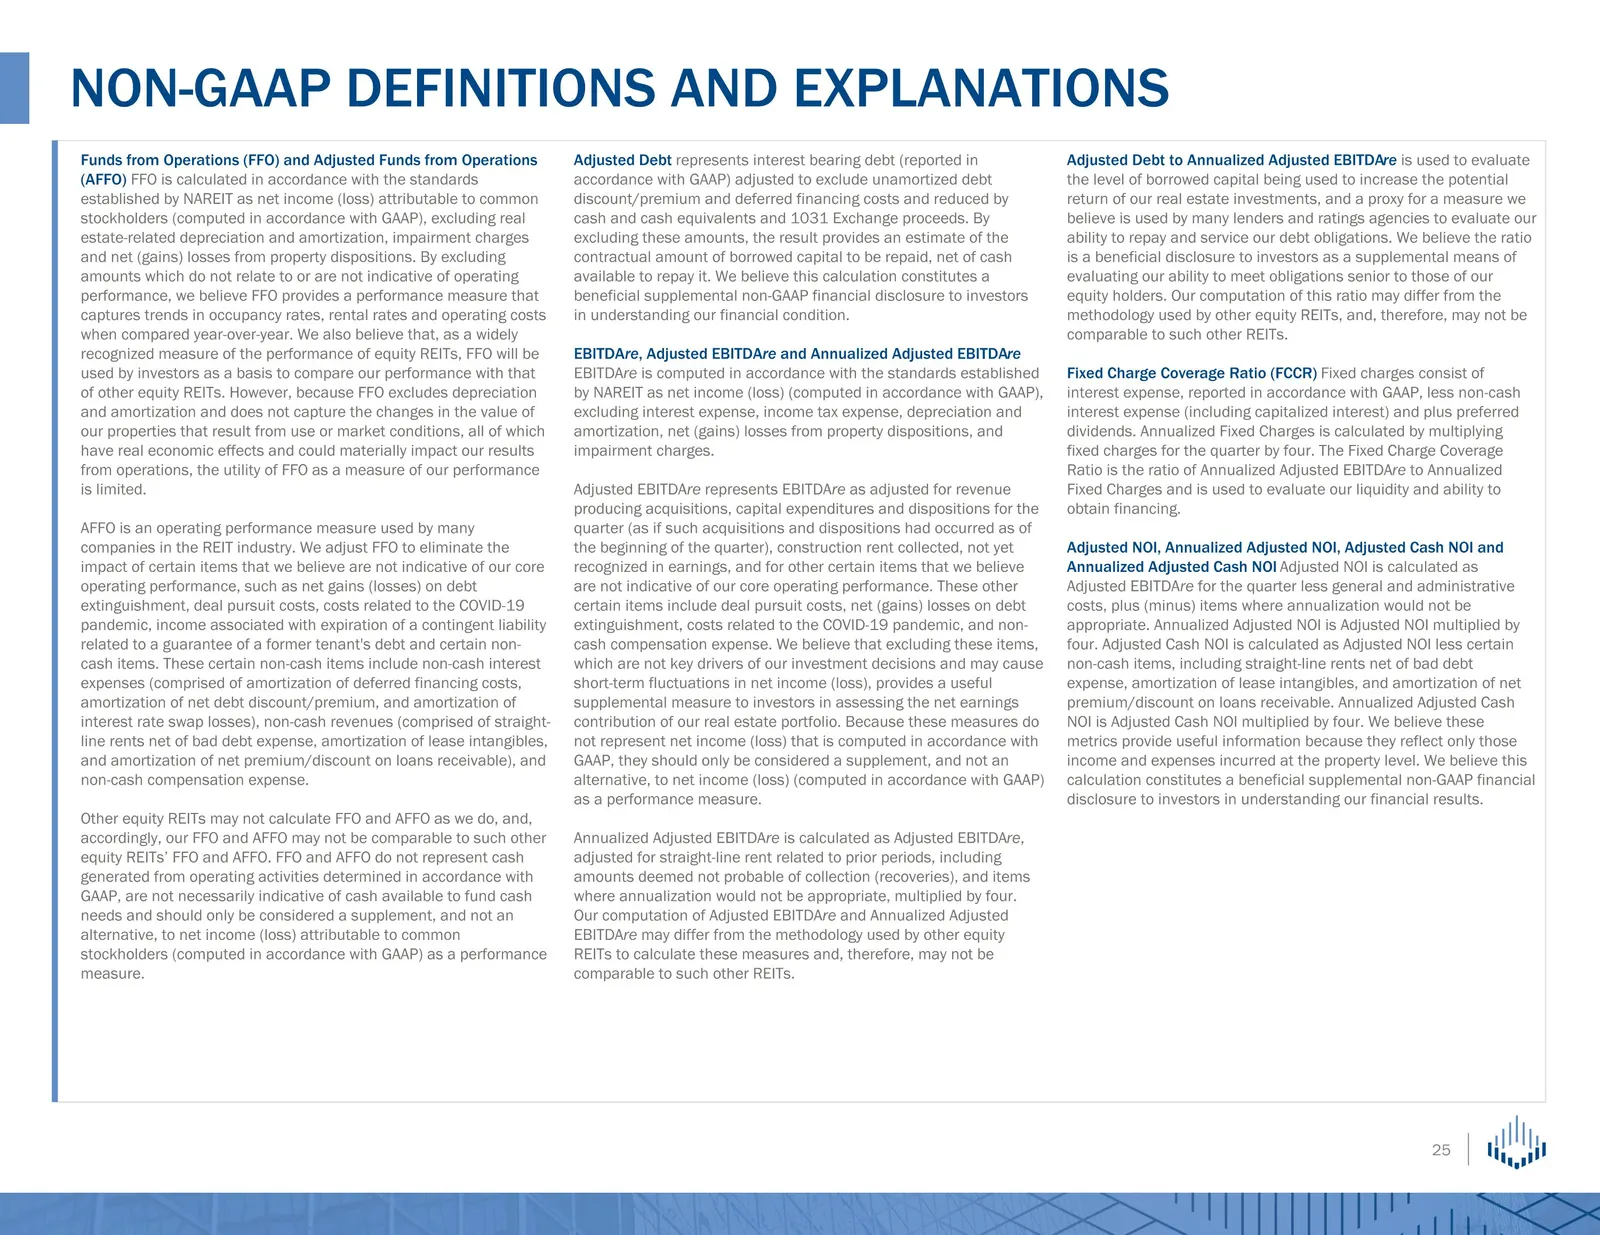
Funds from Operations (FFO) and Adjusted Funds from Operations (AFFO) FFO is calculated in accordance with the standards established by NAREIT as net income (loss) attributable to common stockholders (computed in accordance with GAAP), excluding real estate-related depreciation and amortization, imp
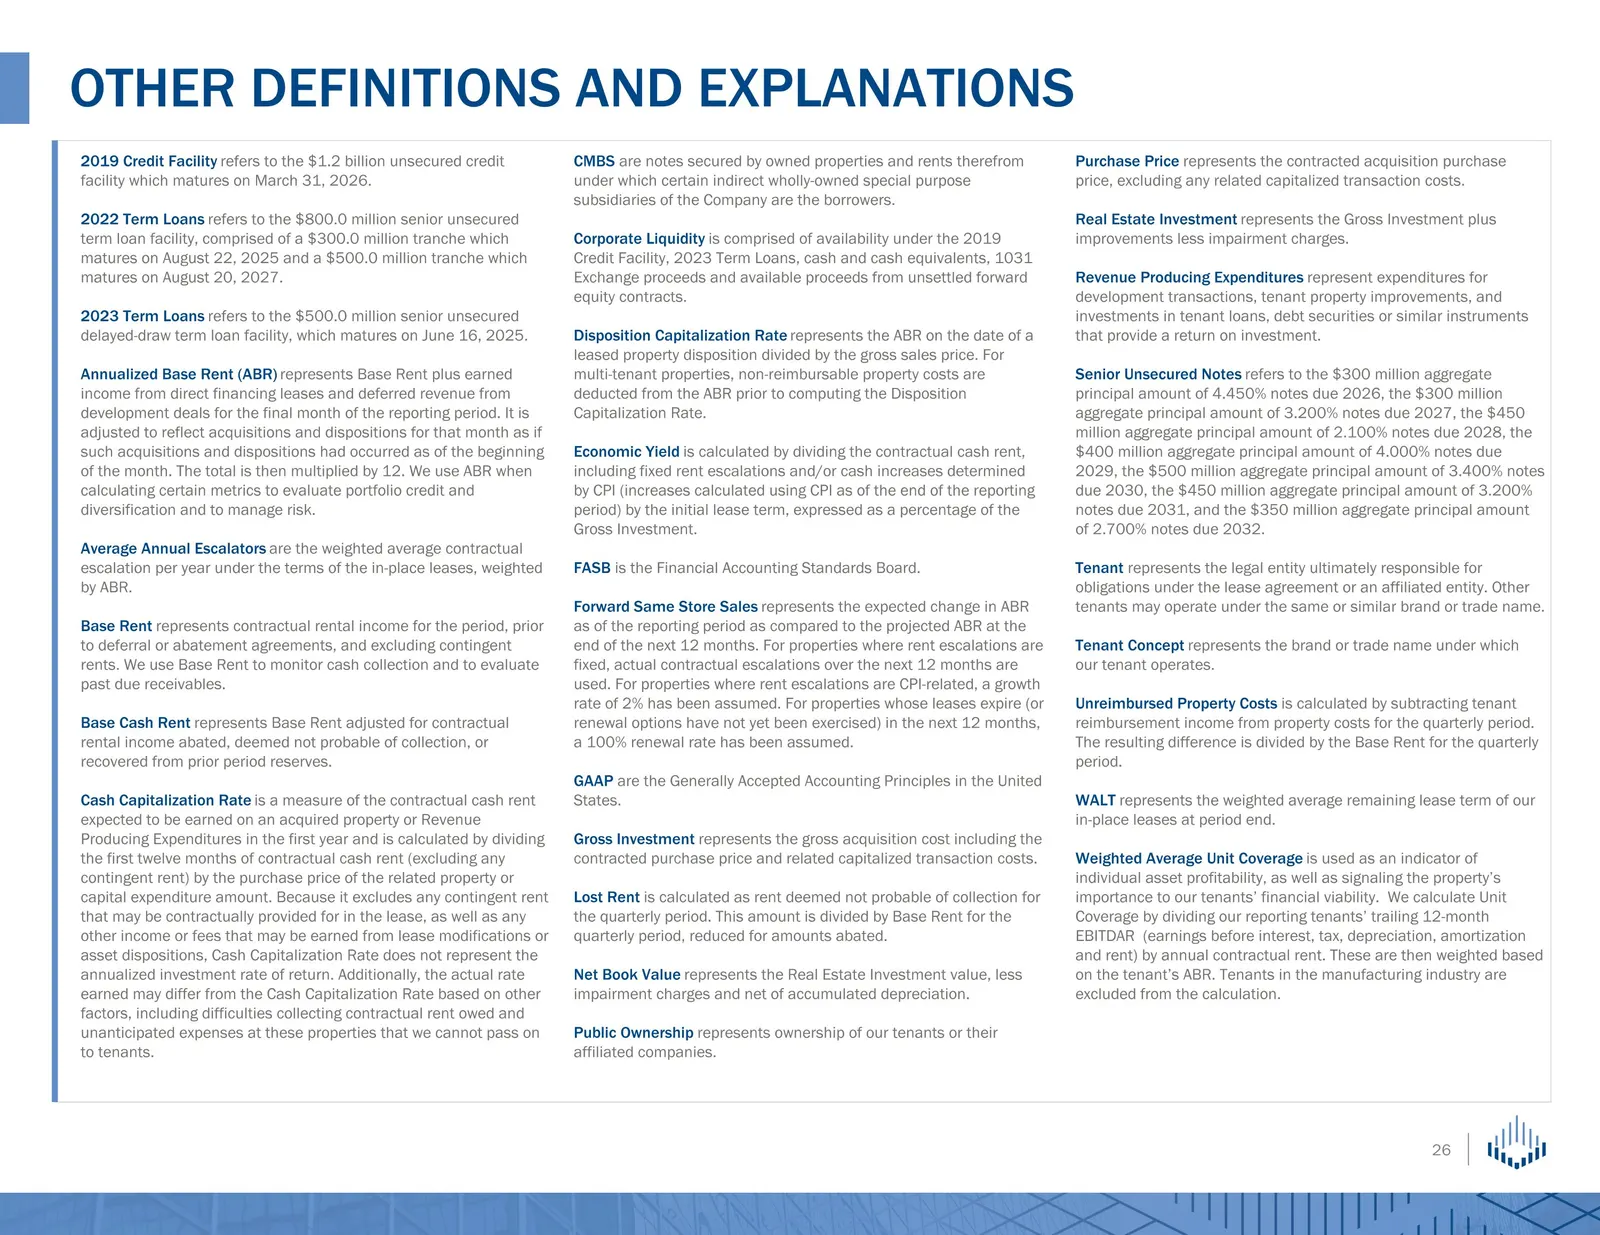
Slide 26: Definitions and debt facilities
2019 Credit Facility refers to the $1.2 billion unsecured credit facility which matures on March 31, 2026. 2022 Term Loans refers to the $800.0 million senior unsecured term loan facility, comprised of a $300.0 million tranche which matures on August 22, 2025 and a $500.0 million tranche which matur
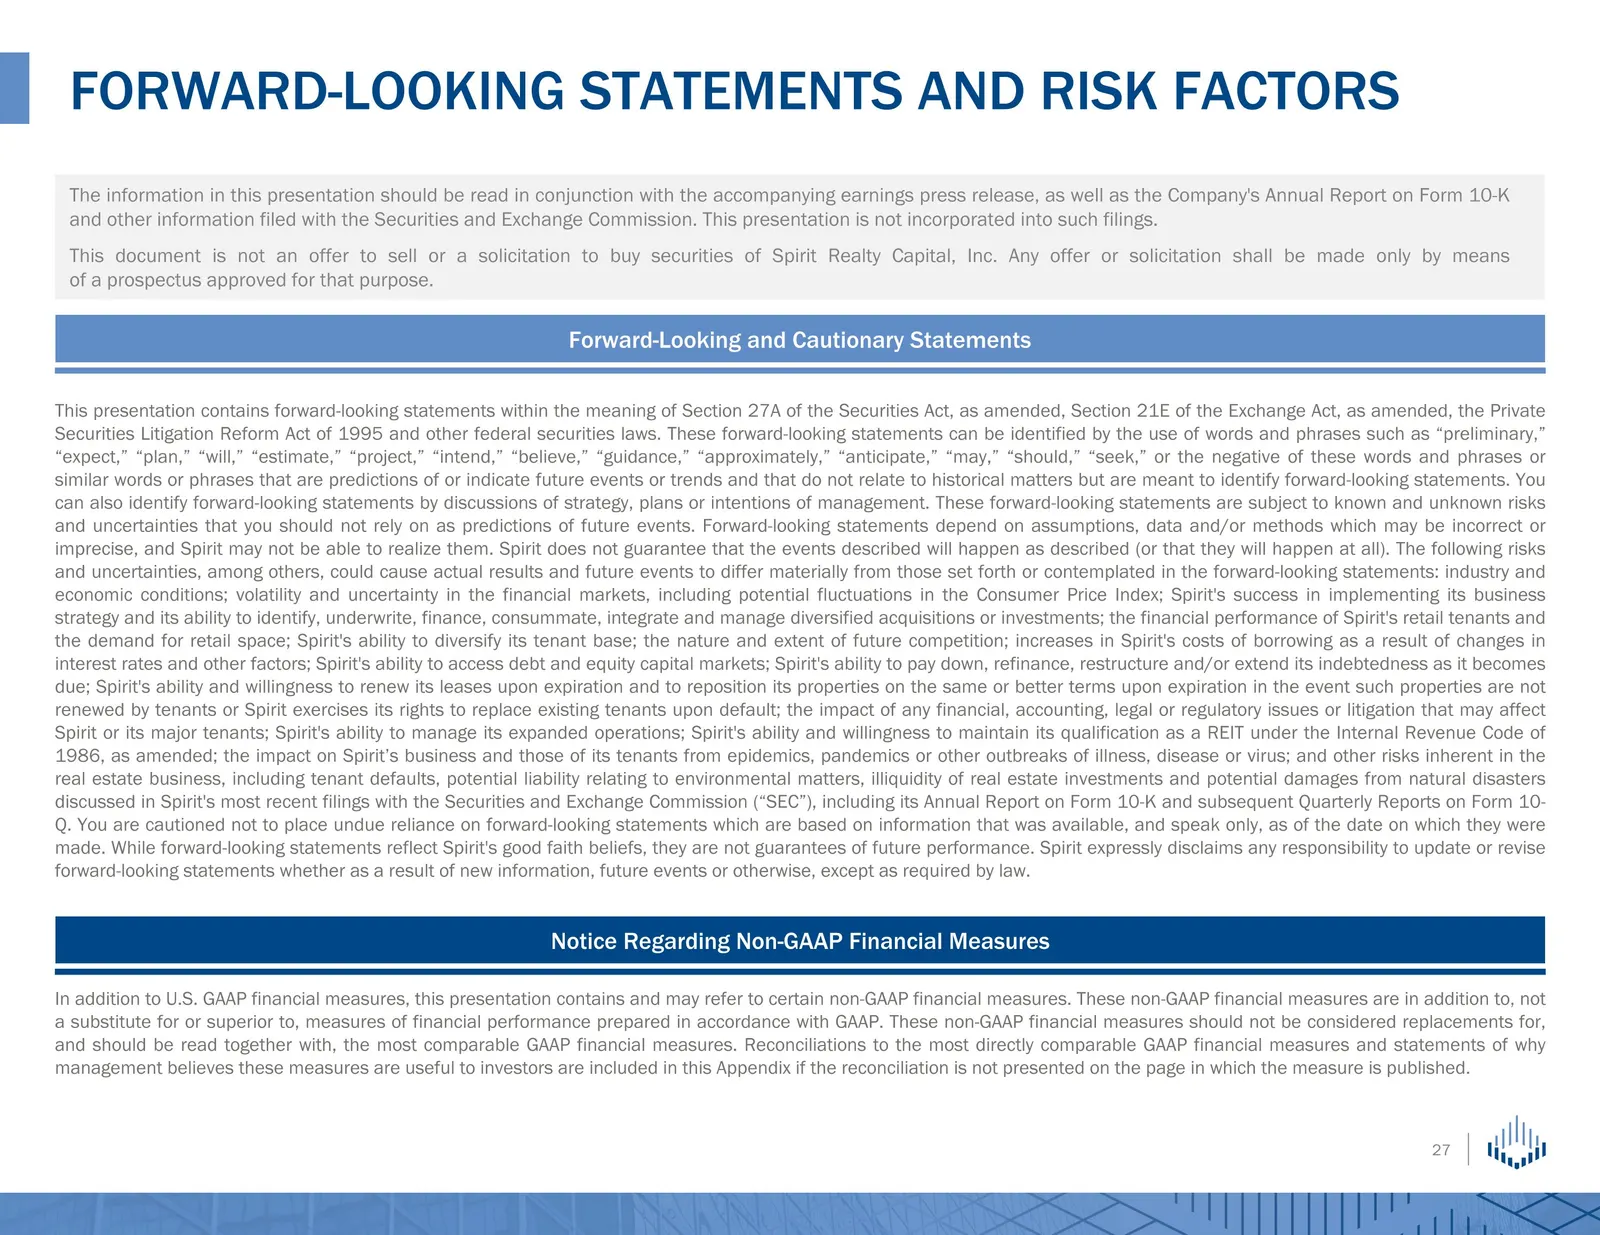
Slide 27: Forward-Looking Statements and Risk Factors
FORWARD-LOOKING STATEMENTS AND RISK FACTORS The information in this presentation should be read in conjunction with the accompanying earnings press release, as well as the Company's Annual Report on Form 10-K and other information filed with the Securities and Exchange Commission. This presentation
Source: SEC EDGAR · 8-K filed May 3, 2023
More decks from Spirit Realty Capital Inc
 Q3 2023 Earnings Presentation28 slides · Nov 2, 2023
 Merger or Acquisition (October 2023)20 slides · Oct 30, 2023
 Q2 2023 Earnings Presentation26 slides · Aug 7, 2023
 Q2 2023 Earnings Presentation26 slides · August 2023
 Q4 2022 Earnings Presentation31 slides · Feb 28, 2023
 Q3 2022 Earnings Presentation26 slides · Nov 8, 2022