Strategic Hotels and Resorts Inc
Strategic Hotels and Resorts — Investor Presentation (February 2014)
48 slides from Strategic Hotels and Resorts's investor presentation, Feb 26, 2014

Slide 1: Investor Presentation February 2014
Investor Presentation February 2014 Exhibit 99.1

Slide 2: Strategic Hotels: An Overview
I. Strategic Hotels: An Overview II. Financial Overview III. Strategic Plan IV. Industry Update & Operating Trends V. Appendix I. Case Studies II. Corporate Governance Strategic Hotels: An Overview 1
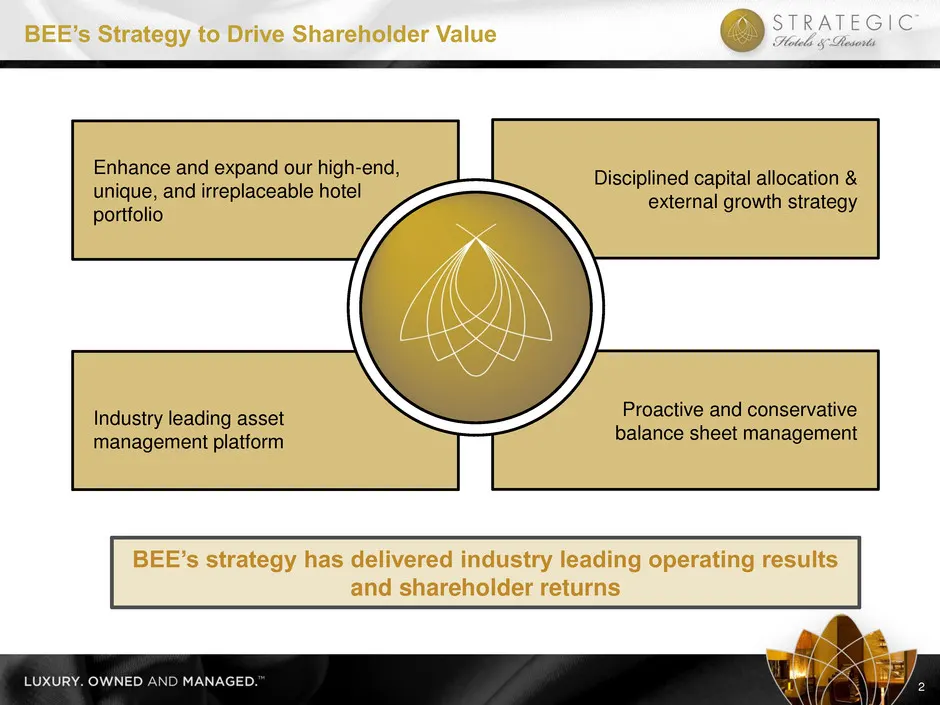
Slide 3: BEE's Strategy to Drive Shareholder Value
2 BEE’s Strategy to Drive Shareholder Value Disciplined capital allocation & external growth strategy Enhance and expand our high-end, unique, and irreplaceable hotel portfolio Proactive and conservative balance sheet management Industry leading asset management platform BEE’s strategy has delivered
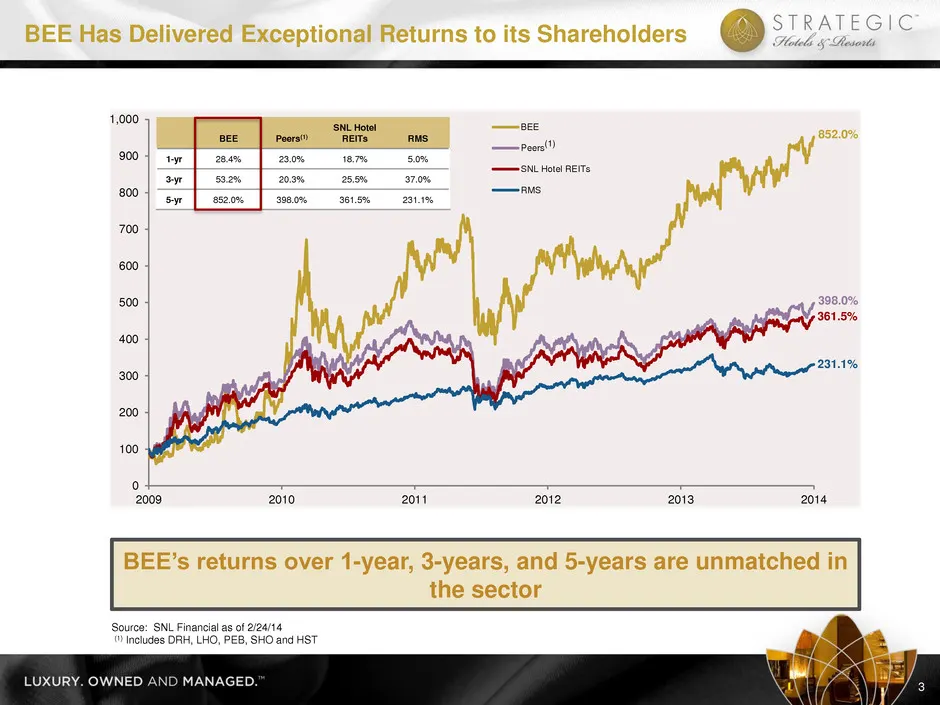
Slide 4: BEE Has Delivered Exceptional Returns to its Shareholders
3 BEE Has Delivered Exceptional Returns to its Shareholders BEE’s returns over 1-year, 3-years, and 5-years are unmatched in the sector Source: SNL Financial as of 2/24/14 (1) Includes DRH, LHO, PEB, SHO and HST 0 100 200 300 400 500 600 700 800 900 1,000 2009 2010 2011 2012 2013 2014 BEE Peers SNL

Slide 5: Financial Overview
I. Strategic Hotels: An Overview II. Financial Overview III. Strategic Plan IV. Industry Update & Operating Trends V. Appendix I. Case Studies II. Corporate Governance Financial Overview
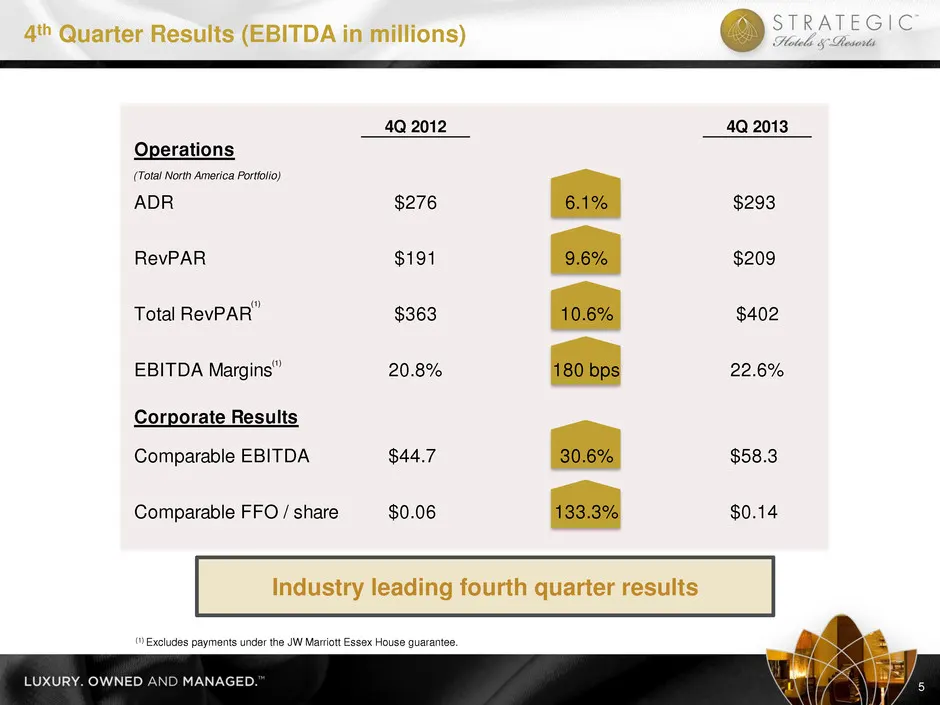
Slide 6: 4th Quarter Results
4th Quarter Results (EBITDA in millions) 5 (1) (1) Excludes payments under the JW Marriott Essex House guarantee. . Industry leading fourth quarter results (1) 4Q 2012 4Q 2013 Operations (Total North America Portfolio) ADR $276 6.1% $293 RevPAR $191 9.6% $209 Total RevPAR $363 10.6% $402 EBITDA Marg
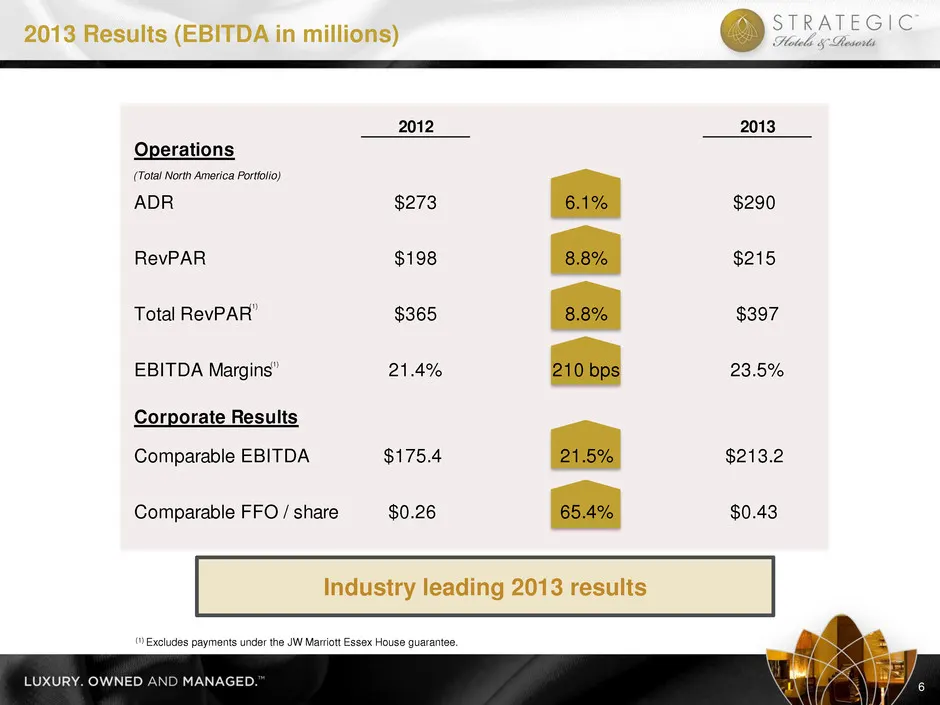
Slide 7: 2013 Results
2013 Results (EBITDA in millions) 6 Industry leading 2013 results (1) Excludes payments under the JW Marriott Essex House guarantee. (1) (1) 2012 2013 Operations (Total North America Portfolio) ADR $273 6.1% $290 RevPAR $198 8.8% $215 Total RevPAR $365 8.8% $397 EBITDA Margins 21.4% 210 bps 23.5% Co
Slide 8: 2014 Guidance
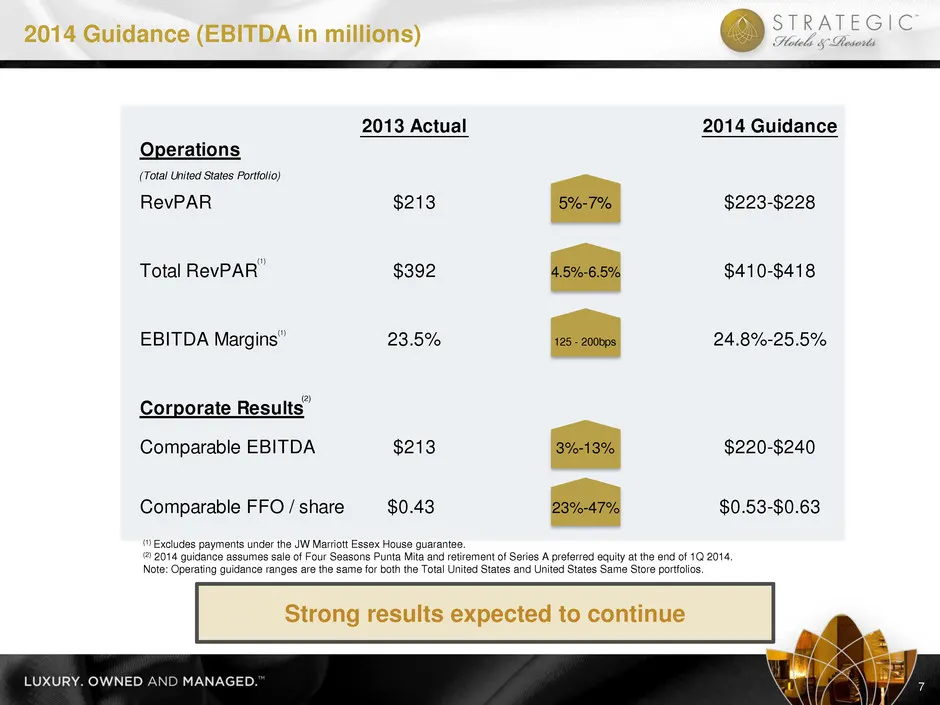
(1) Excludes payments under the JW Marriott Essex House guarantee. (2) 2014 guidance assumes sale of Four Seasons Punta Mita and retirement of Series A preferred equity at the end of 1Q 2014. Note: Operating guidance ranges are the same for both the Total United States and United States Same Store p

Slide 9: Strategic Plan
I. Strategic Hotels: An Overview II. Financial Overview III. Strategic Plan IV. Industry Update & Operating Trends V. Appendix I. Case Studies II. Corporate Governance Strategic Plan
Slide 10: BEE's Strategy to Drive Shareholder Value
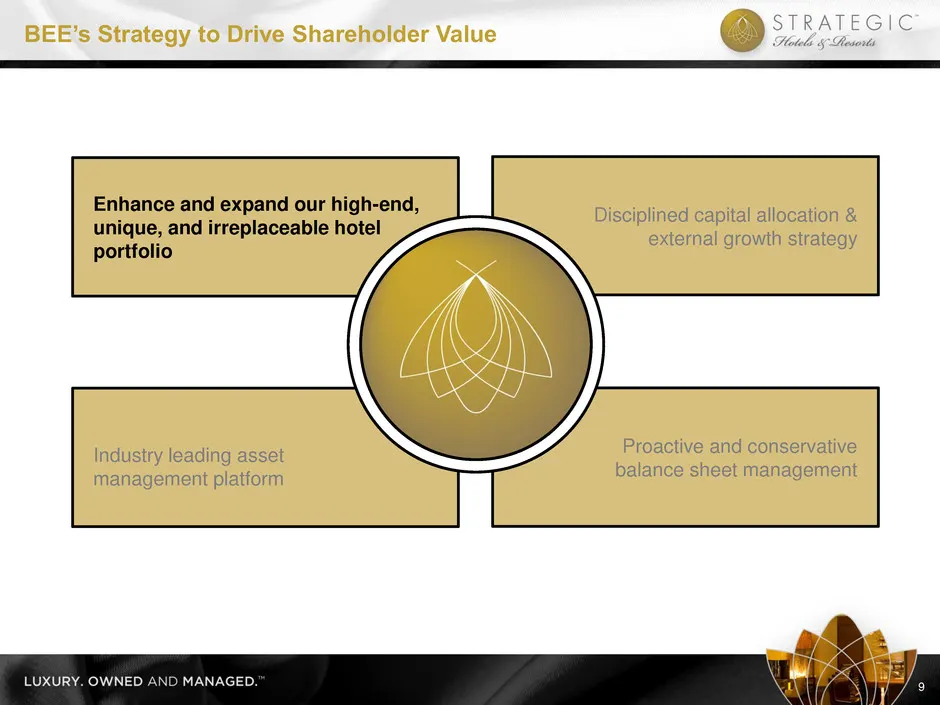
9 BEE’s Strategy to Drive Shareholder Value Disciplined capital allocation & external growth strategy Enhance and expand our high-end, unique, and irreplaceable hotel portfolio Proactive and conservative balance sheet management Industry leading asset management platform

Slide 11: High-End, Unique & Irreplaceable Portfolio
o Unique portfolio of luxury and upper upscale hotels in public markets o Locations in high-barrier-to-entry urban and resort markets with limited supply growth o Complex hotels with multiple revenue streams managed as mixed-use assets o World-class amenities managed by world-class operators High-En

Slide 12: Exceptional Portfolio of Urban and Resort Destinations
JW Marriott Essex House InterContinental Chicago Westin St. Francis Exceptional Portfolio of Urban and Resort Destinations 11 Ritz-Carlton Laguna Niguel Hotel del Coronado Four Seasons Washington, D.C.
Slide 13: Top-Tier Market Exposure
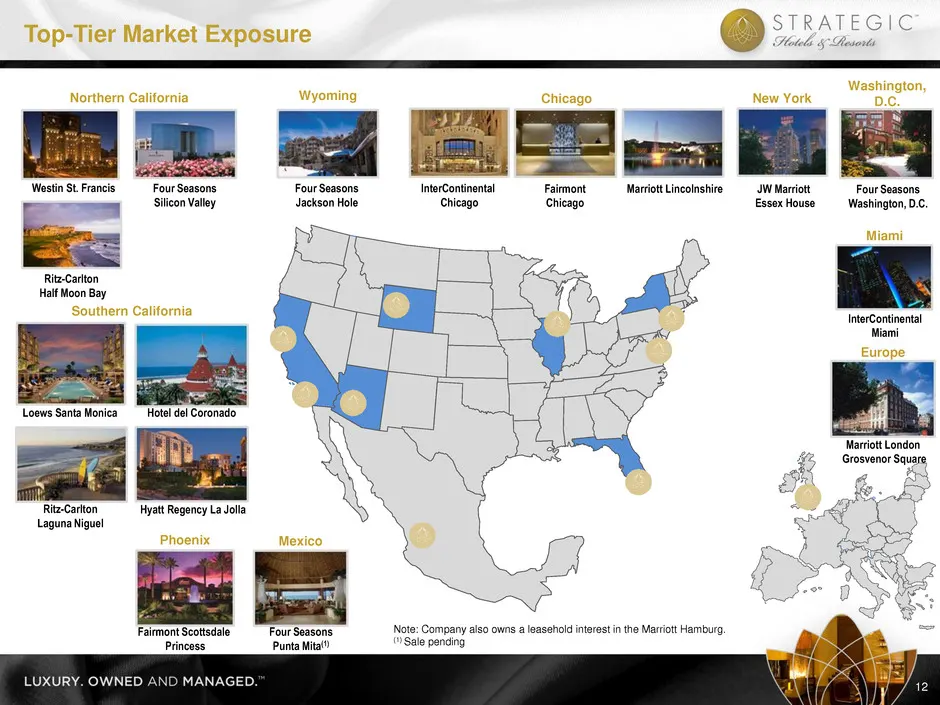
Top-Tier Market Exposure 12 Northern California Westin St. Francis Ritz-Carlton Half Moon Bay Four Seasons Silicon Valley Southern California Loews Santa Monica Ritz-Carlton Laguna Niguel Hyatt Regency La Jolla Hotel del Coronado Chicago InterContinental Chicago Fairmont Chicago Marriott Lincolnshir
Slide 14: Limited Competitive Supply Growth in BEE Markets
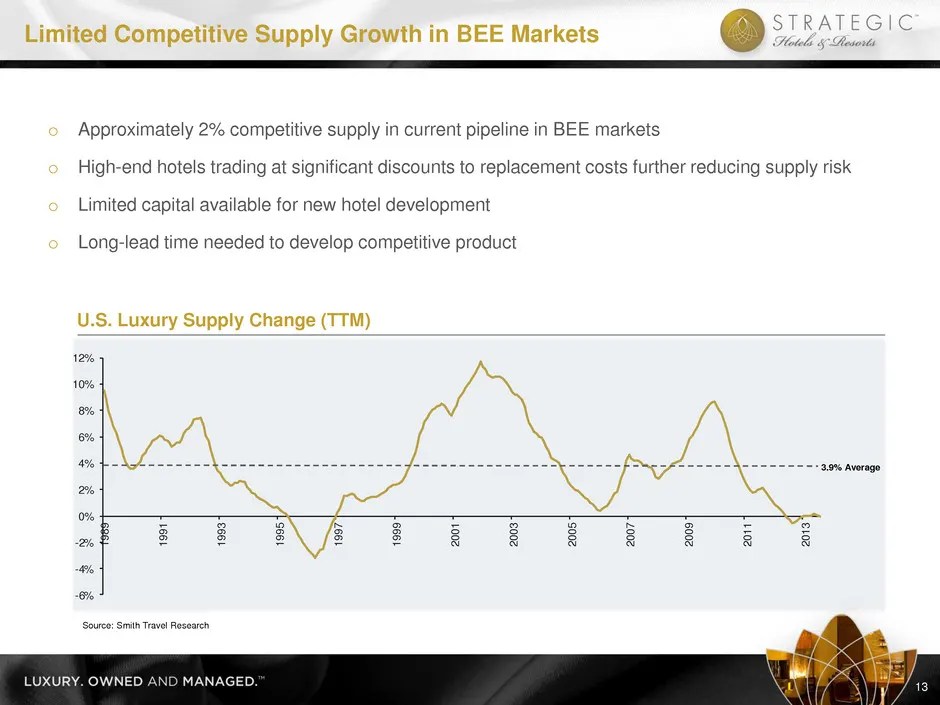
-6% -4% -2% 0% 2% 4% 6% 8% 10% 12% 198 9 199 1 199 3 199 5 199 7 199 9 200 1 200 3 200 5 200 7 200 9 201 1 201 3 o Approximately 2% competitive supply in current pipeline in BEE markets o High-end hotels trading at significant discounts to replacement costs further reducing supply risk o Limited cap
Slide 15: BEE's Strategy to Drive Shareholder Value
14 BEE’s Strategy to Drive Shareholder Value Disciplined capital allocation & external growth strategy Enhance and expand our high-end, unique, and irreplaceable hotel portfolio Proactive and conservative balance sheet management Industry leading asset management platform
Slide 16: Industry Leading Asset Management Platform
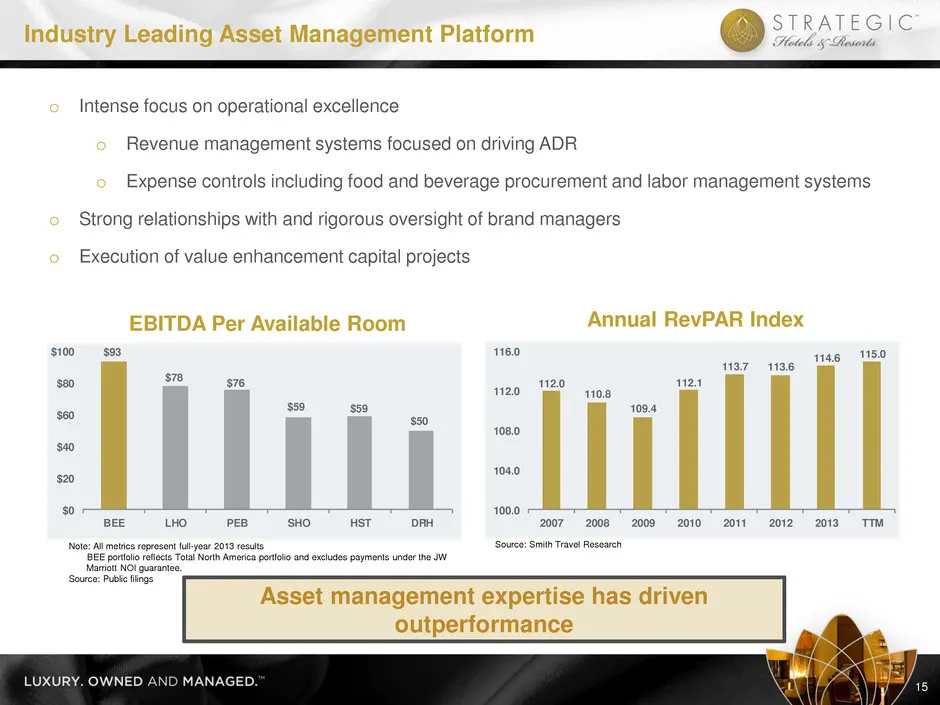
112.0 110.8 109.4 112.1 113.7 113.6 114.6 115.0 100.0 104.0 108.0 112.0 116.0 2007 2008 2009 2010 2011 2012 2013 TTM $93 $78 $76 $5 $59 $50 $0 $20 $40 $60 $80 $100 BEE LHO PEB SHO HST DRH o Intense focus on operational excellence o Revenue management systems focused on driving ADR o Expense controls
Slide 17: BEE's Operating Metrics Lead the Sector
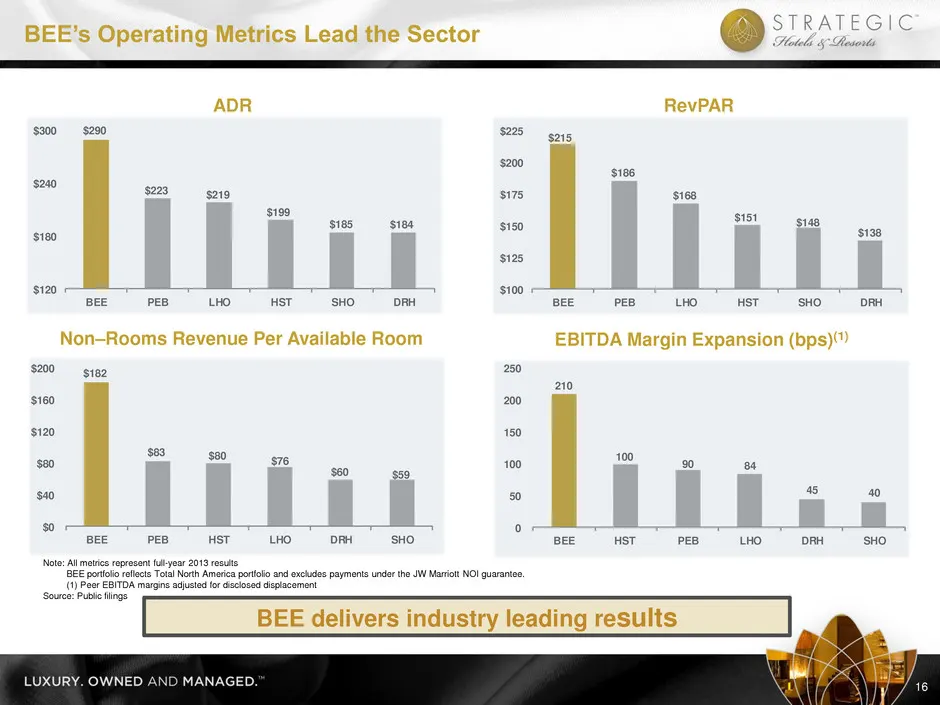
210 100 90 84 45 40 0 50 100 150 200 250 BEE HST PEB LHO DRH SHO $290 $223 $219 $199 $185 $184 $120 $180 $240 $300 BEE PEB LHO HST SHO DRH $182 $83 $80 $76 $60 $59 $0 $40 $80 $120 $160 $200 BEE PEB HST LHO DRH SHO $215 $186 $168 $151 $148 $138 $100 $125 $150 $175 $200 $225 BEE PEB LHO HST SHO DRH AD
Slide 18: Significant Outperformance Throughout the Recovery
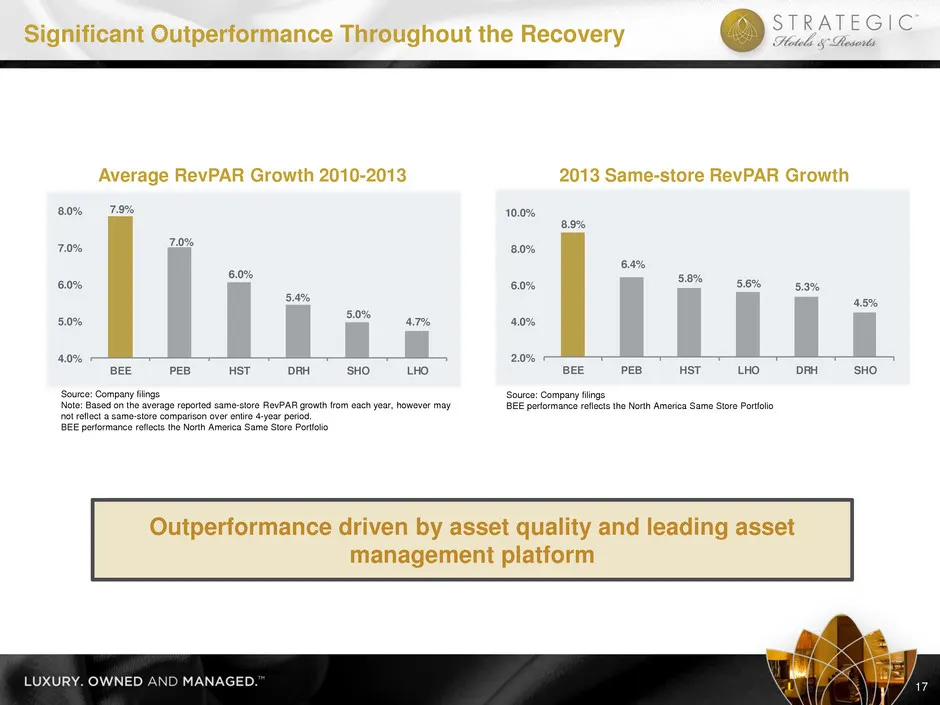
8.9% 6.4% 5.8% 5.6% 5.3% 4.5% 2.0% 4.0% 6.0% 8.0% 10.0% BEE PEB HST LHO DRH SHO 7.9% 7.0% 6.0% 5.4% 5.0% 4.7% 4.0% 5.0% 6.0% 7.0% 8.0% BEE PEB HST DRH SHO LHO 17 Significant Outperformance Throughout the Recovery Source: Company filings Note: Based on the average reported same-store RevPAR growth fr
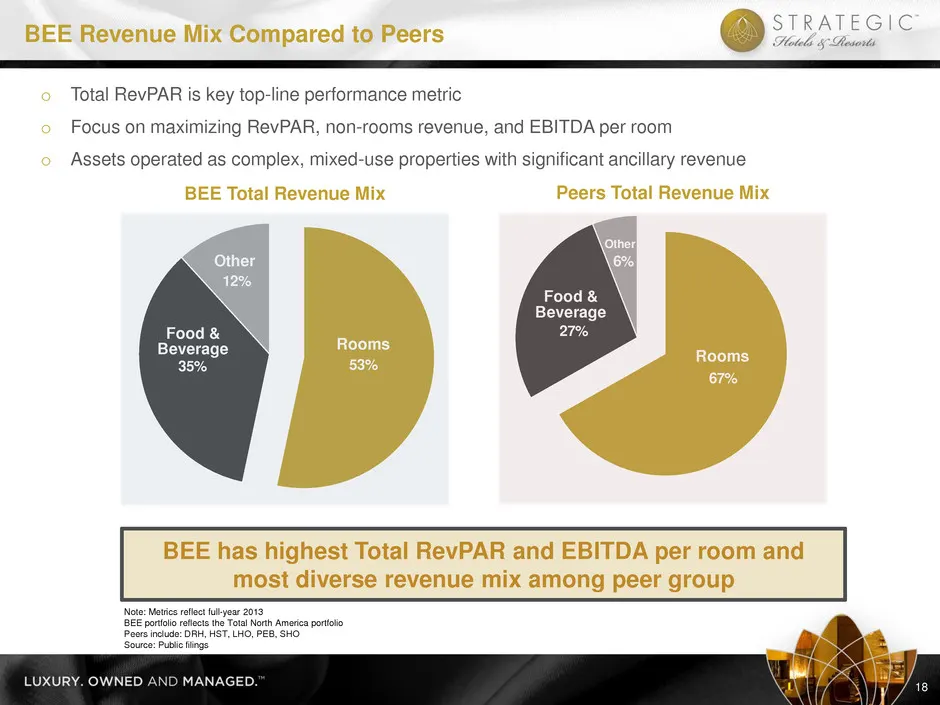
Slide 19: BEE Revenue Mix Compared to Peers
67% 27% 6% Food & Beverage Other Rooms o Total RevPAR is key top-line performance metric o Focus on maximizing RevPAR, non-rooms revenue, and EBITDA per room o Assets operated as complex, mixed-use properties with significant ancillary revenue BEE Total Revenue Mix Peers Total Revenue Mix Note: Metr
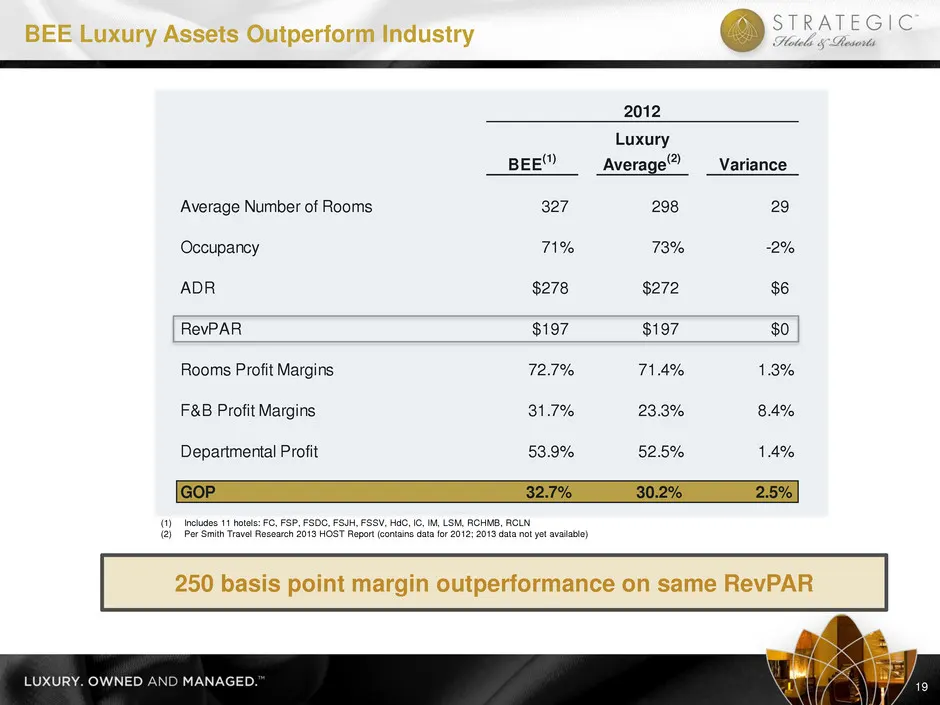
Slide 20: BEE Luxury Assets Outperform Industry
2012 BEE (1) Luxury Average (2) Variance Average Number of Rooms 327 298 29 Occupancy 71% 73% -2% ADR $278 $272 $6 RevPAR $197 $197 $0 Rooms Profit Margins 72.7% 71.4% 1.3% F&B Profit Margins 31.7% 23.3% 8.4% Departmental Profit 53.9% 52.5% 1.4% GOP 32.7% 30.2% 2.5% BEE Luxury Assets Outperform Indu
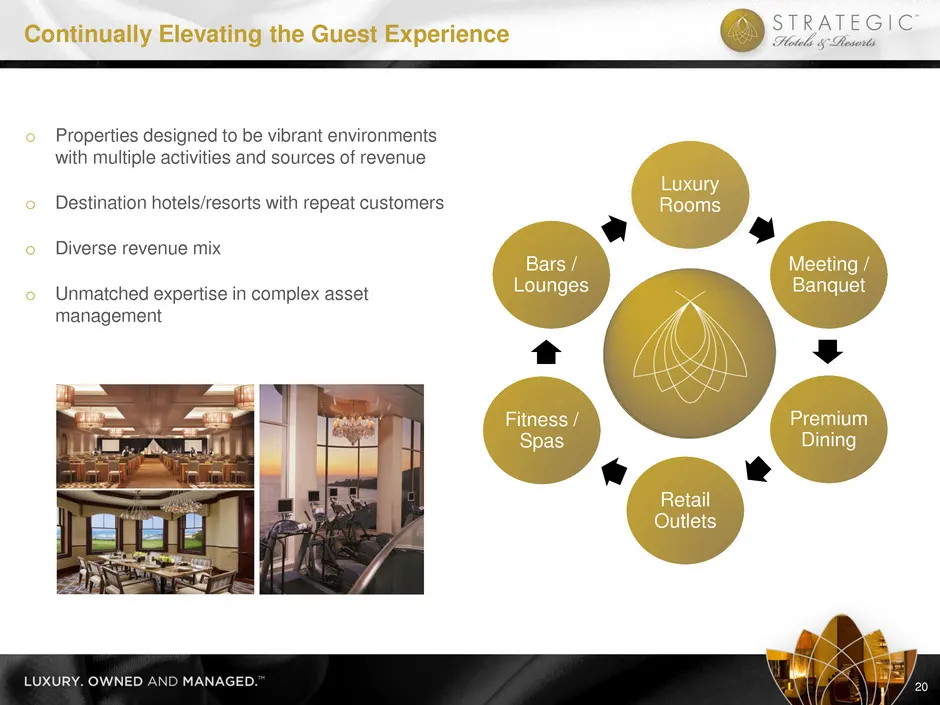
Slide 21: Continually Elevating the Guest Experience
20 Continually Elevating the Guest Experience Luxury Rooms Meeting / Banquet Premium Dining Retail Outlets Fitness / Spas Bars / Lounges o Properties designed to be vibrant environments with multiple activities and sources of revenue o Destination hotels/resorts with repeat customers o Diverse reven
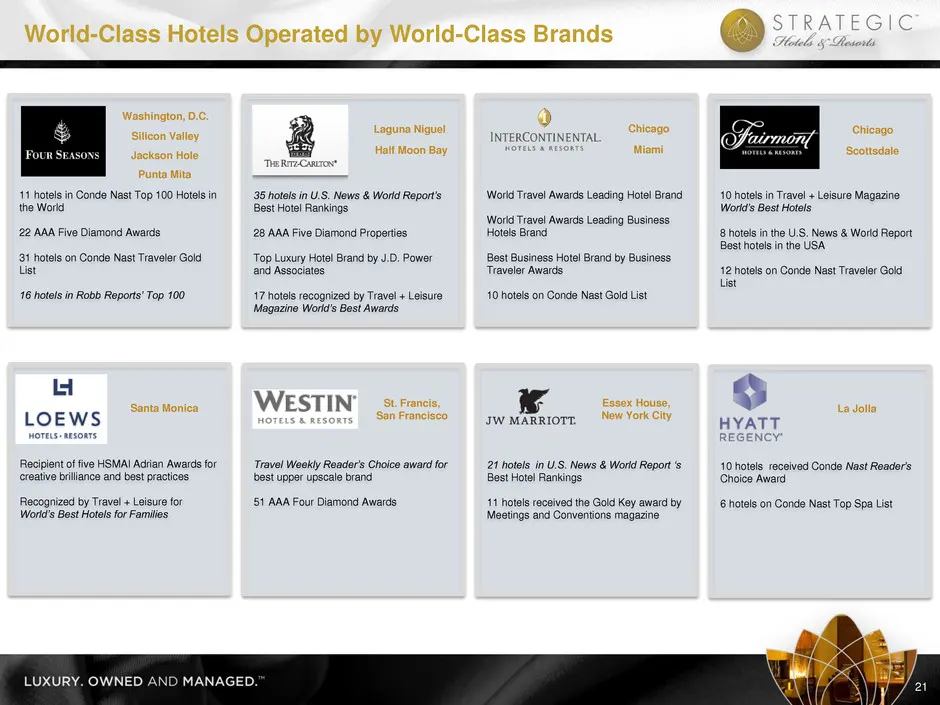
Slide 22: World-Class Hotels Operated by World-Class Brands
World-Class Hotels Operated by World-Class Brands 21 11 hotels in Conde Nast Top 100 Hotels in the World 22 AAA Five Diamond Awards 31 hotels on Conde Nast Traveler Gold List 16 hotels in Robb Reports’ Top 100 35 hotels in U.S. News & World Report’s Best Hotel Rankings 28 AAA Five Diamond Properties
Slide 23: BEE's Strategy to Drive Shareholder Value
22 BEE’s Strategy to Drive Shareholder Value Disciplined capital allocation & external growth strategy Enhance and expand our high-end, unique, and irreplaceable hotel portfolio Proactive and conservative balance sheet management Industry leading asset management platform
Slide 24: Proactive and Conservative Balance Sheet Management
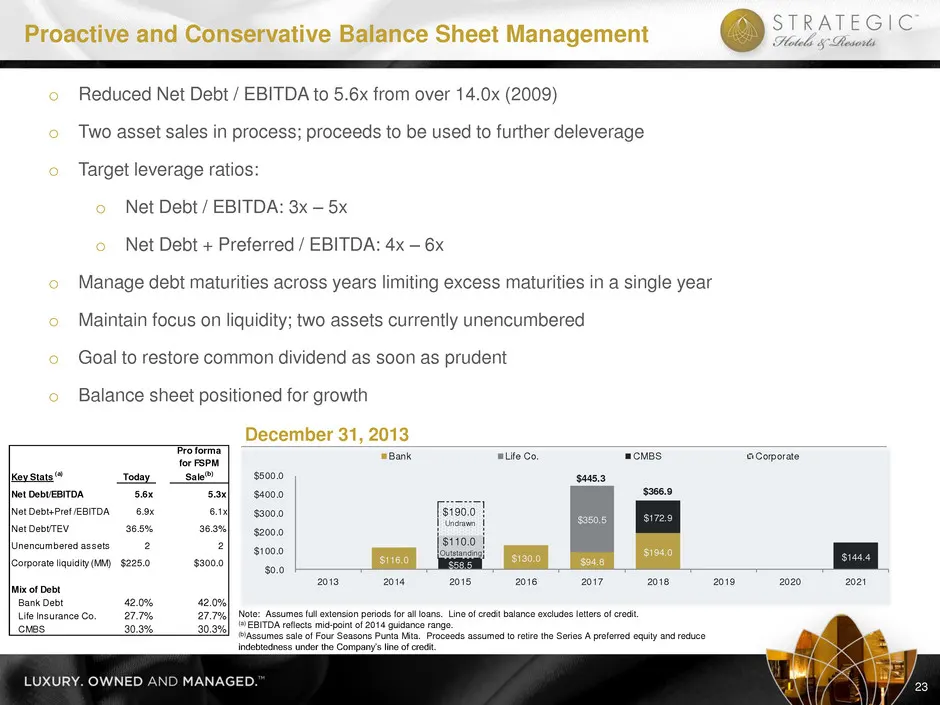
Key Stats (a) Today Pro forma for FSPM Sale (b) Net Debt/EBITDA 5.6x 5.3x Net Debt+Pref /EBITDA 6.9x 6.1x Net Debt/TEV 36.5% 36.3% Unencumbered assets 2 2 Corporate liquidity (MM) $225.0 $300.0 Mix of Debt Bank Debt 42.0% 42.0% Life Insurance Co. 27.7% 27.7% CMBS 30.3% 30.3% $163.0 Undrawn $137.0 Ou
Slide 25: BEE's Strategy to Drive Shareholder Value
24 BEE’s Strategy to Drive Shareholder Value Disciplined capital allocation & external growth strategy Enhance and expand our high-end, unique, and irreplaceable hotel portfolio Proactive and conservative balance sheet management Industry leading asset management platform
Slide 26: Disciplined Capital Allocation
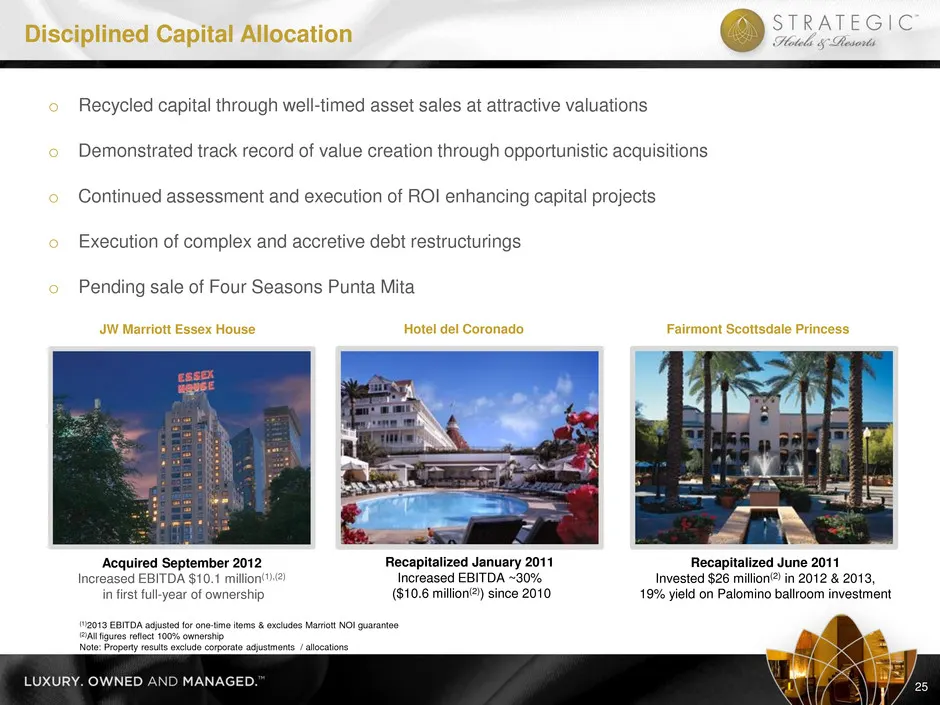
o Recycled capital through well-timed asset sales at attractive valuations o Demonstrated track record of value creation through opportunistic acquisitions o Continued assessment and execution of ROI enhancing capital projects o Execution of complex and accretive debt restructurings o Pending sale o
Slide 27: External Growth Strategy
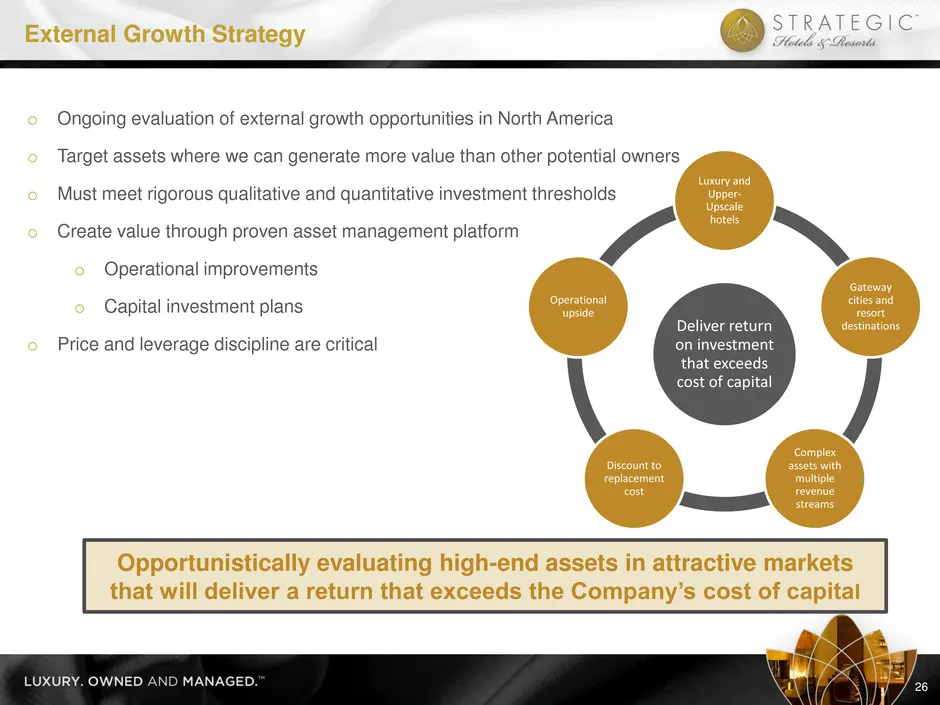
External Growth Strategy 26 Deliver return on investment that exceeds cost of capital Luxury and Upper- Upscale hotels Gateway cities and resort destinations Complex assets with multiple revenue streams Discount to replacement cost Operational upside o Ongoing evaluation of external growth opportuni

Slide 28: Industry Update & Operating Trends
I. Strategic Hotels: An Overview II. Financial Overview III. Strategic Plan IV. Industry Update & Operating Trends V. Appendix I. Case Studies II. Corporate Governance Industry Update & Operating Trends
Slide 29: Favorable Luxury Lodging Supply & Demand Dynamics
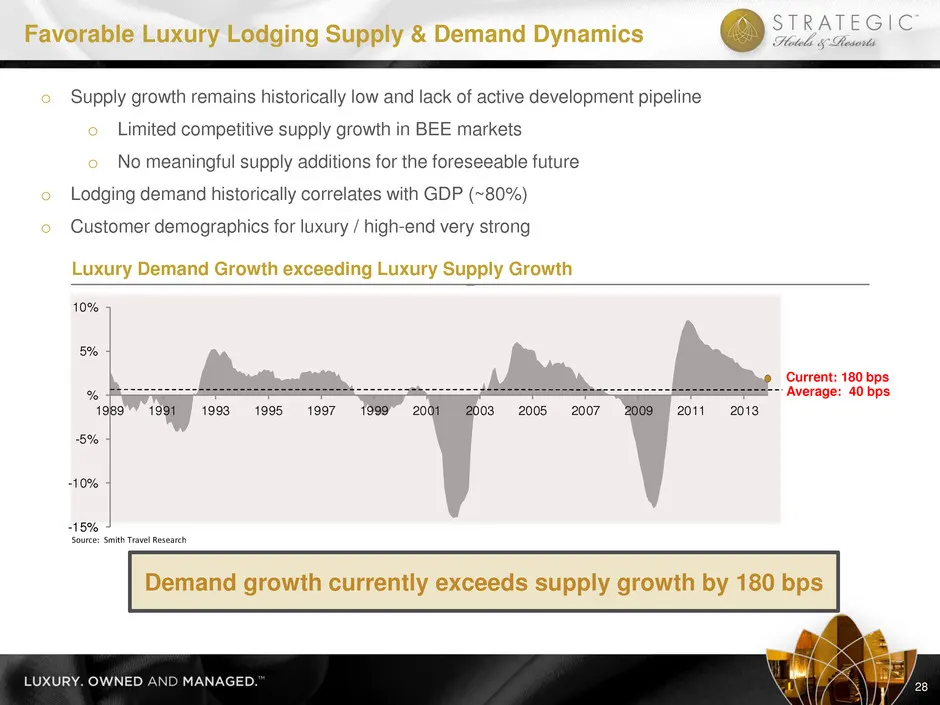
-15% -10% -5% % 5% 10% 1989 1991 1993 1995 1997 1999 2001 2003 2005 2007 2009 2011 2013 o Supply growth remains historically low and lack of active development pipeline o Limited competitive supply growth in BEE markets o No meaningful supply additions for the foreseeable future o Lodging demand his
Slide 30: Luxury Hotels Outperform in a Recovery
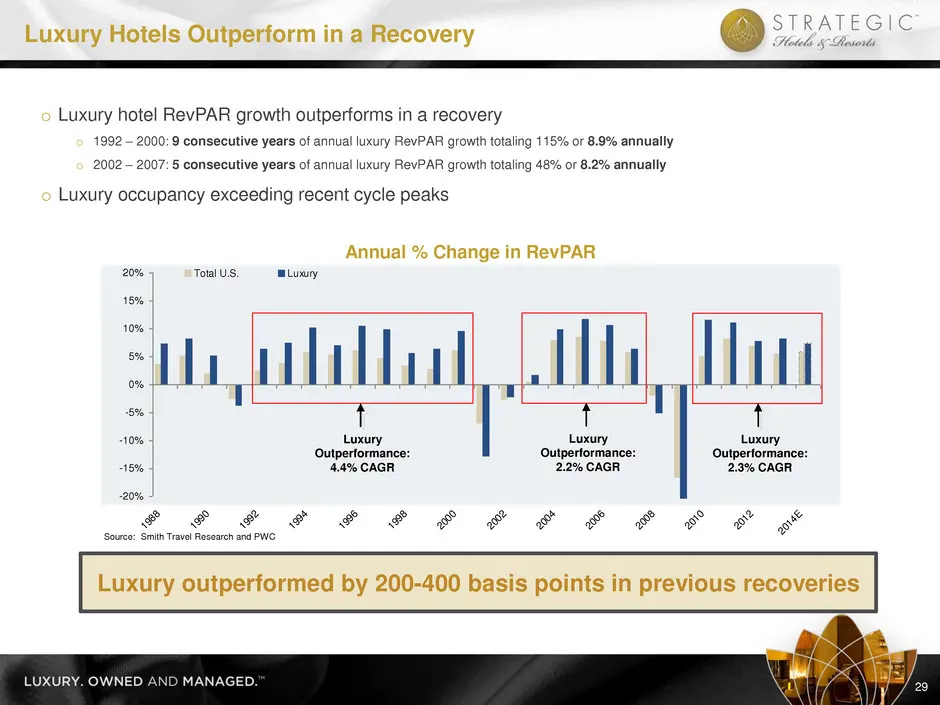
-20% -15% -10% -5% 0% 5% 10% 15% 20% 198 8 199 0 199 2 199 4 199 6 199 8 200 0 200 2 200 4 200 6 200 8 201 0 201 2 201 4E Total U.S. Luxury Source: Smith Travel Research and PWC Annual % Change in RevPAR o Luxury hotel RevPAR growth outperforms in a recovery o 1992 – 2000: 9 consecutive years of ann
Slide 31: 2014 Group Booking Outlook
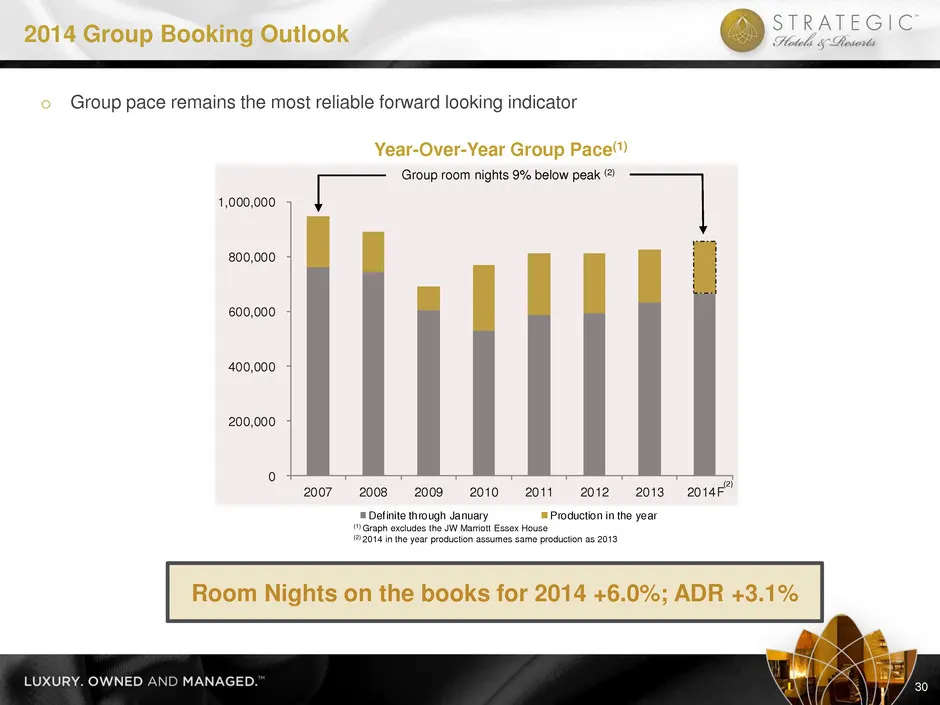
0 200,000 400,000 600,000 800,000 1,000,000 2007 2008 2009 2010 2011 2012 2013 2014F Definite through January Production in the year o Group pace remains the most reliable forward looking indicator Year-Over-Year Group Pace(1) Group room nights 9% below peak (2) (1) Graph excludes the JW Marriott Es
Slide 32: BEE's Strategy to Drive Shareholder Value
31 BEE’s Strategy to Drive Shareholder Value Disciplined capital allocation & external growth strategy Enhance and expand our high-end, unique, and irreplaceable hotel portfolio Proactive and conservative balance sheet management Industry leading asset management platform BEE’s strategy has delivere
Slide 33: Case Studies
I. Strategic Hotels: An Overview II. Financial Overview III. Strategic Plan IV. Industry Update & Operating Trends V. Appendix I. Case Studies II. Corporate Governance Case Studies
Slide 34: JW Marriott New York Essex House – Case Study
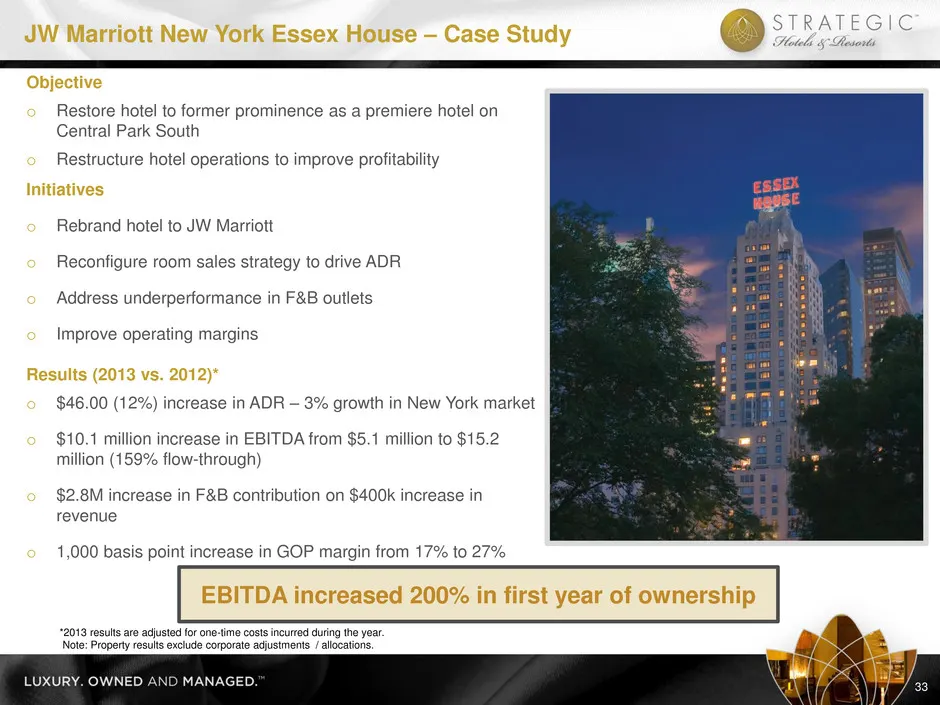
JW Marriott New York Essex House – Case Study Objective o Restore hotel to former prominence as a premiere hotel on Central Park South o Restructure hotel operations to improve profitability Initiatives o Rebrand hotel to JW Marriott o Reconfigure room sales strategy to drive ADR o Address underperf
Slide 35: Four Seasons Jackson Hole & Silicon Valley – Case Study
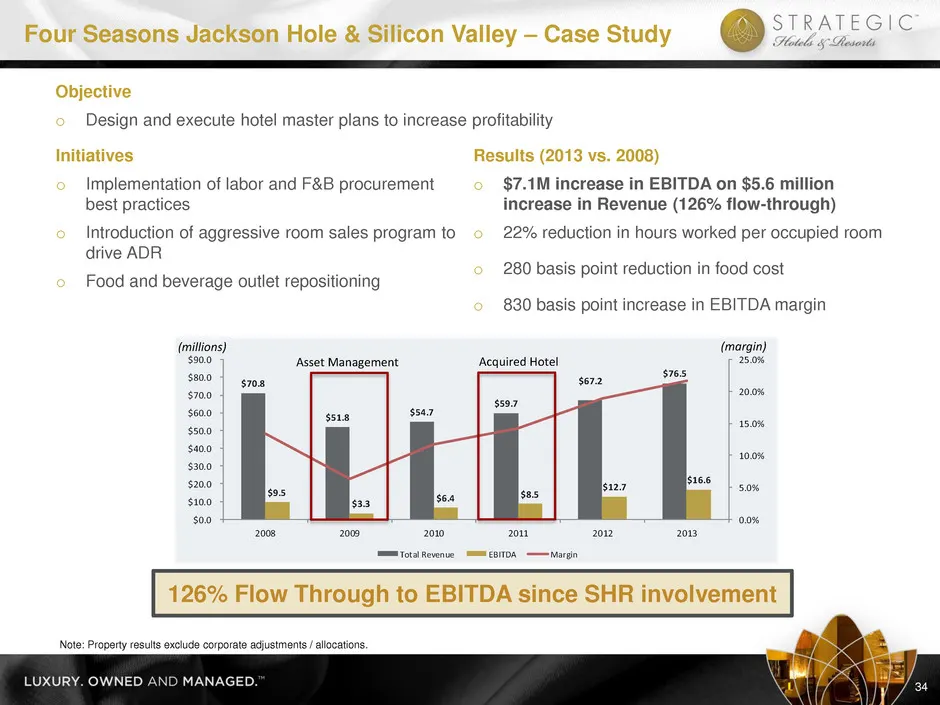
$70.8 $51.8 $54.7 $59.7 $67.2 $76.5 $9.5 $3.3 $6.4 $8.5 $12.7 $16.6 0.0% 5.0% 10.0% 15.0% 20.0% 25.0% $0.0 $10.0 $20.0 $30.0 $40.0 $50.0 $60.0 $70.0 $80.0 $90.0 2008 2009 2010 2011 2012 2013 Total Revenue EBITDA Margin Four Seasons Jackson Hole & Silicon Valley – Case Study Initiatives o Implementat
Slide 36: Fairmont Scottsdale Princess – Case Study
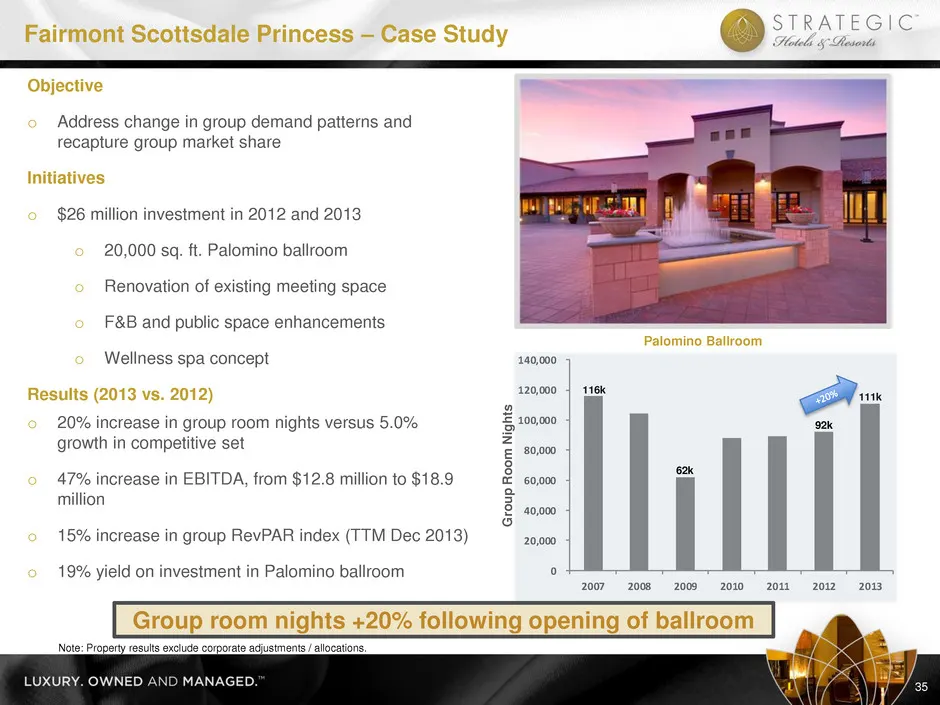
0 20,000 40,000 60,000 80,000 100,000 120,000 140,000 2007 2008 2009 2010 2011 2012 2013 Gr ou p R oo m Ni gh tsFairmont Scottsdale Princess – Case Study 35 Objective o Address change in group demand patterns and recapture group market share Initiatives o $26 million investment in 2012 and 2013 o 20
Slide 37: InterContinental Miami – Case Study
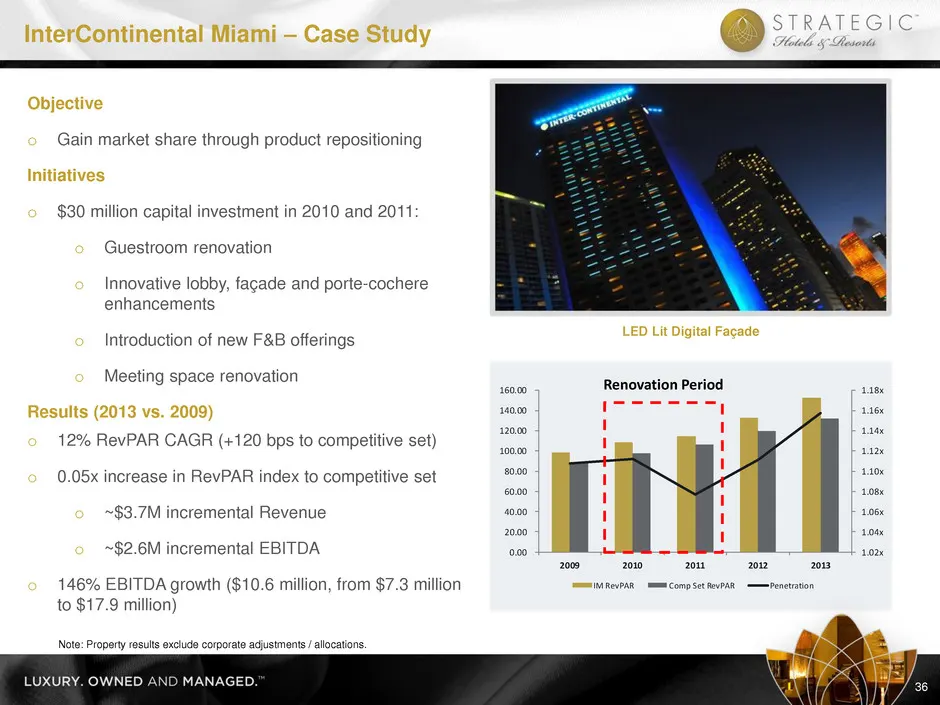
1.02x 1.04x 1.06x 1.08x 1.10x 1.12x 1.14x 1.16x 1.18x 0.00 20.00 40.00 60.00 80.00 100.00 120.00 140.00 160.00 2009 2010 2011 2012 2013 IM RevPAR Comp Set RevPAR Penetration InterContinental Miami – Case Study 36 Objective o Gain market share through product repositioning Initiatives o $30 million c
Slide 38: Four Seasons Washington, D.C. – Case Study
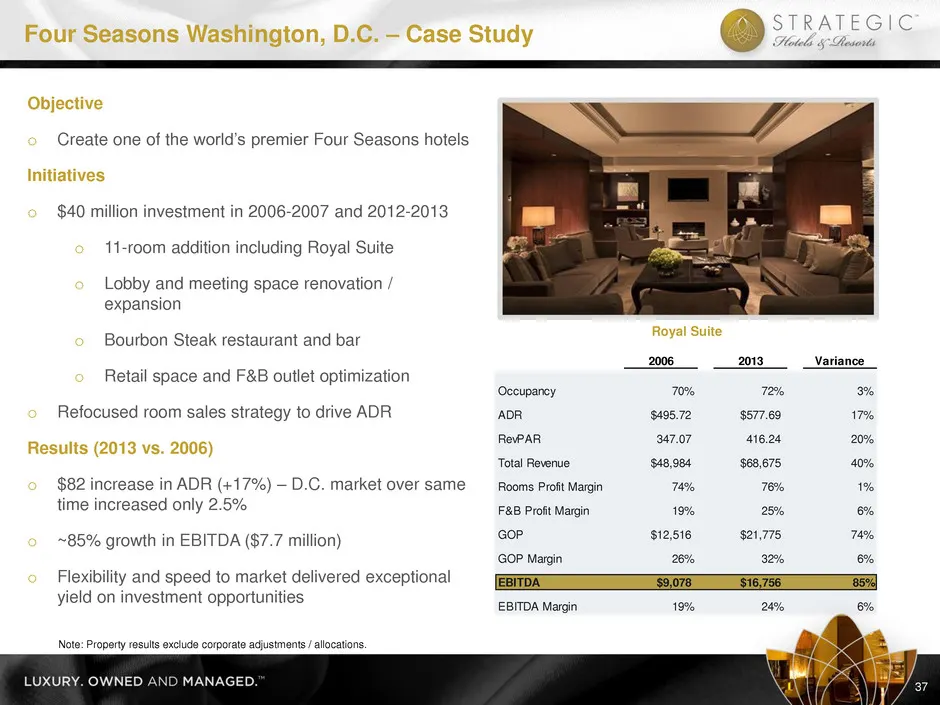
2006 2013 Variance Occupancy 70% 72% 3% ADR $495.72 $577.69 17% RevPAR 347.07 416.24 20% Total Revenue $48,984 $68,675 40% Rooms Profit Margin 74% 76% 1% F&B Profit Margin 19% 25% 6% GOP $12,516 $21,775 74% GOP Margin 26% 32% 6% EBITDA $9,078 $16,756 85% EBITDA Margin 19% 24% 6% Four Seasons Washing
Slide 39: Corporate Governance
I. Strategic Hotels: An Overview II. Financial Overview III. Strategic Plan IV. Industry Update & Operating Trends V. Appendix I. Case Studies II. Corporate Governance Corporate Governance
Slide 40: Corporate Governance Initiatives
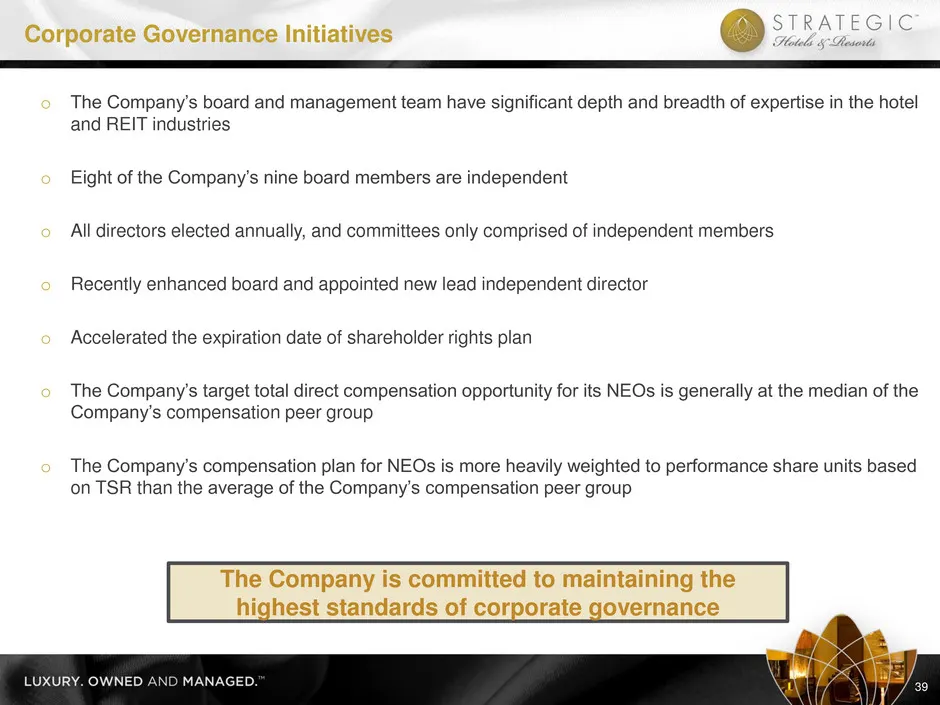
o The Company’s board and management team have significant depth and breadth of expertise in the hotel and REIT industries o Eight of the Company’s nine board members are independent o All directors elected annually, and committees only comprised of independent members o Recently enhanced board and
Slide 41: BEE's Strong Leadership Team
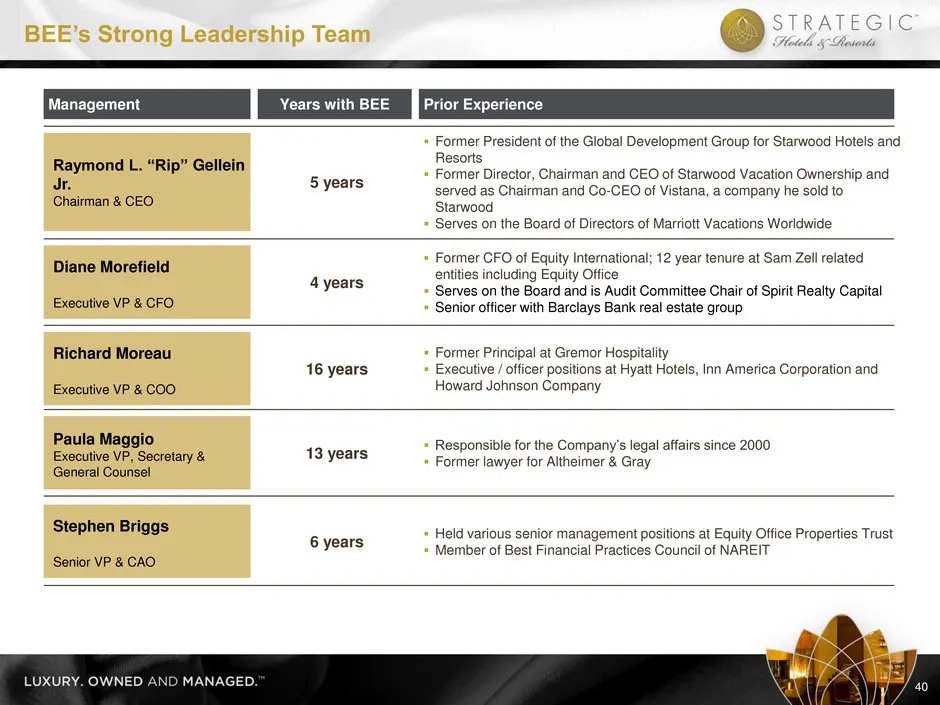
40 BEE’s Strong Leadership Team Prior Experience Management Years with BEE Former President of the Global Development Group for Starwood Hotels and Resorts Former Director, Chairman and CEO of Starwood Vacation Ownership and served as Chairman and Co-CEO of Vistana, a company he sold to Starwood
Slide 42: BEE's Highly Qualified & Independent Board of Directors
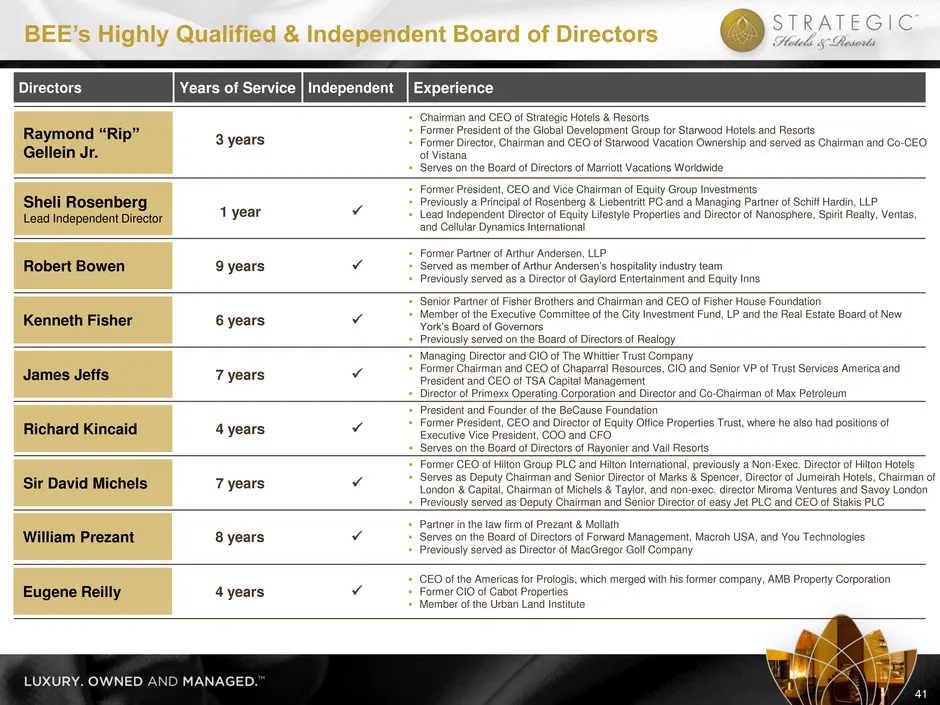
41 BEE’s Highly Qualified & Independent Board of Directors Experience Chairman and CEO of Strategic Hotels & Resorts Former President of the Global Development Group for Starwood Hotels and Resorts Former Director, Chairman and CEO of Starwood Vacation Ownership and served as Chairman and Co-C
Slide 43: Except for historical information, the matters discussed in this presentation are forward-looking statements subject
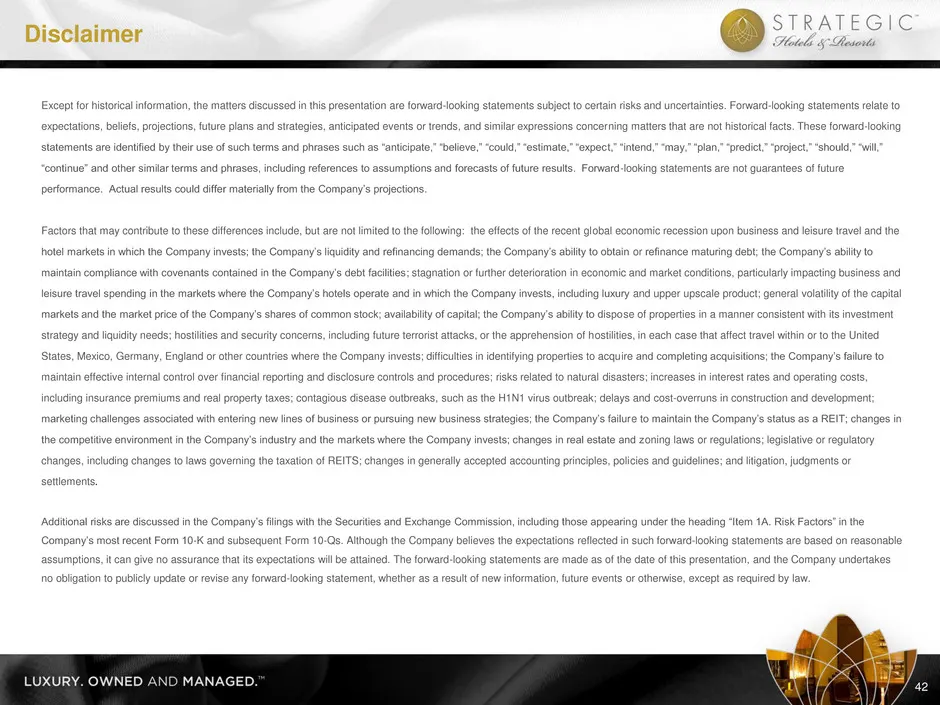
Except for historical information, the matters discussed in this presentation are forward-looking statements subject to certain risks and uncertainties. Forward-looking statements relate to expectations, beliefs, projections, future plans and strategies, anticipated events or trends, and similar exp
Slide 44: Non-GAAP to GAAP Reconciliations
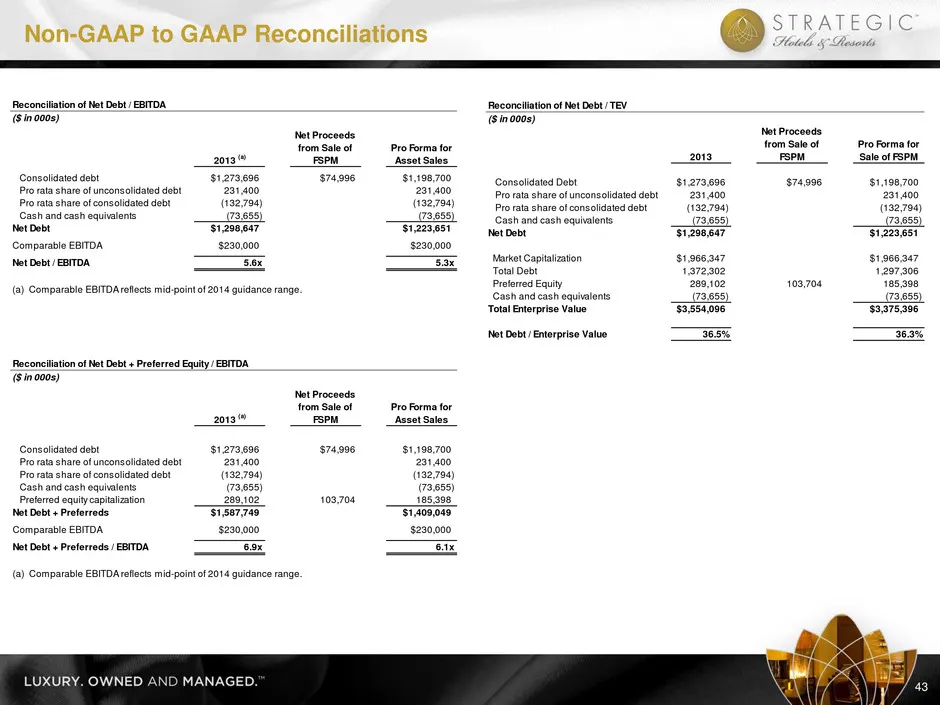
Non-GAAP to GAAP Reconciliations 43 Reconciliation of Net Debt / EBITDA ($ in 000s) 2013 (a) Net Proceeds from Sale of FSPM Pro Forma for Asset Sales Consolidated debt $1,273,696 $74,996 $1,198,700 Pro rata share of unconsolidated debt 231,400 231,400 Pro rata share of consolidated debt (132,794) (1
Slide 45: Non-GAAP to GAAP Reconciliations
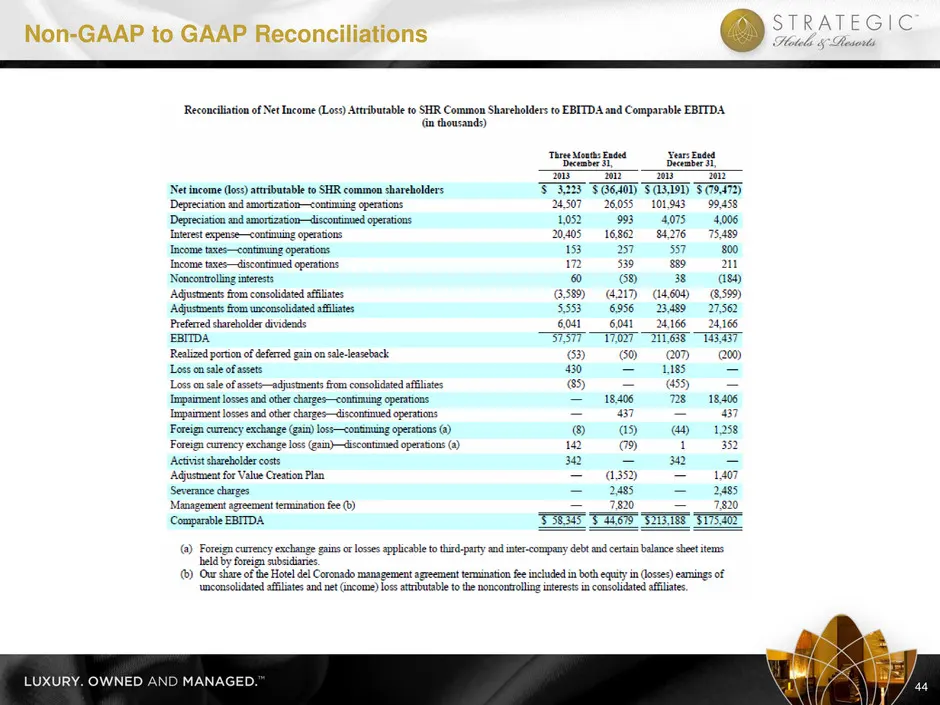
Non-GAAP to GAAP Reconciliations 44
Slide 46: Non-GAAP to GAAP Reconciliations
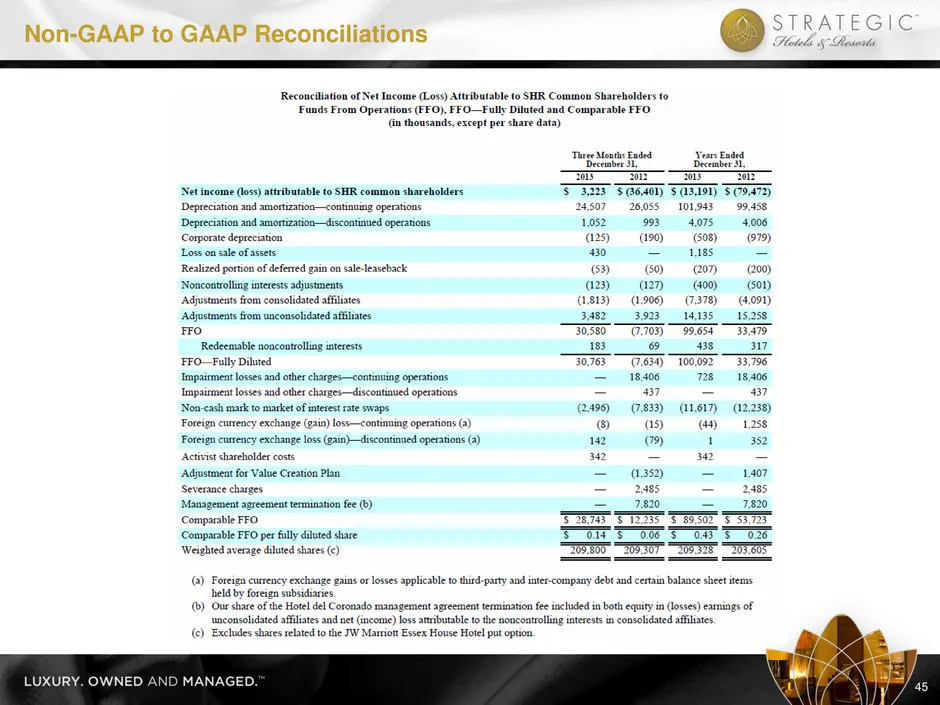
Non-GAAP to GAAP Reconciliations 45
Slide 47: Non-GAAP to GAAP Reconciliations
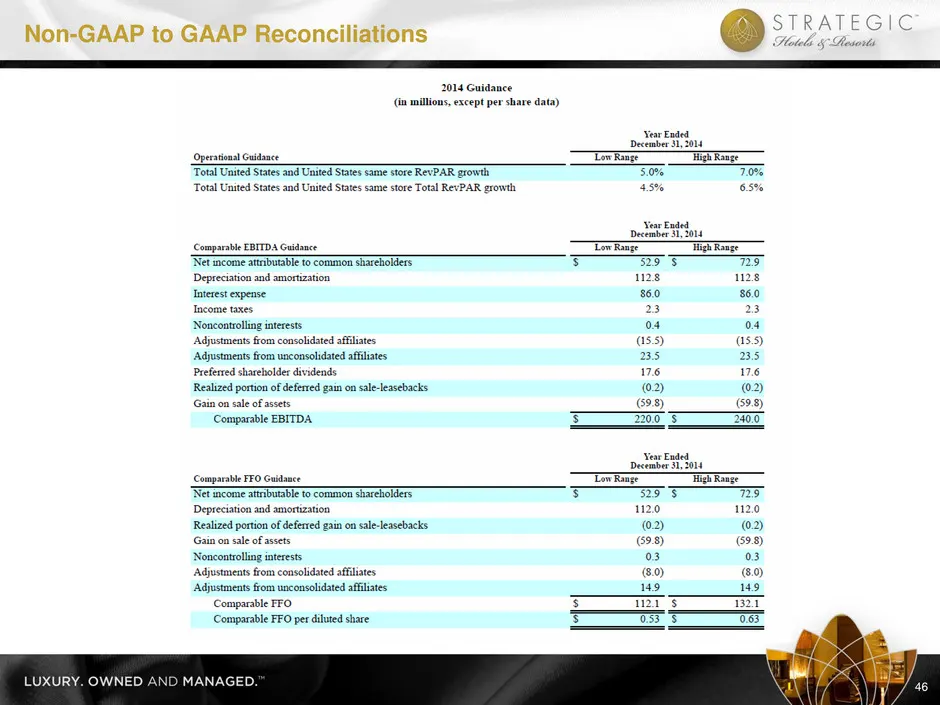
Non-GAAP to GAAP Reconciliations 46

Slide 48: Non-GAAP to GAAP Reconciliations
Non-GAAP to GAAP Reconciliations 47 Update when Guidance ranges available
Source: SEC EDGAR · 8-K filed Feb 26, 2014
More decks from Strategic Hotels and Resorts Inc
 Investor Presentation (June 2015)43 slides · Jun 1, 2015
 Investor Presentation (February 2015)43 slides · Feb 24, 2015
 Investor Presentation (January 2015)44 slides · Jan 26, 2015
 Investor Presentation (November 2014)50 slides · Nov 5, 2014
 Investor Presentation (October 2014)50 slides · Oct 3, 2014
 Investor Day (September 2014)67 slides · Sep 22, 2014