Western Asset Mortgage Capital
Western Asset Mortgage Capital — Q1 2013 Earnings Presentation
14 slides from Western Asset Mortgage Capital's earnings presentation, May 17, 2013
Slide 1: First Quarter 2013 Investor Presentation
First Quarter 2013 Investor Presentation May 15, 2013
Slide 2: Safe Harbor Statement
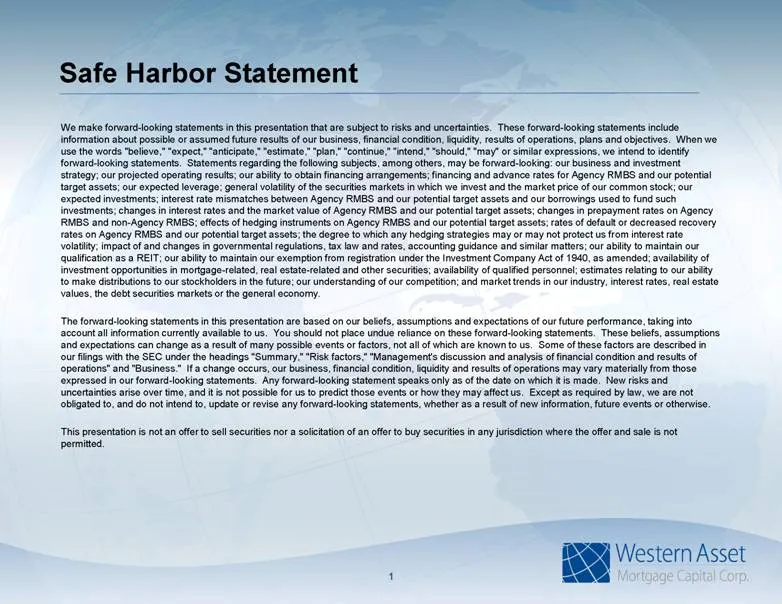
Safe Harbor Statement We make forward-looking statements in this presentation that are subject to risks and uncertainties. These forward-looking statements include information about possible or assumed future results of our business, financial condition, liquidity, results of operations, plans and o
Slide 3: Key Highlights
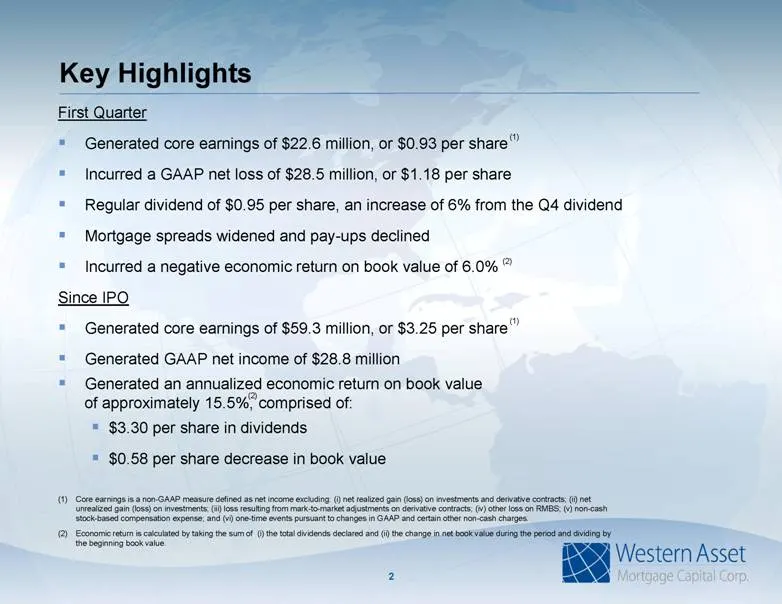
Key Highlights First Quarter Generated core earnings of $22.6 million, or $0.93 per share Incurred a GAAP net loss of $28.5 million, or $1.18 per share Regular dividend of $0.95 per share, an increase of 6% from the Q4 dividend Mortgage spreads widened and pay-ups declined Incurred a negative econom
Slide 4: First Quarter Financial Results
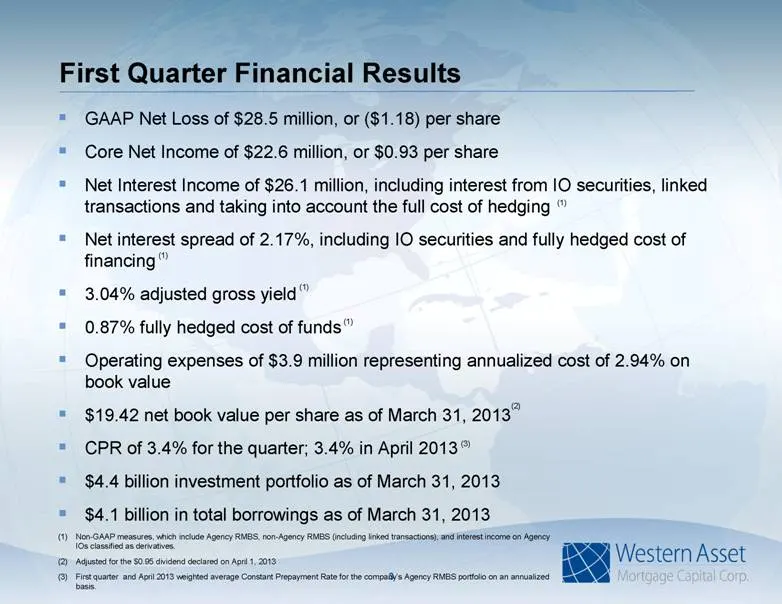
First Quarter Financial Results GAAP Net Loss of $28.5 million, or ($1.18) per share Core Net Income of $22.6 million, or $0.93 per share Net Interest Income of $26.1 million, including interest from IO securities, linked transactions and taking into account the full cost of hedging Net interest spr
Slide 5: Q1 2013: Difficult Quarter for Mortgage Assets
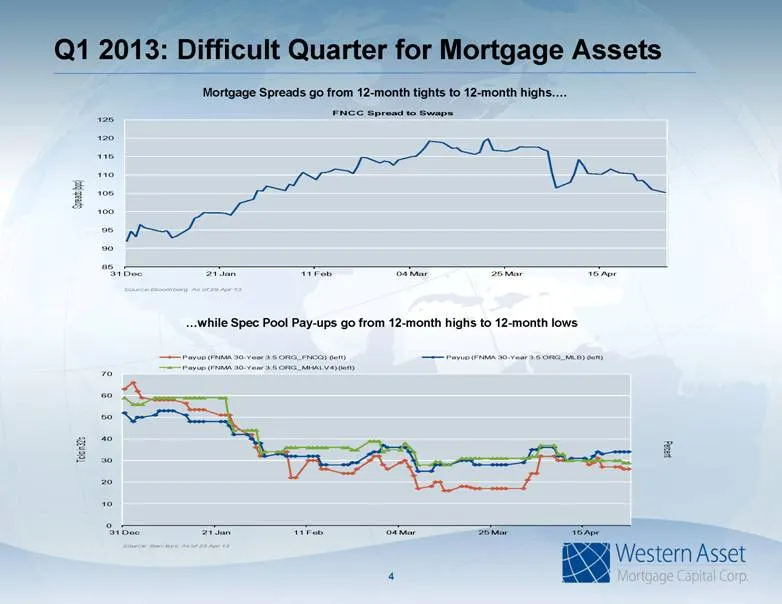
Q1 2013: Difficult Quarter for Mortgage Assets 4 Mortgage Spreads go from 12-month tights to 12-month highs. while Spec Pool Pay-ups go from 12-month highs to 12-month lows 85 90 95 100 105 110 115 120 125 31 Dec 21 Jan 11 Feb 04 Mar 25 Mar 15 Apr FNCC Spread to Swaps Source:Bloomberg. As of 29 Apr
Slide 6: Market Update
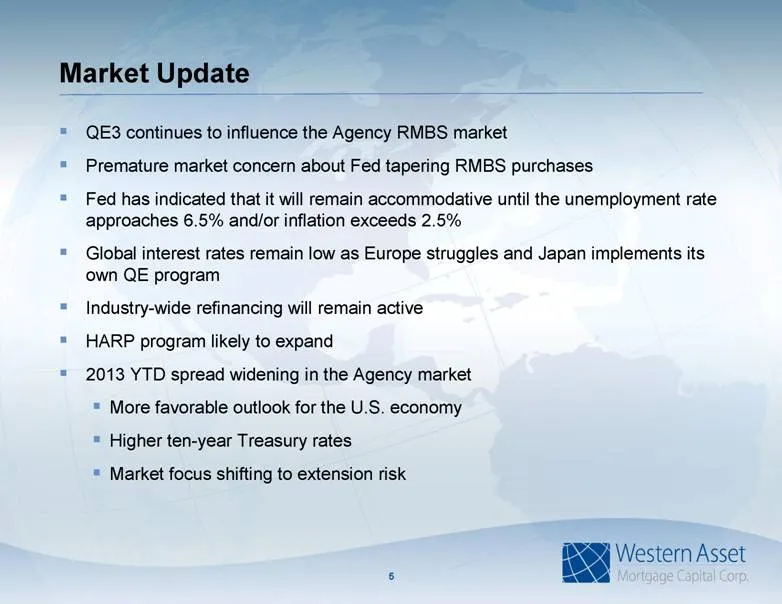
Market Update QE3 continues to influence the Agency RMBS market Premature market concern about Fed tapering RMBS purchases Fed has indicated that it will remain accommodative until the unemployment rate approaches 6.5% and/or inflation exceeds 2.5% Global interest rates remain low as Europe struggle
Slide 7: Portfolio Composition as of March 31, 2013
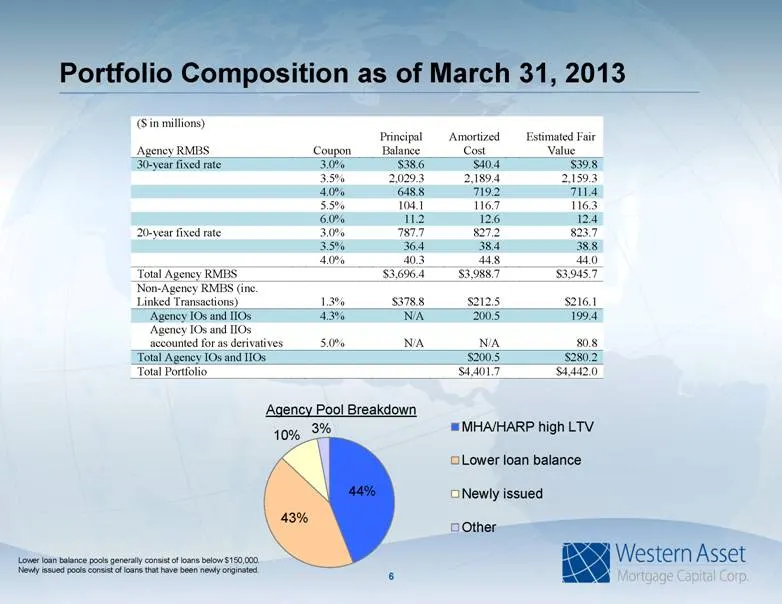
6 Portfolio Composition as of March 31, 2013 Lower loan balance pools generally consist of loans below $150,000. Newly issued pools consist of loans that have been newly originated. ($ in millions) Agency RMBS Coupon Principal Balance Amortized Cost Estimated Fa ir Value 30 - year fixed rate 3.0% $
Slide 8: Key Portfolio Metrics as of March 31, 2013
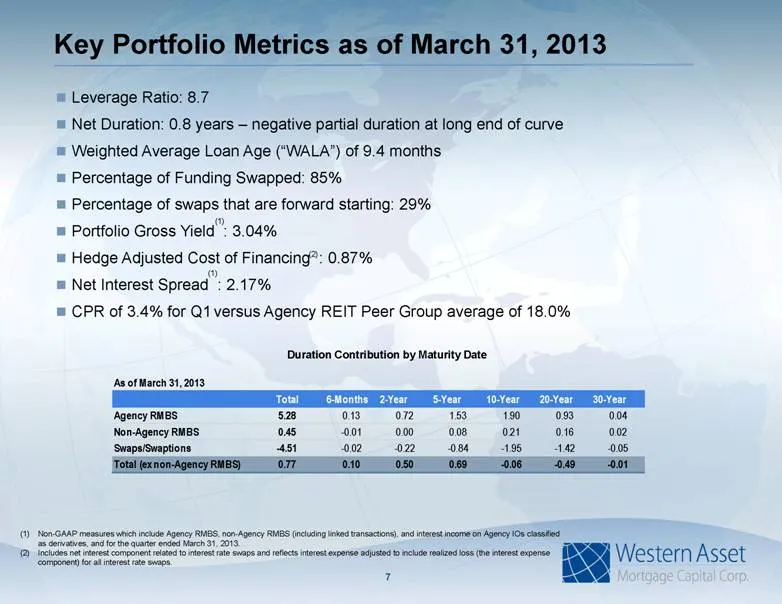
Non-GAAP measures which include Agency RMBS, non-Agency RMBS (including linked transactions), and interest income on Agency IOs classified as derivatives, and for the quarter ended March 31, 2013. Includes net interest component related to interest rate swaps and reflects interest expense adjusted t
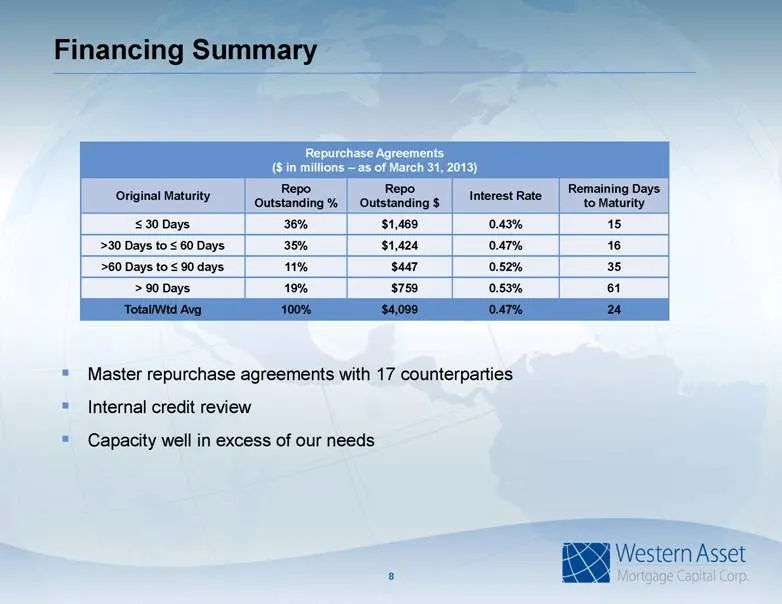
Slide 9: Financing Summary
Financing Summary Repurchase Agreements ($ in millions – as of March 31, 2013) Original Maturity Repo Outstanding % Repo Outstanding $ Interest Rate Remaining Days to Maturity < 30 Days 36% $1,469 0.43% 15 >30 Days to < 60 Days 35% $1,424 0.47% 16 >60 Days to < 90 days 11% $447 0.52% 35 > 90 Days 19
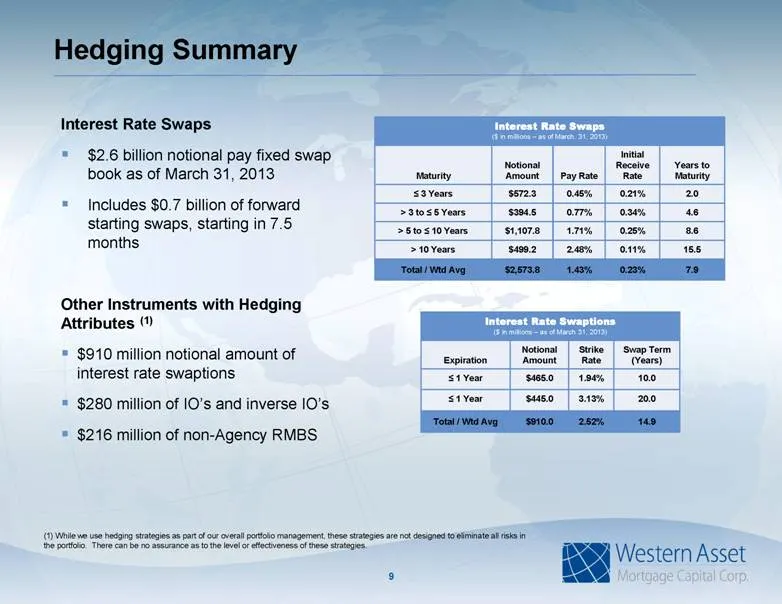
Slide 10: Hedging Summary
Hedging Summary Interest Rate Swaps ($ in millions – as of March. 31, 2013) Maturity Notional Amount Pay Rate Initial Receive Rate Years to Maturity < 3 Years $572.3 0.45% 0.21% 2.0 > 3 to < 5 Years $394.5 0.77% 0.34% 4.6 > 5 to < 10 Years $1,107.8 1.71% 0.25% 8.6 > 10 Years $499.2 2.48% 0.11% 15.5
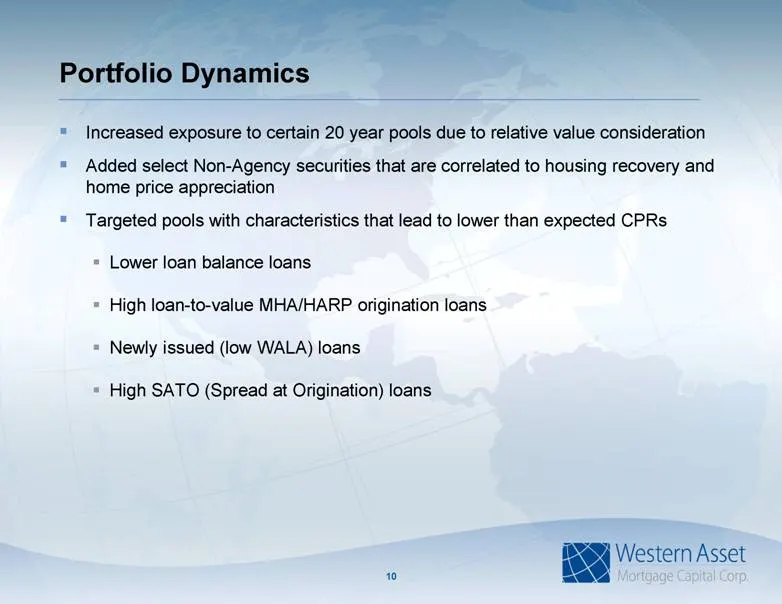
Slide 11: Portfolio Dynamics
Portfolio Dynamics Increased exposure to certain 20 year pools due to relative value consideration Added select Non-Agency securities that are correlated to housing recovery and home price appreciation Targeted pools with characteristics that lead to lower than expected CPRs Lower loan balance loans
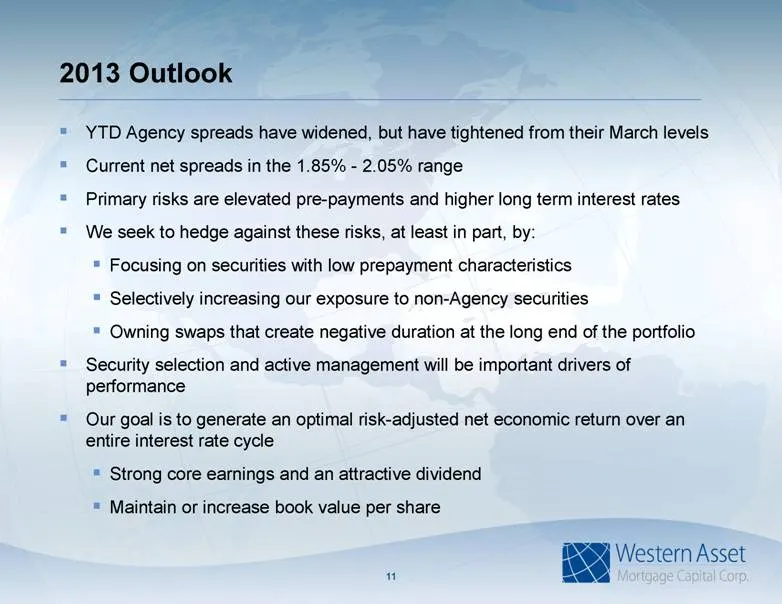
Slide 12: 2013 Outlook
2013 Outlook YTD Agency spreads have widened, but have tightened from their March levels Current net spreads in the 1.85% - 2.05% range Primary risks are elevated pre-payments and higher long term interest rates We seek to hedge against these risks, at least in part, by: Focusing on securities with
Slide 13: Investment Highlights
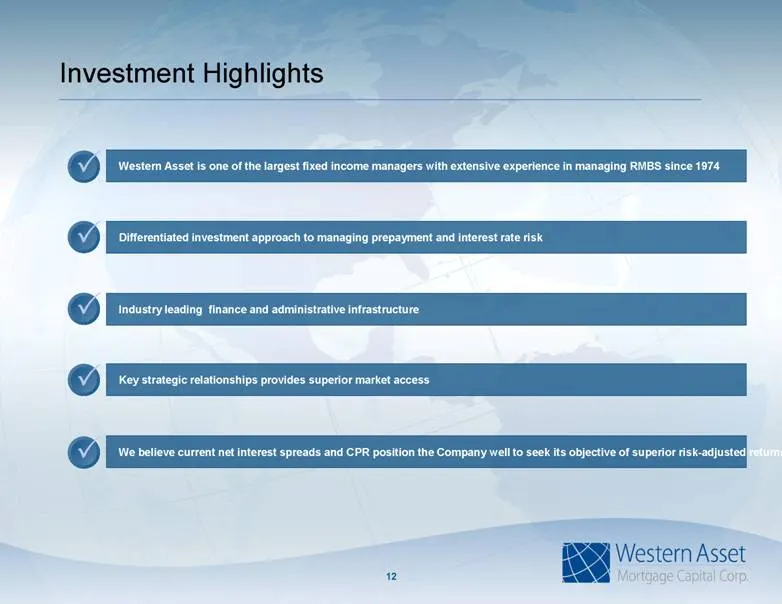
Investment Highlights Western Asset is one of the largest fixed income managers with extensive experience in managing RMBS since 1974 Differentiated investment approach to managing prepayment and interest rate risk We believe current net interest spreads and CPR position the Company well to seek its
Slide 14: Contact Information
Contact Information 13 Western Asset Mortgage Capital Corporation c/o Financial Profiles, Inc. 11601 Wilshire Blvd., Suite 1920 Los Angeles, CA 90025 www.westernassetmcc.com Investor Relations Contact: Larry Clark Tel: (310) 478-2700 x29 [email protected]
Source: SEC EDGAR · 8-K filed May 17, 2013
More decks from Western Asset Mortgage Capital
 Merger or Acquisition (August 2023)9 slides · Aug 9, 2023
 Q2 2023 Earnings Presentation32 slides · Aug 8, 2023
 Merger or Acquisition (July 2023)9 slides · Jul 13, 2023
 Merger or Acquisition (June 2023)16 slides · Jun 28, 2023
 Q1 2023 Earnings Presentation33 slides · May 4, 2023
 Q4 2022 Earnings Presentation34 slides · Mar 2, 2023