Western Asset Mortgage Capital
Western Asset Mortgage Capital — Q1 2023 Earnings Presentation
33 slides from Western Asset Mortgage Capital's earnings presentation, May 4, 2023
Slide 1: First Quarter 2023 Investor Presentation
First Quarter 2023 Investor Presentation May 4, 2023
Slide 2: Forward-looking statements
We make forward-looking statements in this presentation that are subject to risks and uncertainties, many of which are difficult to predict and are generally beyond the Company's control. These forward-looking statements include information about possible or assumed future results of our business, f
Slide 3: Earnings Call Presenters
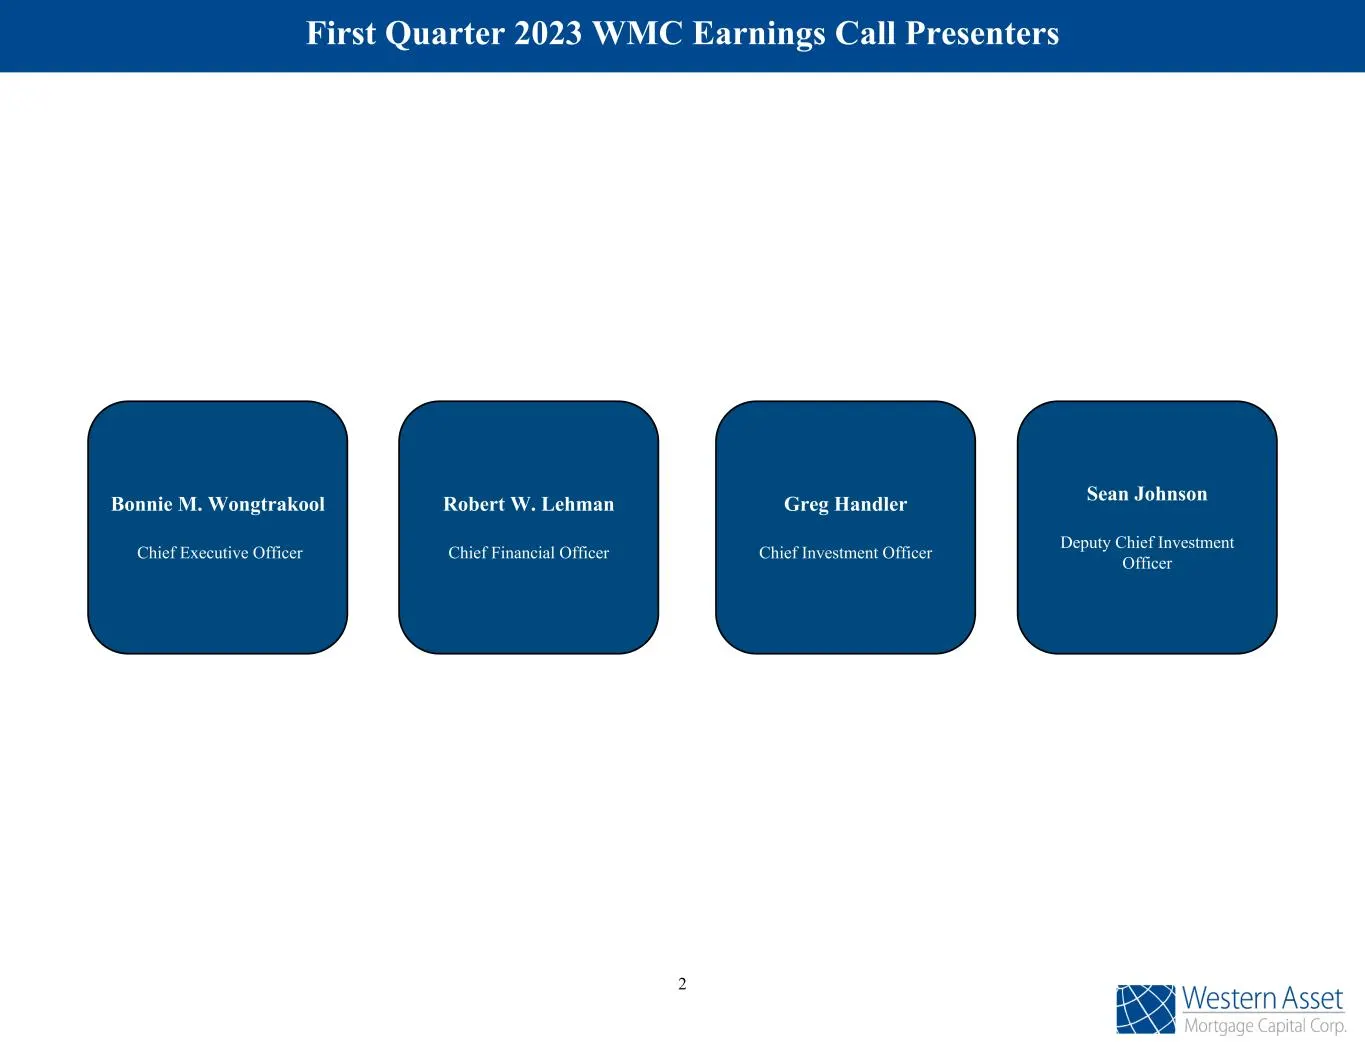
Robert W. Lehman Chief Financial Officer Bonnie M. Wongtrakool Chief Executive Officer Sean Johnson Deputy Chief Investment Officer First Quarter 2023 WMC Earnings Call Presenters Greg Handler Chief Investment Officer 2
Slide 4: Overview of Western Asset Mortgage Capital Corporation
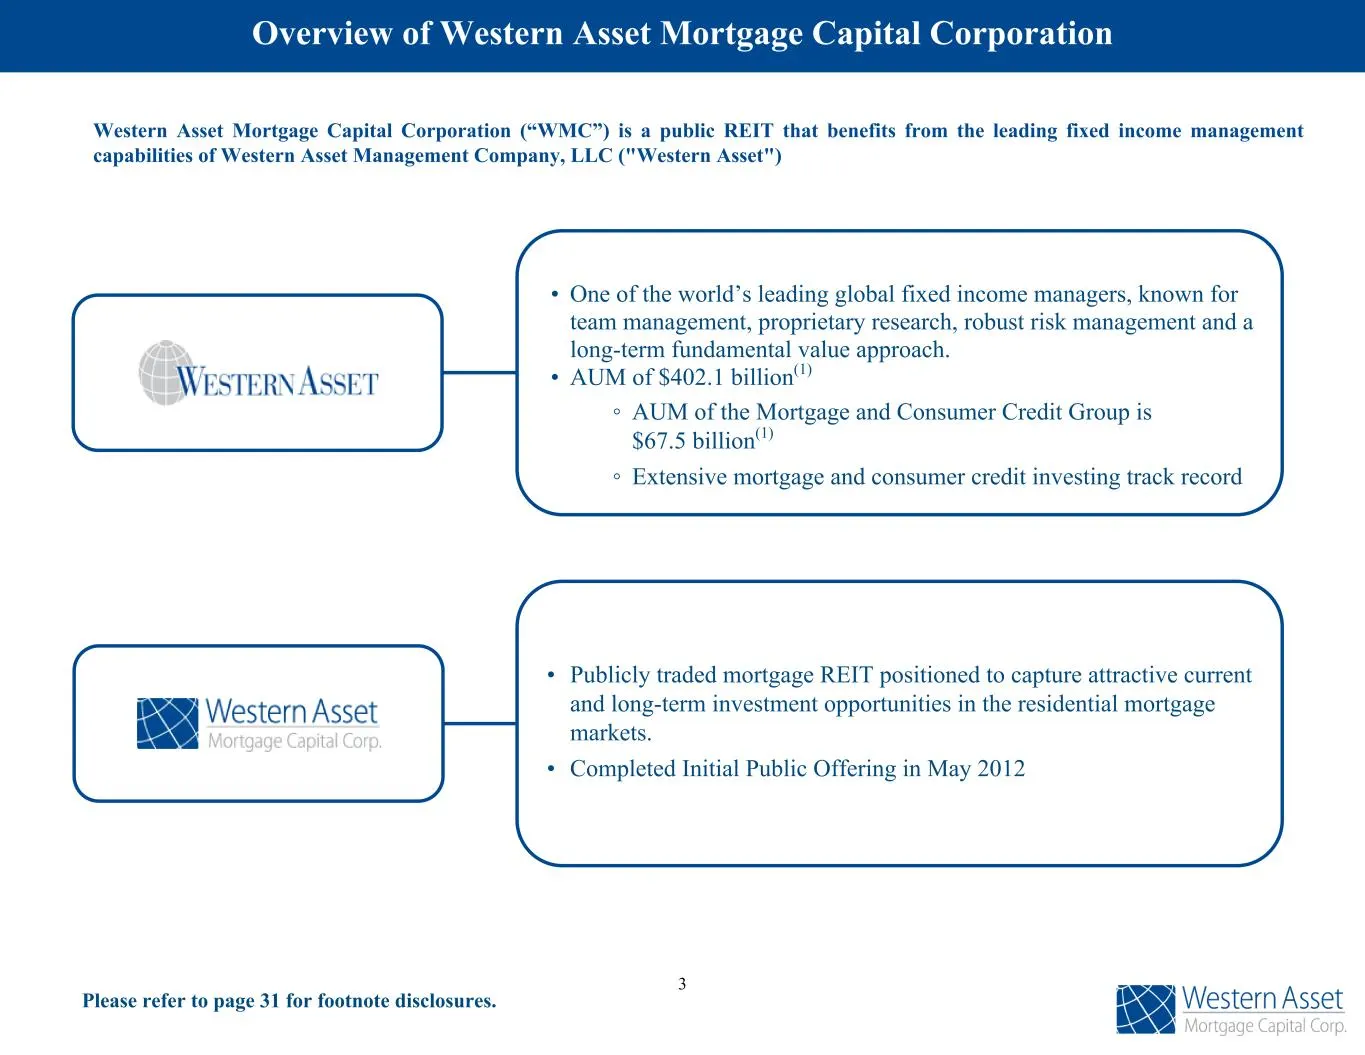
Western Asset Mortgage Capital Corporation (“WMC”) is a public REIT that benefits from the leading fixed income management capabilities of Western Asset Management Company, LLC ("Western Asset") • One of the world’s leading global fixed income managers, known for team management, proprietary researc
Slide 5: 2023 Outlook
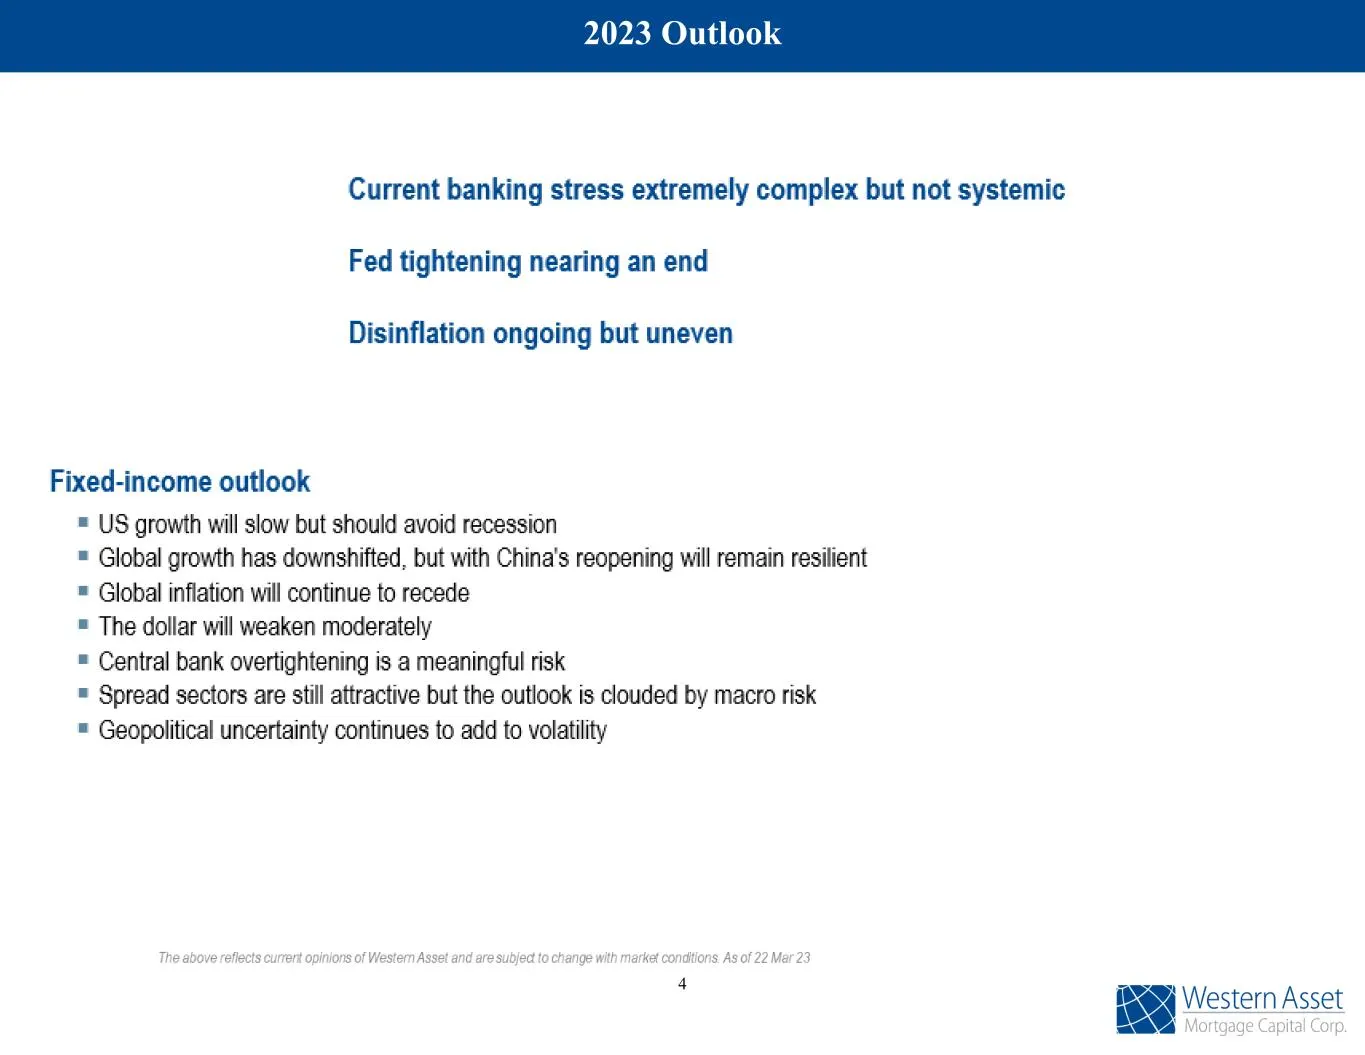
2023 Outlook Current banking stress extremely complex but not systemic Fed tightening nearing an end Disinflation ongoing but uneven Fixed-income outlook = US growth will slow but should avoid recession = Global growth has downshifted, but with China's reopening will remain resilient ® Global inflat
Slide 6: Mortgage & Consumer Credit Outlook
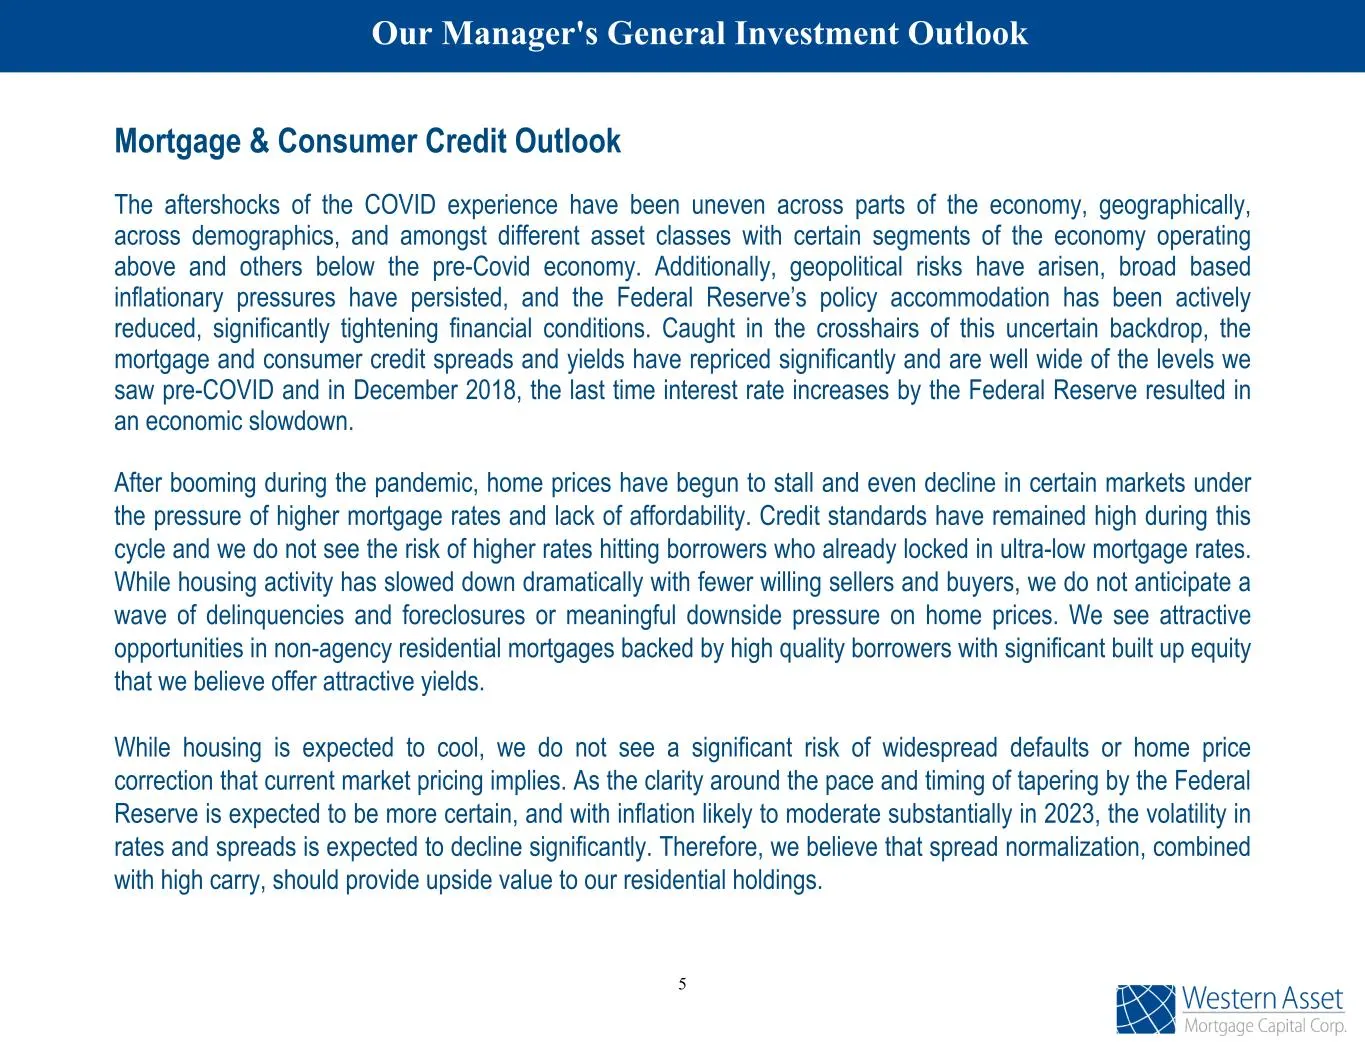
Mortgage & Consumer Credit Outlook The aftershocks of the COVID experience have been uneven across parts of the economy, geographically, across demographics, and amongst different asset classes with certain segments of the economy operating above and others below the pre-Covid economy. Additionally,
Slide 7: Prepayment Risk and Origination Supply are Low
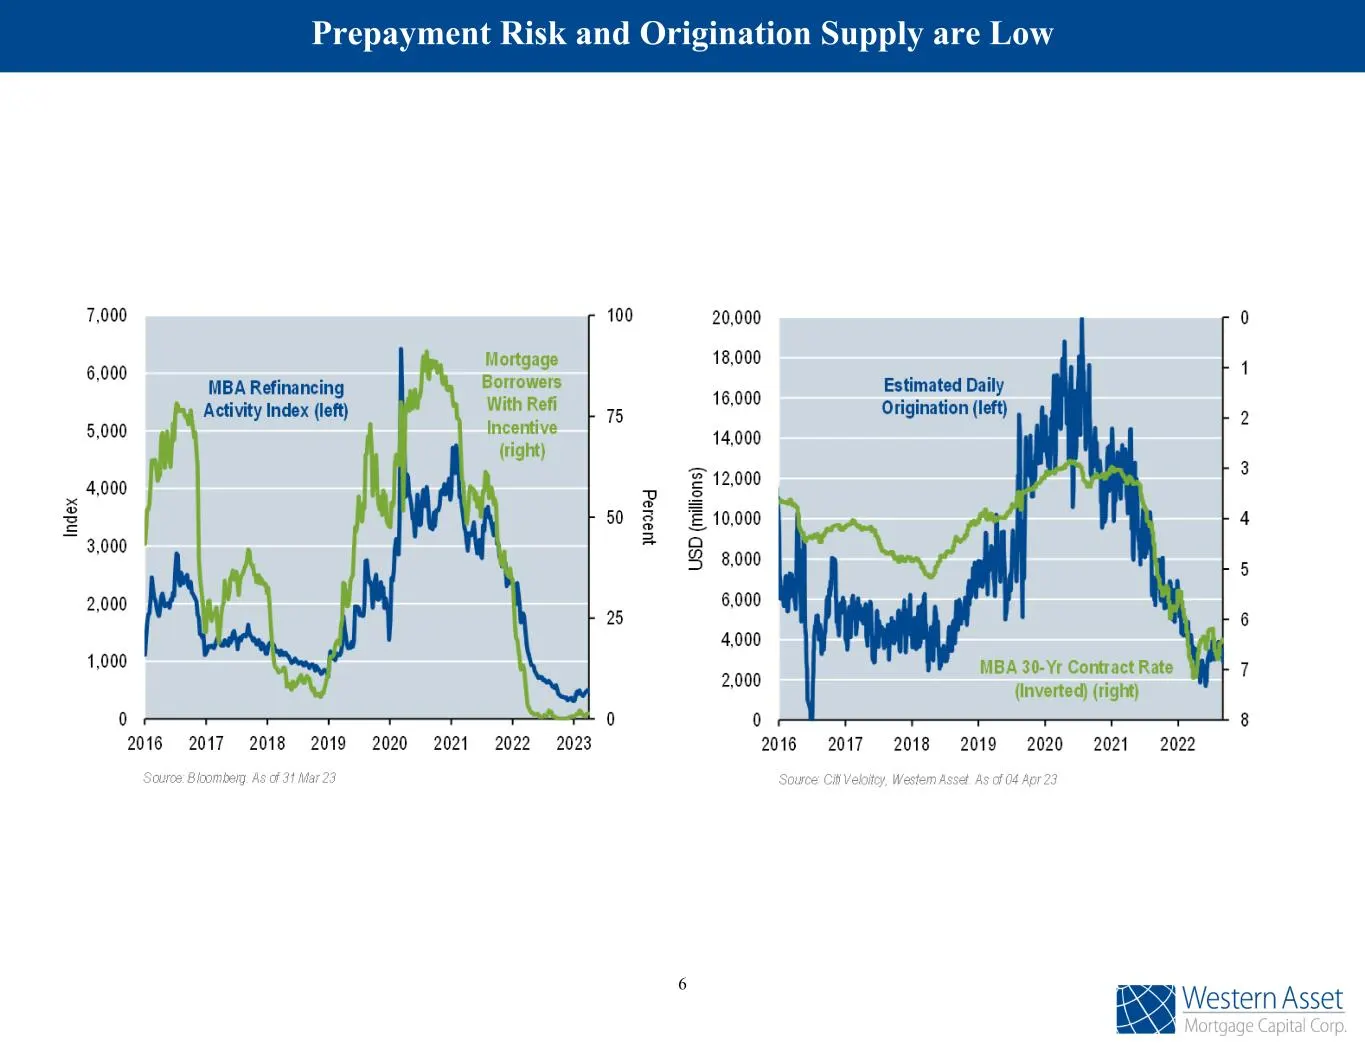
Prepayment Risk and Origination Supply are Low 6
Slide 8: Consumer balance sheets have predominantly fixed rate debt
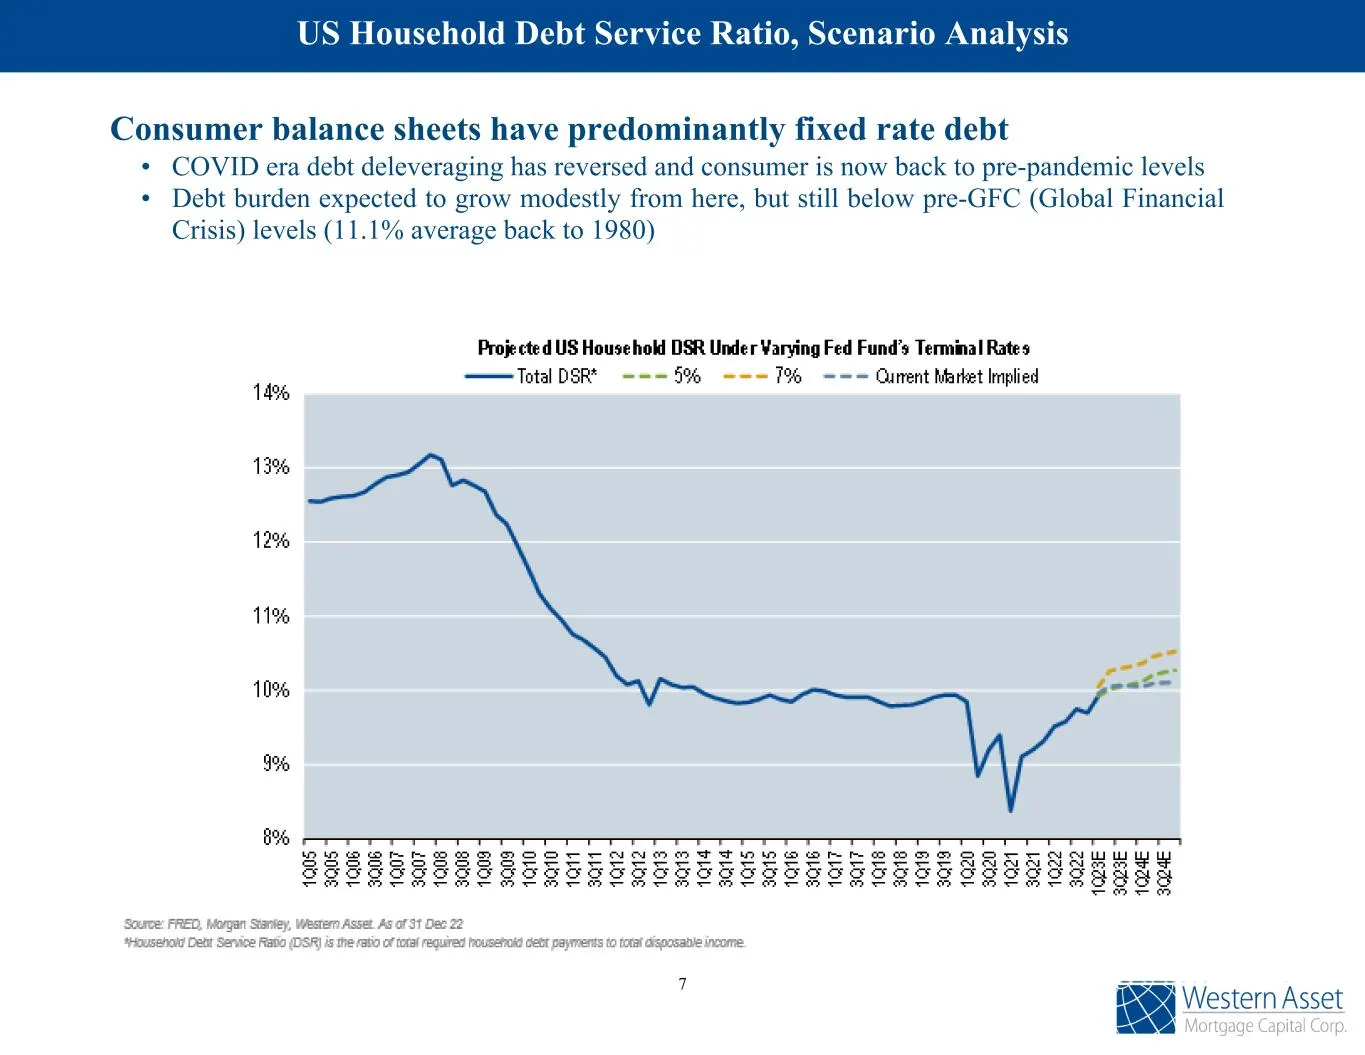
Consumer balance sheets have predominantly fixed rate debt • COVID era debt deleveraging has reversed and consumer is now back to pre-pandemic levels • Debt burden expected to grow modestly from here, but still below pre-GFC (Global Financial Crisis) levels (11.1% average back to 1980) US Household
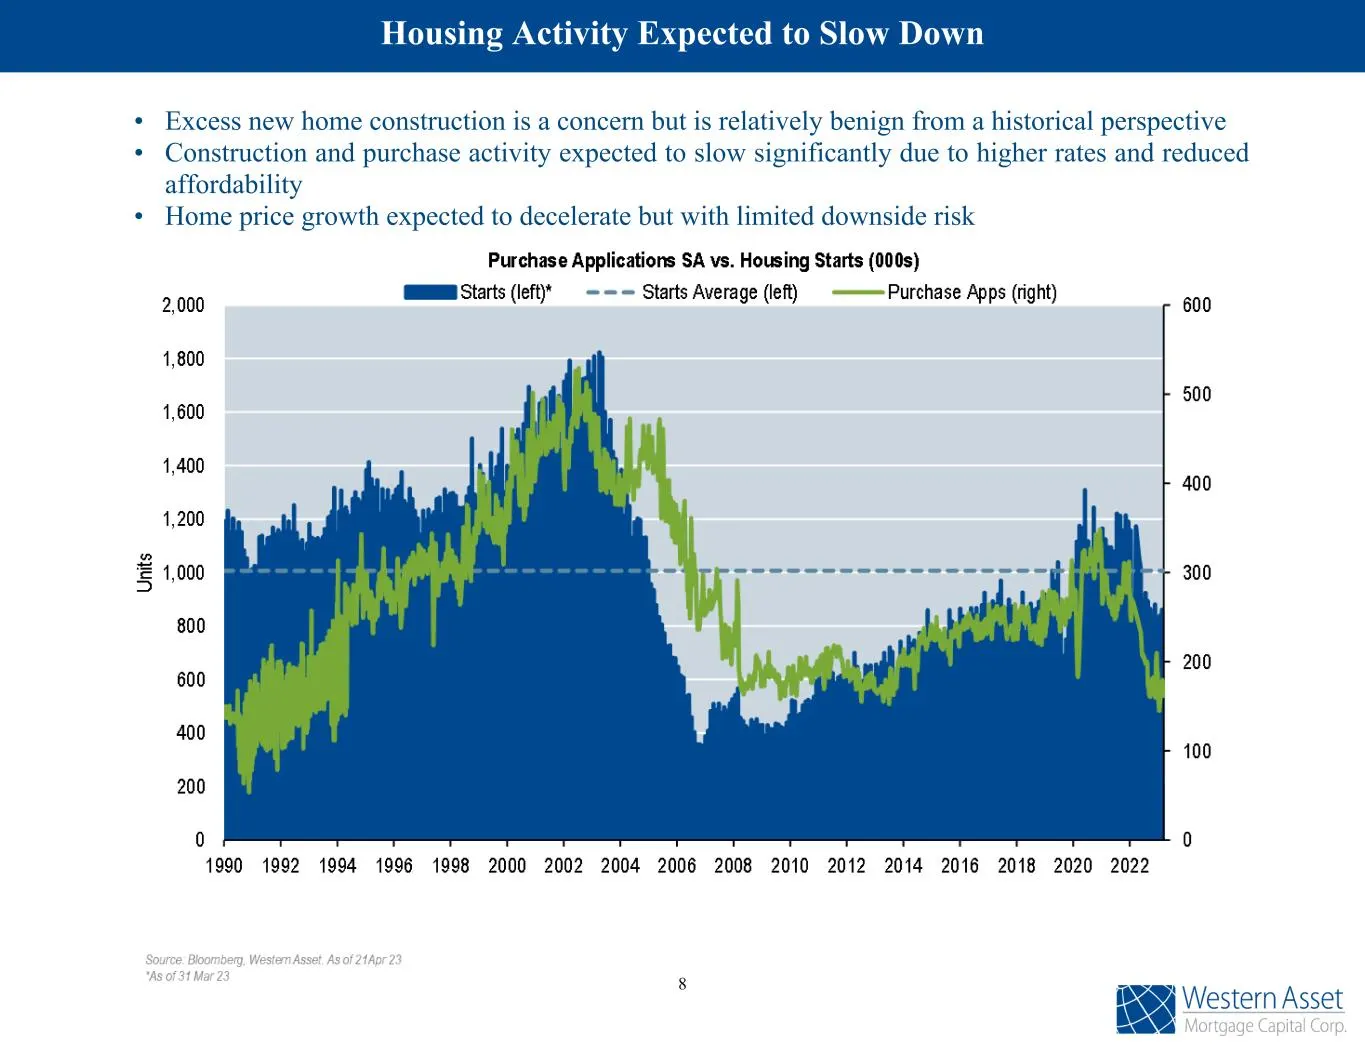
Slide 9: Housing Activity Expected to Slow Down
• Excess new home construction is a concern but is relatively benign from a historical perspective • Construction and purchase activity expected to slow significantly due to higher rates and reduced affordability • Home price growth expected to decelerate but with limited downside risk Housing Activ
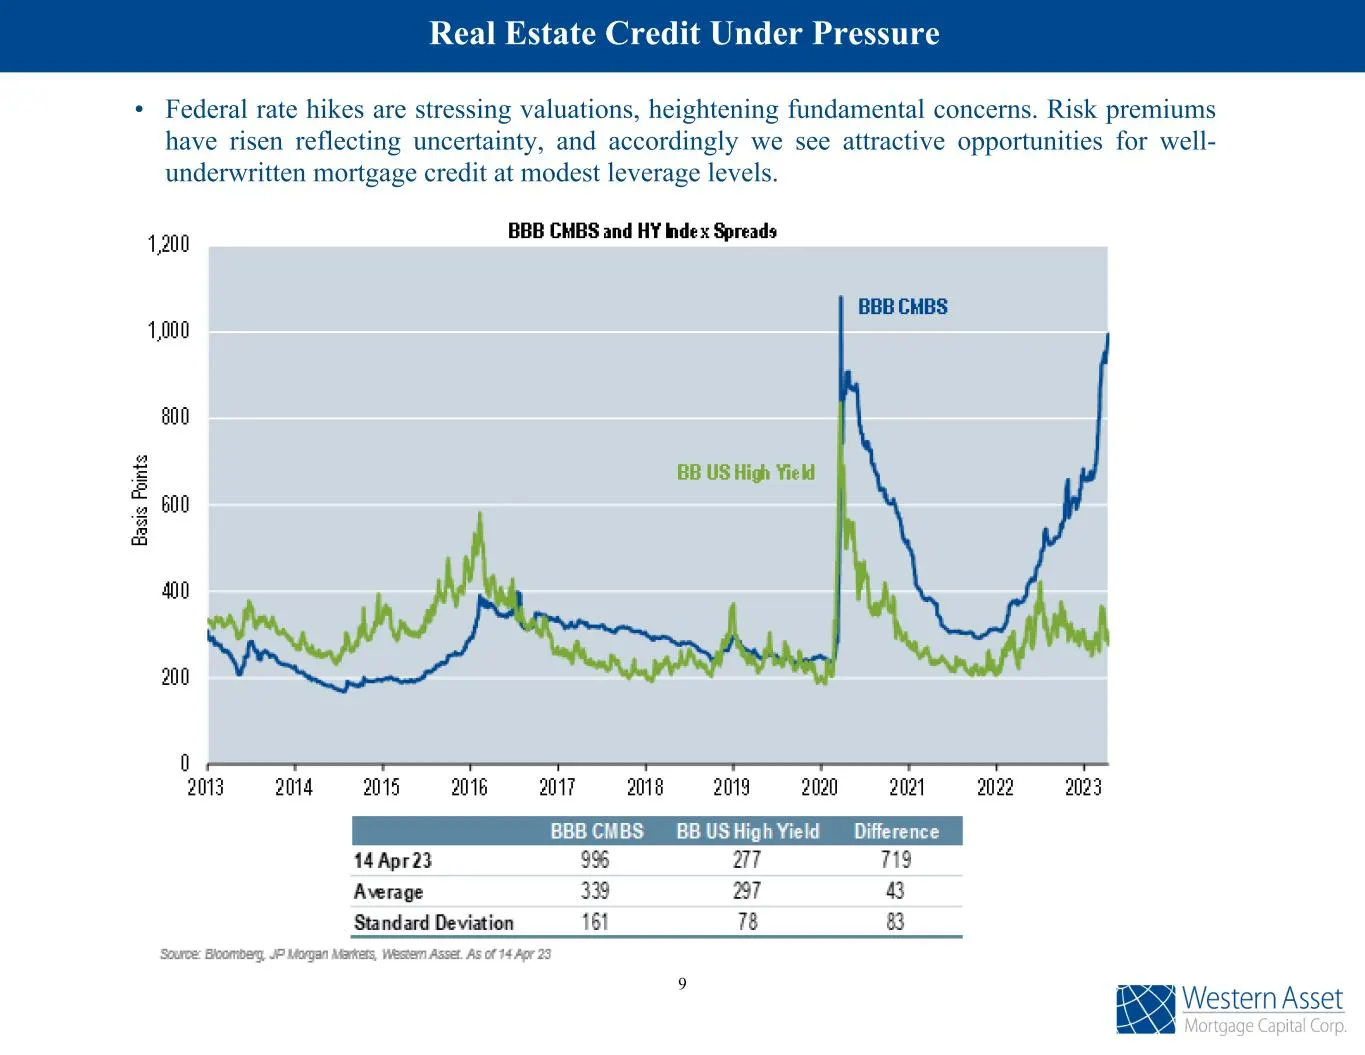
Slide 10: Real Estate Credit Under Pressure
Real Estate Credit Under Pressure • Federal rate hikes are stressing valuations, heightening fundamental concerns. Risk premiums have risen reflecting uncertainty, and accordingly we see attractive opportunities for well- underwritten mortgage credit at modest leverage levels. 9
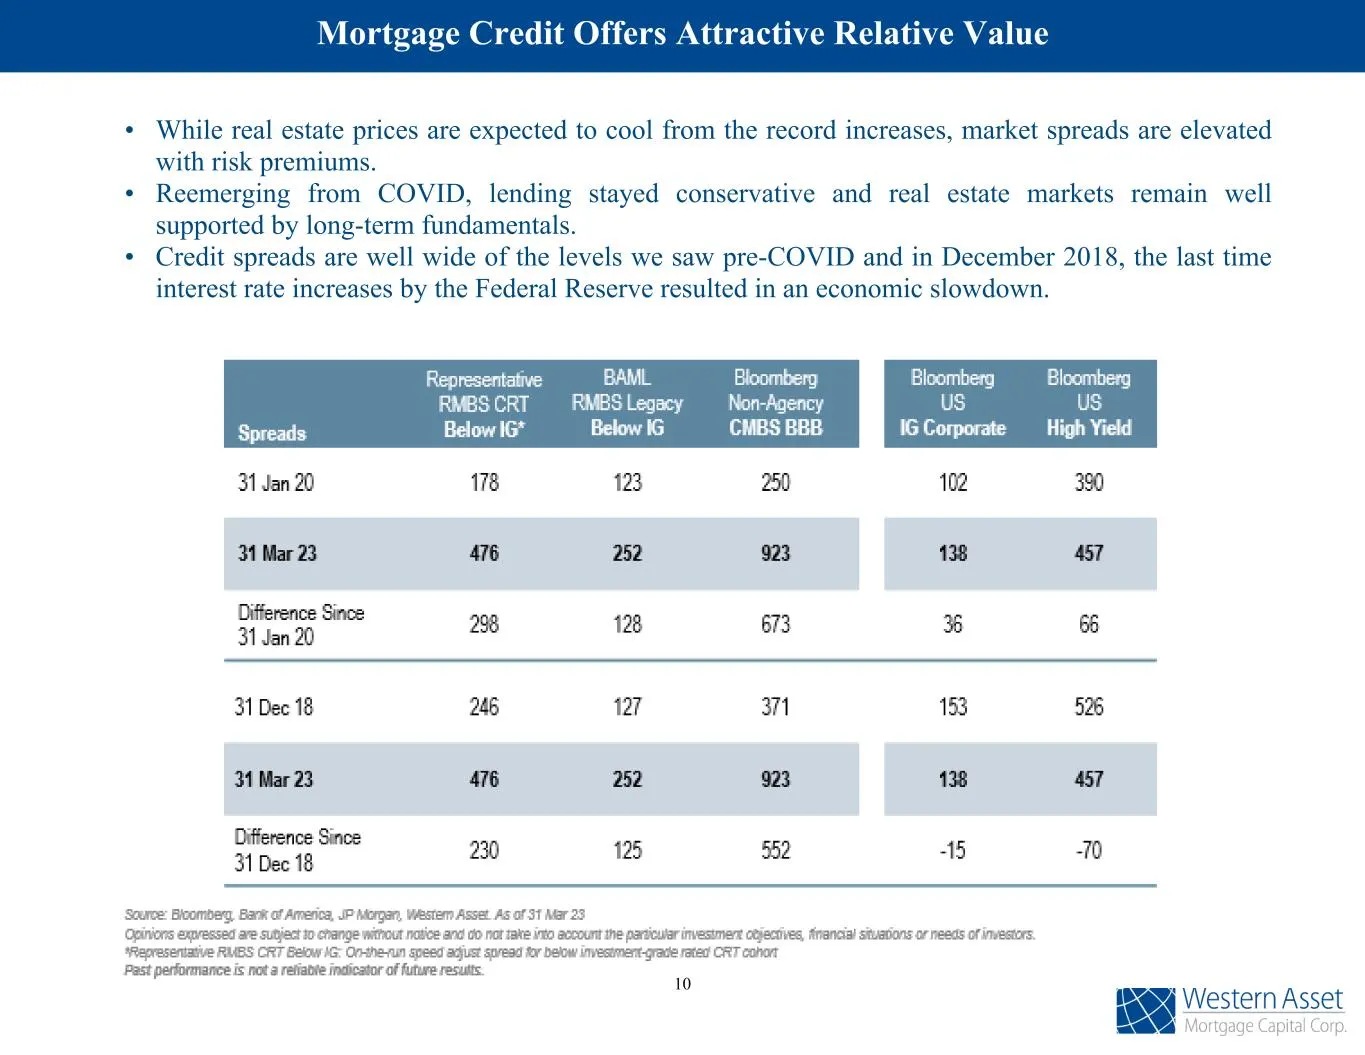
Slide 11: Mortgage Credit Offers Attractive Relative Value
Mortgage Credit Offers Attractive Relative Value • While real estate prices are expected to cool from the record increases, market spreads are elevated with risk premiums. • Reemerging from COVID, lending stayed conservative and real estate markets remain well supported by long-term fundamentals. •
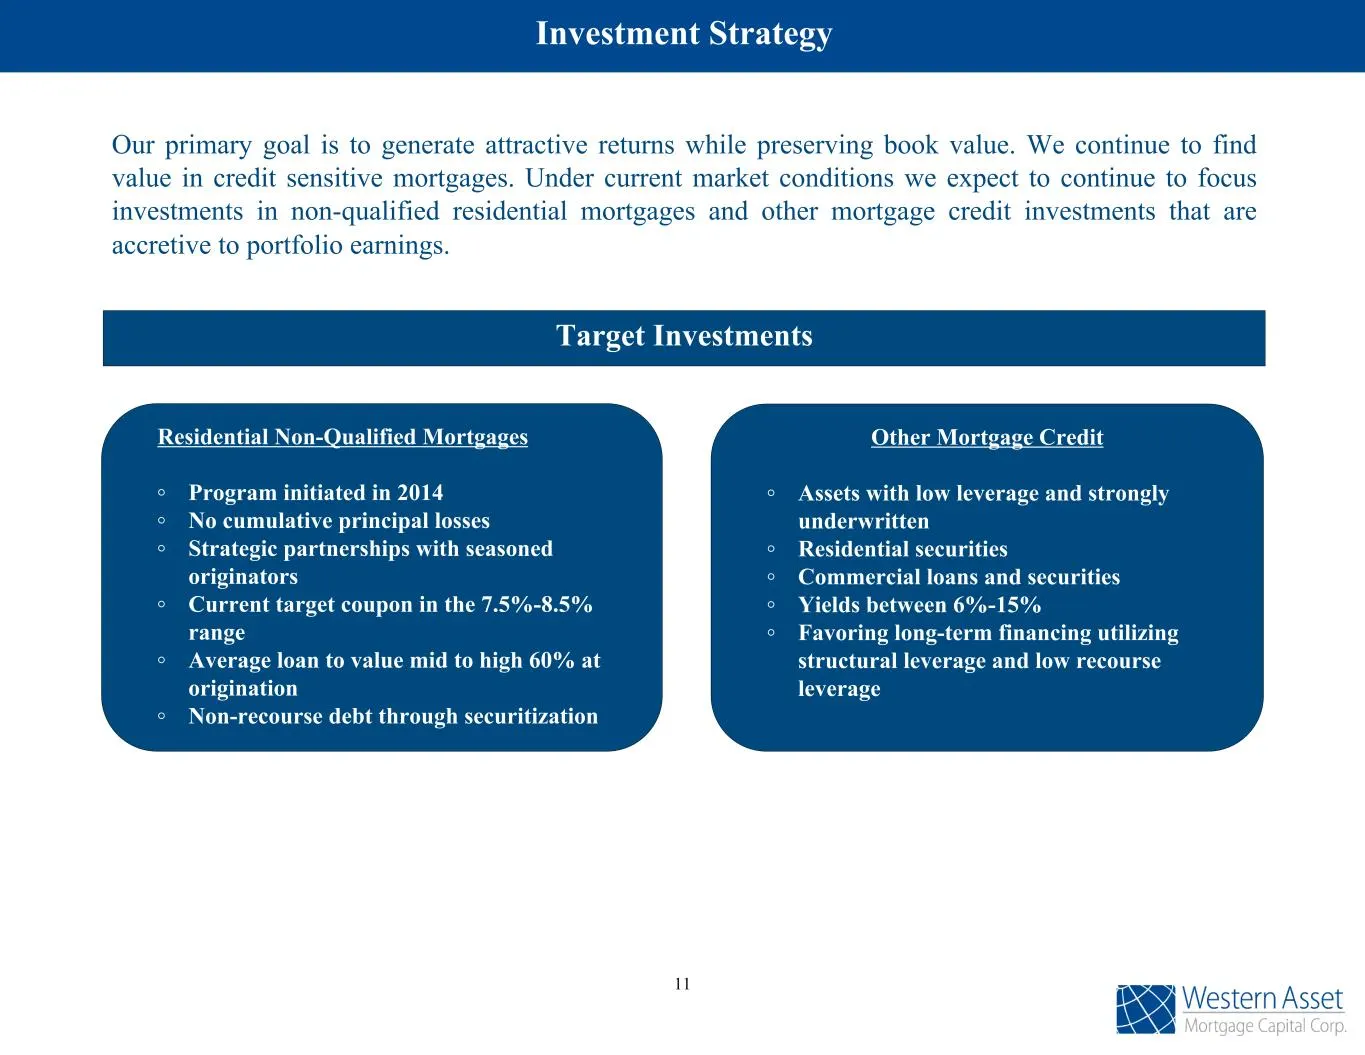
Slide 12: Investment Strategy
Investment Strategy Our primary goal is to generate attractive returns while preserving book value. We continue to find value in credit sensitive mortgages. Under current market conditions we expect to continue to focus investments in non-qualified residential mortgages and other mortgage credit inv
Slide 13: Company Business Highlights
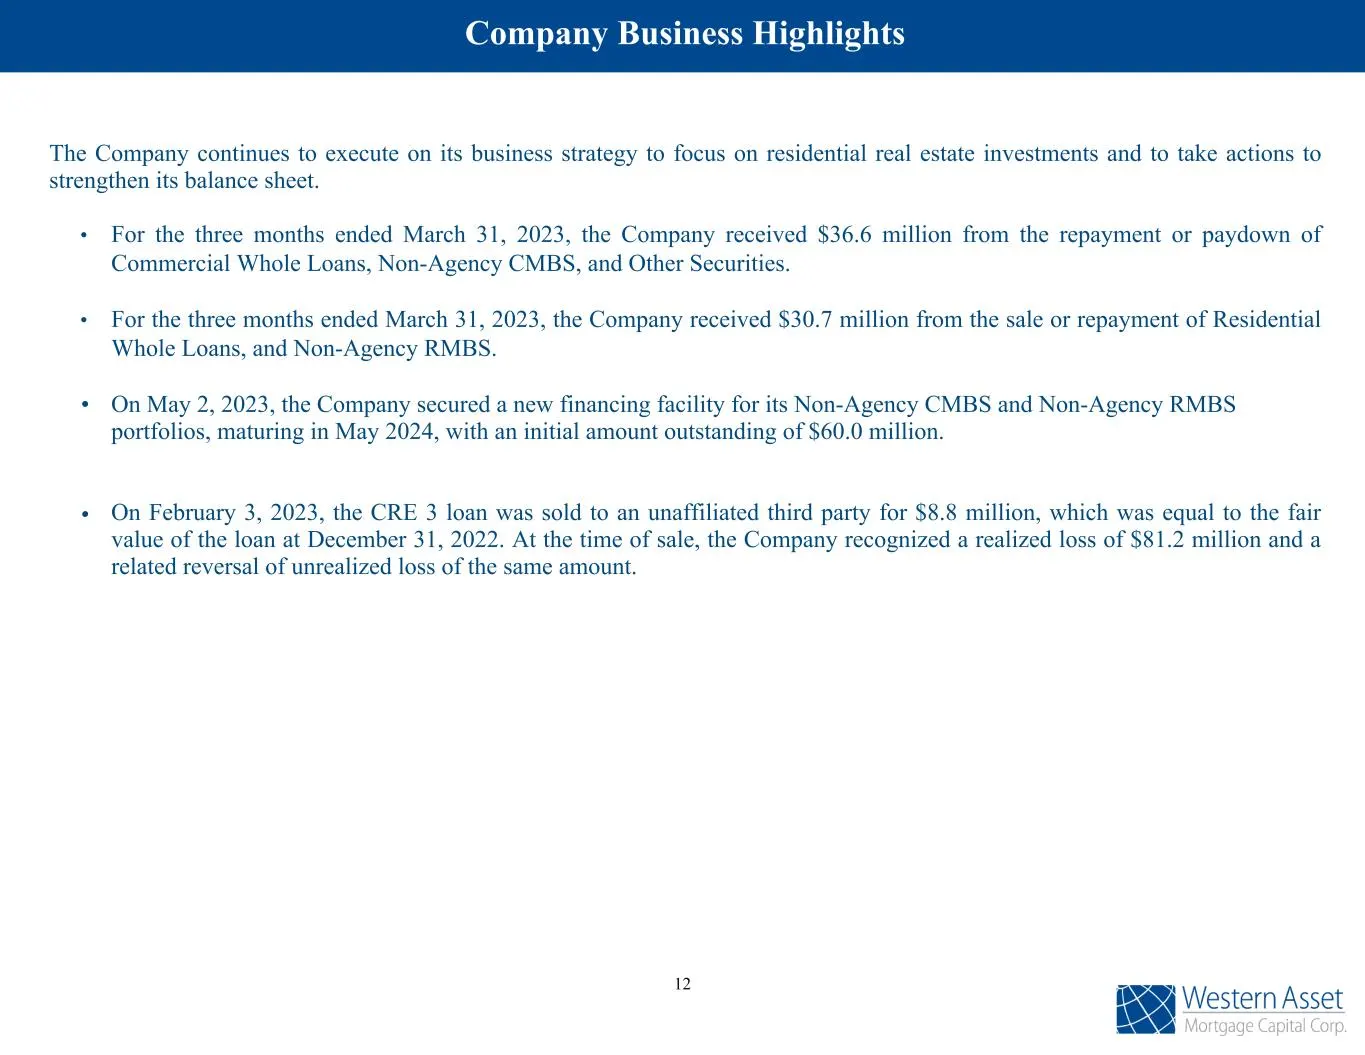
Company Business Highlights The Company continues to execute on its business strategy to focus on residential real estate investments and to take actions to strengthen its balance sheet. • For the three months ended March 31, 2023, the Company received $36.6 million from the repayment or paydown of
Slide 14: First Quarter Financial Results
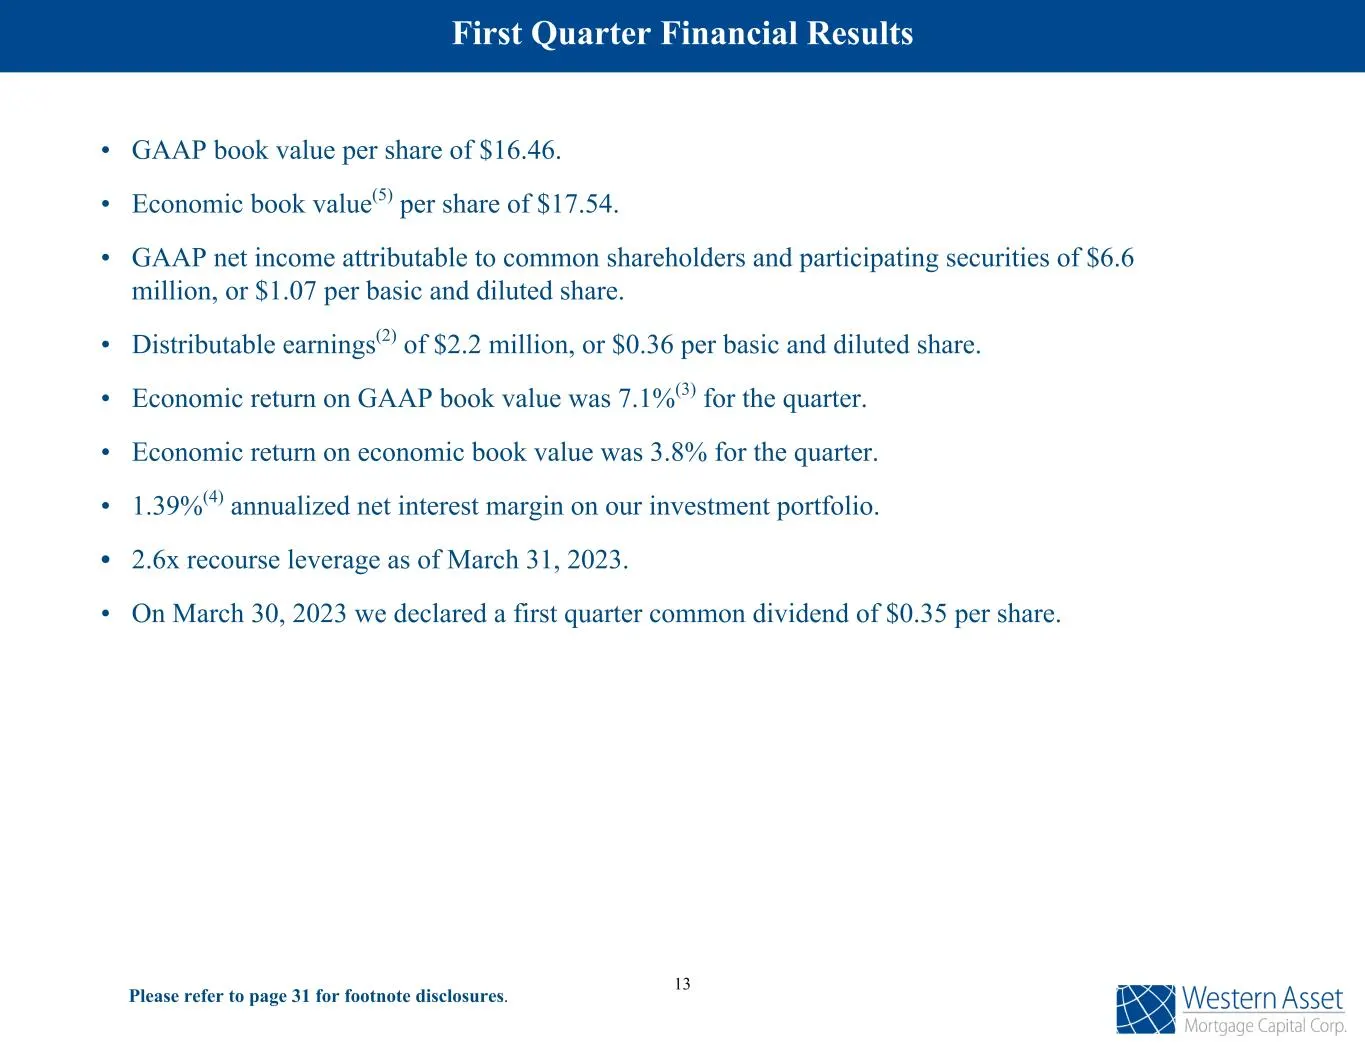
Please refer to page 31 for footnote disclosures. • GAAP book value per share of $16.46. • Economic book value(5) per share of $17.54. • GAAP net income attributable to common shareholders and participating securities of $6.6 million, or $1.07 per basic and diluted share. • Distributable earnings(2)
Slide 15: WMC Key Metrics as of March 31, 2023
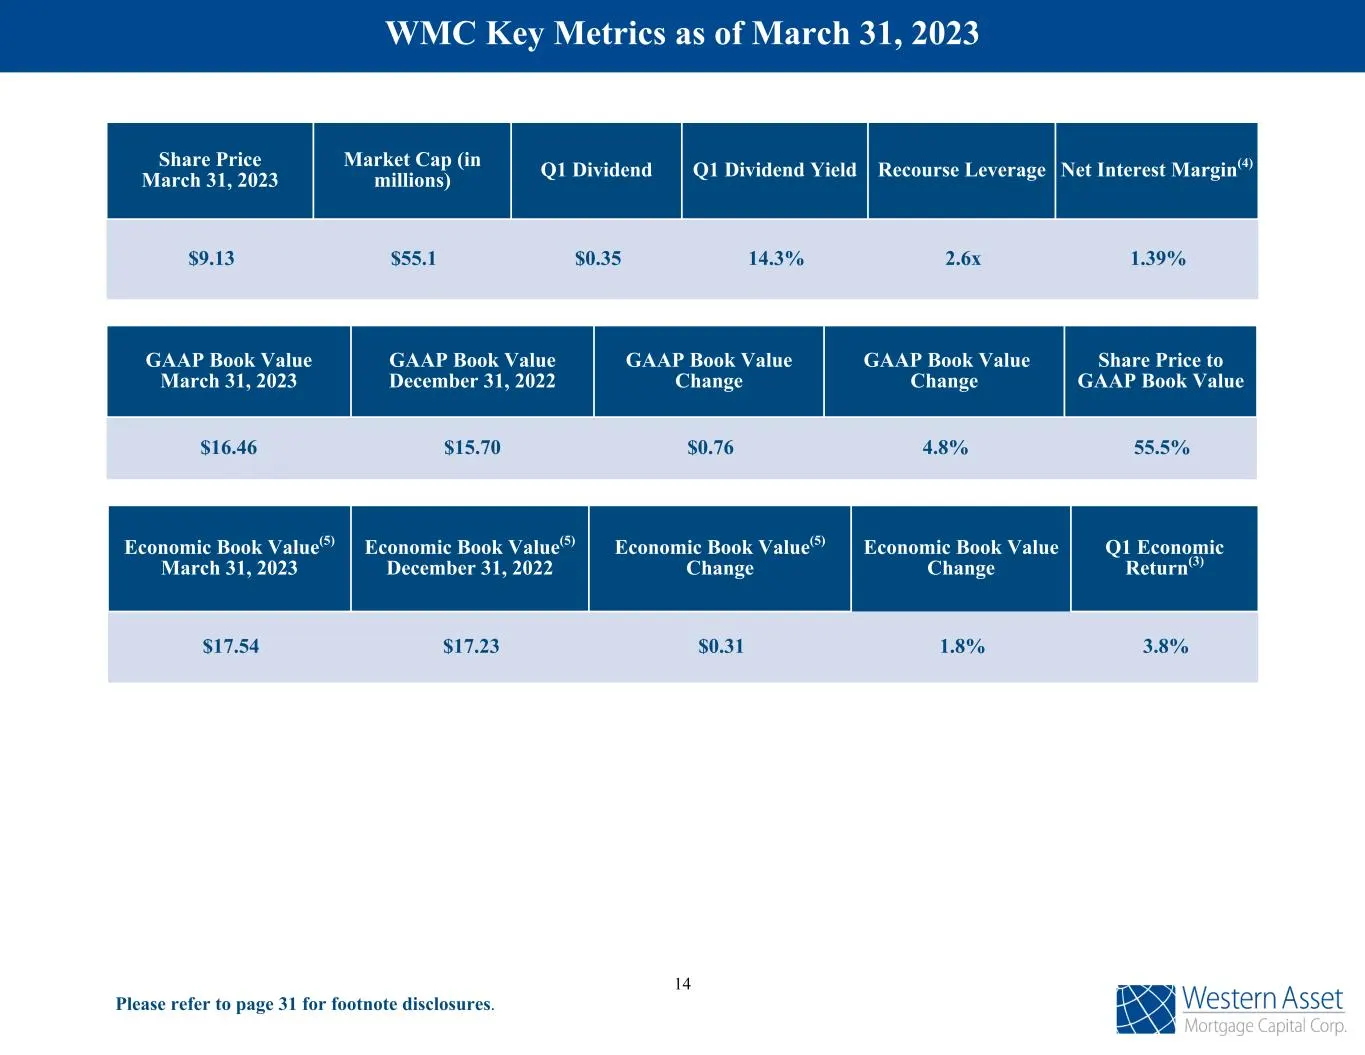
The following are the Company's key metrics as of December 31, 2021; Share Price March 31, 2023 Market Cap (in millions) Q1 Dividend Q1 Dividend Yield Recourse Leverage Net Interest Margin(4) $9.13 $55.1 $0.35 14.3% 2.6x 1.39% Economic Book Value(5) March 31, 2023 Economic Book Value(5) December 31,
Slide 16: Portfolio Summary
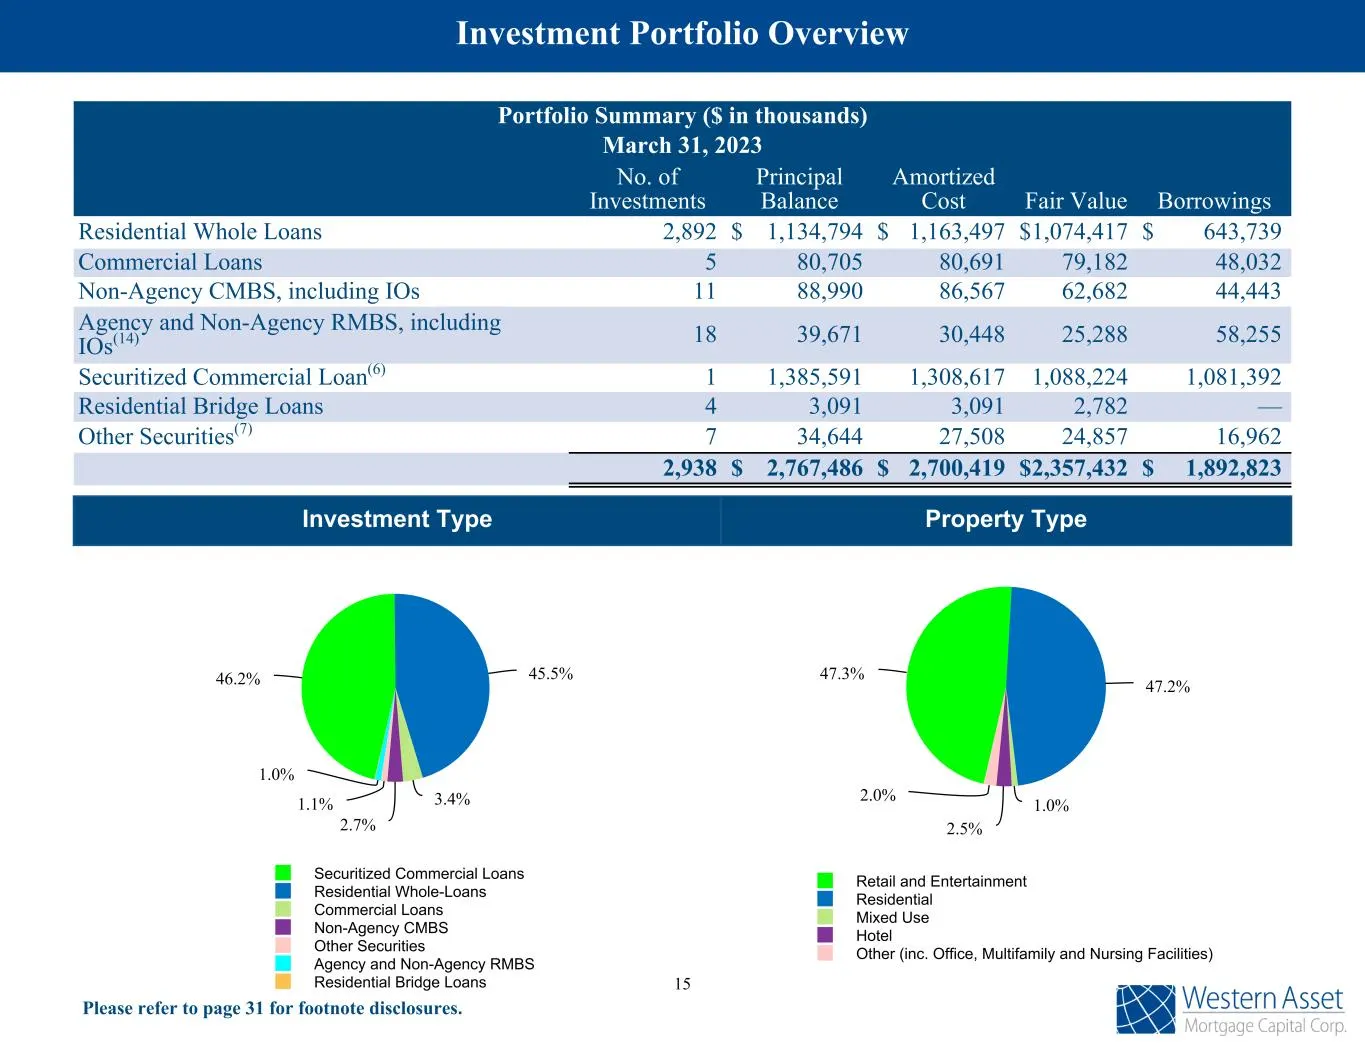
Portfolio Summary ($ in thousands) March 31, 2023 No. of Investments Principal Balance Amortized Cost Fair Value Borrowings Residential Whole Loans 2,892 $ 1,134,794 $ 1,163,497 $ 1,074,417 $ 643,739 Commercial Loans 5 80,705 80,691 79,182 48,032 Non-Agency CMBS, including IOs 11 88,990 86,567 62,68
Slide 17: Residential Whole Loans Overview
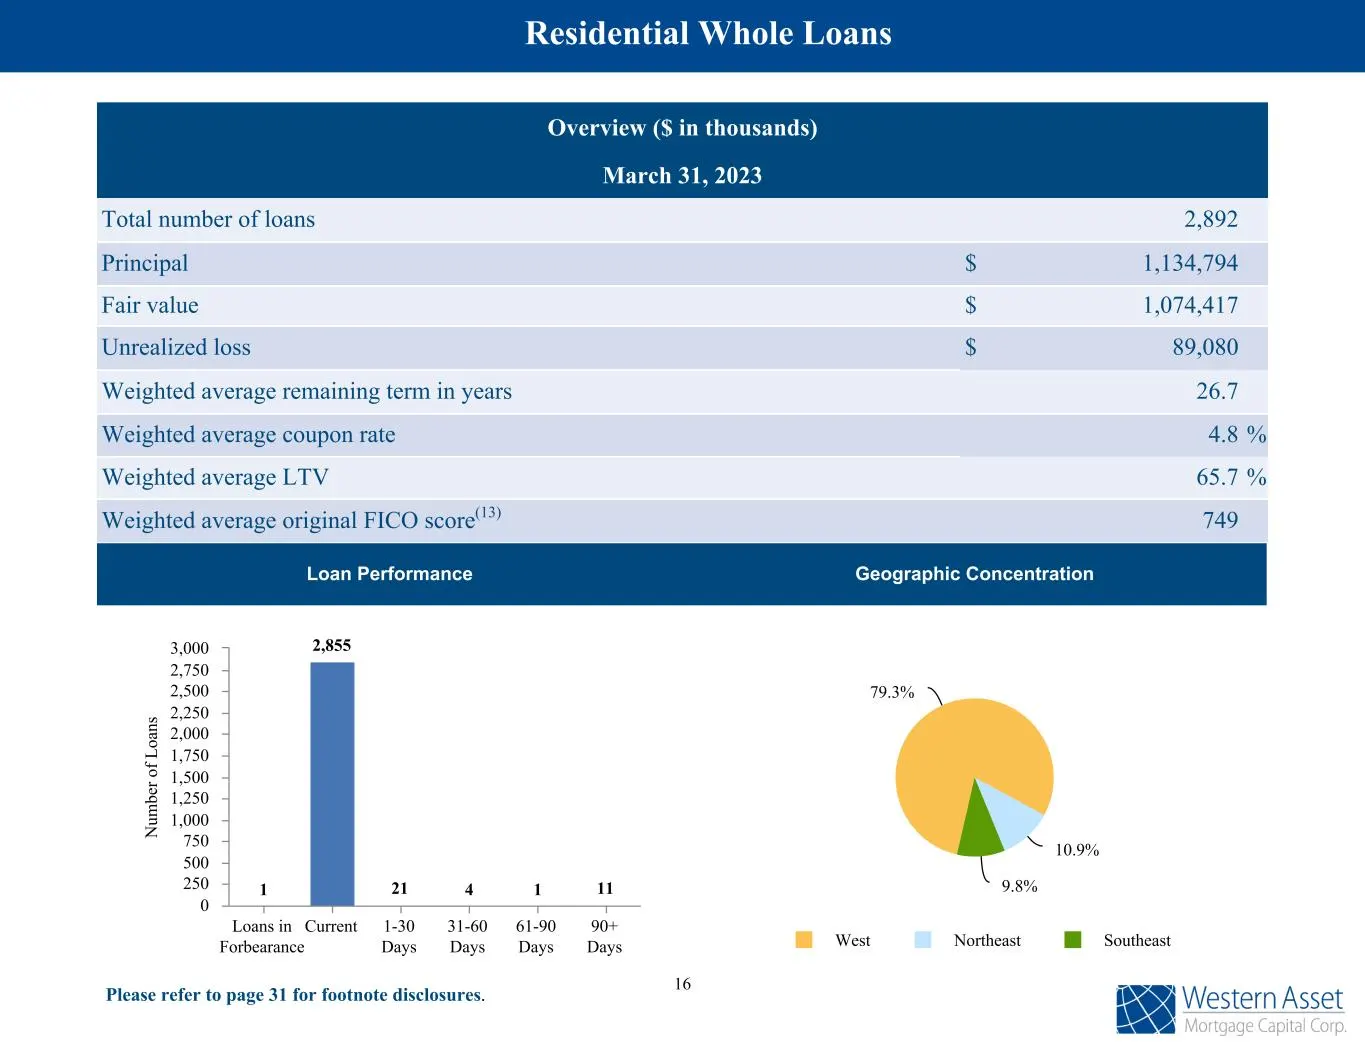
Overview ($ in thousands) March 31, 2023 Total number of loans 2,892 Principal $ 1,134,794 Fair value $ 1,074,417 Unrealized loss $ 89,080 Weighted average remaining term in years 26.7 Weighted average coupon rate 4.8 % Weighted average LTV 65.7 % Weighted average original FICO score(13) 749 Loan Pe
Slide 18: Commercial Loans Overview
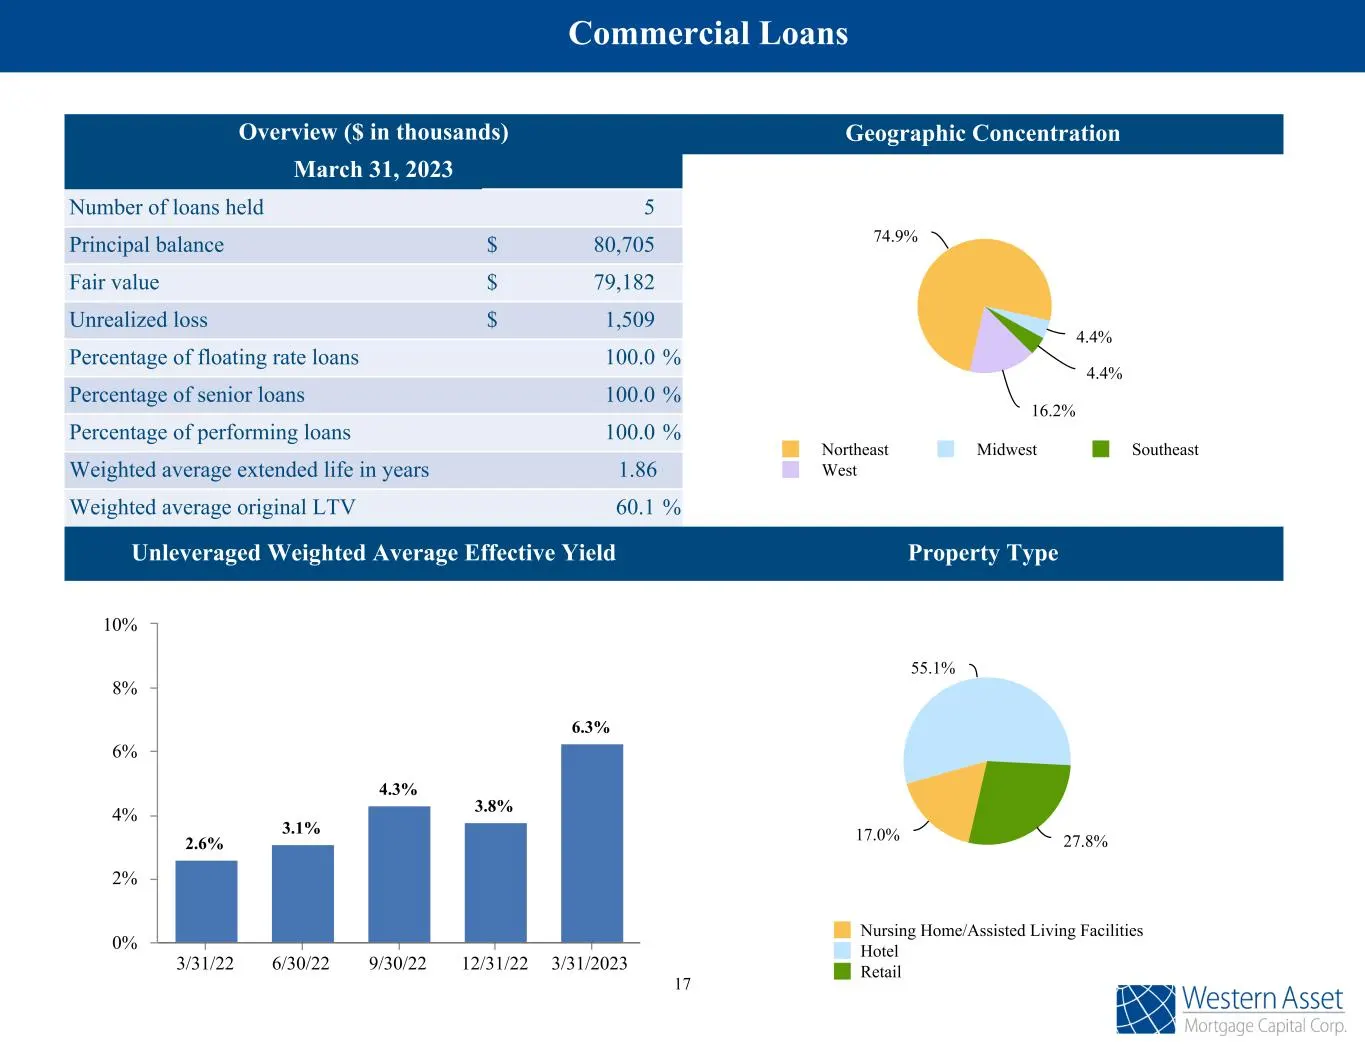
Overview ($ in thousands) March 31, 2023 Number of loans held 5 Principal balance $ 80,705 Fair value $ 79,182 Unrealized loss $ 1,509 Percentage of floating rate loans 100.0 % Percentage of senior loans 100.0 % Percentage of performing loans 100.0 % Weighted average extended life in years 1.86 Weig
Slide 19: Commercial Loans as of March 31, 2023
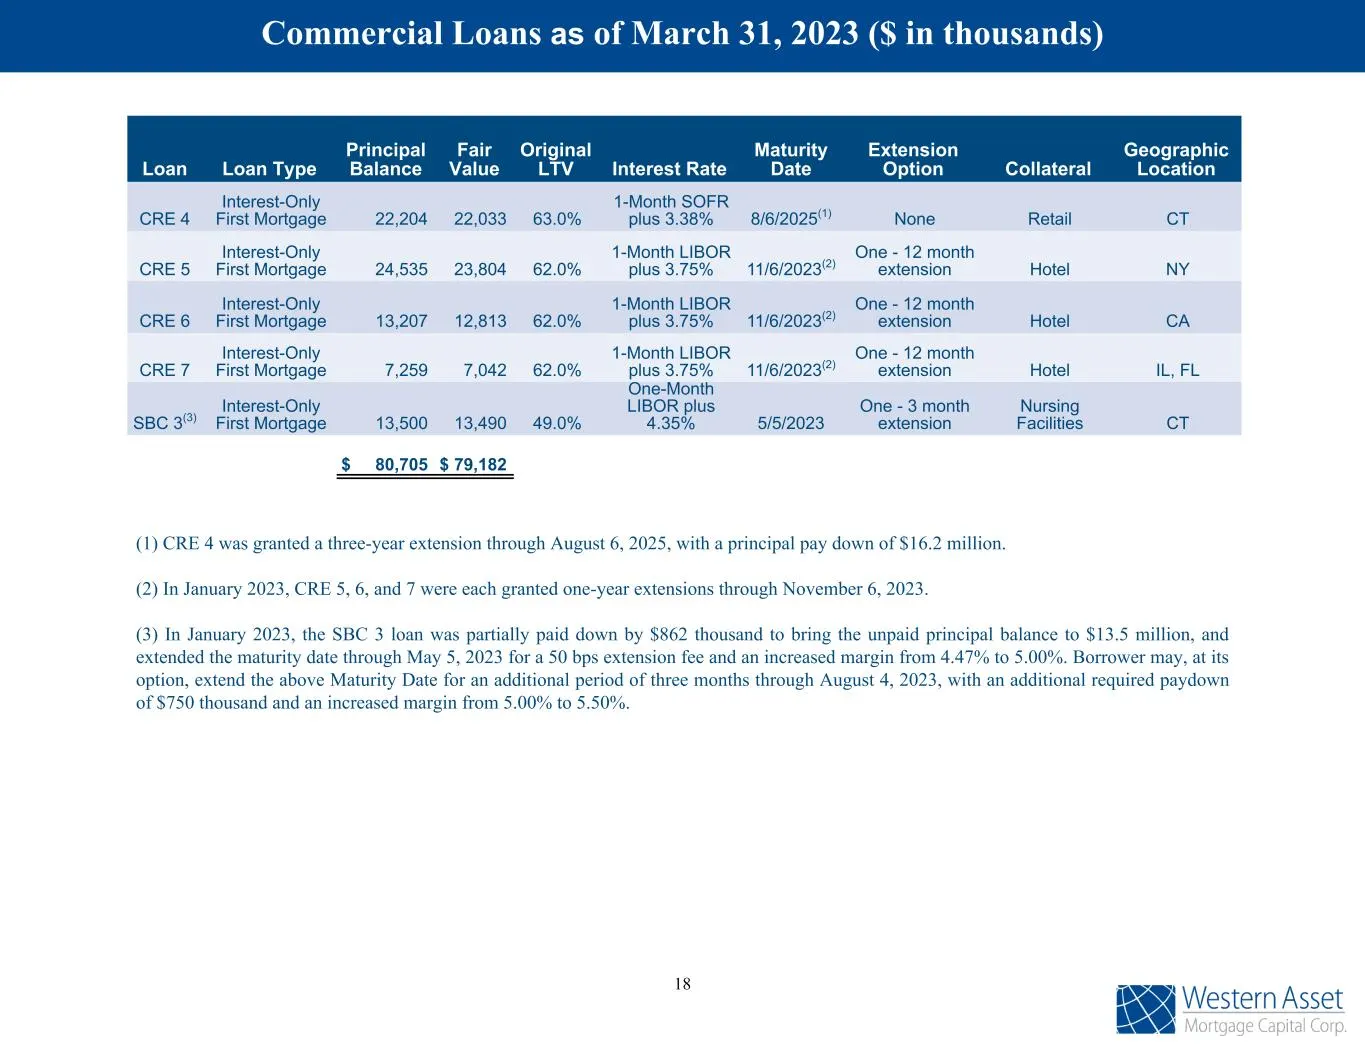
Loan Loan Type Principal Balance Fair Value Original LTV Interest Rate Maturity Date Extension Option Collateral Geographic Location CRE 4 Interest-Only First Mortgage 22,204 22,033 63.0% 1-Month SOFR plus 3.38% 8/6/2025(1) None Retail CT CRE 5 Interest-Only First Mortgage 24,535 23,804 62.0% 1-Mont
Slide 20: Non-Agency CMBS Investments
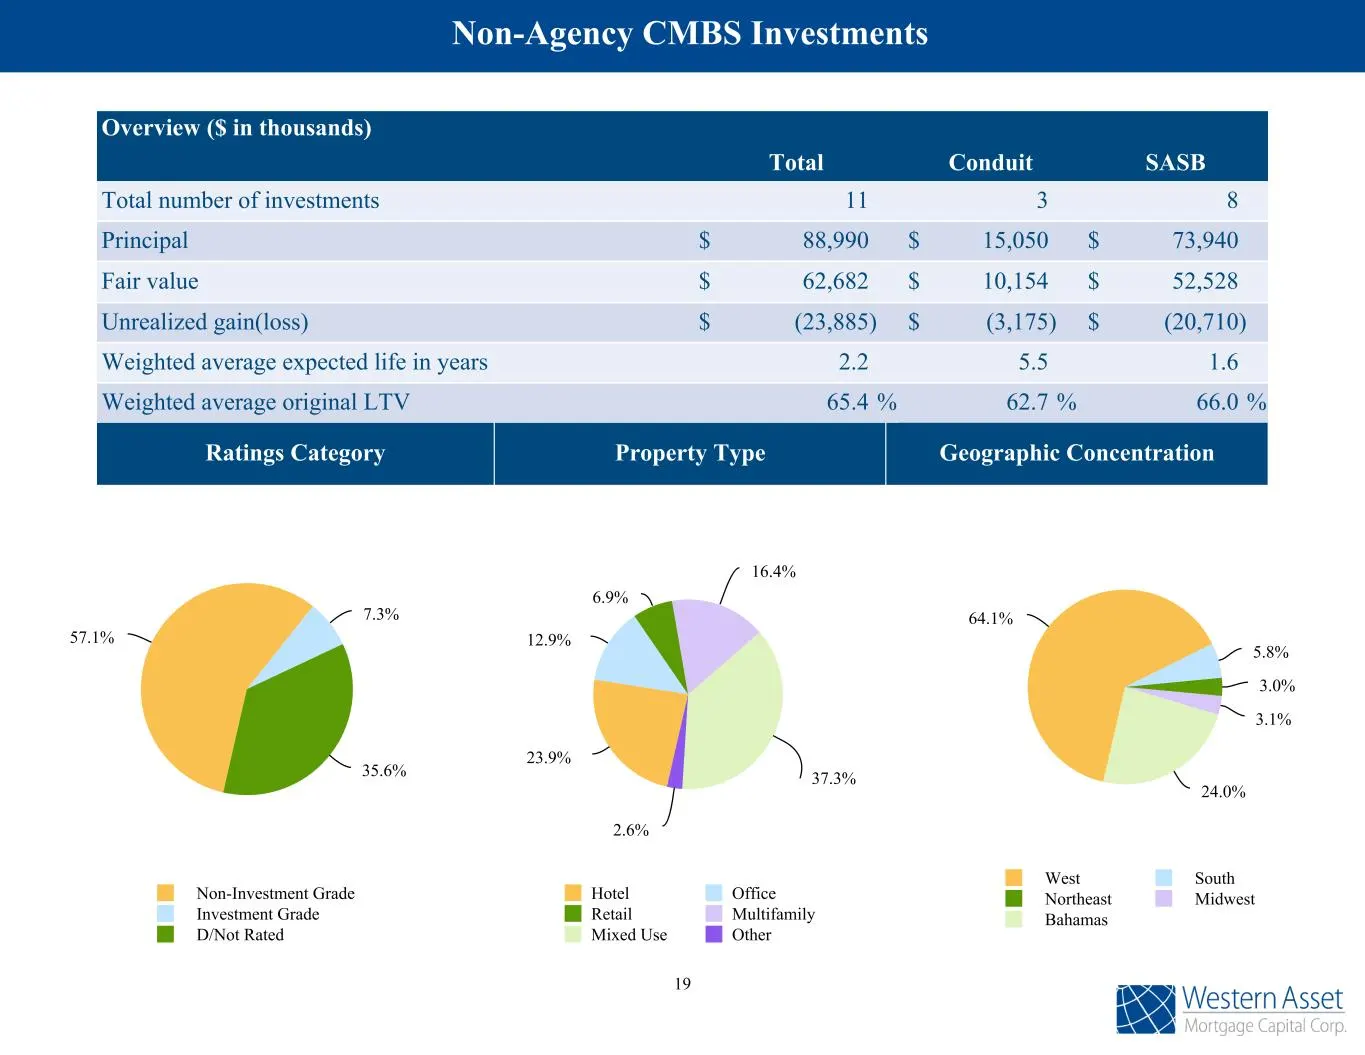
Overview ($ in thousands) Total Conduit SASB Total number of investments 11 3 8 Principal $ 88,990 $ 15,050 $ 73,940 Fair value $ 62,682 $ 10,154 $ 52,528 Unrealized gain(loss) $ (23,885) $ (3,175) $ (20,710) Weighted average expected life in years 2.2 5.5 1.6 Weighted average original LTV 65.4 % 62
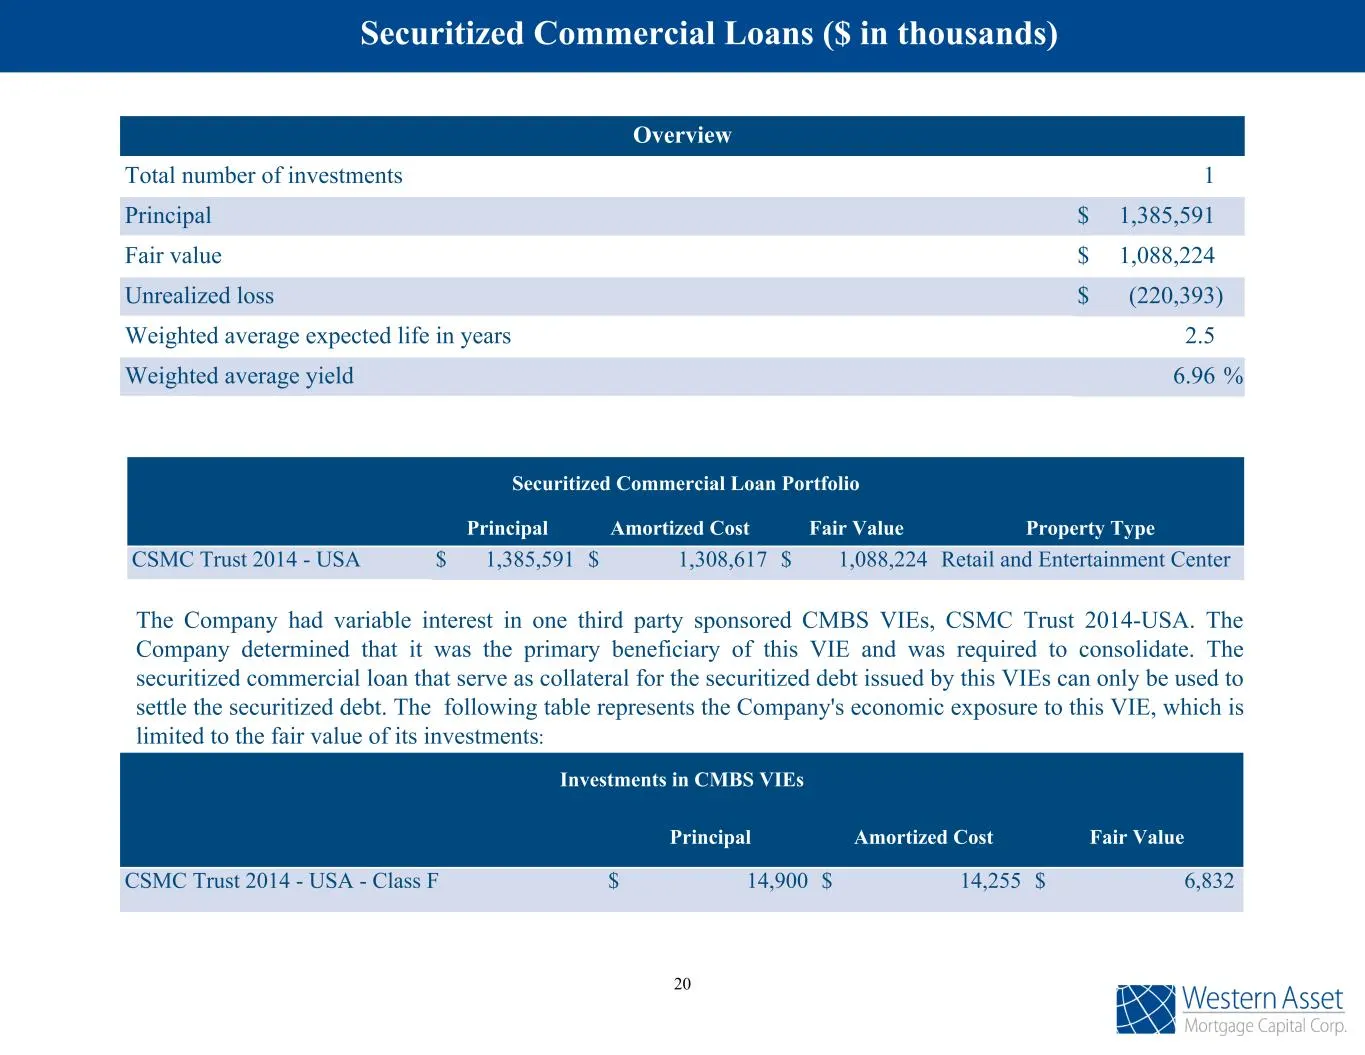
Slide 21: Securitized Commercial Loan Portfolio
Overview Total number of investments 1 Principal $ 1,385,591 Fair value $ 1,088,224 Unrealized loss $ (220,393) Weighted average expected life in years 2.5 Weighted average yield 6.96 % Securitized Commercial Loan Portfolio Principal Amortized Cost Fair Value Property Type CSMC Trust 2014 - USA $ 1,
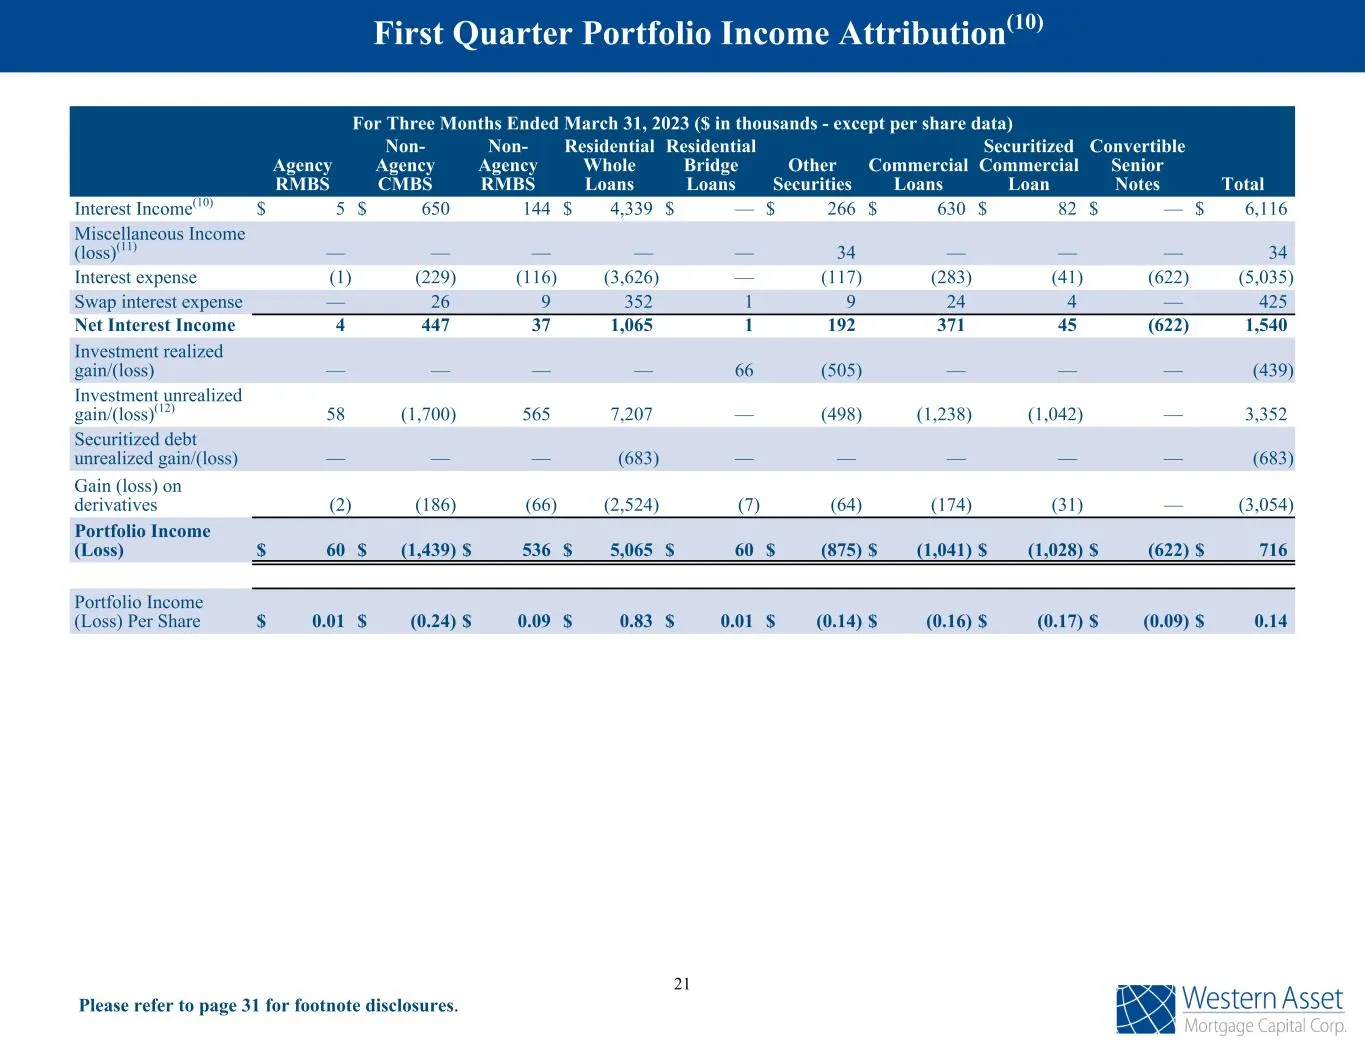
Slide 22: Results by Investment Type, Three Months Ended March 31, 2023
Please refer to page 31 for footnote disclosures. For Three Months Ended March 31, 2023 ($ in thousands - except per share data) Agency RMBS Non- Agency CMBS Non- Agency RMBS Residential Whole Loans Residential Bridge Loans Other Securities Commercial Loans Securitized Commercial Loan Convertible Se
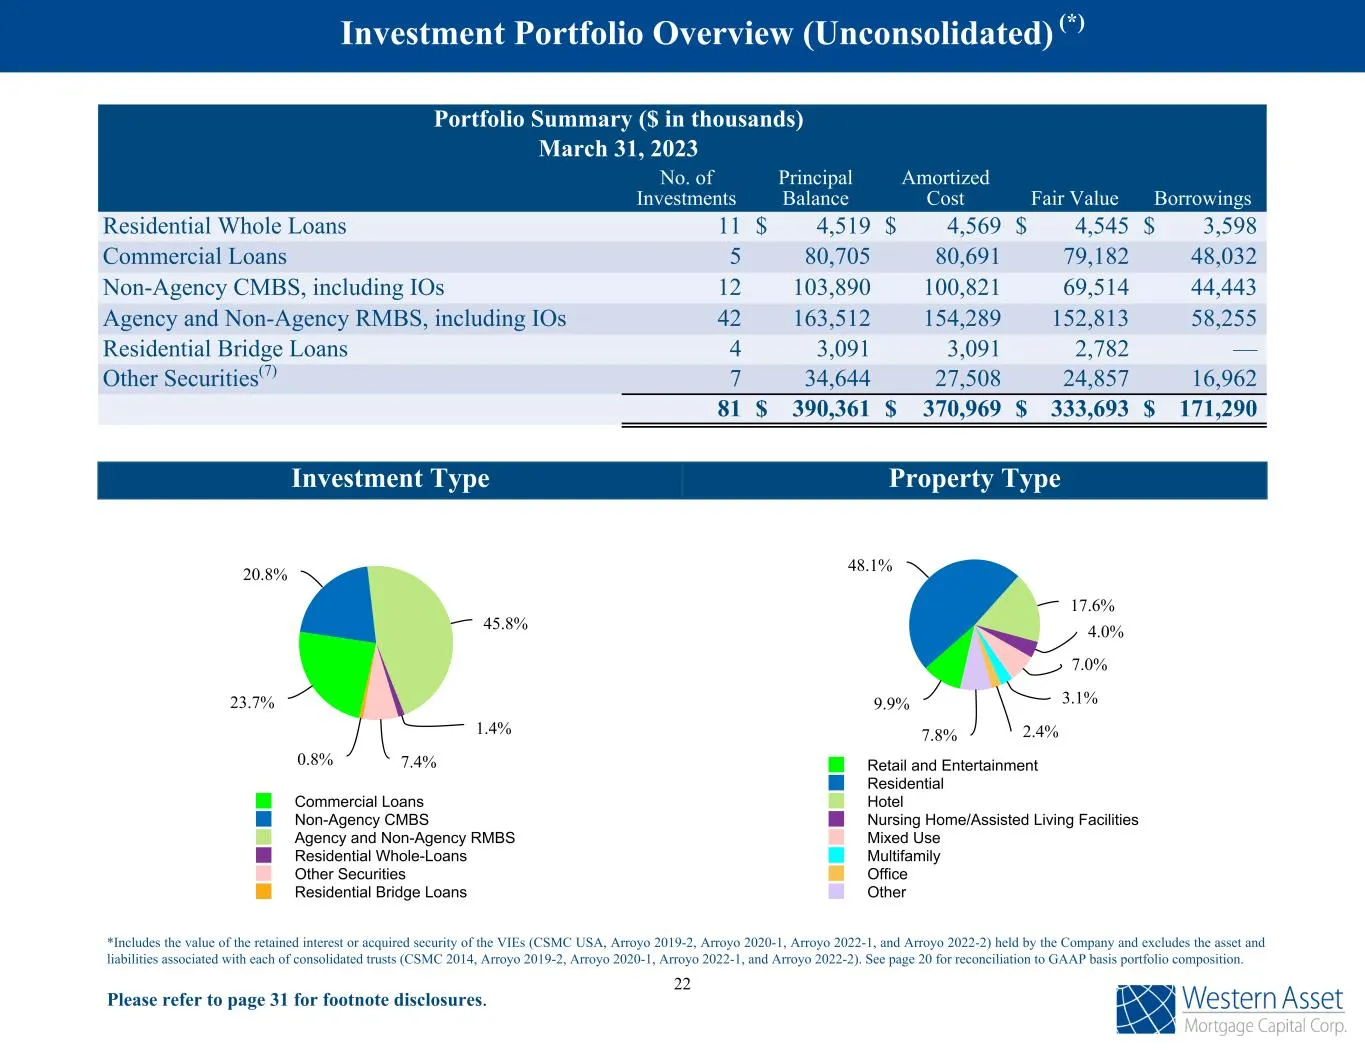
Slide 23: Adjusted Portfolio Composition
Investment Type 23.7% 20.8% 45.8% 1.4% 7.4%0.8% Commercial Loans Non-Agency CMBS Agency and Non-Agency RMBS Residential Whole-Loans Other Securities Residential Bridge Loans Portfolio Summary ($ in thousands) March 31, 2023 No. of Investments Principal Balance Amortized Cost Fair Value Borrowings Re
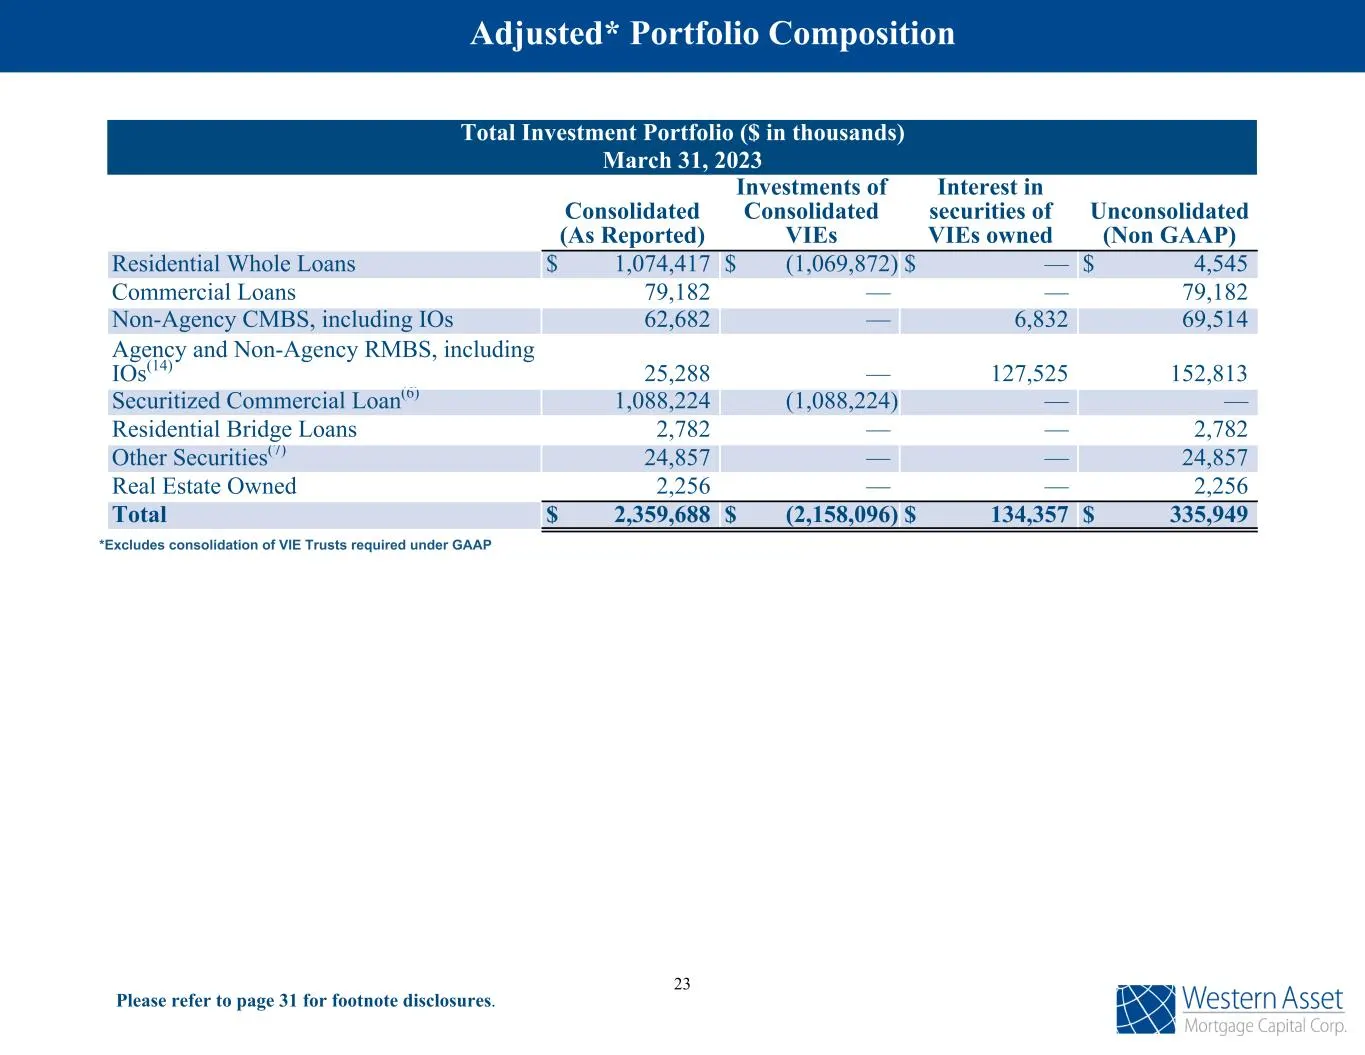
Slide 24: Total Investment Portfolio
*Excludes consolidation of VIE Trusts required under GAAP Please refer to page 31 for footnote disclosures. Total Investment Portfolio ($ in thousands) March 31, 2023 Consolidated (As Reported) Investments of Consolidated VIEs Interest in securities of VIEs owned Unconsolidated (Non GAAP) Residentia
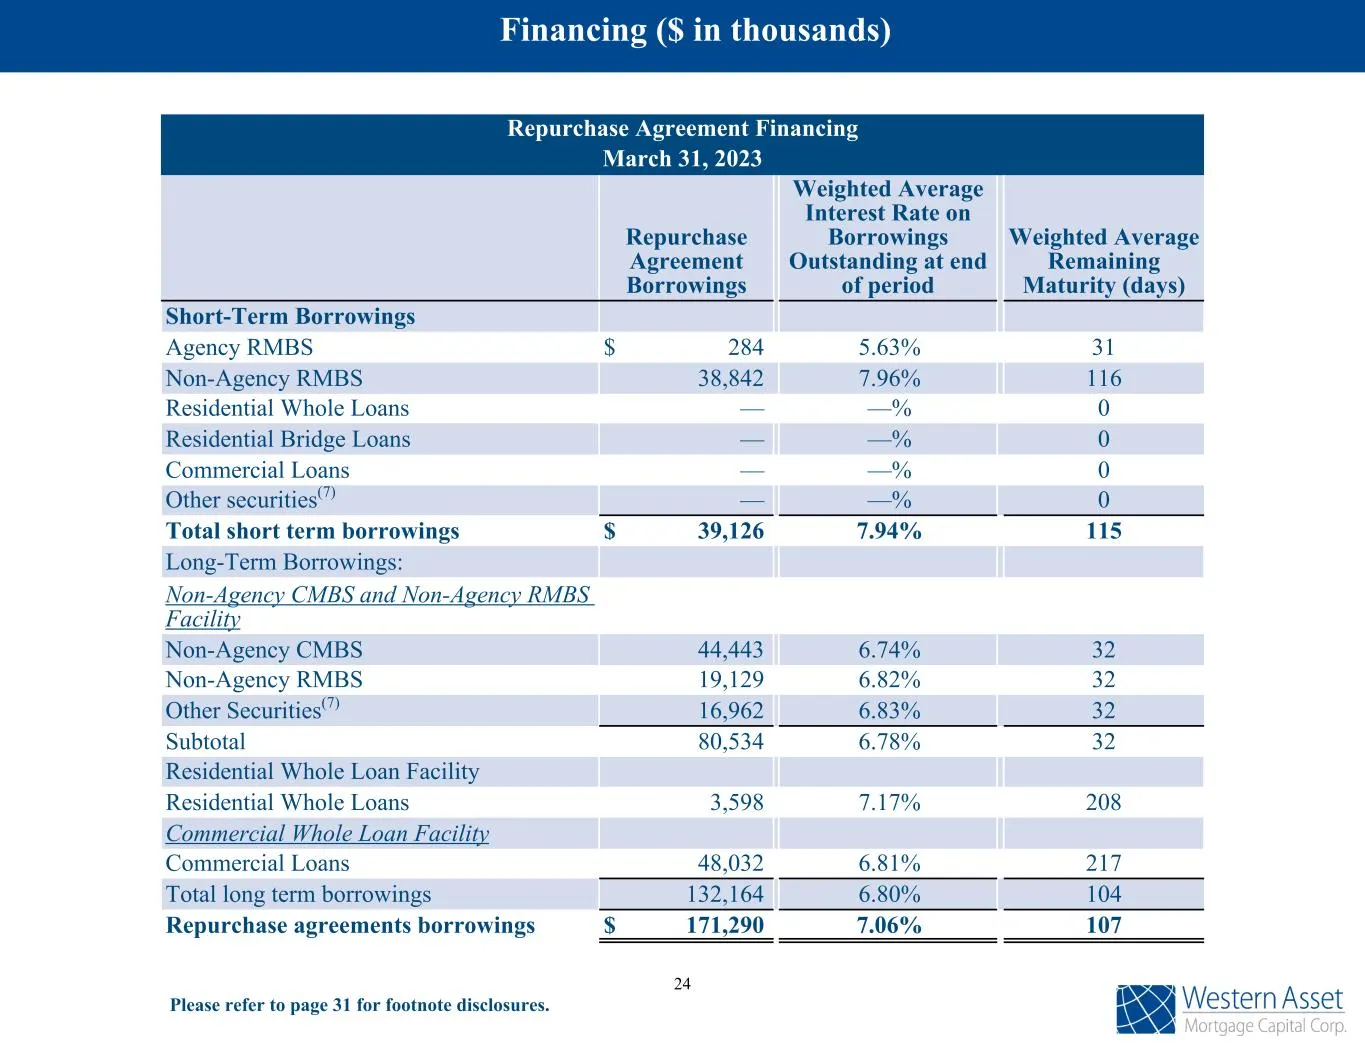
Slide 25: Repurchase Agreement Financing
Repurchase Agreement Financing March 31, 2023 Repurchase Agreement Borrowings Weighted Average Interest Rate on Borrowings Outstanding at end of period Weighted Average Remaining Maturity (days) Short-Term Borrowings Agency RMBS $ 284 5.63% 31 Non-Agency RMBS 38,842 7.96% 116 Residential Whole Loans
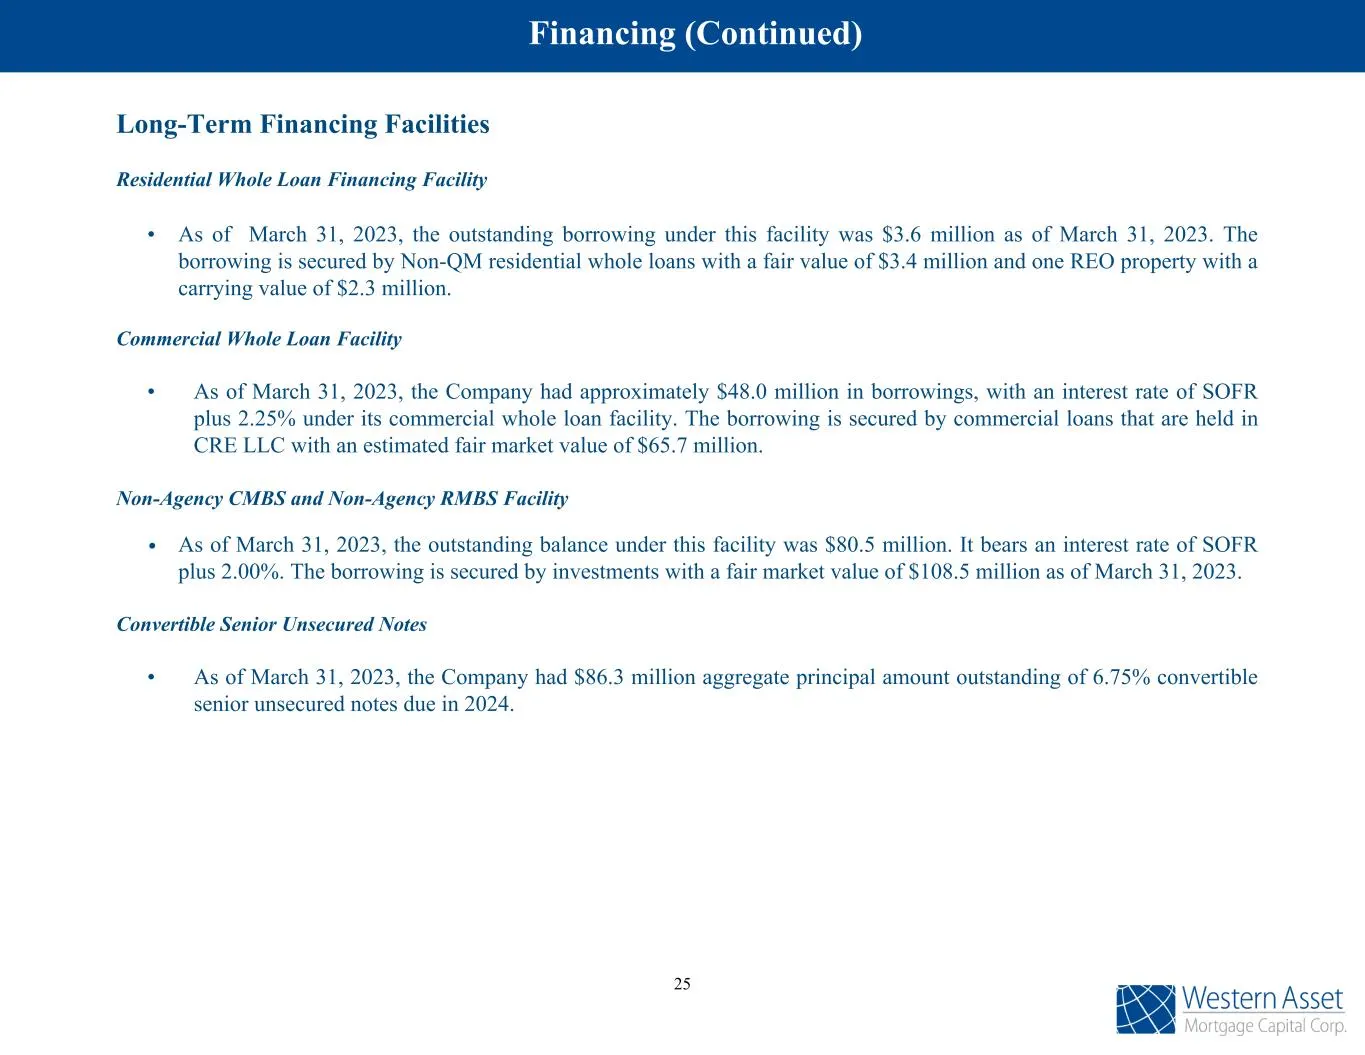
Slide 26: Long-Term Financing Facilities
Long-Term Financing Facilities Residential Whole Loan Financing Facility • As of March 31, 2023, the outstanding borrowing under this facility was $3.6 million as of March 31, 2023. The borrowing is secured by Non-QM residential whole loans with a fair value of $3.4 million and one REO property with
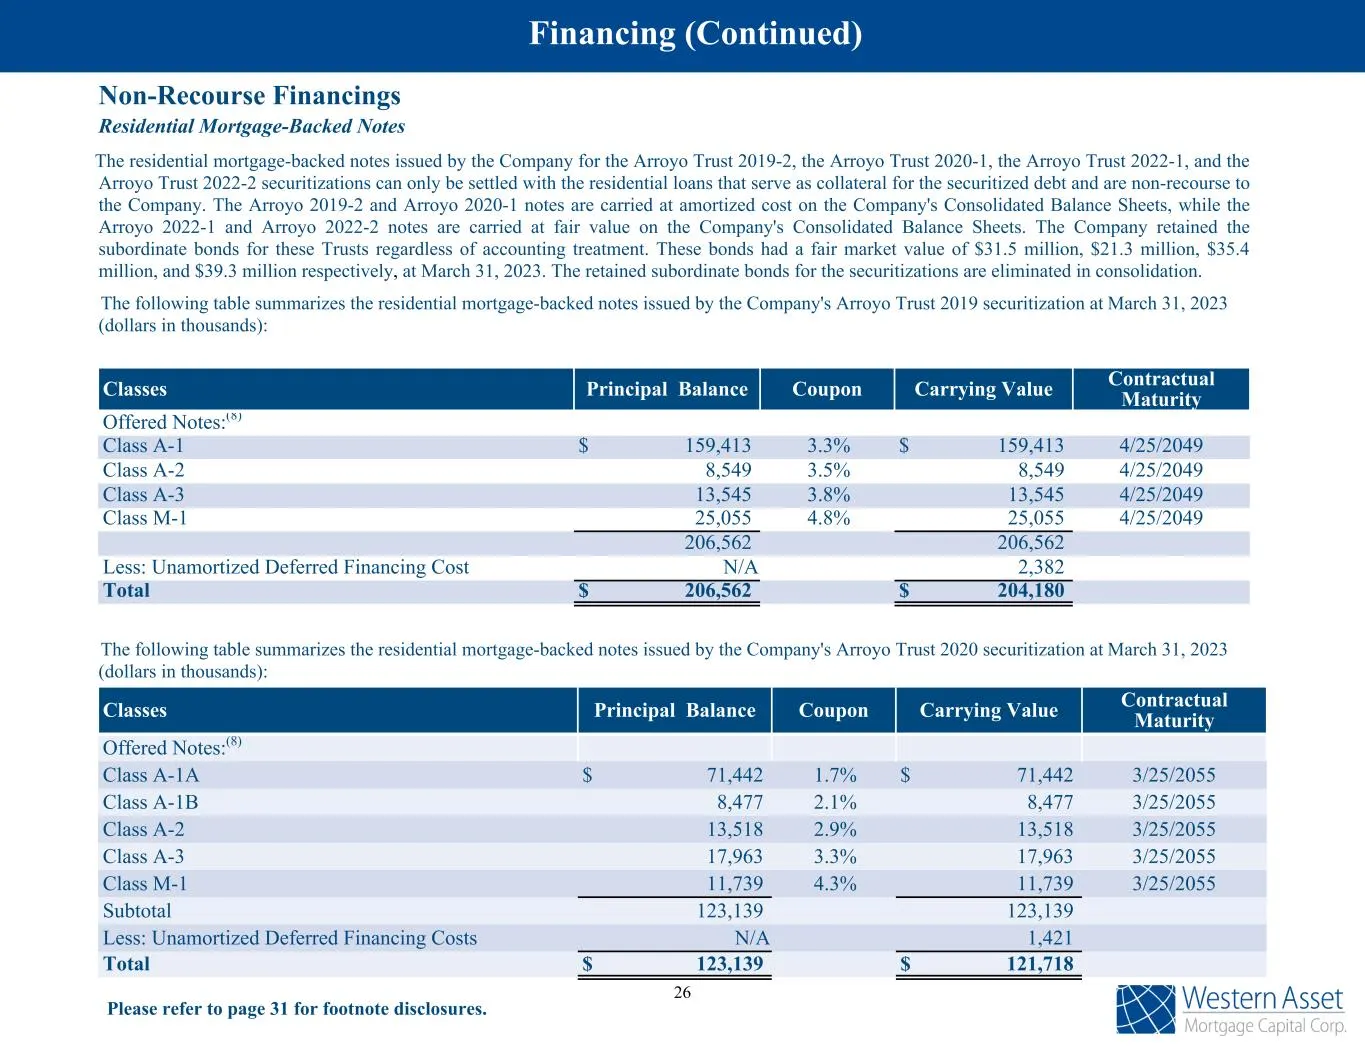
Slide 27: Non-Recourse Financings
Non-Recourse Financings Residential Mortgage-Backed Notes The residential mortgage-backed notes issued by the Company for the Arroyo Trust 2019-2, the Arroyo Trust 2020-1, the Arroyo Trust 2022-1, and the Arroyo Trust 2022-2 securitizations can only be settled with the residential loans that serve a
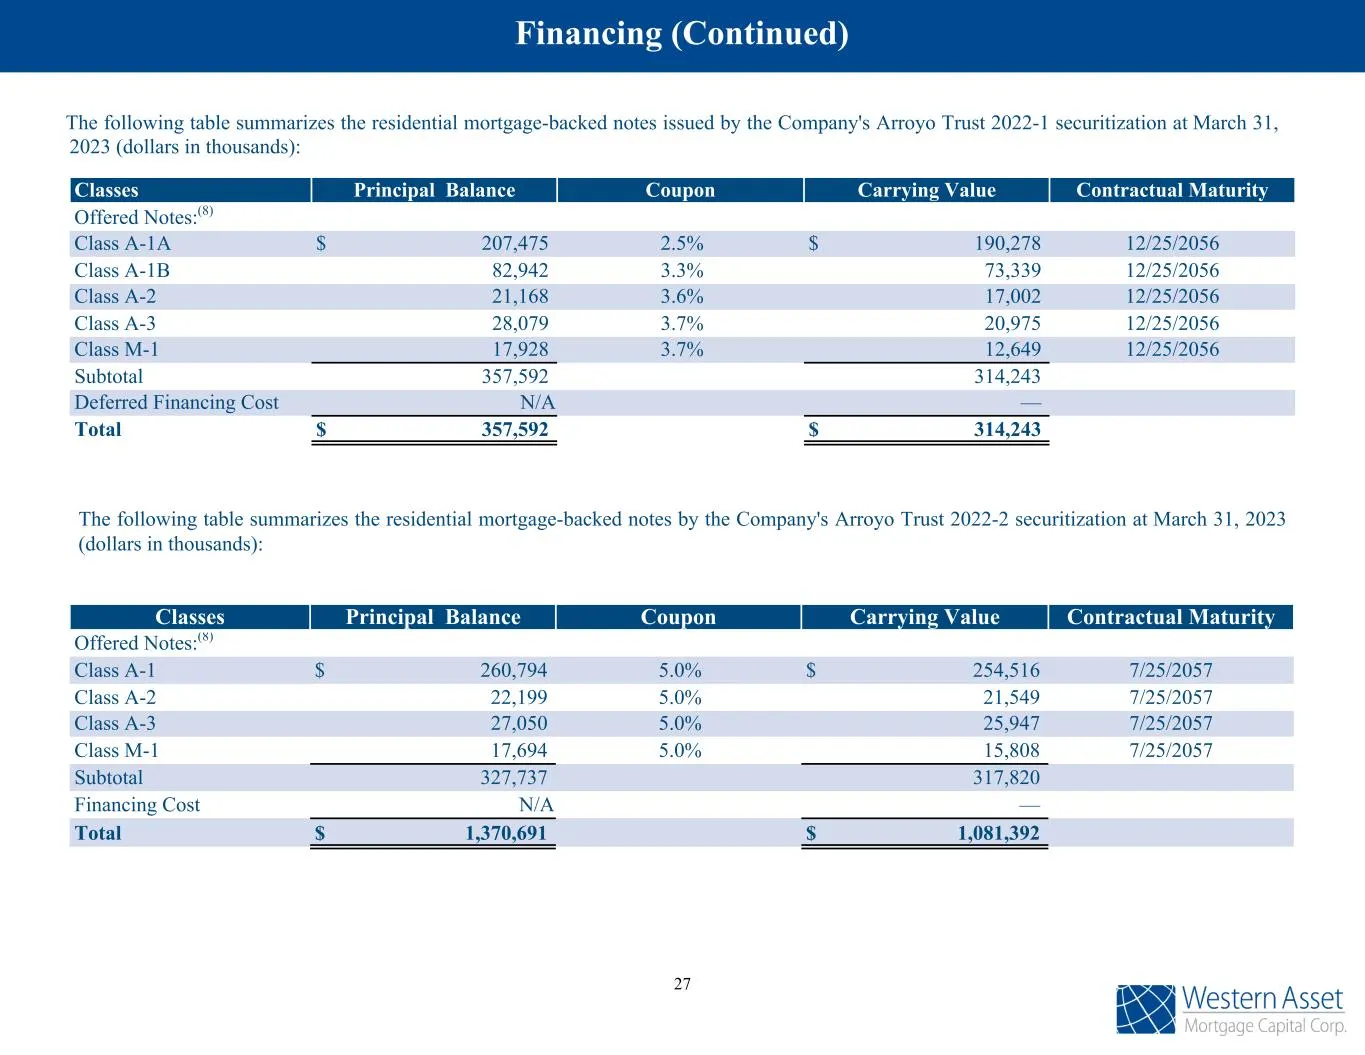
Slide 28: Financing (Continued)
Financing (Continued) The following table summarizes the residential mortgage-backed notes issued by the Company's Arroyo Trust 2022-1 securitization at March 31, 2023 (dollars in thousands): Classes Principal Balance Coupon Carrying Value Contractual Maturity Offered Notes:(8) Class A-1A $ 207,475
Slide 29: Financing (Continued) Commercial Mortgage backed Notes
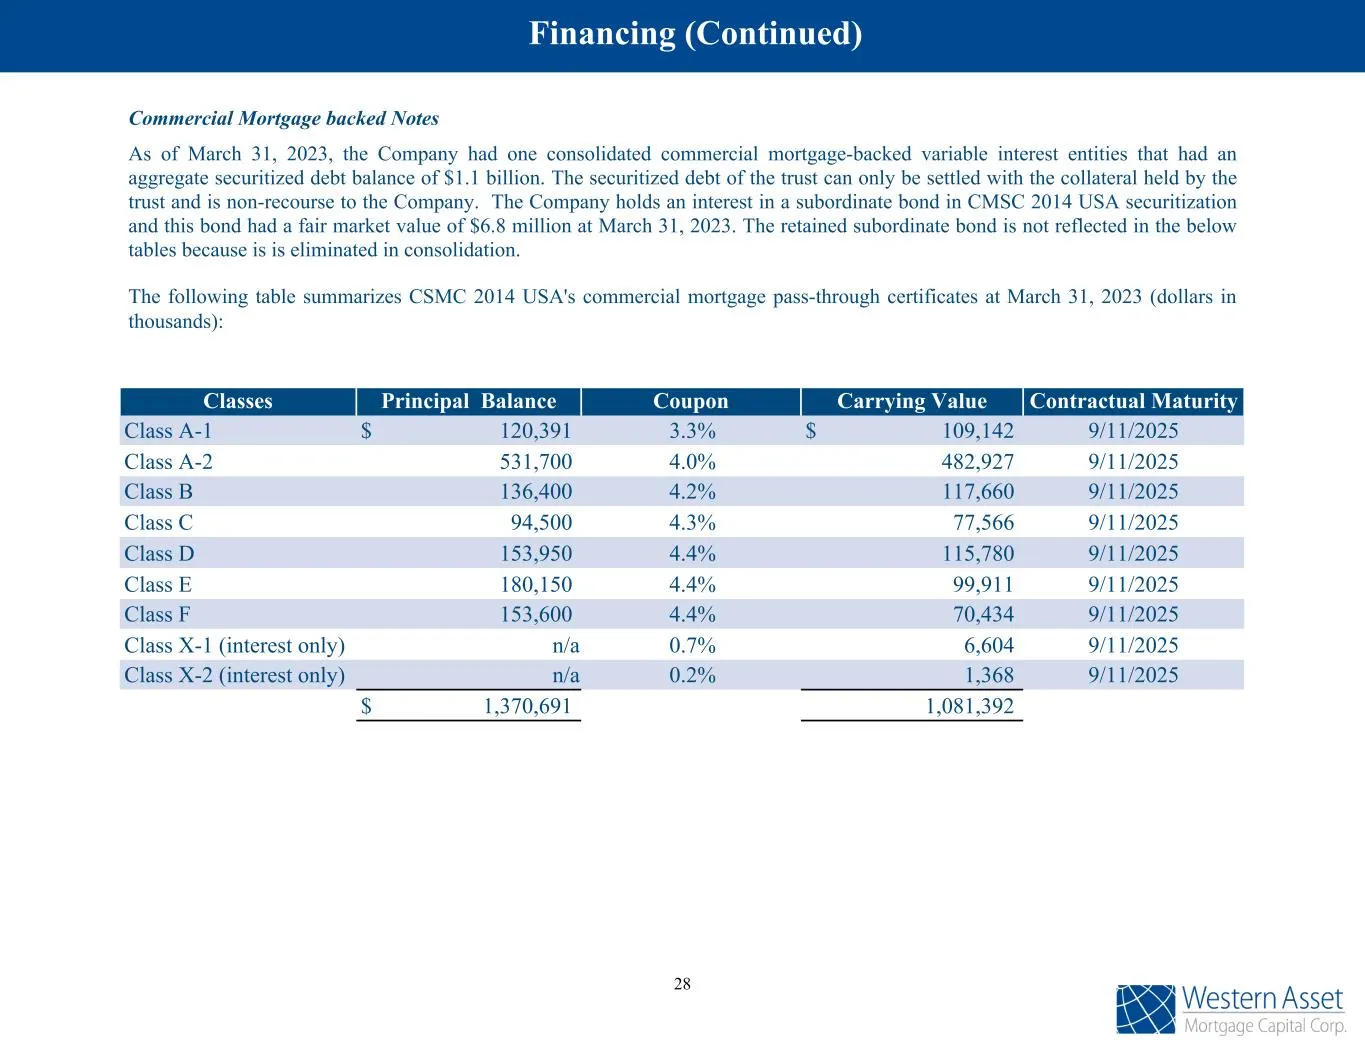
Financing (Continued) Commercial Mortgage backed Notes As of March 31, 2023, the Company had one consolidated commercial mortgage-backed variable interest entities that had an aggregate securitized debt balance of $1.1 billion. The securitized debt of the trust can only be settled with the collatera
Slide 30: Subsequent Events
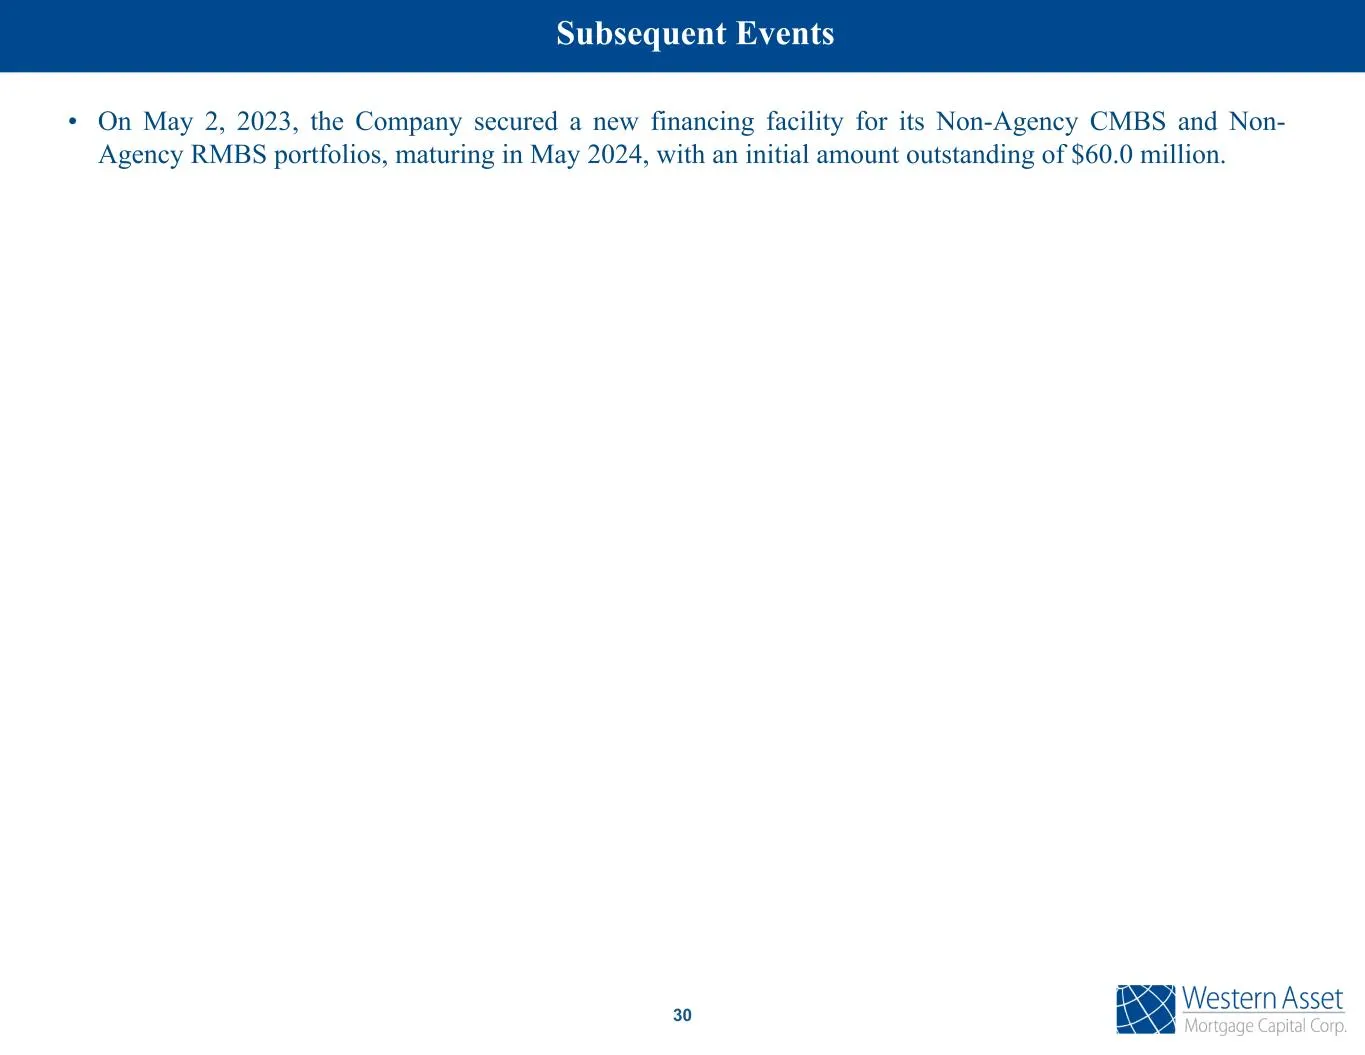
Subsequent Events • On May 2, 2023, the Company secured a new financing facility for its Non-Agency CMBS and Non- Agency RMBS portfolios, maturing in May 2024, with an initial amount outstanding of $60.0 million. 30
Slide 31: Footnote disclosures
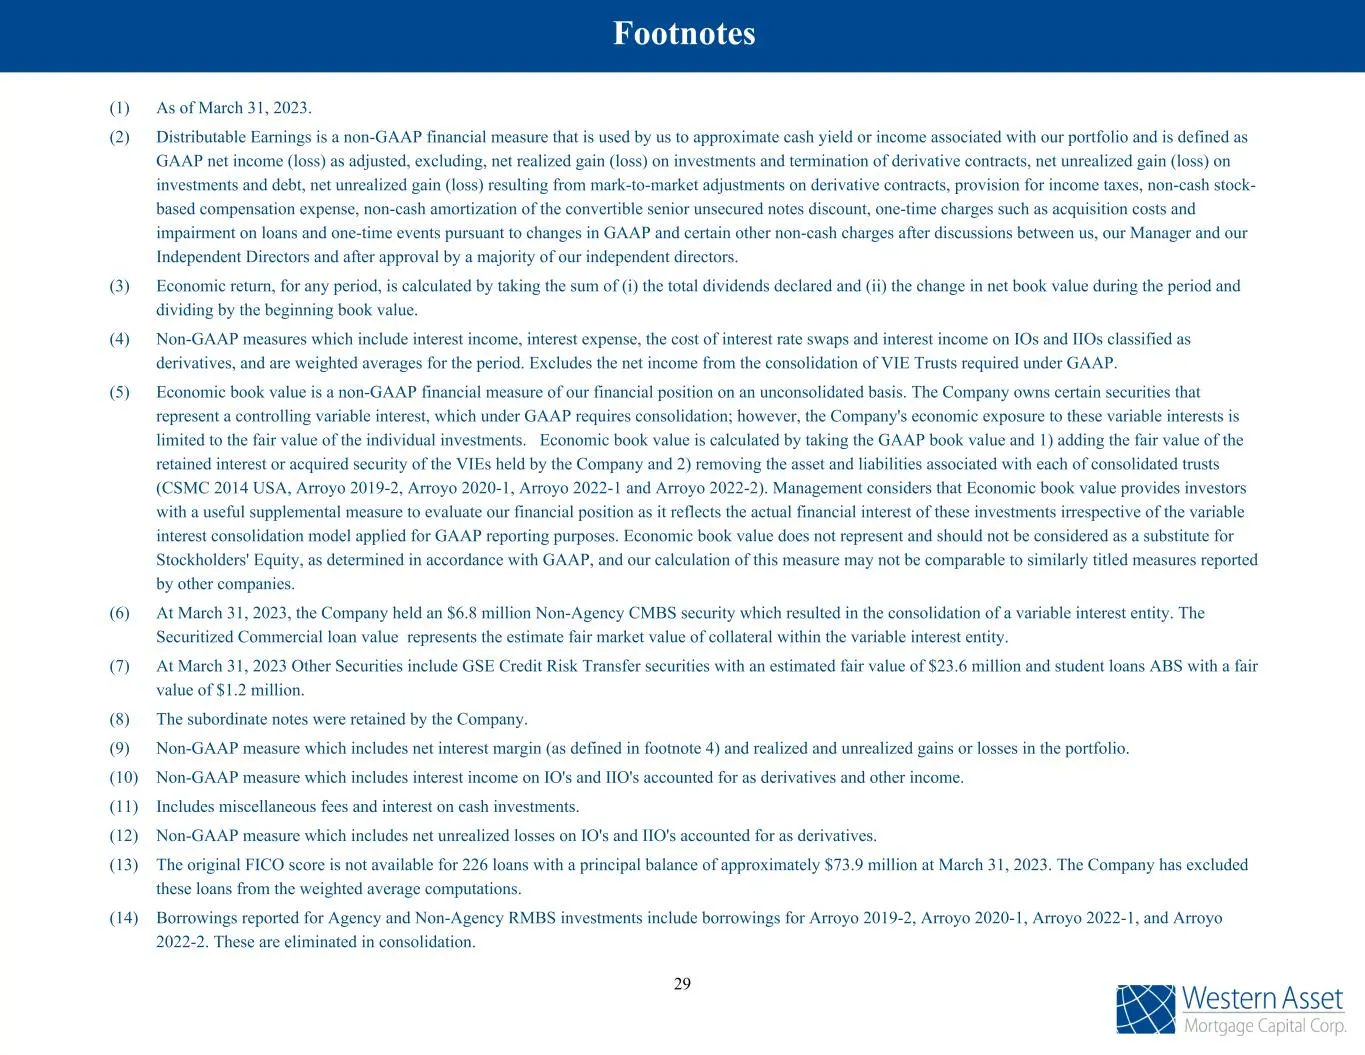
(1) As of March 31, 2023. (2) Distributable Earnings is a non-GAAP financial measure that is used by us to approximate cash yield or income associated with our portfolio and is defined as GAAP net income (loss) as adjusted, excluding, net realized gain (loss) on investments and termination of deriva
Slide 32: Book Value Roll Forward
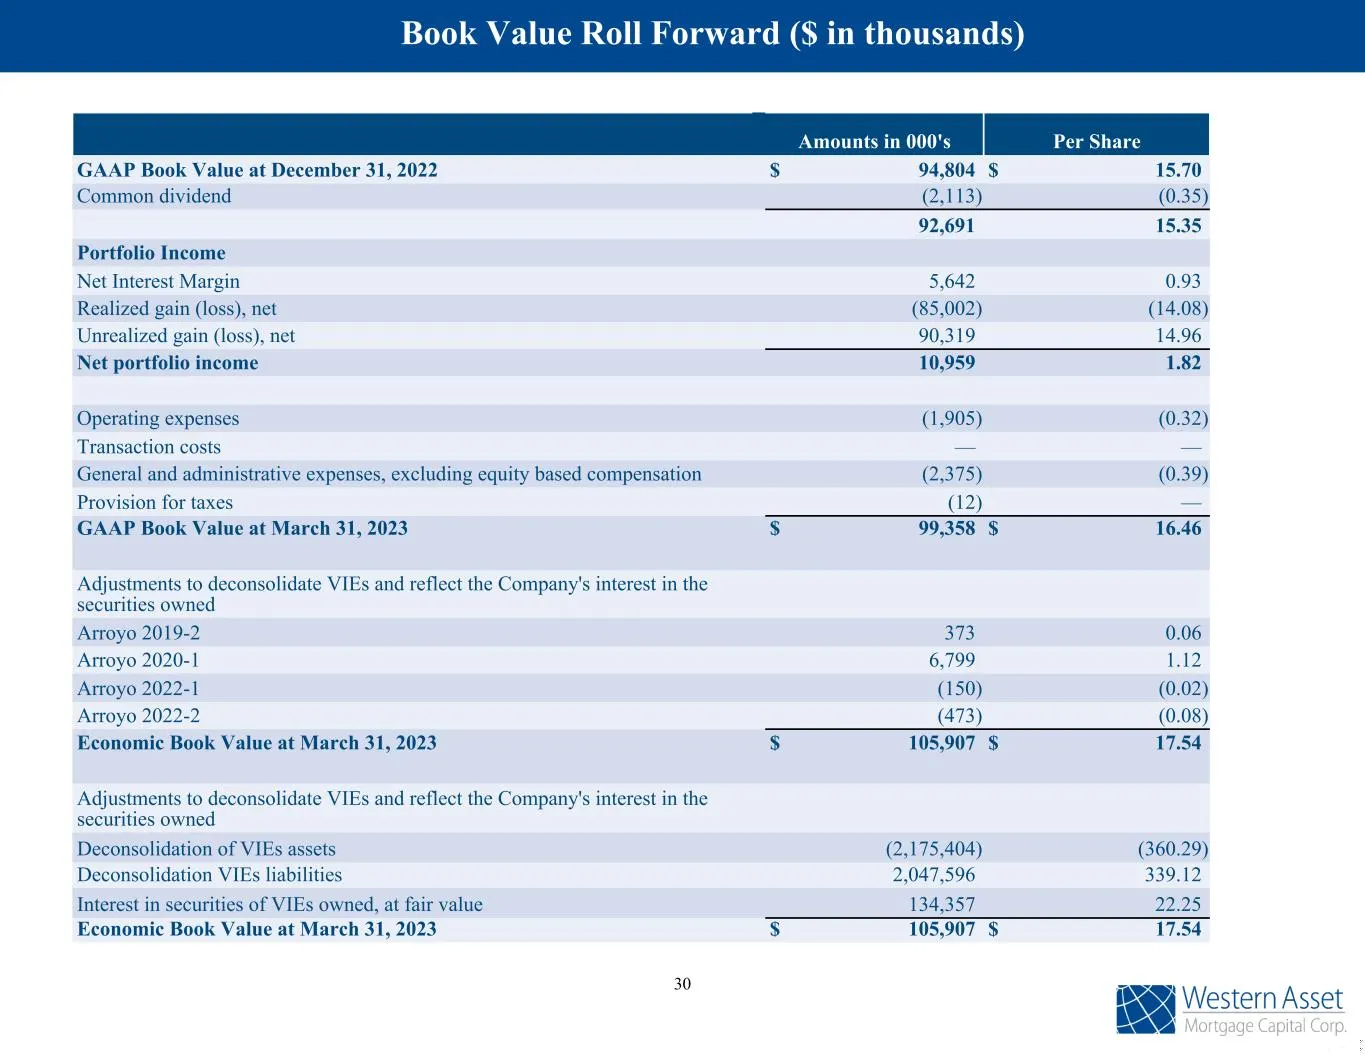
Book Value Roll Forward ($ in thousands) Amounts in 000's Per Share GAAP Book Value at December 31, 2022 $ 94,804 $ 15.70 Common dividend (2,113) (0.35) 92,691 15.35 Portfolio Income Net Interest Margin 5,642 0.93 Realized gain (loss), net (85,002) (14.08) Unrealized gain (loss), net 90,319 14.96 Ne
Slide 33: Contact Information
Western Asset Mortgage Capital Corporation c/o Financial Profiles, Inc. 11601 Wilshire Blvd., Suite 1920 Los Angeles, CA 90025 www.westernassetmcc.com Investor Relations Contact: Larry Clark Tel: (310) 622-8223 [email protected] Contact Information 31
Source: SEC EDGAR · 8-K filed May 4, 2023
More decks from Western Asset Mortgage Capital
 Merger or Acquisition (August 2023)9 slides · Aug 9, 2023
 Q2 2023 Earnings Presentation32 slides · Aug 8, 2023
 Merger or Acquisition (July 2023)9 slides · Jul 13, 2023
 Merger or Acquisition (June 2023)16 slides · Jun 28, 2023
 Q4 2022 Earnings Presentation34 slides · Mar 2, 2023
 Q3 2022 Earnings Presentation34 slides · Nov 4, 2022