Omega Protein — Investor Presentation (September 2014)
25 slides from Omega Protein's investor presentation, Sep 17, 2014
Slide 1: Investor Presentation September 2014
OMEGA Qe PROTEIN’ Healthy Products for a Healthy World® Investor Presentation September 2014 ADT yr
Slide 2: Forward Looking Statements
Forward Looking Statements The statements contained in this presentation that are not historical facts are forward-looking statements that involve number of risks and uncertainties. Forward-looking information may be based on projections, predictions and estimates. Some statements in this presentati
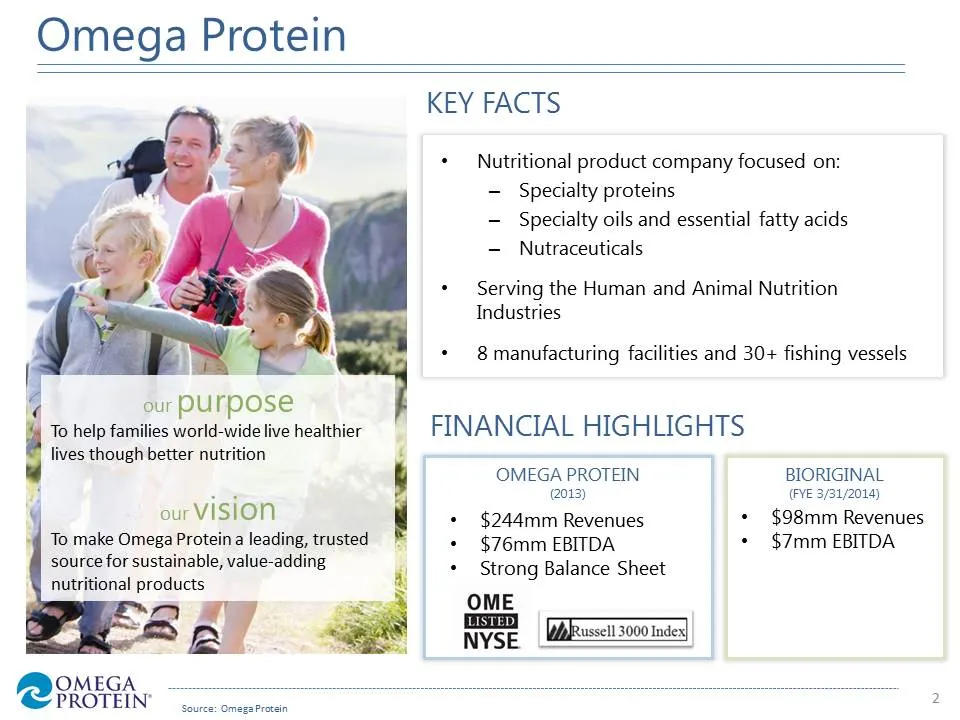
Slide 3: Omega Protein Key Facts
Omega Protein KEY FACTS + Nutritional product company focused on: — Specialty proteins - Specialty oils and essential fatty acids — Nutraceuticals * — Serving the Human and Animal Nutrition Industries ’ + 8 manufacturing facilities and 30+ fishing vessels our PUrPOsSe To help families world-wide liv
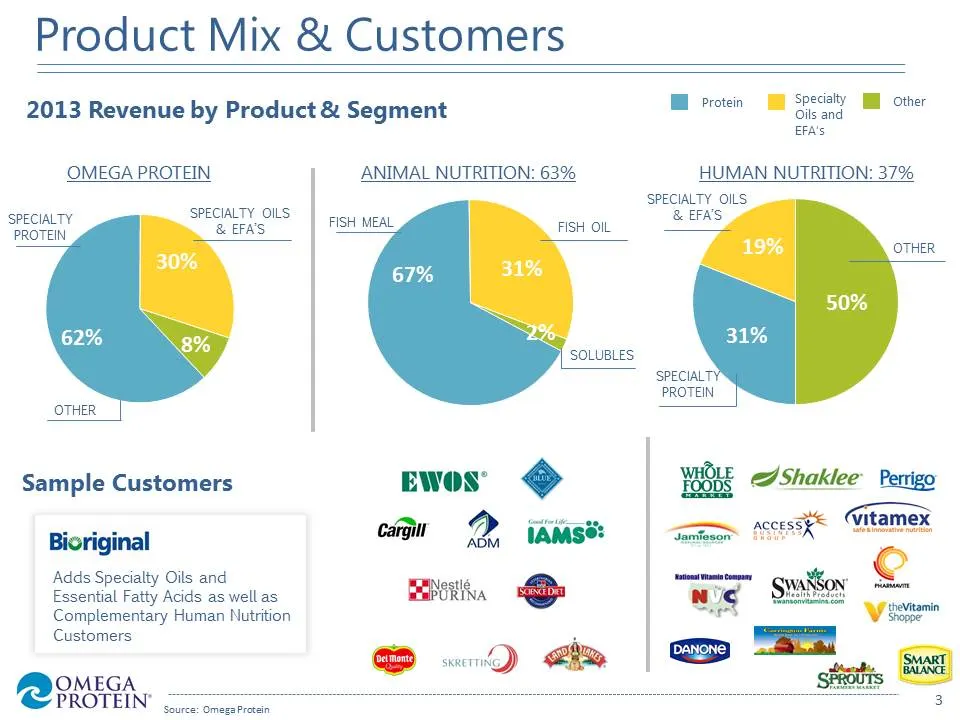
Slide 4: Product Mix & Customers
Product Mix & Customers 2013 Revenue by Product & Segment Tl Protein Specialty other Oils and EFA's OMEGA PROTEIN ANIMAL NUTRITION: 63% HUMAN NUTRITION: 37% ‘SPECIALTY. SPECIALTY OILS SPECIALTY OILS. & EFAS i FISH MEAL PROTEIN SEES FISH OIL SOLUBLES SPECIAL PROTEIN Sample Customers EWwos’ BE Shaklee
Slide 5: Locations and Distribution
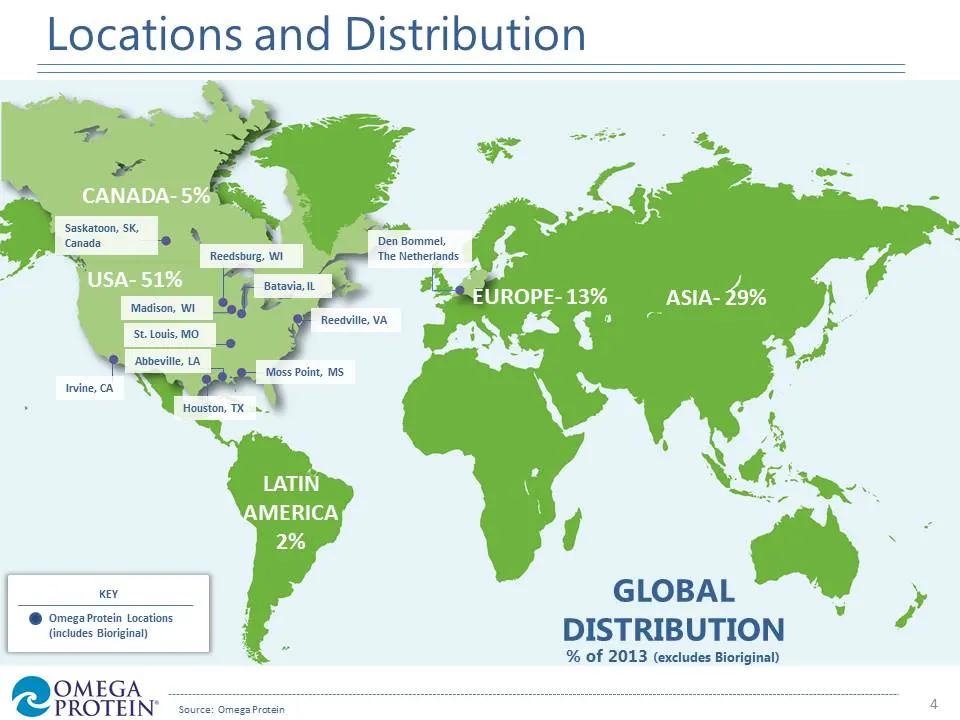
Locations and Distribution USA- 51% " enn 0 GLOBAL , DISTRIBUTION % of 2013 (excludes Bioriginal) OMEGA © PROTEIN
Slide 6: Strategic Business Model
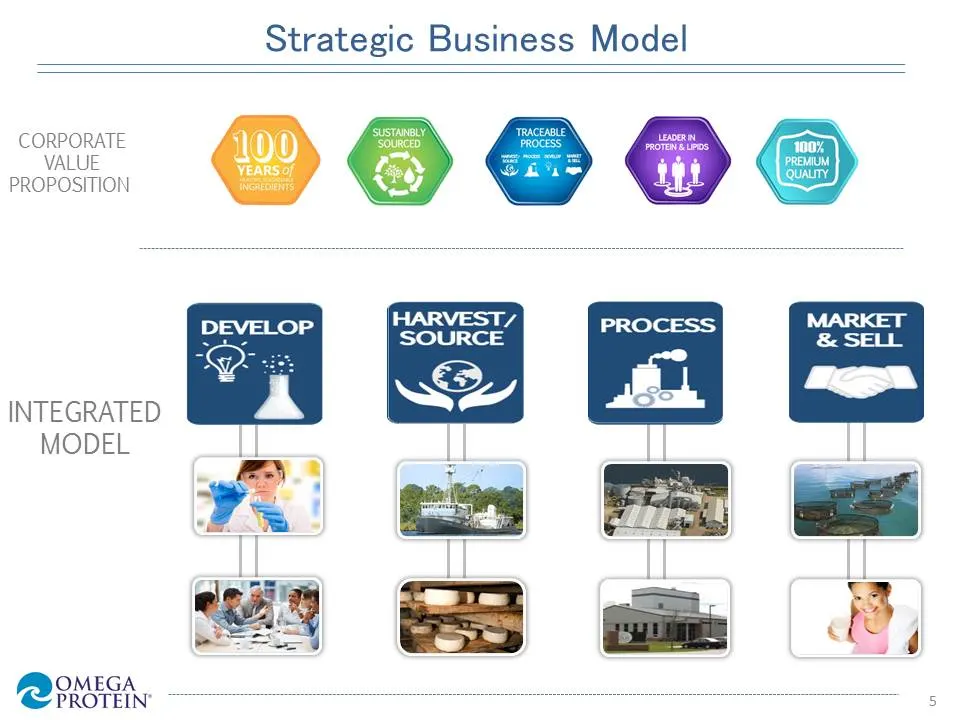
Strategic Business Model CORPORATE VALUE PROPOSITION INTEGRATED MODEL
Slide 7: Strategic Growth Objectives
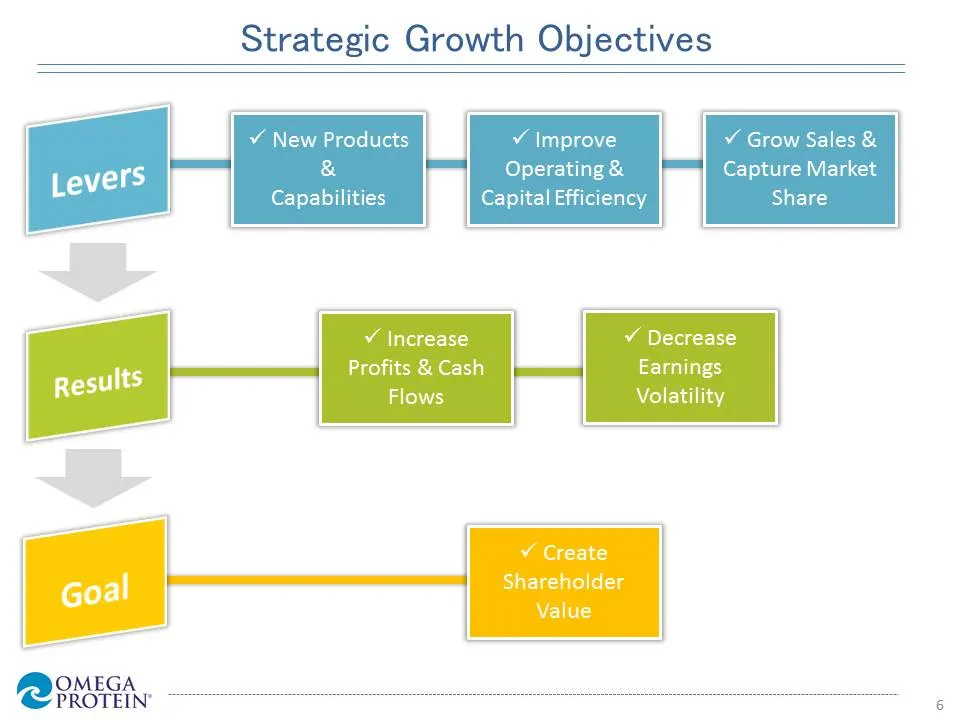
Strategic Growth Objectives ¥ New Products v Improve ¥ Grow Sales & & Operating & Capture Market Capabilities Capital Efficiency Share Y Increase v Decrease Profits & Cash Earnings Volatility ¥ Create Shareholder Value
Slide 8: Track Record of Growth
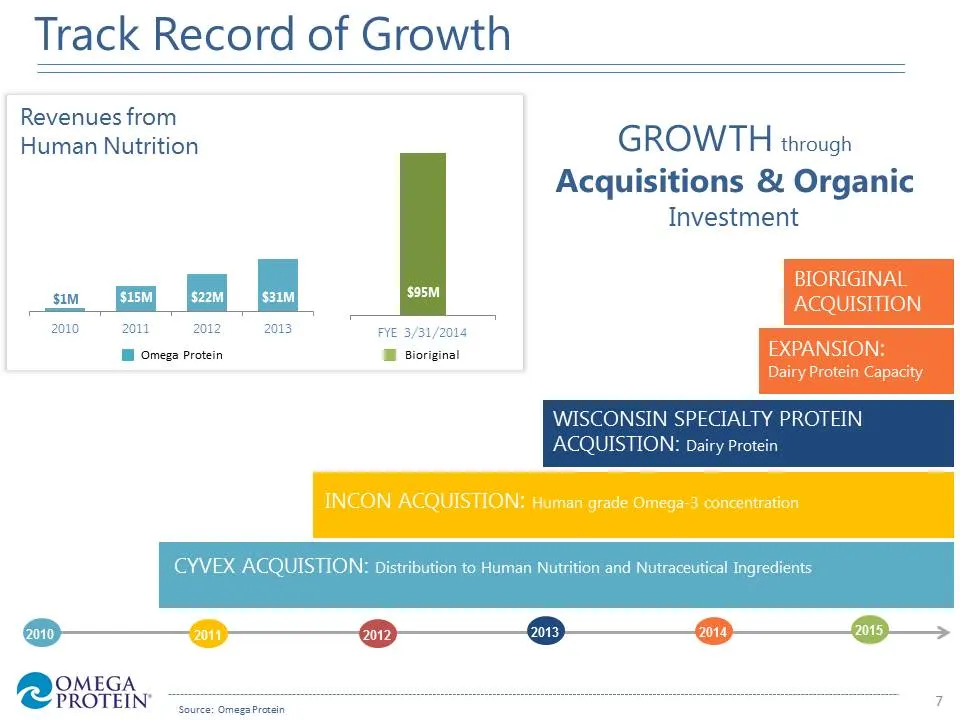
Track Record of Growth Revenues from Human Nutrition GROWTH through Acquisitions & Organic Investment 2010 2011 2012 2013 I Omega Protein Y PROTEIN

Slide 9: Animal Nutrition
FOOMEGA PROTEIN’ Animal Nutrition
Slide 10: Animal Nutrition Business Drivers
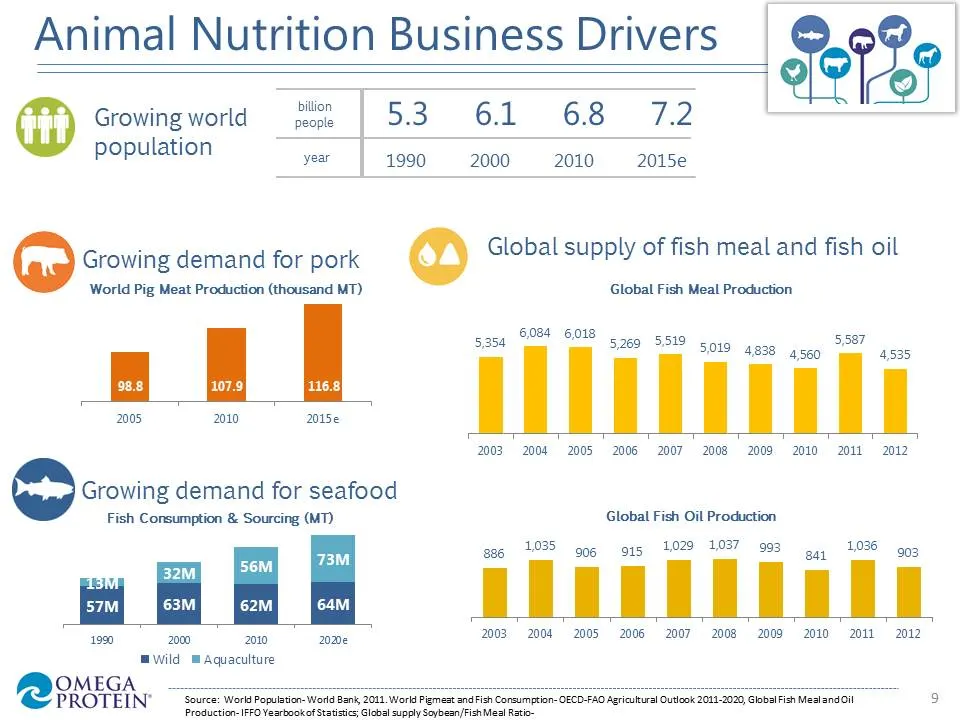
Animal Nutrition Business Drivers Si2e @ Growing world prope 53 61 68 7.2 population year 1990 2000 2010 2015e ® Growin demand Hepa @ Global supply of fish meal and fish oil World Pig Meat Production (thousand MT) Global Fish Meal Production 6084 6018 Say 5354 5.019 4838 4.560 4,535 5,269 5519 98.8
Slide 11: Animal Nutrition
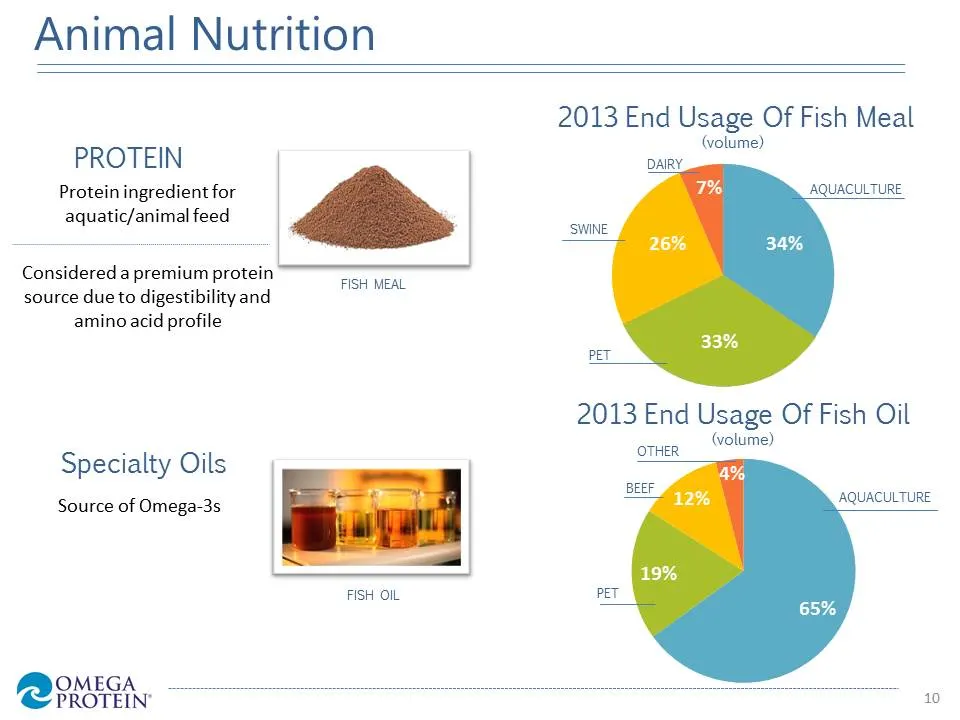
Animal Nutrition PROTEIN Protein ingredient for aquatic/animal feed Considered a premium protein source due to digestibility and aminoacid profile FISH MEAL Specialty Oils Source of Omega-3s FISH OIL OMEGA EMG. 2013 End Usage Of Fish Meal (volume) DAIRY, AQUACULTURE SWINE 2013 End Usage Of Fish Oil

Slide 12: Human Nutrition
wu iii ii me . ) nutegrity Human Nutrition Bisriginal
Slide 13: Human Nutrition Business Drivers
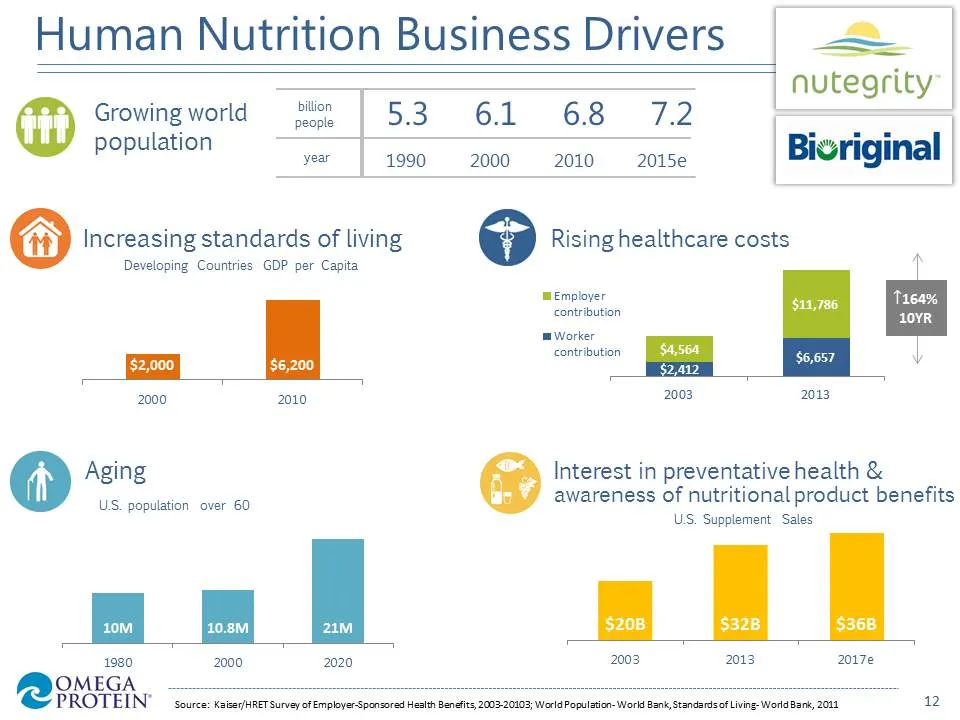
Human Nutrition Business Drivers _— nutegrity Growingworld hr | 530661 C68 O72 population Bivriginal year 1990 2000 2010 2015e 3) Increasing standards of living GP Bischeatthcare costs Developing Countries GDP per Capita mEmployer qiee contribution stove Worker contribution S00 00 2003 2013 Aging In
Slide 14: Human Nutrition
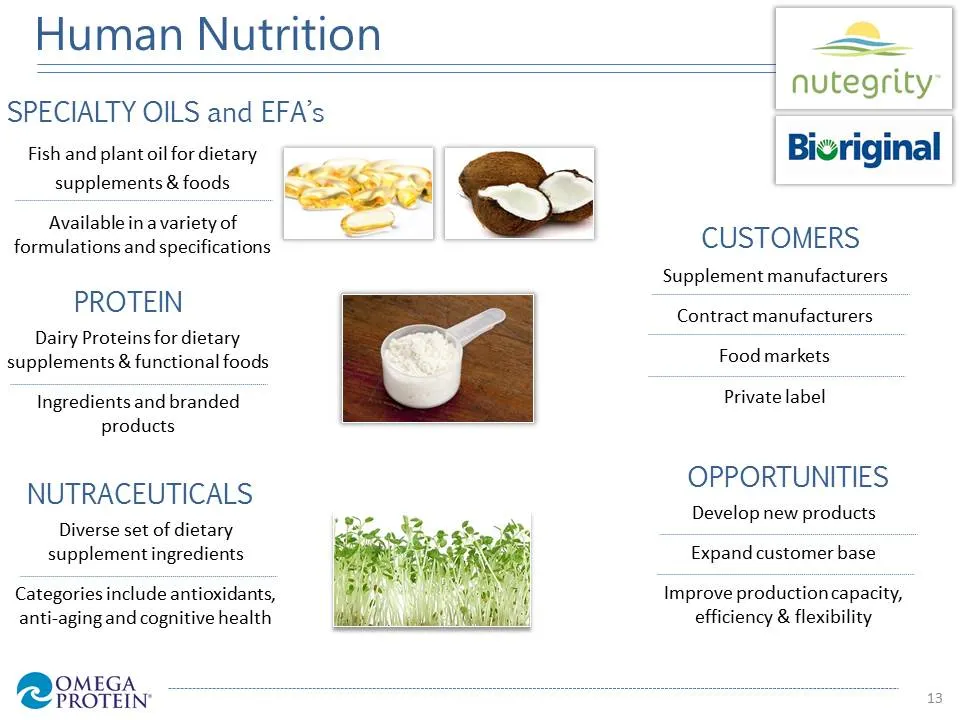
Human Nutrition _— nutegrity SPECIALTY OILS and EFA’s Fish and plant oil for dietary Bivriginal supplements & foods Available ina variety of formulations and specifications CUSTOMERS Supplement manufacturers PROTEIN Dairy Proteins for dietary supplements & functional foods Contract manufacturers Foo
Slide 15: Financial Highlights
OMEGA ROO MEOK
Slide 16: Income Statement Highlights
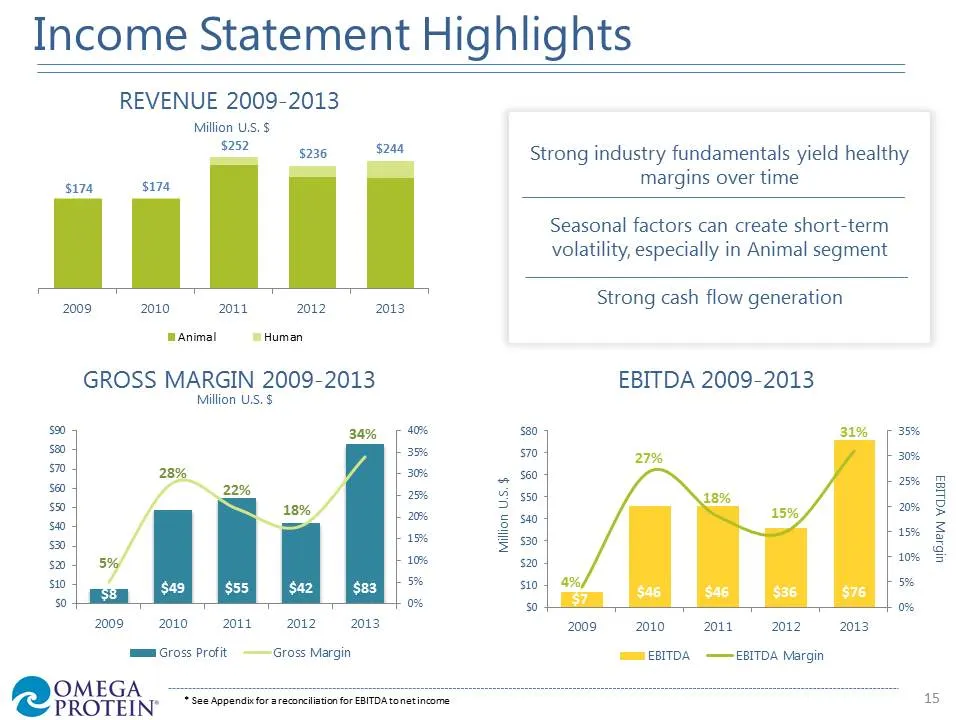
Income Statement Highlights REVENUE 2009-2013 Million US. $ a $236 $244 Strong industry fundamentals yield healthy ron atk margins over time Seasonal factors can create short-term volatility, especially in Animal segment 009 oo10 coi coi coi Strong cash flow generation Animal Human GROSS MARGIN 2009
Slide 17: Balance Sheet Highlights
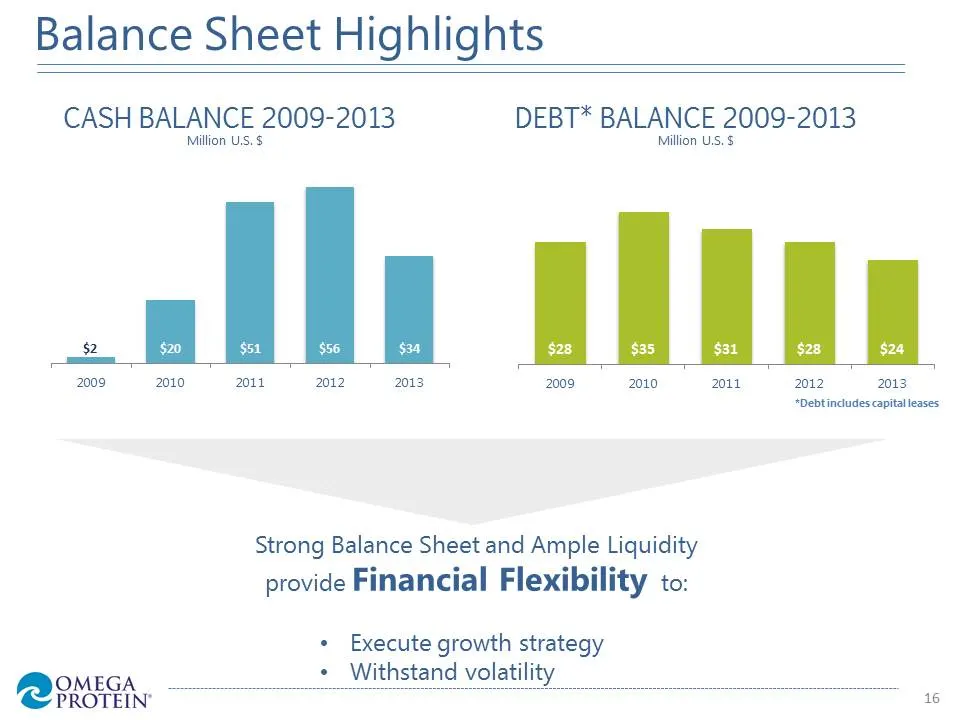
Balance Sheet Highlights CASH BALANCE 2009-2013 DEBT* BALANCE 2009-2013 Million US. $ Million US. $ $2 2009 2010 2011 2012 2013 2009 2010 2011 2012 2013 “*Debtincludes capital leases Strong Balance Sheet and Ample Liquidity provide Financial Flexibility to: * Execute growth strategy OMEGA ROMEGK 16
Slide 18: Investment Highlights
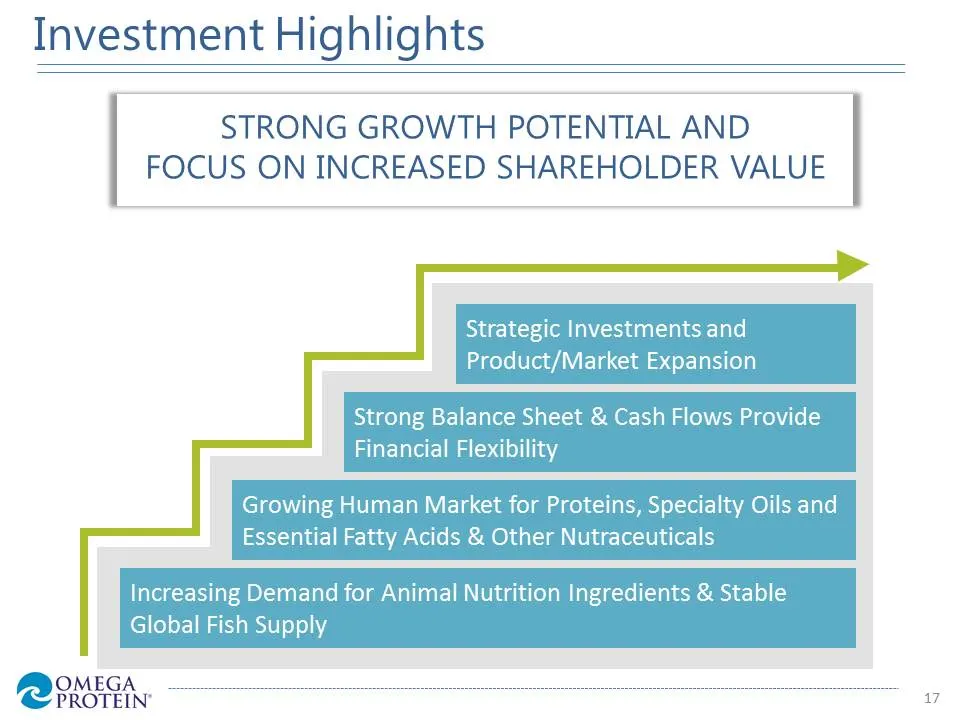
Investment Highlights STRONG GROWTH POTENTIAL AND FOCUS ON INCREASED SHAREHOLDER VALUE Strategic Investments and Product/Market Expansion Strong Balance Sheet & Cash Flows Provide Financial Flexibility Growing Human Market for Proteins, Specialty Oils and Essential Fatty Acids & Other Nutraceuticals
Slide 19: Appendix
OMEGA REMESh
Slide 20: Omega Protein Gross Profit Drivers
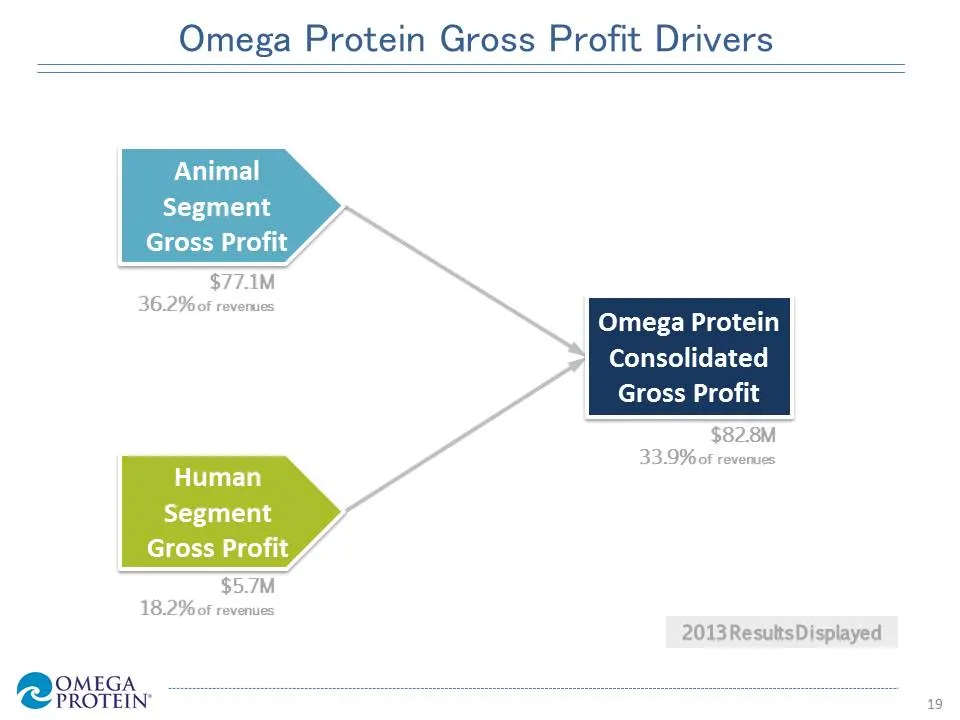
Omega Protein Gross Profit Drivers Animal Segment > Gross Profit 4 $77.1M 36.2% of reverues 5 Omega Protein Consolidated Gross Profit $82.8M 33.9% of reverues Human Segment Gross Profit 4 $5.7M 18.2% of revenues 2013 ResultsDisplayed OMEGA EMG.
Slide 21: Animal Nutrition Gross Profit Drivers
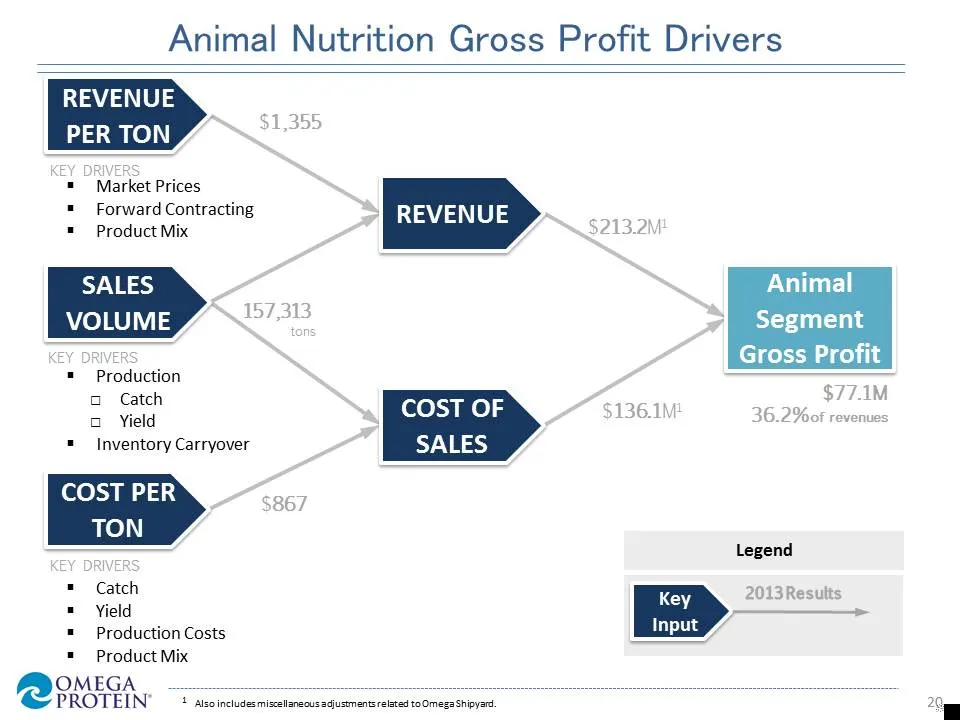
Animal Nutrition Gross Profit Drivers REVENUE PER TON $1,455 = Forward Contracting 7 REVENUE = Product Mix SALES Animal VOLUME pias | Segment $213.2M KE S Gross Profit = Production = 7 Catch estita $77.1M 5 Held COST OF $136.1M 36.2% oF r _ = Inventory Carryover SALES ¥ COST PER $867 TON Legend = Ca
Slide 22: Human Nutrition Gross Profit Drivers
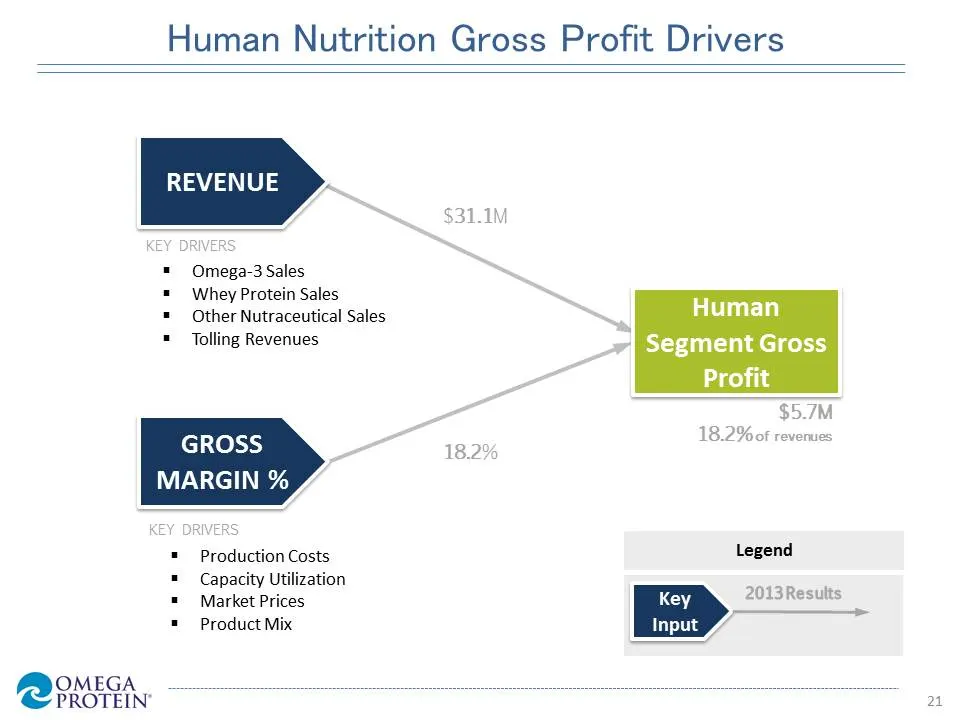
Human Nutrition Gross Profit Drivers REVENUE Omega-3 Sales Whey Protein Sales Other Nutraceutical Sales Tolling Revenues GROSS MARGIN % Production Costs Capacity Utilization Market Prices Product Mix $31.1M 18.2% Human Segment Gross Profit
Slide 23: OME: Key Historical Drivers
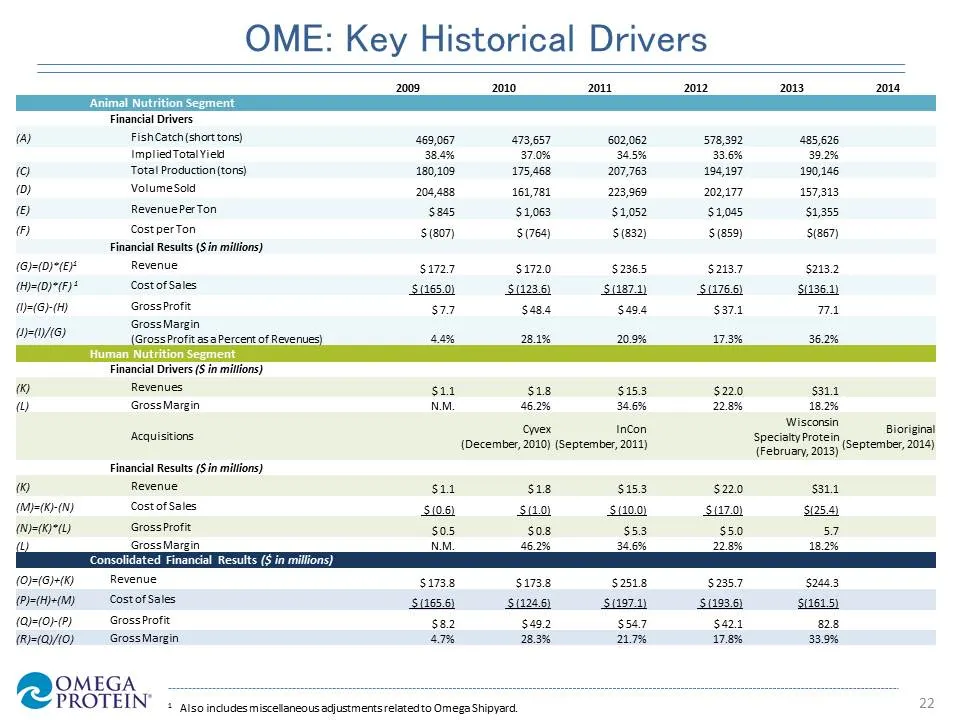
OME: Key Historical Drivers 2009 2010 2011 2012 2013 2014 Financial Drivers ‘a FishCatch (short tons) 469,067 473,857 602,062 578,392 485,626 Implied Total View 38.4% 37.0% 345% 33.6% 38.2% 0 Total Production (tons) 180,109 175,468 207,763 194,197 190,146 (0) Volumesold 204,488 361781 223,969 202,17
Slide 24: Regulation G Reconciliation
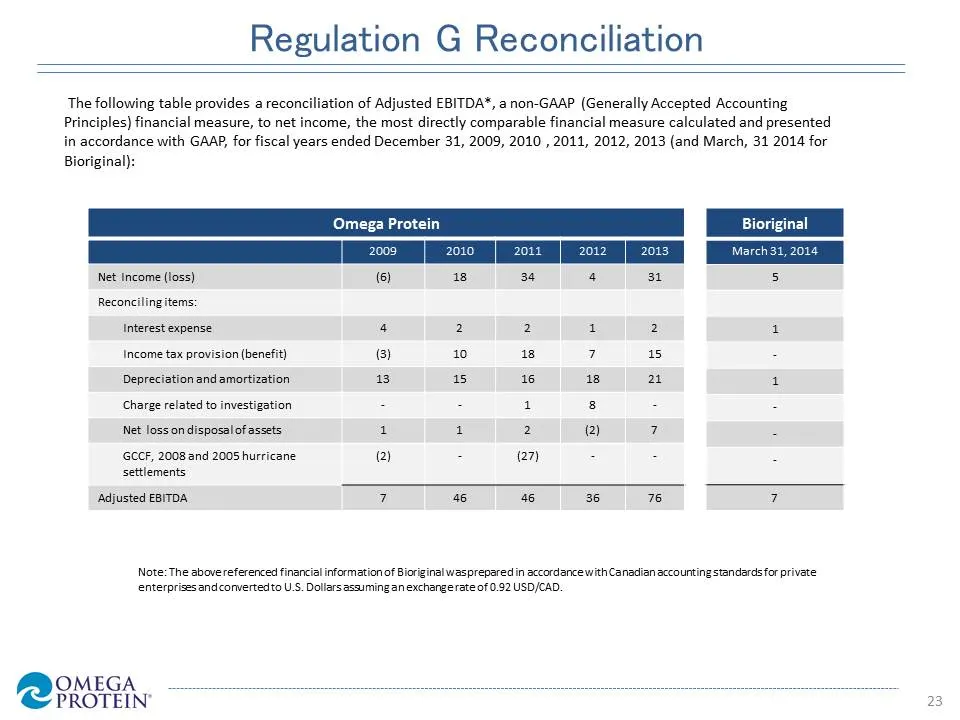
Regulation G Reconciliation The following table provides a reconciliation of Adjusted EBITDA*, a non-GAAP (Generally Accepted Accounting Principles) financial measure, to net income, the most directly comparable financial measure calculated and presented in accordance with GAAP, for fiscal years end
Slide 25: Regulation G Reconciliation
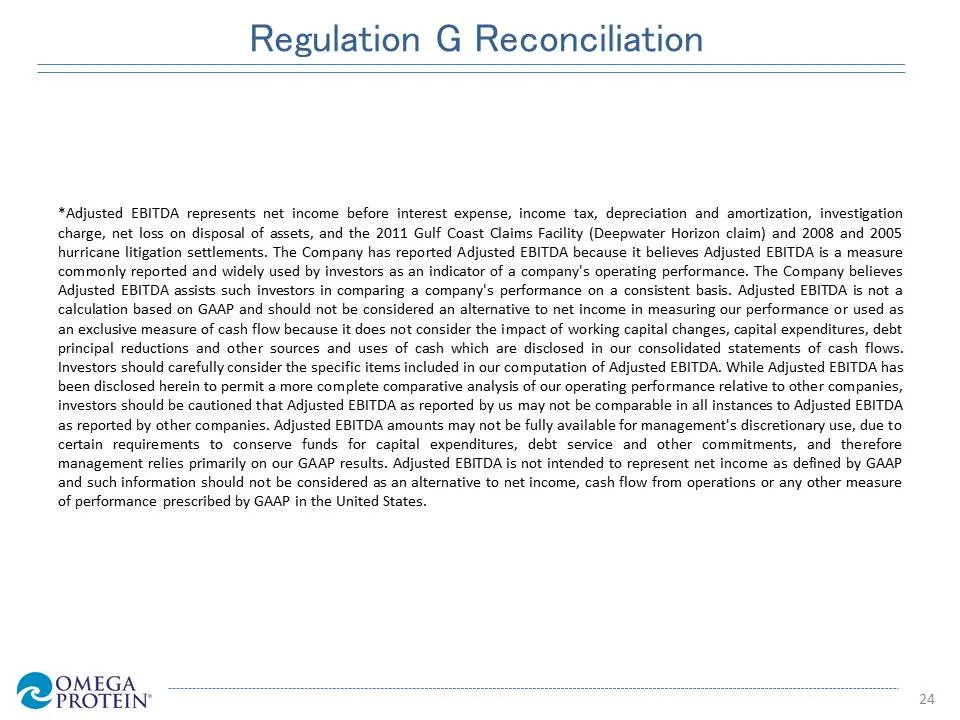
Regulation G Reconciliation *Adjusted EBITDA represents net income before interest expense, income tax, depreciation and amortization, investigation charge, net loss on disposal of assets, and the 2011 Gulf Coast Claims Facility (Deepwater Horizon claim) and 2008 and 2005 hurricane litigation settle
Source: SEC EDGAR · 8-K filed Sep 17, 2014
More decks from Omega Protein Corp
 Investor Presentation (May 2017)27 slides · May 17, 2017
 Investor Presentation (January 2017)27 slides · Jan 11, 2017
 Proxy Contest (June 2016)48 slides · Jun 8, 2016
 Proxy Contest (June 2016)36 slides · Jun 7, 2016
 Investor Presentation (May 2016)29 slides · May 18, 2016
 Investor Presentation (September 2015)25 slides · Sep 17, 2015