Omega Protein — Investor Presentation (May 2016)
29 slides from Omega Protein's investor presentation, May 18, 2016
Slide 1: Omega Protein - Healthy Products for a Healthy World
OMEGA & PROTEIN Healthy Products for a Healthy World!
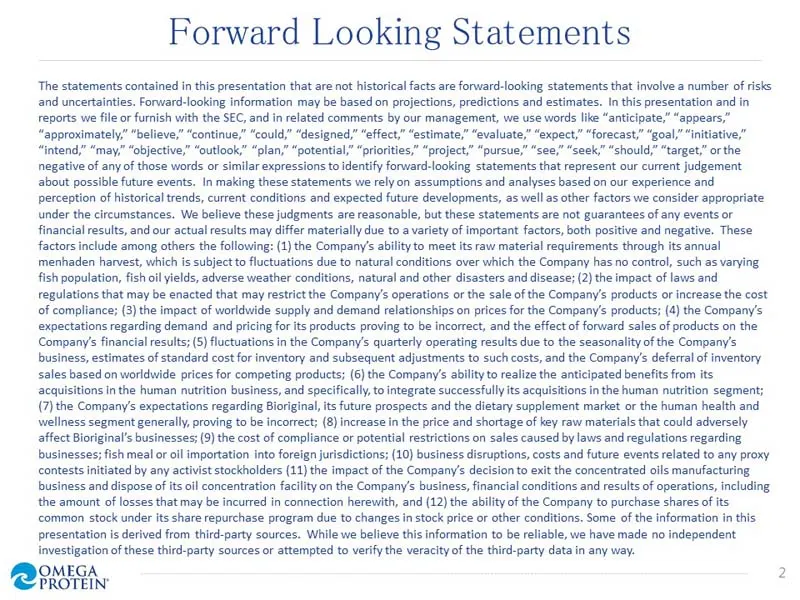
Slide 2: Forward Looking Statements
Forward Looking Statements The statements contained in this presentation that are not historical facts are forward-looking statements that involve a number of risks and uncertainties. Forward-looking information may be based on projections, predictions and estimates. In this presentation and in repo
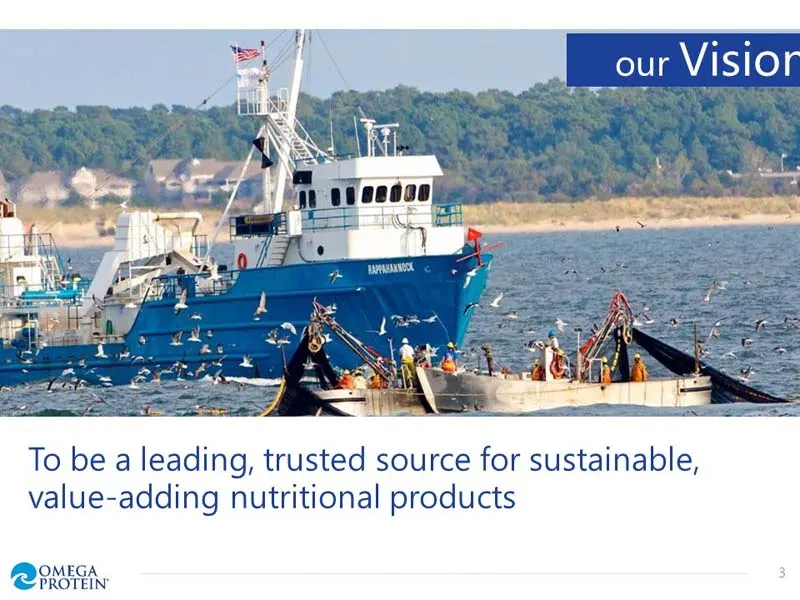
Slide 3: To be a leading, trusted source for sustainable, value-adding nutritional products
To be a leading, trusted source for sustainable, value-adding nutritional products OMEGA OMG
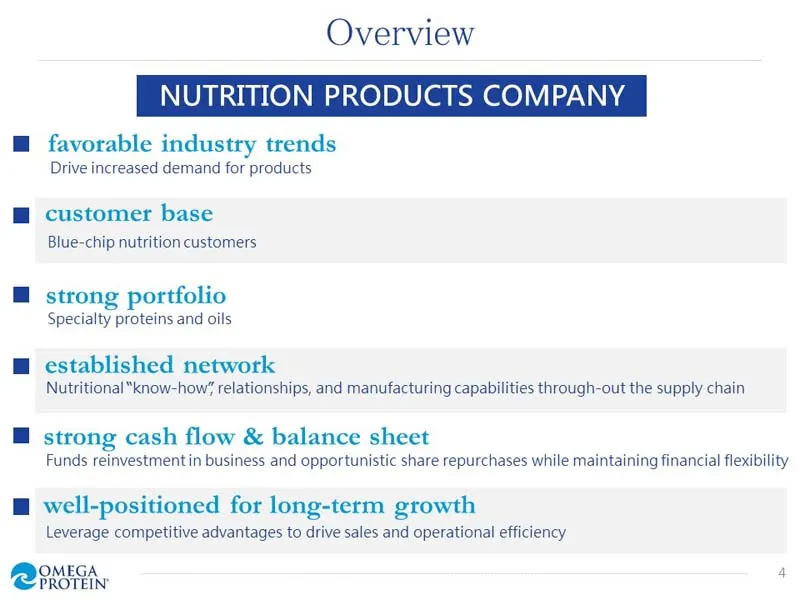
Slide 4: Overview
Overview NUTRITION PRODUCTS COMPANY ™@ favorable industry trends Drive increased demand for products @ customer base Blue-chip nutrition customers ™@ strong portfolio Specialty proteins and oils ™@ established network Nutritional know-how’ relationships, and manufacturing capabilities through-out th
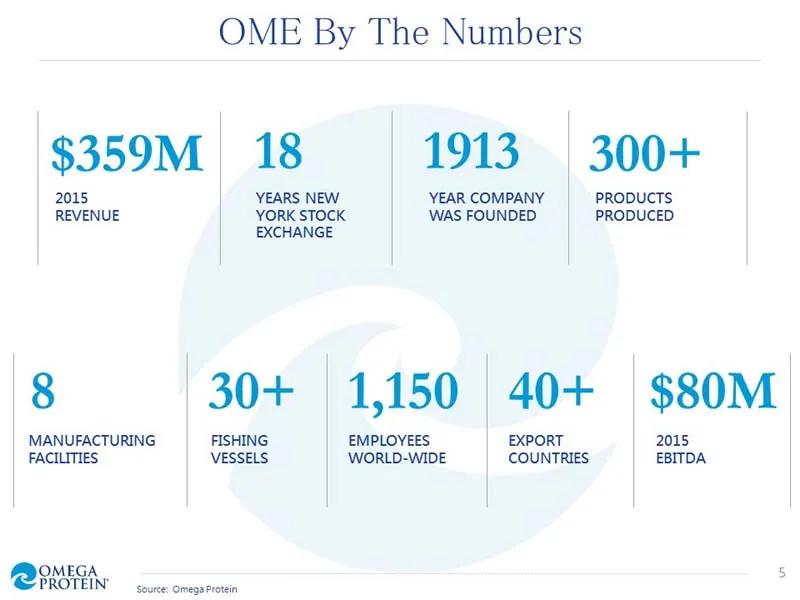
Slide 5: OME By The Numbers
OME By The Numbers $359M_ 18 8 2015 REVENUE YEARS NEW YORK STOCK EXCHANGE 30+ MANUFACTURING. FISHING FACILITIES VESSELS OMEGA 2 PROTEIN ‘Source: Omega Protein 1913 300+ YEAR COMPANY WAS FOUNDED 1,150 40+ EMPLOYEES EXPORT WORLD-WIDE COUNTRIES PRODUCTS PRODUCED. $80M 2015 EBITDA
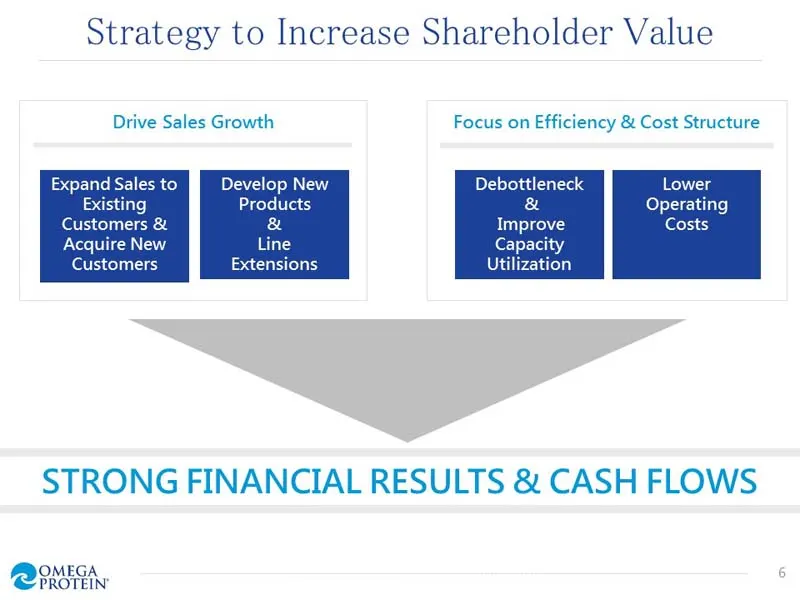
Slide 6: Strategy to Increase Shareholder Value
Strategy to Increase Shareholder Value Drive Sales Growth Focus on Efficiency & Cost Structure Expand Sales to [J Develop New Debottleneck Lower Existing Products & Operating Customers & & Improve Costs Acquire New Line Capacity Customers Extensions Utilization STRONG FINANCIAL RESULTS & CASH FLOWS
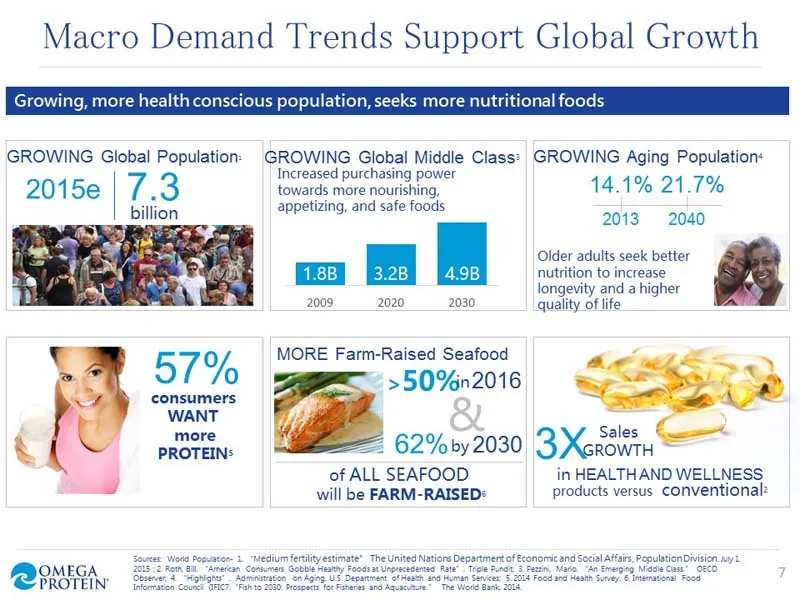
Slide 7: Macro Demand Trends Support Global Growth
Macro Demand Trends Support Global Growth Growi jore health conscious population, seek more nutritional foods GROWING Global Population: GROWING Global Middle Class: GROWING Aging Population: Increased purchasing power 2015e|7.3 fenanie neate naurigon: 14.1% 21.7% billion appetizing, and safe foods
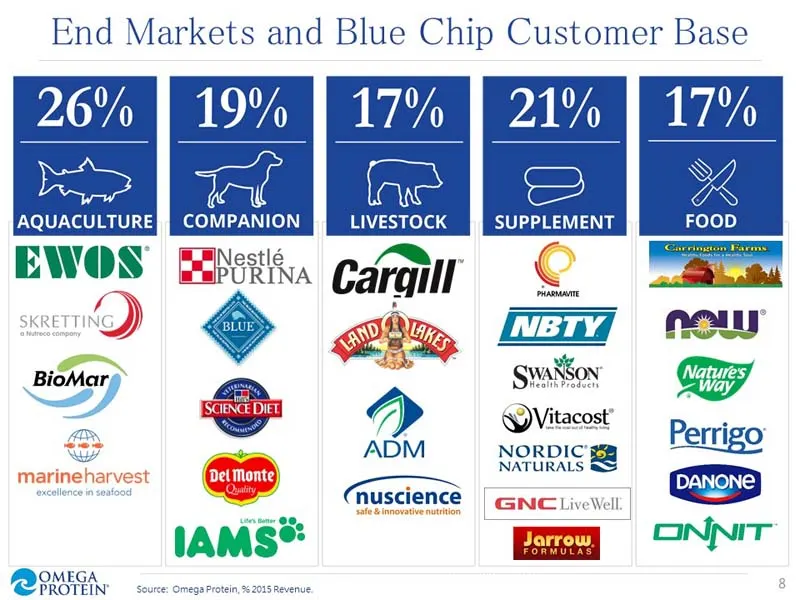
Slide 8: End Markets and Blue Chip Customer Base
End Markets and Blue Chip Customer Base SWAnsoy Vitacost! NORDIC NATURALS.
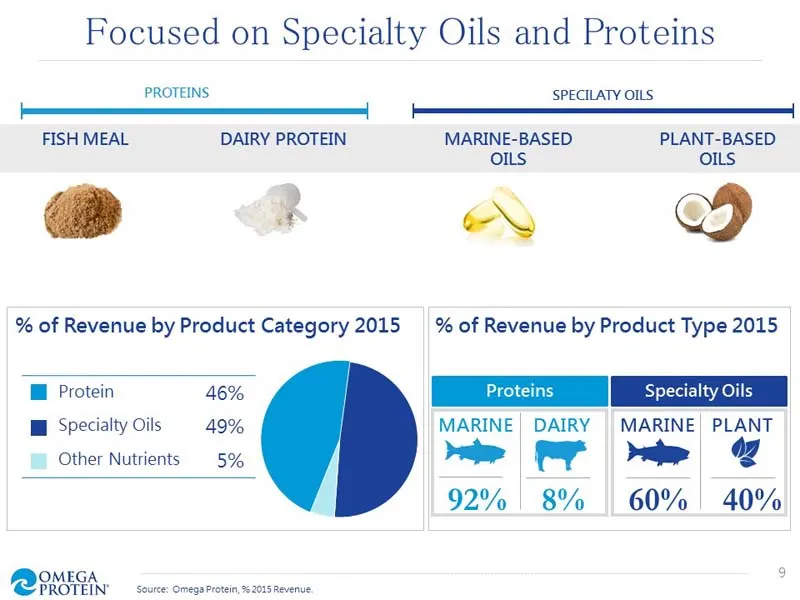
Slide 9: Focused on Specialty Oils and Proteins
Focused on Specialty Oils and Proteins PROTEINS FISH MEAL DAIRY PROTEIN % of Revenue by Product Category 2015 “Mi Proten = 46% Protein 46% Bf Specialty Oils 49% Other Nutrients 5% PROTEIN’ source: omega Protein, 262015 Revenue. SPECILATY OILS MARINE-BASED PLANT-BASED OILS OILS SS @®@ % of Revenue by
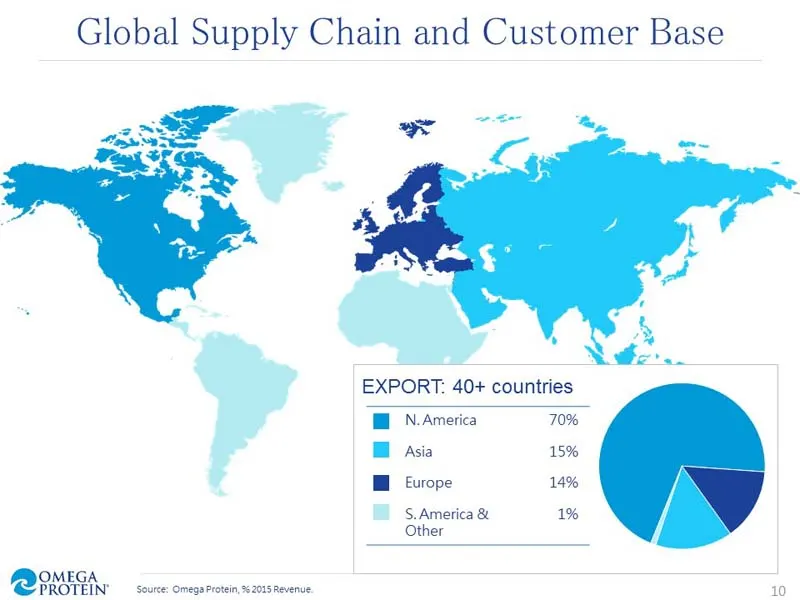
Slide 10: Global Supply Chain and Customer Base
Global Supply Chain and Customer Base EXPORT: 40+ countries “BE NAmerica 70% HH Asia 15% HE Europe 14% S.America & 1% Other OMEGA OMEGA ‘Source: Omega Protein, % 2015 Revenue. 10
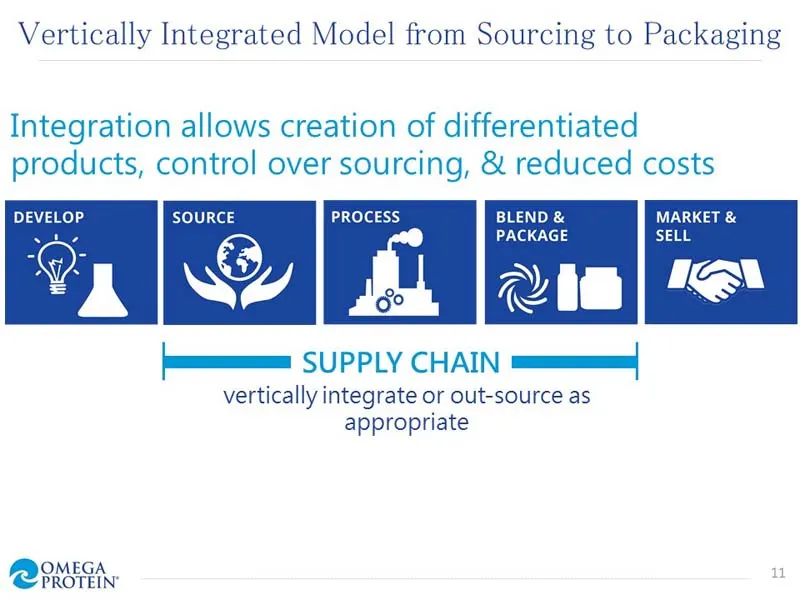
Slide 11: Vertically Integrated Model from Sourcing to Packaging
Vertically Integrated Model from Sourcing to Packaging Integration allows creation of differentiated products, control over sourcing, & reduced costs DEVELOP SOURCE PROCESS BLEND & MARKET & . . S) PACKAGE ° NY 4 Z jms SUPPLY CHAIN vertically integrate or out-source as appropriate OMEGA QM ll
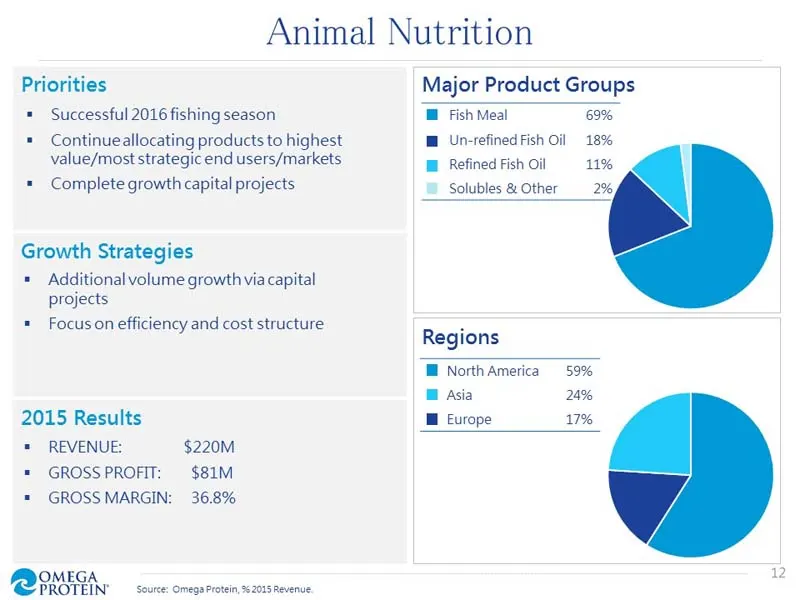
Slide 12: Animal Nutrition
Animal Nutrition Priorities = Successful 2016 fishing season + Continueallocating products to highest value/most strategic end users/markets = Complete growth capital projects Growth Strategies * Additional volume growth via capital projects * Focuson efficiency and cost structure 2015 Results = REV
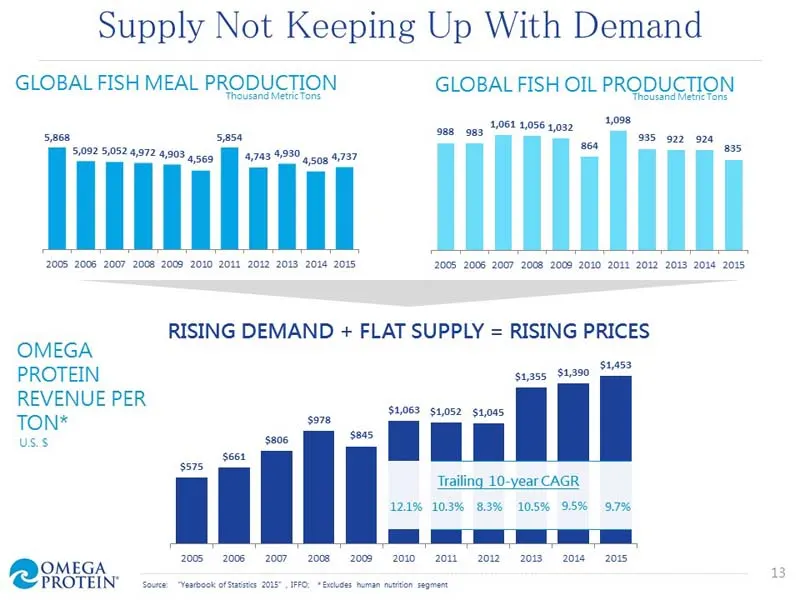
Slide 13: Supply Not Keeping Up With Demand
Supply Not Keeping Up With Demand GLOBAL FISH MEAL PRODUCTION 5.868 5854 5,082 5,052 4,972 4,903 4 seg [| 4,743 4930 aso 4737 12005 2006 2007 2008 2009 2010 2011 2012 2013 2014 2015 OMEGA PROTEIN REVENUE PER TON* USS $978 $808 $651 $575 2005 2008 2007 2008 OMEGA PROTEIN" souce SF — | 2008 GLOBAL FIS
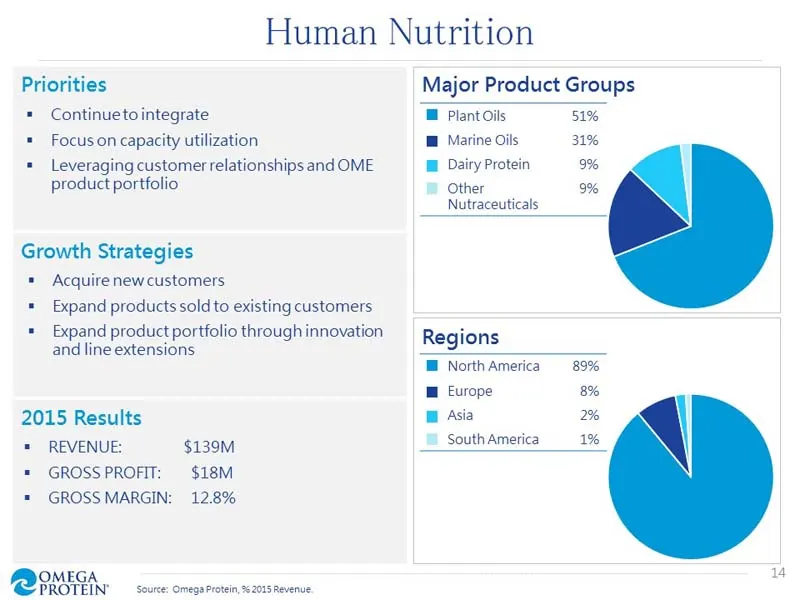
Slide 14: Human Nutrition
Human Nutrition Priorities = Continueto integrate * Focus on capacity utilization * Leveraging customer relationships and OME product portfolio Growth Strategies = Acquire newcustomers = Expand products sold to existing customers * Expand product portfolio through innovation and line extensions 2015
Slide 15: Financial Highlights
FINANCIAL HIGHLIGHTS
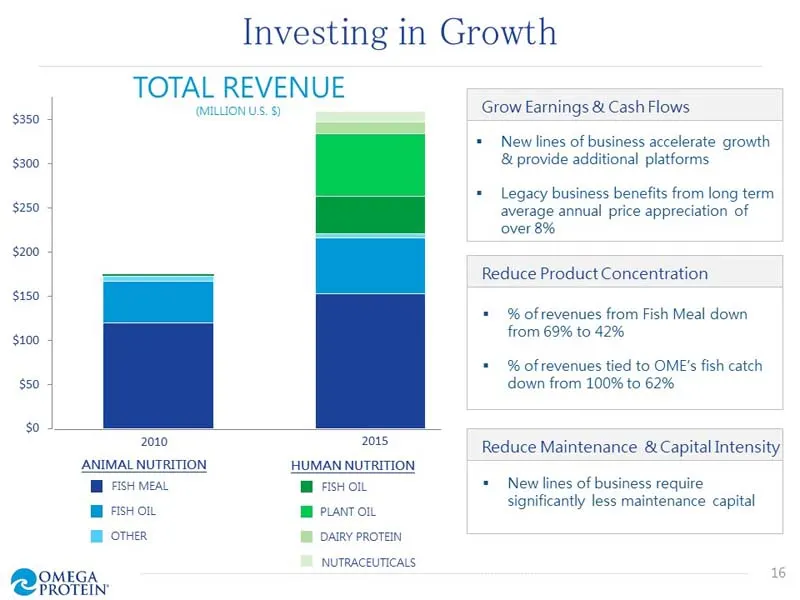
Slide 16: Investing in Growth
Investing in Growth TOTAL REVENUE Lae Grow Earnings & Cash Flows $350 RES 9 + New lines of business accelerate growth $300 & provide additional platforms * Legacy business benefits from long term $250 average annual price appreciation of over 8% $200 Reduce Product Concentration $150 + % of revenues
Slide 17: Income Statement Highlights
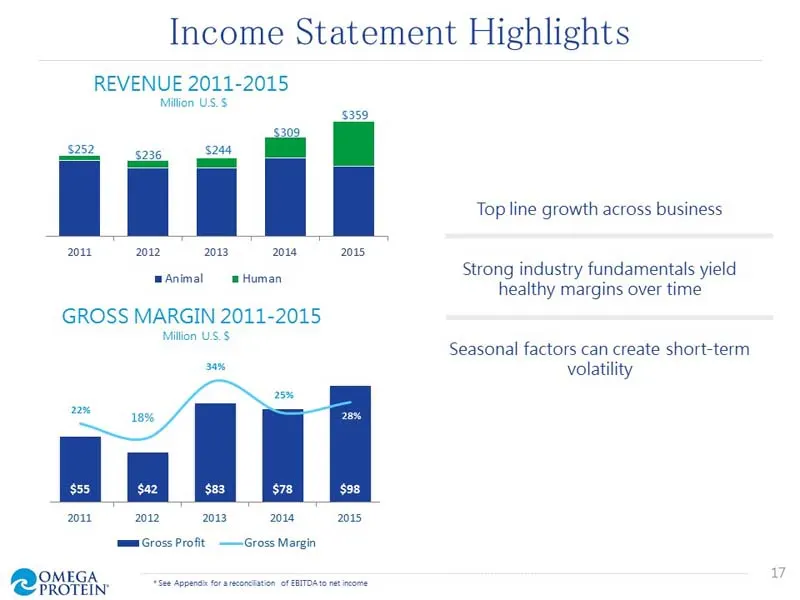
Income Statement Highlights REVENUE 2011-2015 Million US.$ 2012 2012 2013 2018 2015 Animal = Human GROSS MARGIN 2011-2015 Millon US.$ am 2011 2012 2013 2014 2015 mm Gross Profit, —Gross Margin Top line growth across business Strong industry fundamentals yield healthy margins over time Seasonal facto
Slide 18: Strong Cash Flow Generation
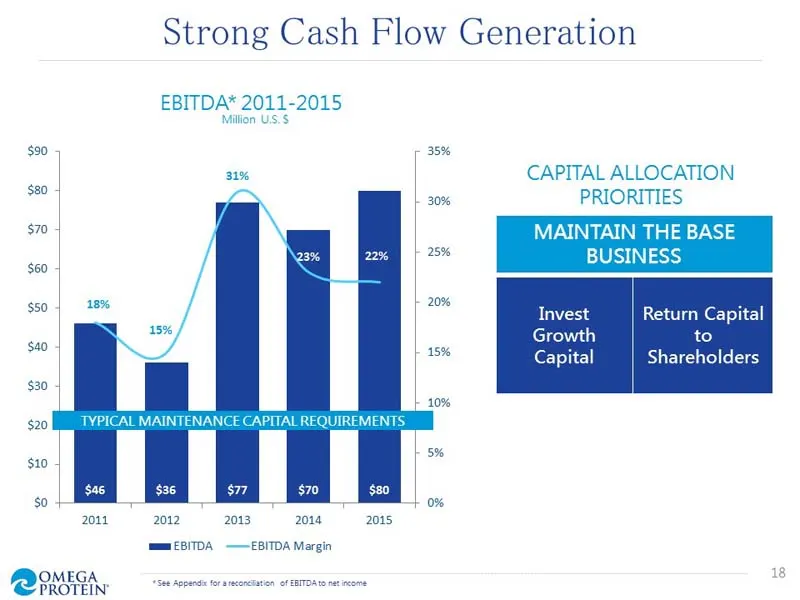
$90 Strong Cash Flow Generation EBITDA* 2011-2015 Milo 35% CAPITAL ALLOCATION PRIORITIES MAINTAIN THE BASE BUSINESS Invest Return Capital Growth to Capital Shareholders 2012 2013 2014 2015 mmm EB/TDA ——EBITDA Margin 18 +See Append or areconciation of ETOATD neice
Slide 19: Financially Flexible Balance Sheet
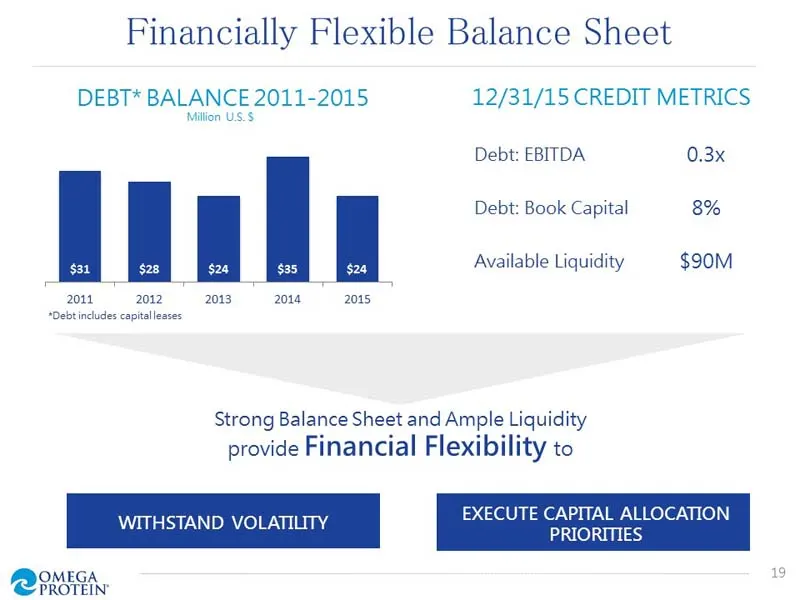
Financially Flexible Balance Sheet DEBT* BALANCE 2011-2015 12/31/15 CREDIT METRICS Millon O58 Debt: EBITDA 0.3x Debt: Book Capital 8% Available Liquidity $90M 2011 2012 2013 2018 2015 *Debtincludes copitalleaces Strong Balance Sheet and Ample Liquidity provide Financial Flexibility to EXECUTE CAPITA
Slide 20: Favorably Positioned vs. Peers
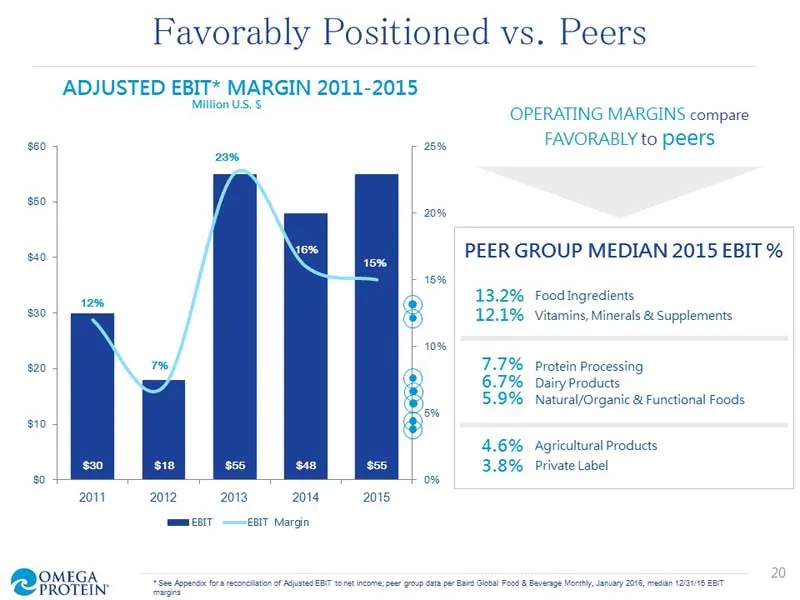
Favorably Positioned vs. Peers ADJUSTED EBIT* MARGIN 2011-2015 Million US. § OPERATING MARGINS compare $60 25% FAVORABLY to peers $60 PEER GROUP MEDIAN 2015 EBIT % so 13.29% Foodingredients $30 12.1% Vitamins, Minerals & Supplements 7.7% protein Processing 6.7% Dairy Products 5.9% Natural/Organic &
Slide 21: Attractive Margin Profile
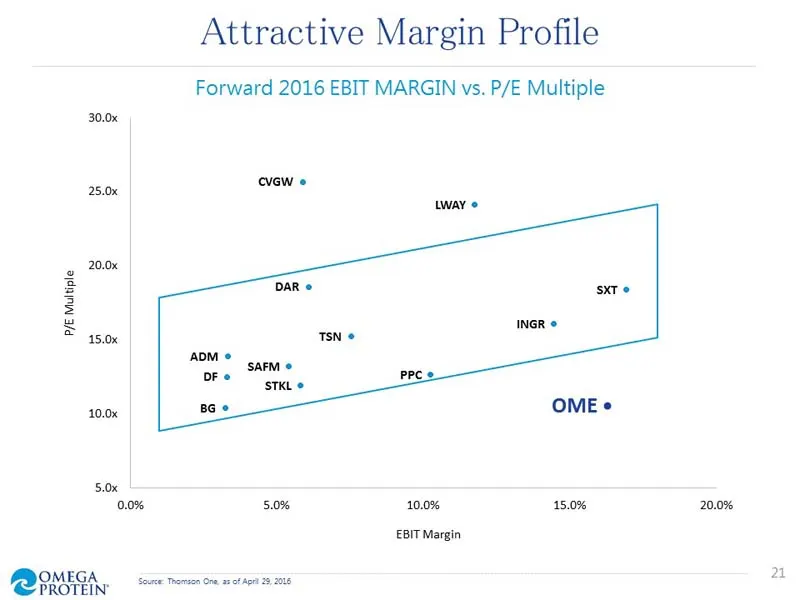
Attractive Margin Profile Forward 2016 EBIT MARGIN vs. P/E Multiple 25.0x 20.0x P/E Multiple 15.0x 10.0x 0.0% 5.0% 10.0% 15.0% 20.0% EBIT Margin
Slide 22: Conclusion
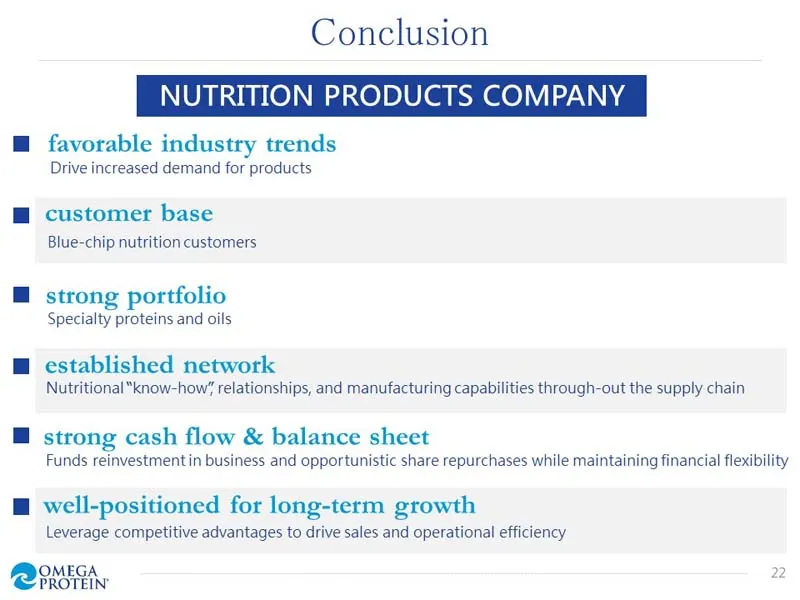
Conclusion NUTRITION PRODUCTS COMPANY ™@ favorable industry trends Drive increased demand for products @ customer base Blue-chip nutrition customers ™@ strong portfolio Specialty proteins and oils ™@ established network Nutritional know-how’ relationships, and manufacturing capabilities through-out

Slide 23: Appendix
OMEGA ed PROTEIN’ APPENDIX
Slide 24: Omega Protein Gross Profit Drivers
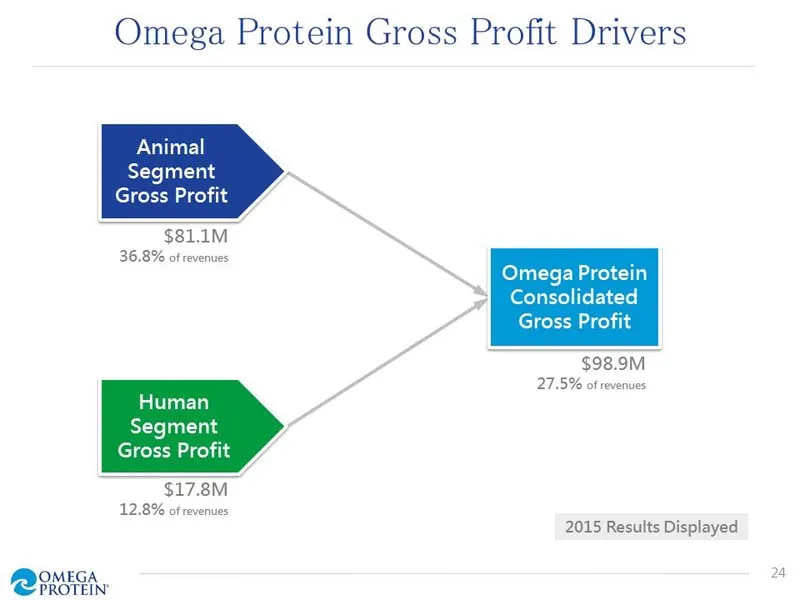
Omega Protein Gross Profit Drivers Animal Segment Gross Profit $81.1M 36.8% ot revenues ; Omega Protein Consolidated Gross Profit $98.9M 27.5% of revenues Human Segment Gross Profit $17.8M 12.8% of revenues 2015 Results Displayed OMEGA 24
Slide 25: Animal Nutrition Gross Profit Drivers
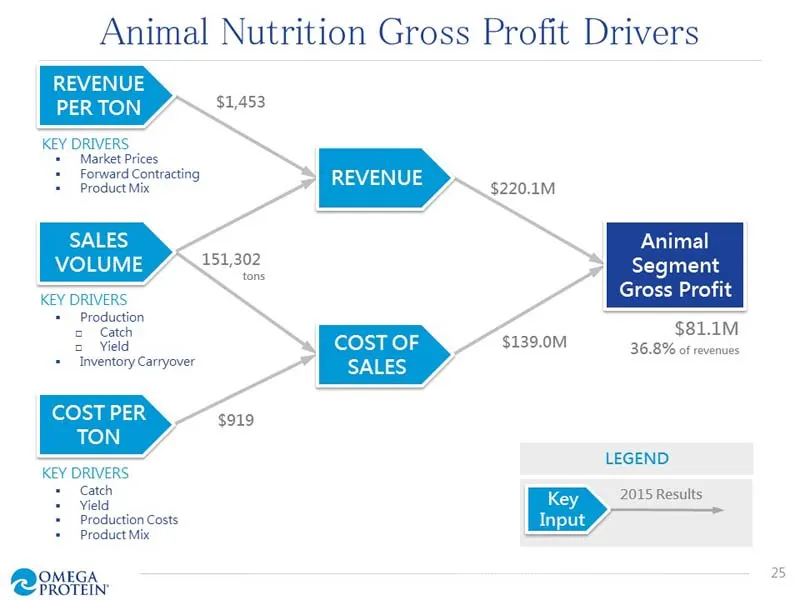
Animal Nutrition Gross Profit Drivers REVENUE PER TON KEY DRIVERS Market Prices Forward Contracting Product Mix SALES VOLUME KEY DRIVERS $1,453 REVENUE Animal 151,302 sce Segment Gross Profit Production ct $81.1M © Noe COST OF $139.0M 36.8% of revenues Inventory Carryover $919 LEGEND KEY DRIVERS Cat
Slide 26: Human Nutrition Gross Profit Drivers
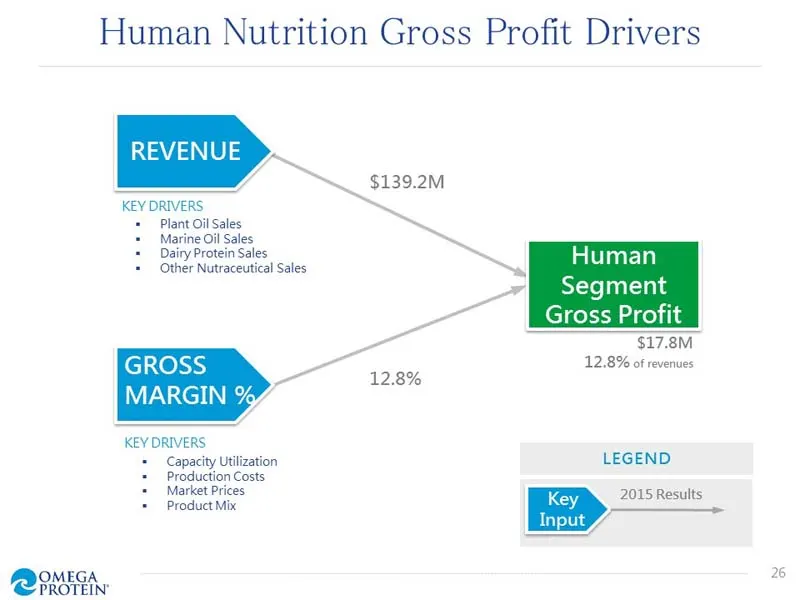
Human Nutrition Gross Profit Drivers REVENUE KEY DRIVERS + Plant Oil Sales + Marine Oil Sales $139.2M = Dairy Protein Sal + Other Nutraceutia Sles Human Segment Gross Profit $17.8M 12.8% of revenues GROSS ay MARG KEY DRIVERS, = Capacity Utilization LEGEND + Production Costs = Market Prices 2015 Resu
Slide 27: OME Key Historical Drivers
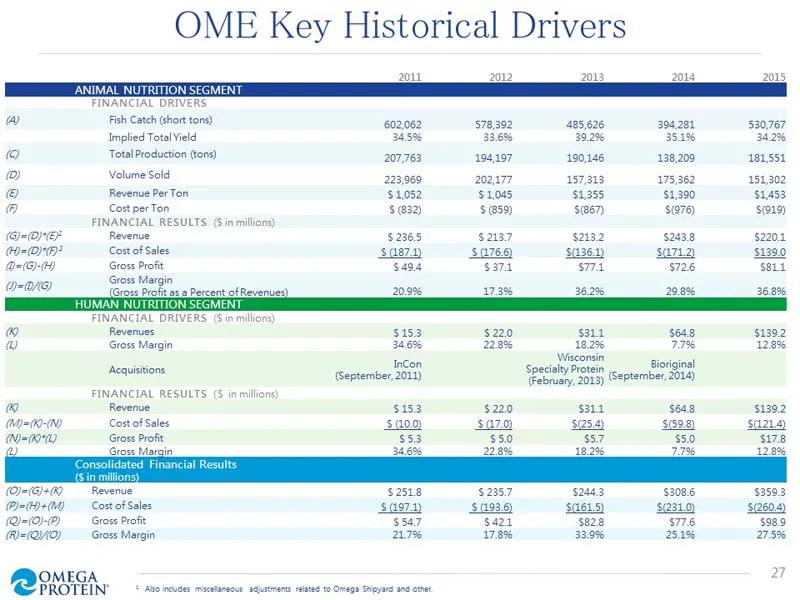
OME Key Historical Drivers 2011 202 2013 201s 2015 ANIMAL NUTRITION SEGMENT es @ Fish Catch (short tone) 602,062 578,392 485,626 394,281 530,767 Ile Talal Be Be a ped ee oo ‘Total Production (tons) 207,763 194,197 190,146 ‘138,209 181,551, Q ‘Volume Sold 223,969 (202,177 157,313 175,362 151,302 @ ee
Slide 28: Regulation G Reconciliation
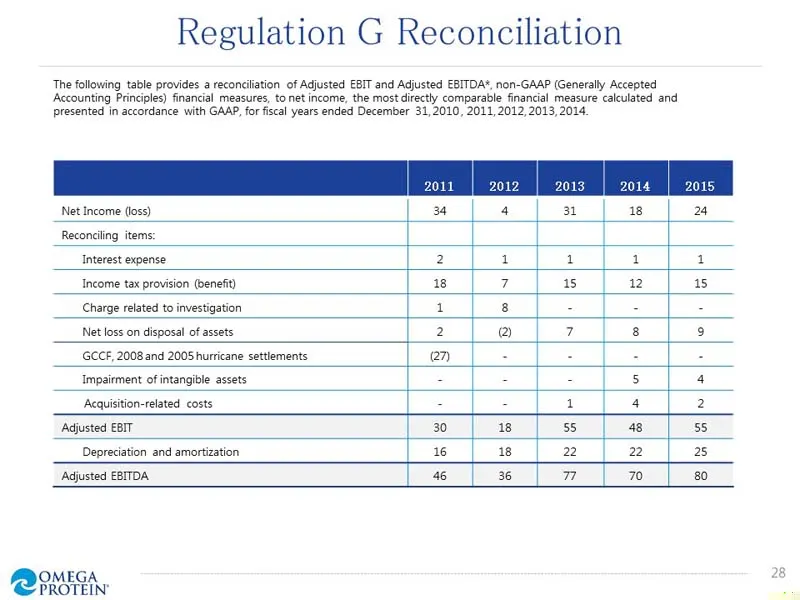
Regulation G Reconciliation ‘The following table provides a reconciliation of Adjusted EBIT and Adjusted EBITDA‘, non-GAAP (Generally Accepted ‘Accounting Principles) financial measures, tomnet income, the most directly comparable financial measure calculated and presented in accordance with GAAP, f
Slide 29: Regulation G Reconciliation
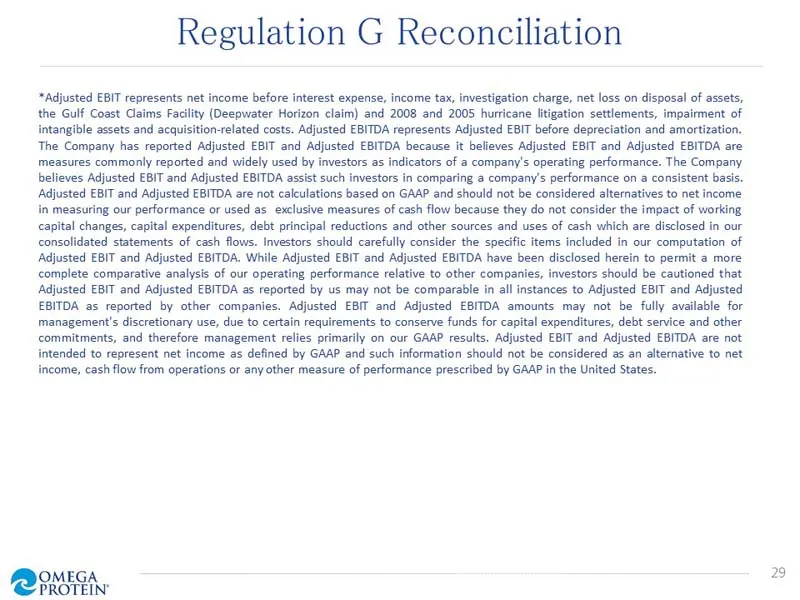
Regulation G Reconciliation “Adjusted EBIT represents net income before interest expense, income tax, investigation charge, net loss on disposal of assets, the Gulf Coast Claims Facility (Deepwater Horizon claim) and 2008 and 2005 hurricane litigation settlements, impairment of intangible assets and
Source: SEC EDGAR · 8-K filed May 18, 2016
More decks from Omega Protein Corp
 Investor Presentation (May 2017)27 slides · May 17, 2017
 Investor Presentation (January 2017)27 slides · Jan 11, 2017
 Proxy Contest (June 2016)48 slides · Jun 8, 2016
 Proxy Contest (June 2016)36 slides · Jun 7, 2016
 Investor Presentation (September 2015)25 slides · Sep 17, 2015
 Investor Presentation (May 2015)25 slides · May 19, 2015