Omega Protein — Investor Presentation (May 2015)
25 slides from Omega Protein's investor presentation, May 19, 2015

Slide 1: Healthy Lives Through Better Nutrition
OMEGA oMEOK. Healthy Lives Through Better Nutrition
Slide 2: Forward Looking Statements
Forward Looking Statements ‘The statements contained in this presentation that are not historical facts are foward-looking statements that involve a numberof risks and uncertainties. Fonvard:-looking information may be based on projections, predictions and estimates. In this presentation and in repo
Slide 3: Omega Protein At A Glance
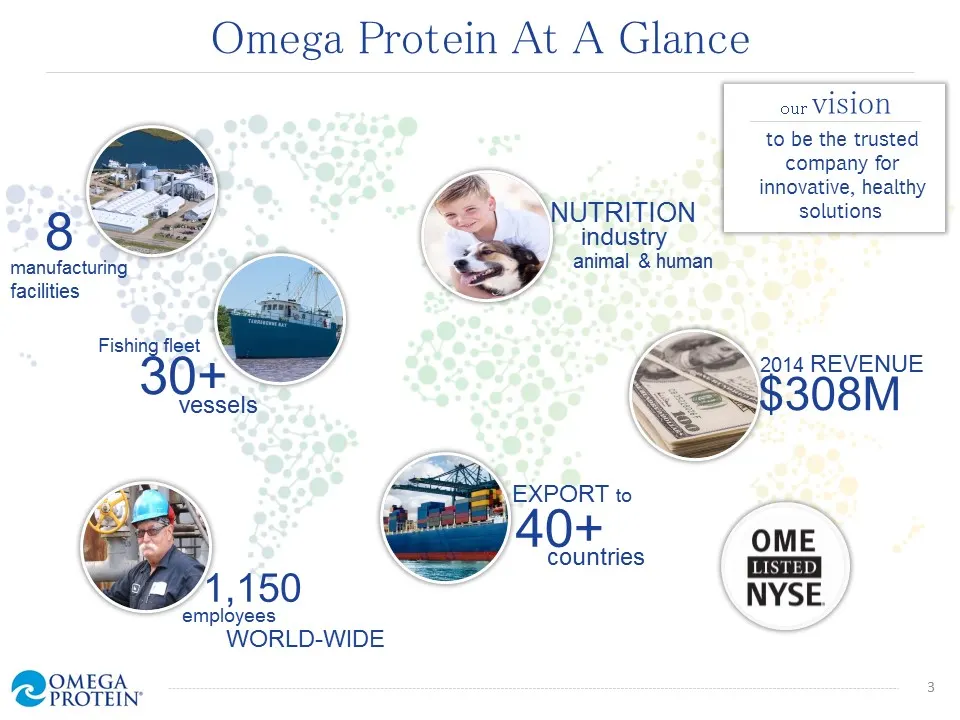
Omega Protein At A Glance our ViSion to be the trusted company for . innovative, healthy “NUTRITION solutions industry _ 8 peer a “8K animal & human facilities Fishing fleet Sa a ae Y SS 2: O8M_ Ot Sees \EXPORT to 2. + \ 40: ntries 1,150 NYSE. employees WORLD-WIDE
Slide 4: Food, Nutrition, and Health Trends
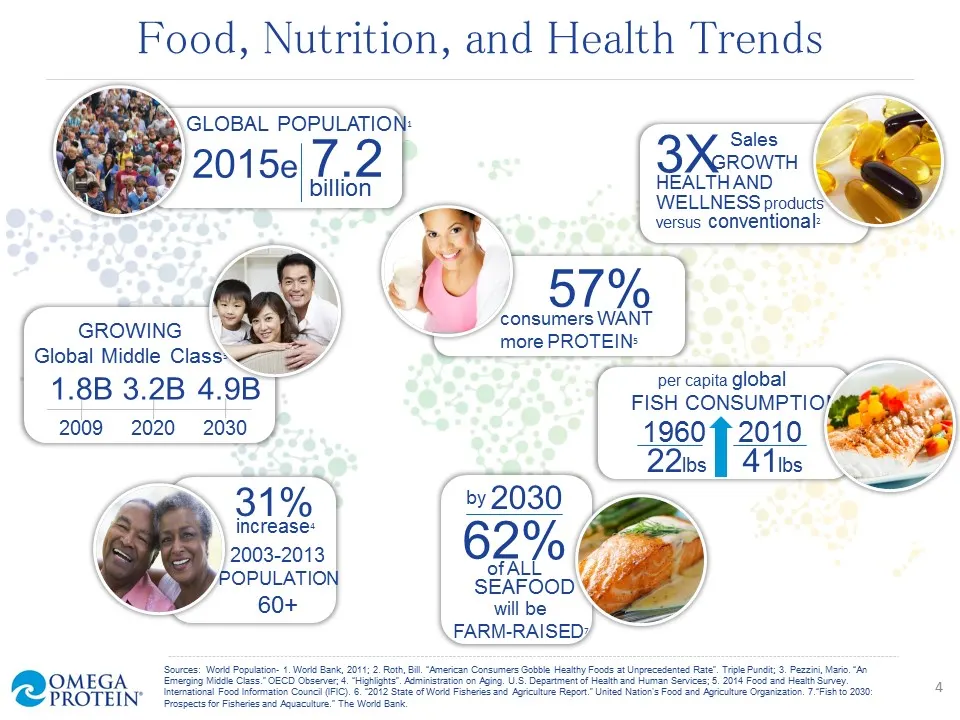
Food, Nutrition, and Health Trends Sales 8 501 Bel / 3 ROWTH bil ra HEALTHAND | WELLNESS products | versus conventional: = “a zs a (0) Sie 21 | My, consumers GROWING > more PROTEIN: Global Middle Class> 4 ww 6 ( per capita global / 1.8B 3.2B 4.9B | FISH CONSUMPTIO{ \ 2009 2020 2030 _) 1960 F 2010 x
Slide 5: End Markets
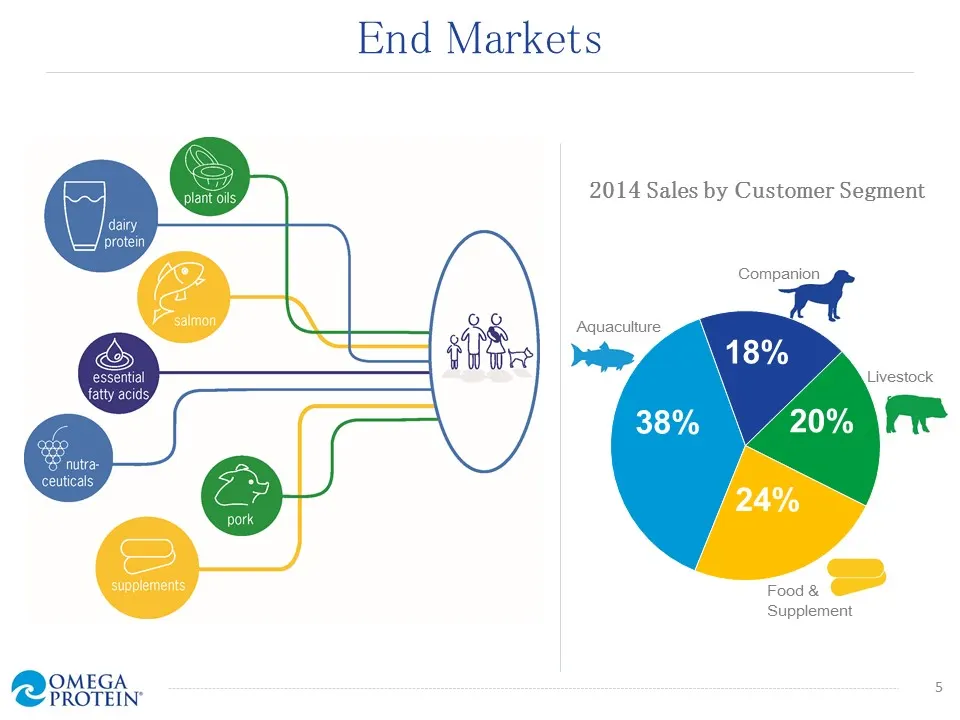
End Markets 2014 Sales by Customer Segment Companion Livestock Supplement OMEGA eg PROTEIN’ °
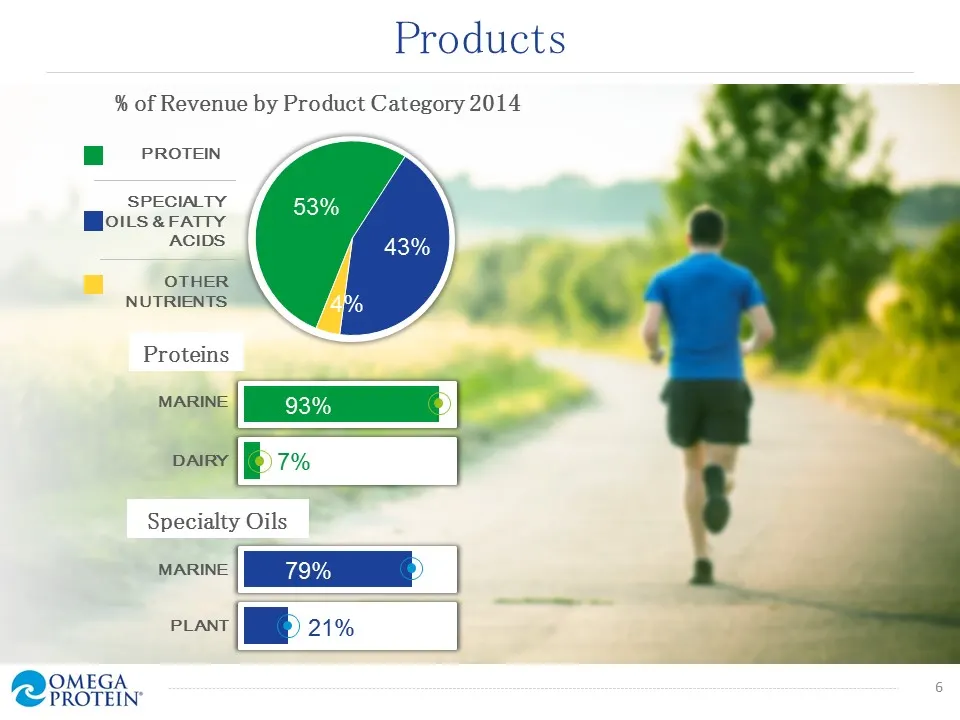
Slide 6: Products
Products % of Revenue by Product Category 2014 WOPROTEIN SPECIALTY Holts ararty ACIDS OTHER, NUTRIENTS Proteins MARINE, DAIRY PLANT OMEGA RMN .
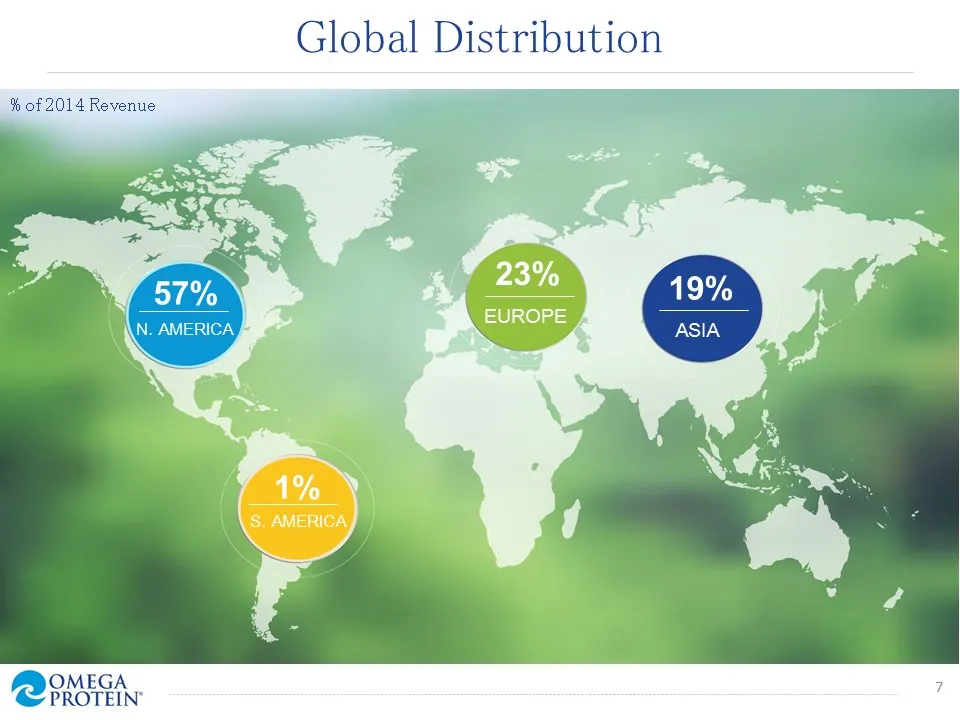
Slide 7: Global Distribution
Global Distribution % of 2014 Revenue
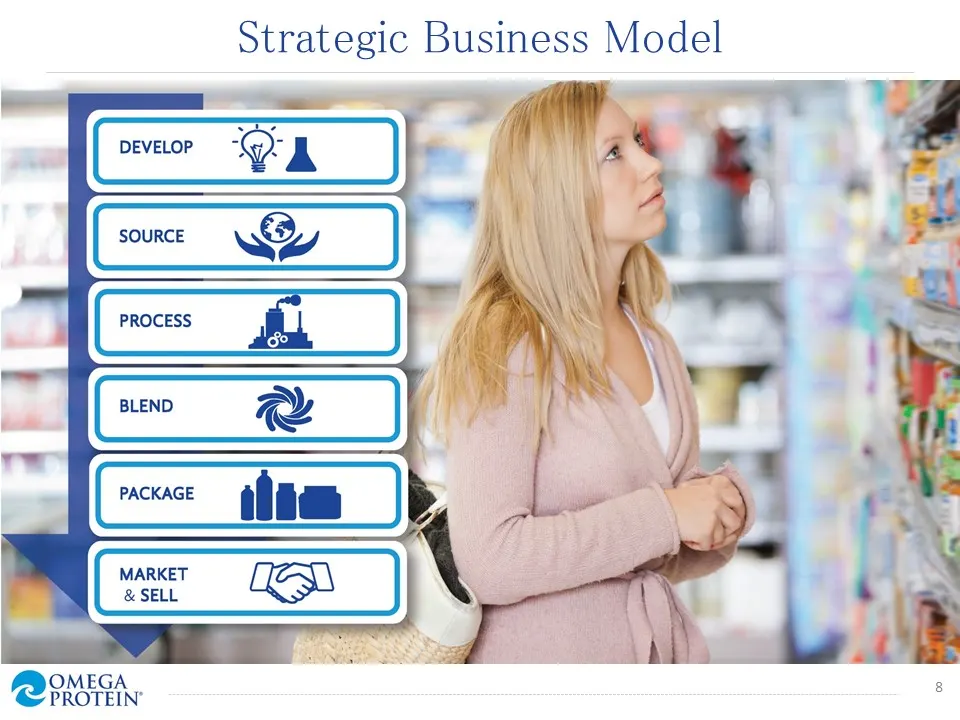
Slide 8: Strategic Business Model
Strategic Business Model DEVELOP Oa SOURCE SY PROCESS so. BLEND PACKAGE (oe ,
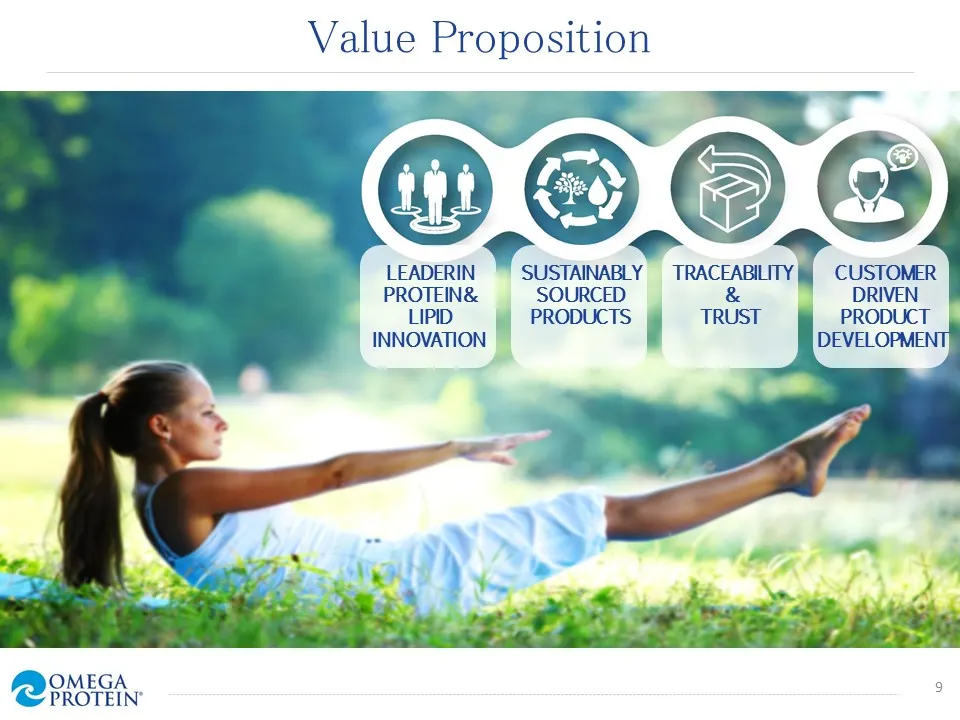
Slide 9: Value Proposition
Value Proposition LEADERIN SUSTAINABLY TRACEABILITY ; CUSTOMER PROTEIN& SOURCED & DRIVEN LIPID PRODUCTS TRUST PRODUCT INNOVATION | OMEGA MEN: 3
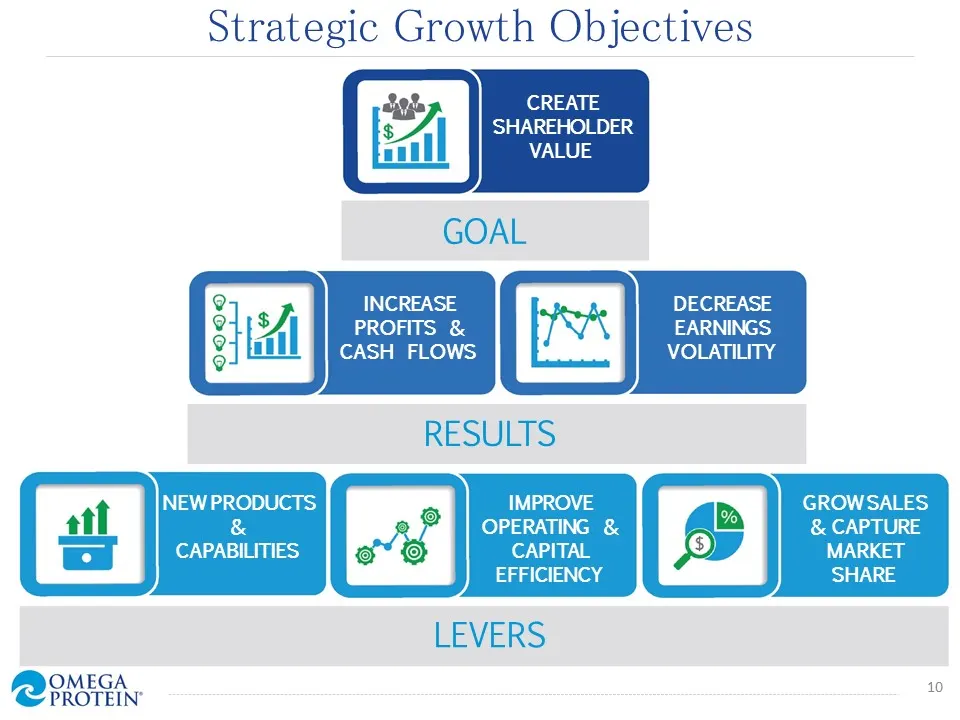
Slide 10: Strategic Growth Objectives
Strategic Growth Objectives CREATE SHAREHOLDER INCREASE DECREASE PROFITS & EARNINGS CASH FLOWS VOLATILITY NEW PRODUCTS IMPROVE GROWSALES & OPERATING & & CAPTURE CAPABILITIES CAPITAL MARKET EFFICIENCY SHARE 10 OMEGA BME.
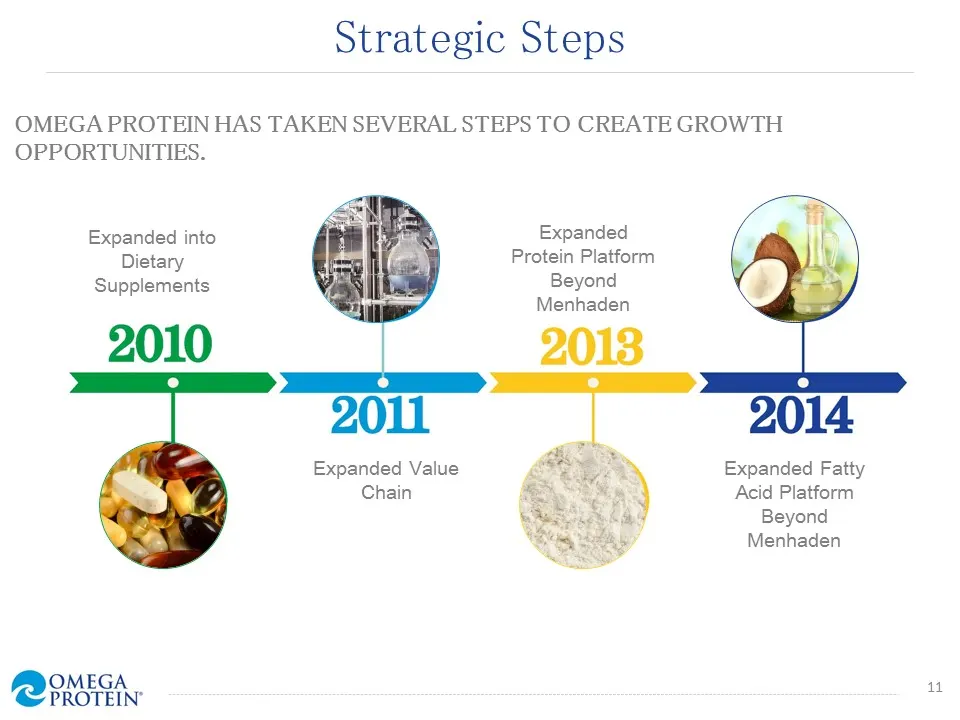
Slide 11: Strategic Steps
Strategic Steps OMEGA PROTEIN HAS TAKEN SEVERAL STEPS TO CREATE GROWTH OPPORTUNITIES. Expanded into Expanded Dietary Protein Platform Supplements Beyond Menhaden 2010 Expanded Value Chain Expanded Fatty Acid Platform Beyond Menhaden OMEGA OME. ut
Slide 12: Financial Highlights
OMEGA aOMEOK FINANCIAL HIGHLIGHTS
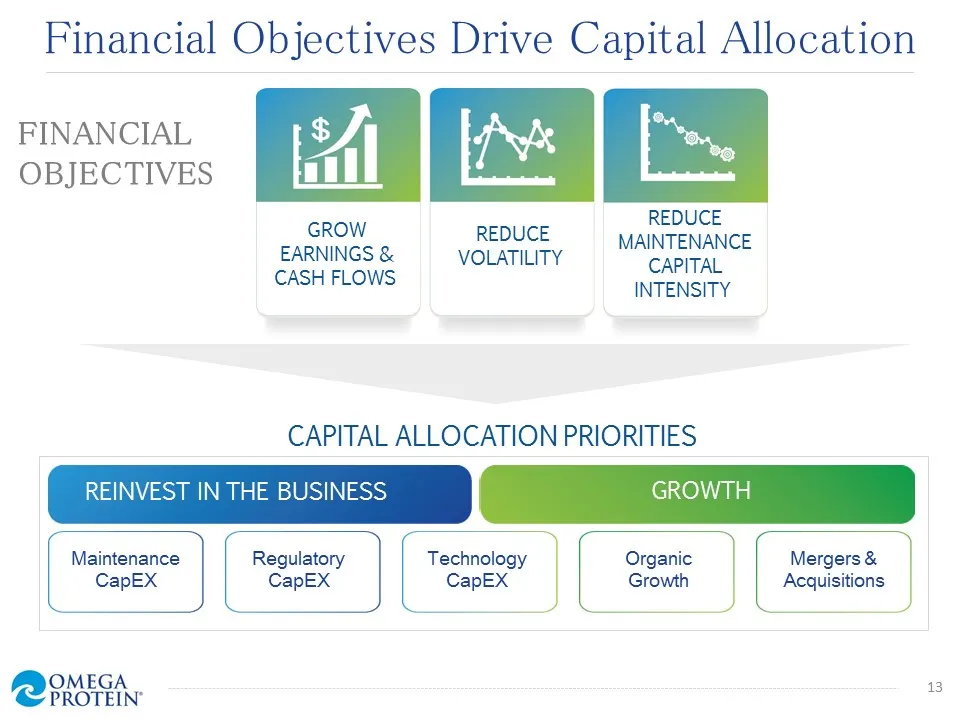
Slide 13: Financial Objectives Drive Capital Allocation
Financial Objectives Drive Capital Allocation FINANCIAL [A [s. OBJECTIVES bee | = REDUCE EARNINGS & Woman MA ENCE CASH FLOWS. INTENSITY CAPITAL ALLOCATION PRIORITIES REINVEST IN THE BUSINESS GROWTH Maintenance CapEX Technology CapEX Mergers & Acquisitions Regulatory CapEX Organic Growth OMEGA OME. 1
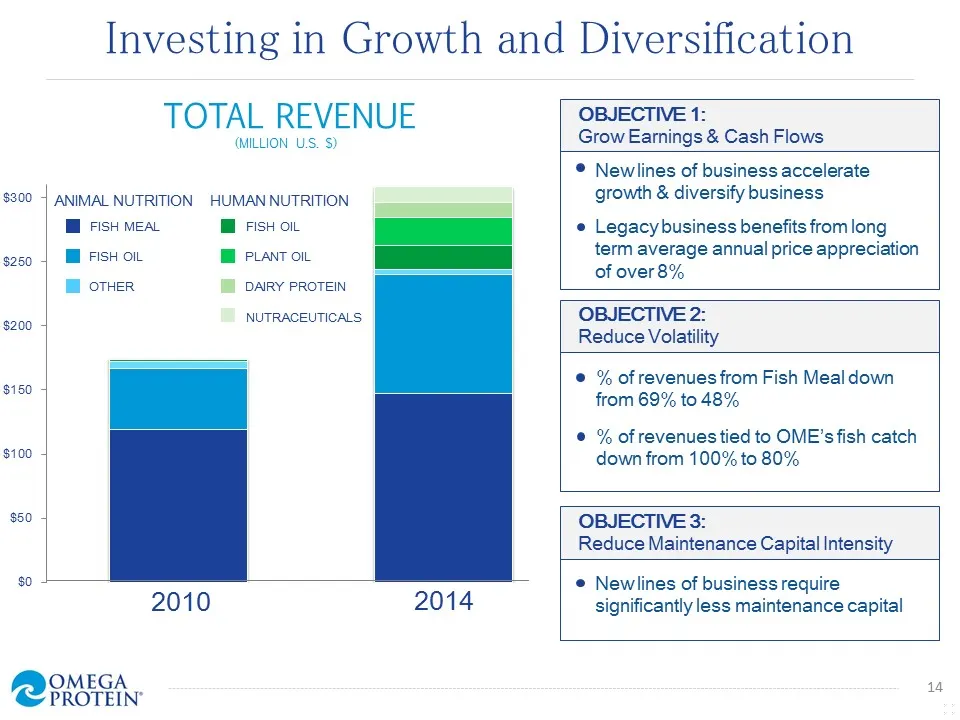
Slide 14: Investing in Growth and Diversification
Investing in Growth and TOTAL REVENUE Diversification OBJECTIVE 1: Grow Earnings & Cash Flows © Newlines of business accelerate growth & diversify business e Legacy business benefits from long term average annual price appreciation of over 8% OBJECTIVE 2: Reduce Volatility © % of revenues from Fish
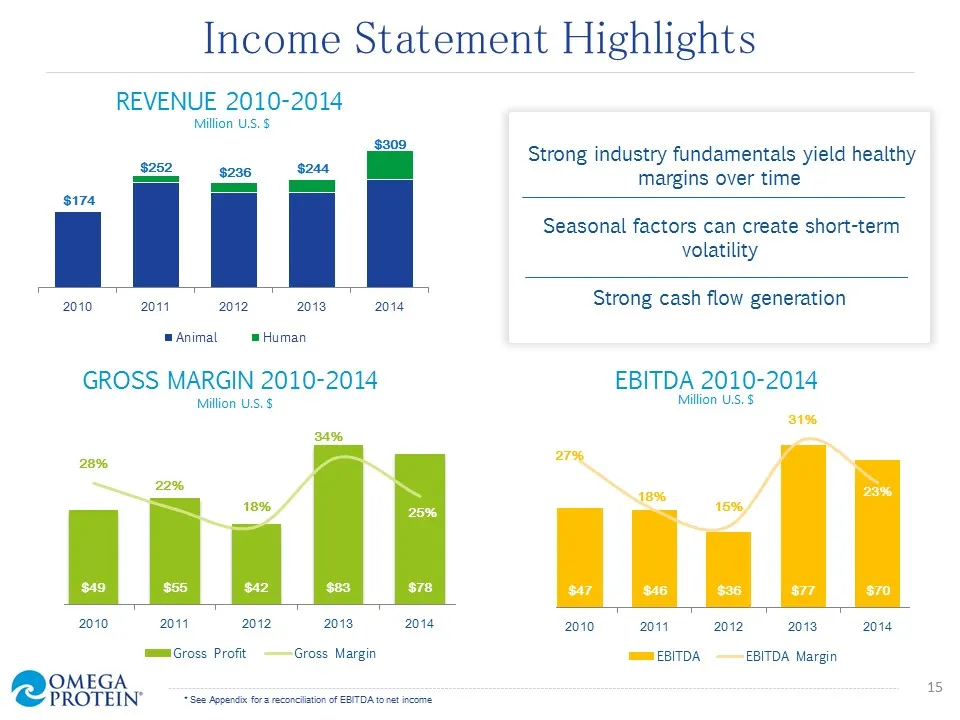
Slide 15: Income Statement Highlights
Income Statement Highlights REVENUE 2010-2014 Million US. $ $309 ' . Strong industry fundamentals yield healthy oe pasa —s |_| margins over time $174 Seasonal factors can create short-term volatility a a ee ee Strong cash flow generation m Animal = Human GROSS MARGIN 2010-2014 EBITDA 2010-2014 Milli
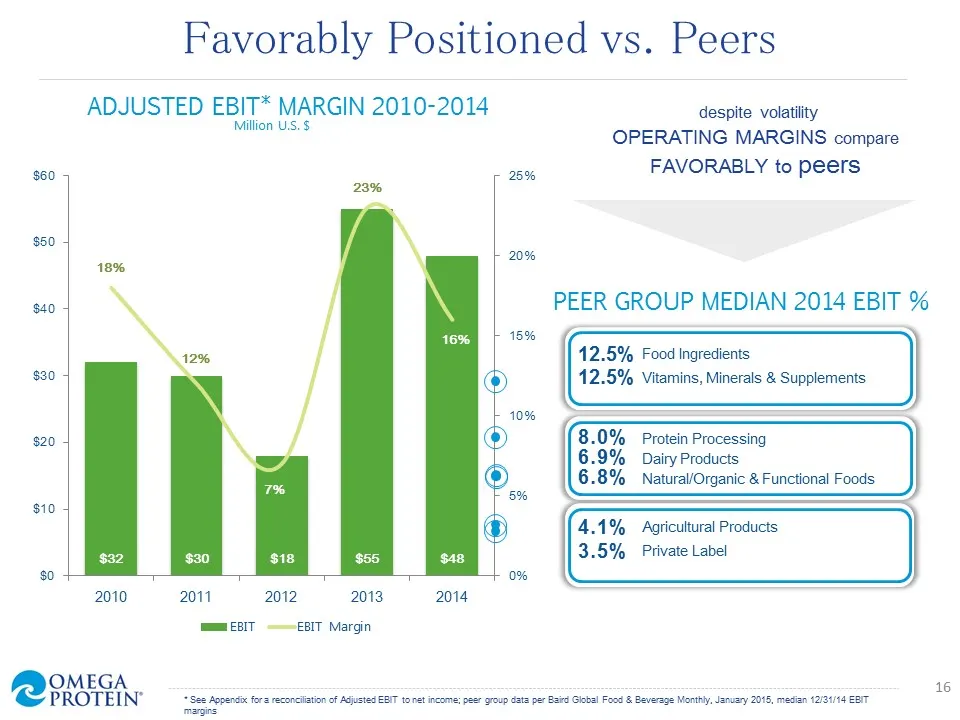
Slide 16: Favorably Positioned vs. Peers
Favorably Positioned vs. Peers ADJUSTED EBIT* MARGIN 2010-2014 despite volatility ee OPERATING MARGINS compare % - FAVORABLY to peers $50 20% PEER GROUP MEDIAN 2014 EBIT % 15% fe Food Ingredients | $40 $30 12.5% Vitamins, Minerals & Supplements $20 6.9% Dairy Products e 8.0% Protein Processing 6.8%
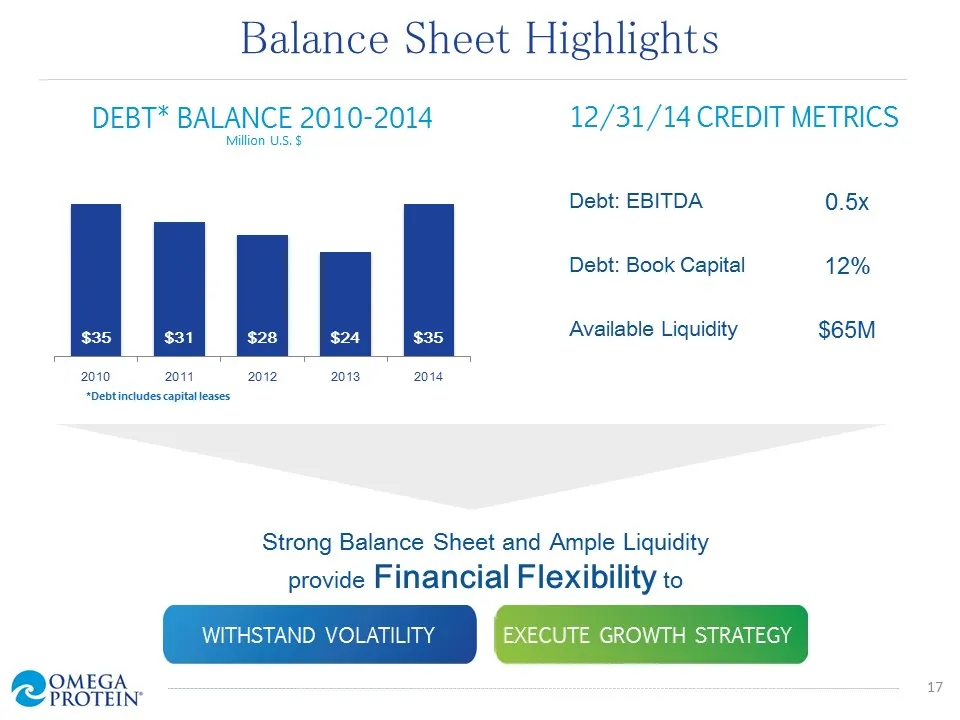
Slide 17: Balance Sheet Highlights
Balance Sheet Highlights DEBT* BALANCE 2010-2014 12/31/14 CREDIT METRICS Million US. $ Debt: EBITDA 0.5x Debt: Book Capital 12% Available Liquidity $65M 2010 2011 2012 2013 2014 *Debtincludes capital leases Strong Balance Sheet and Ample Liquidity provide Financial Flexibility to WITHSTAND VOLATILIT

Slide 18: Appendix
OMEGA OMEOK: APPENDIX
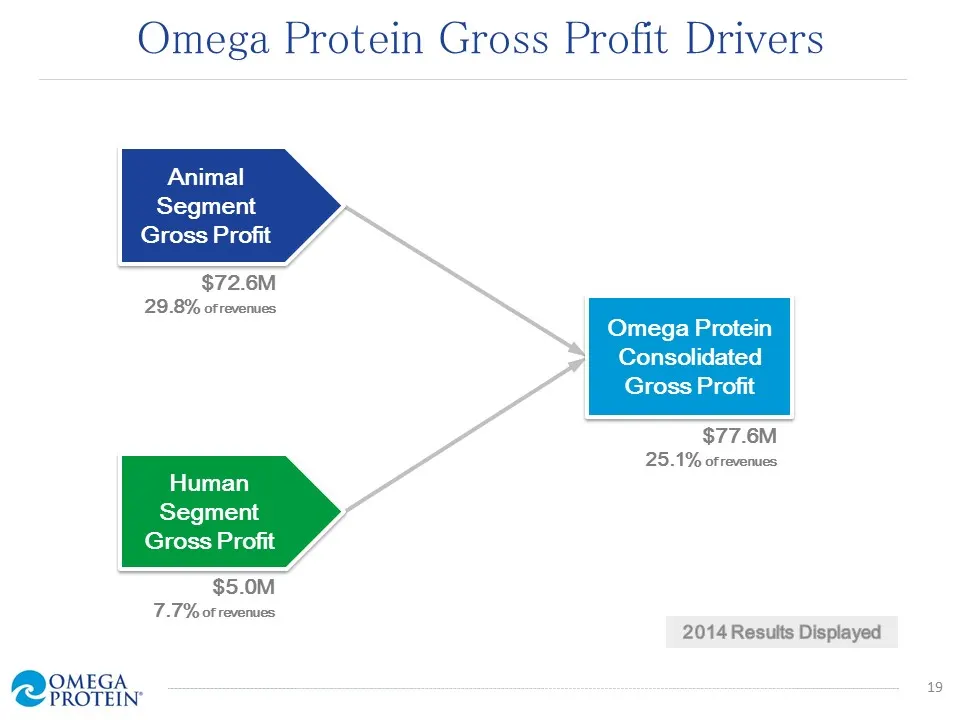
Slide 19: Omega Protein Gross Profit Drivers
Omega Protein Gross Profit Drivers Animal Segment Gross Profit $72.6M 29.8% of revenues Omega Protein Consolidated Gross Profit $77.6M 25.1% of revenues Human Segment Gross Profit $5.0M 7.7% of reverues 2014 Results Displayed OMEGA OMEN *
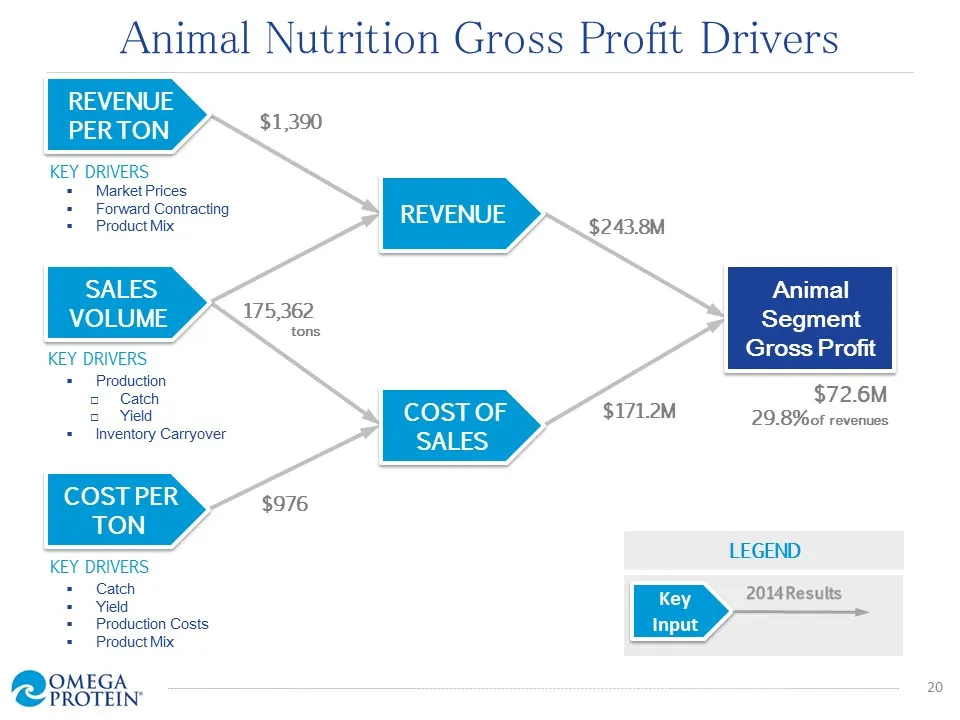
Slide 20: Animal Nutrition Gross Profit Drivers
Animal Nutrition Gross Profit Drivers REVENUE PERTON KEY DRIVERS. Market Prices Forward Contracting Product Mix $1,390 | REVENUE SALES Animal VOLUME Segment KEY DRIVERS | Gross Profit Production Catch $72.6M eee $171.2M 29.8%of revenues Inventory Carryover COST PER $976 TON KEY DRIVERS we 2014Resutt
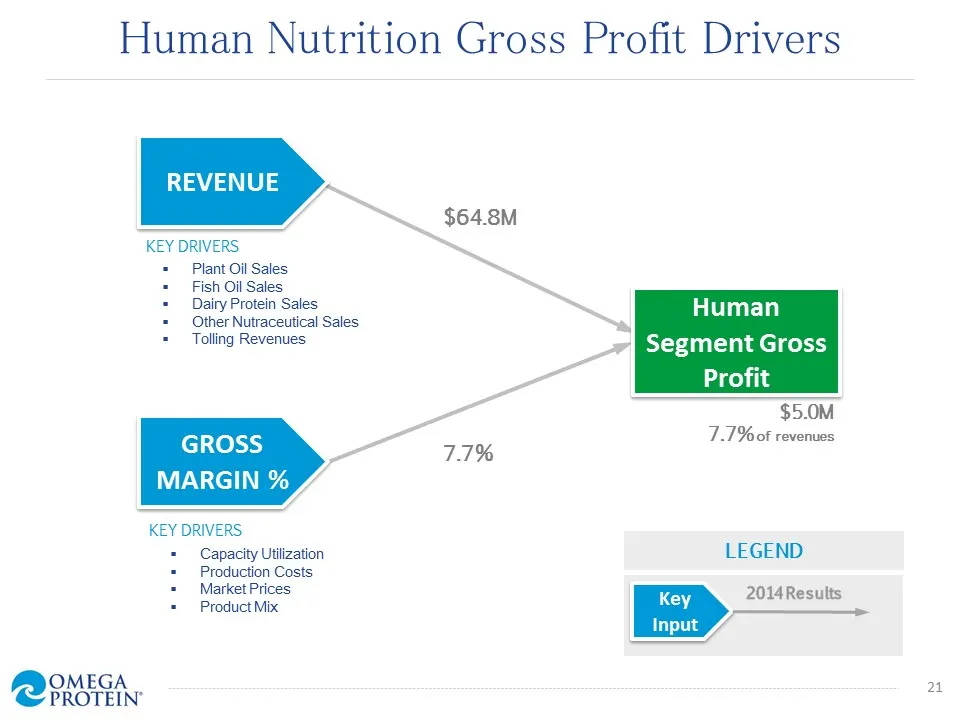
Slide 21: Human Nutrition Gross Profit Drivers
ie] Human Nutrition Gross Profit Drivers REVENUE KEY DRIVERS = Plant Oil Sales Fish Oil Sales Dairy Protein Sales Other Nutraceutical Sales Human Tolling Revenues enmeneGrees Profit $5.0M GROSS 7.7% of revenues MARGIN % KEY DRIVERS Capacity Utilization LEGEND Production Costs Market Prices ees 2014
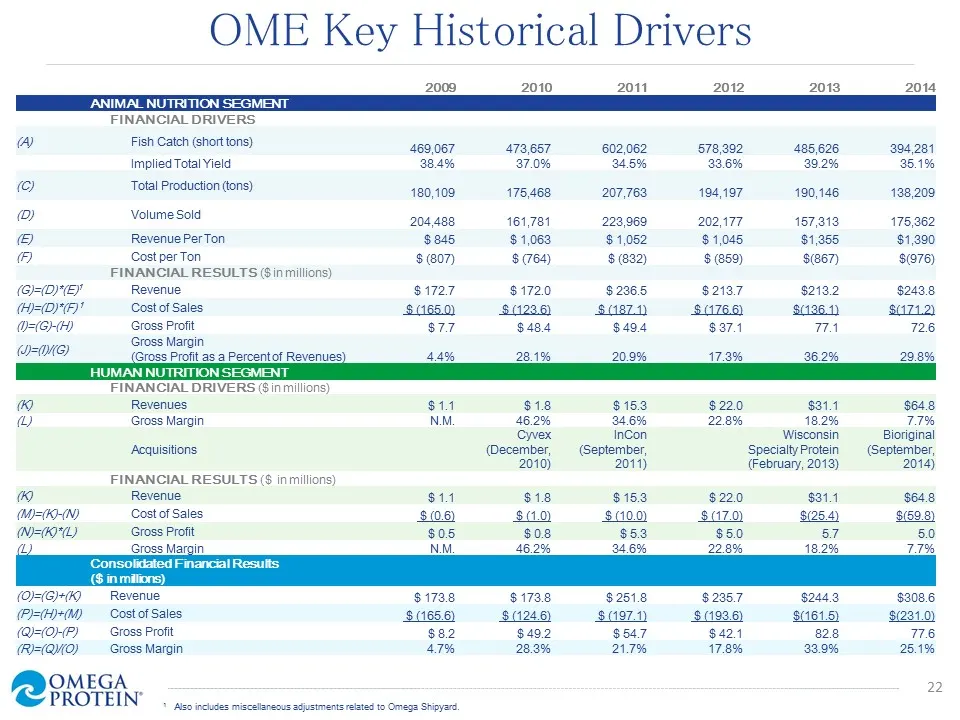
Slide 22: OME Key Historical Drivers
OME Key Historical Drivers 2009 2010 2011 2012 2013 2014 ANIMAL NUTRITION SEGMENT FINANCIAL DRIVERS: A Fish Catch (short tons) 469,067 Implied Total Yield 38.4% (C) Total Production (tons) 180,109 () Volume Sold 204,488 cc) Revenue Per Ton $845 @ Cost perTon $07) FINANCIAL RESULTS ($inmillions) (G=(
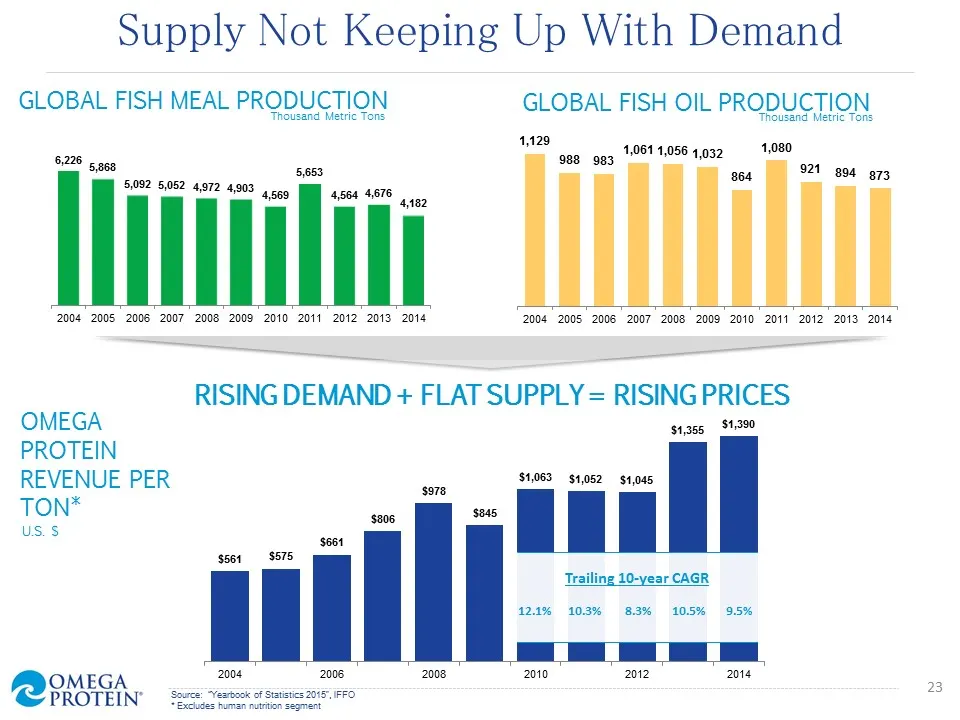
Slide 23: Supply Not Keeping Up With Demand
Supply Not Keeping Up With Demand GLOBAL FISH MEAL PRODUCTION GLOBAL FISH OIL PRODUCTION 6.226 5 s65 eso we eae 993 1061 1058 1,032 1,080 921 g94 973 5,092 5, 5052 4972 4903 ag —— — RISING DEMAND + FLAT SUPPLY = RISING PRICES OMEGA eet PROTEIN REVENUE PER $1063 54052 shoes TON* US.S Trailing 10-year
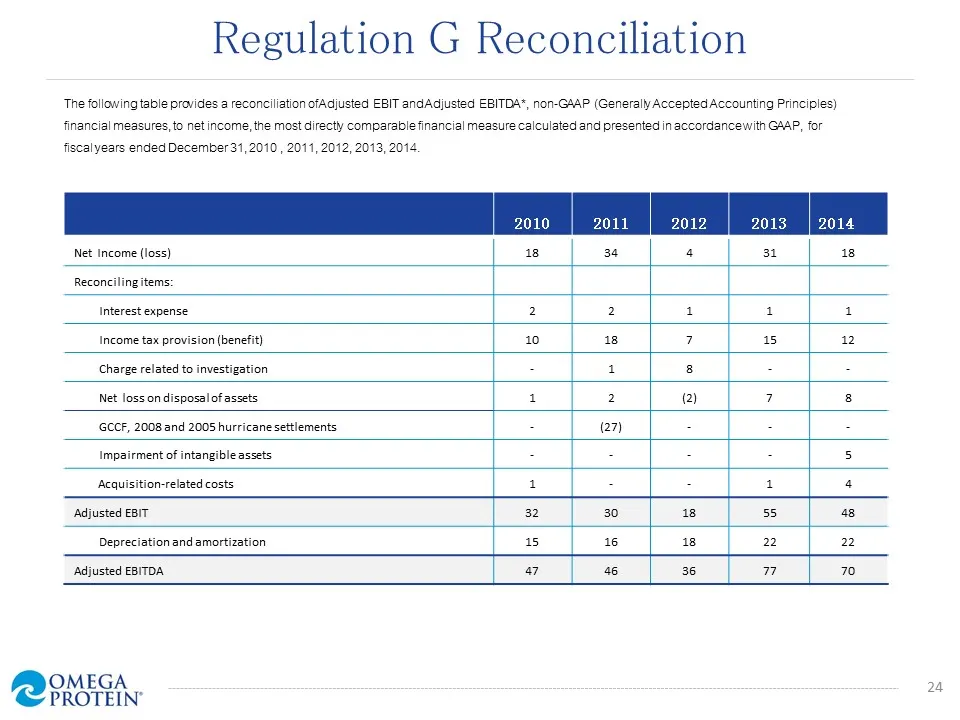
Slide 24: Regulation G Reconciliation
Regulation G Reconciliation ‘The following table provides reconciliation ofAdjusted EBIT andAdjusted EBITDA*, non-GAAP (Generally Accepted Accounting Principles) financial measures, to net income, the most directly comparable financial measure calculated and presented in accordancewith GAAP, for fis
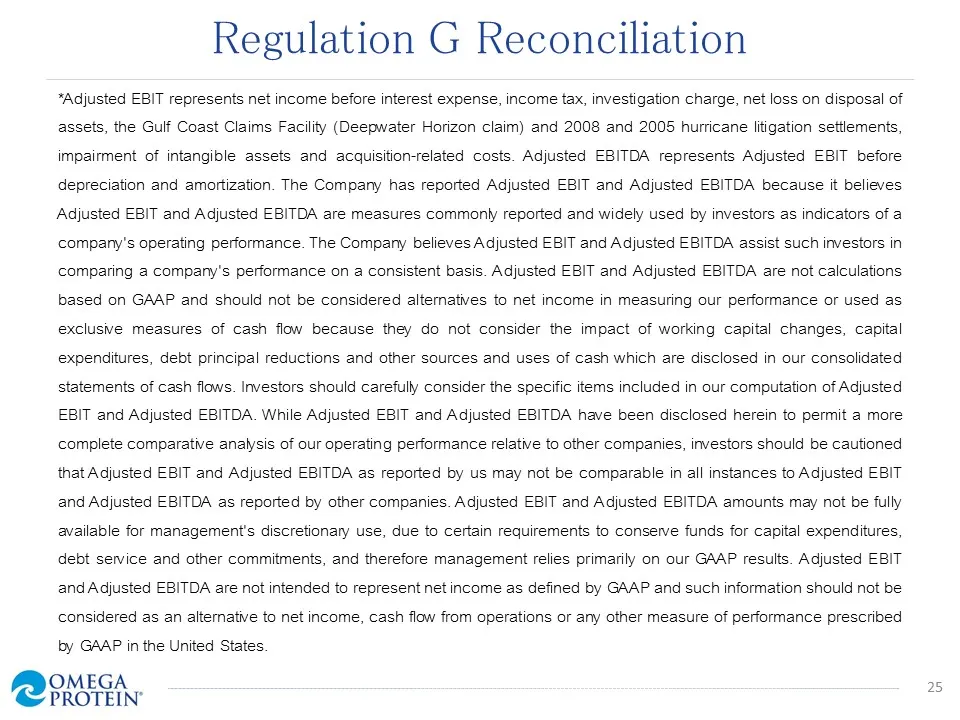
Slide 25: Regulation G Reconciliation
Regulation G Reconciliation *Adjusted EBIT represents net income before interest expense, income tax, investigation charge, net loss on disposal of assets, the Gulf Coast Claims Facility (Deepwater Horizon claim) and 2008 and 2005 hurricane litigation settlements, impairment of intangible assets and
Source: SEC EDGAR · 8-K filed May 19, 2015
More decks from Omega Protein Corp
 Investor Presentation (May 2017)27 slides · May 17, 2017
 Investor Presentation (January 2017)27 slides · Jan 11, 2017
 Proxy Contest (June 2016)48 slides · Jun 8, 2016
 Proxy Contest (June 2016)36 slides · Jun 7, 2016
 Investor Presentation (May 2016)29 slides · May 18, 2016
 Investor Presentation (September 2015)25 slides · Sep 17, 2015