Waste Services — Investor Presentation (October 2006)
17 slides from Waste Services's investor presentation, Oct 23, 2006
Slide 1: Waste Services, Inc. Investor Presentation October 2006
Waste Services, Inc. Investor Presentation October 2006
Slide 2: Safe Harbor for Forward-Looking Statements
Safe Harbor for Forward-Looking Statements Certain matters discussed in this presentation are "forward-looking statements" within the meaning of Section 27A of the Securities Act of 1933 and Section 21E of the Securities Exchange Act of 1934. These statements describe the company's future plans, obj
Slide 3: Company Overview
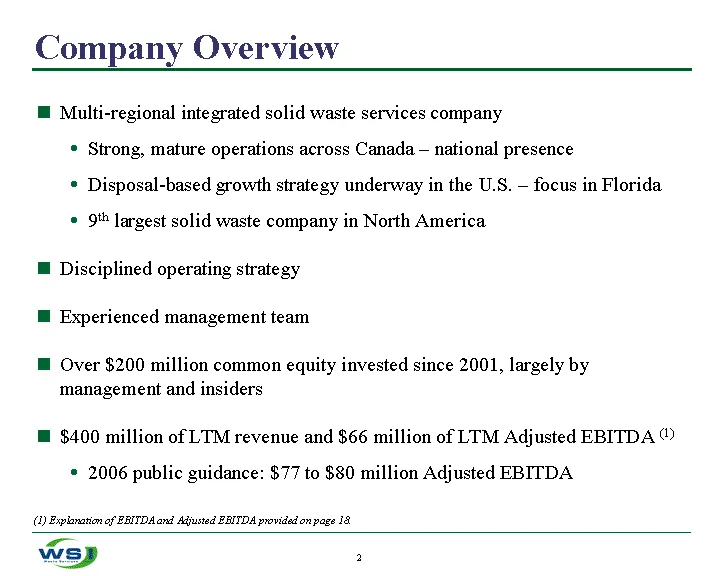
Company Overview Multi-regional integrated solid waste services company Strong, mature operations across Canada - national presence Disposal-based growth strategy underway in the U.S. - focus in Florida 9th largest solid waste company in North America Disciplined operating strategy Experienced manag
Slide 4: Business Overview
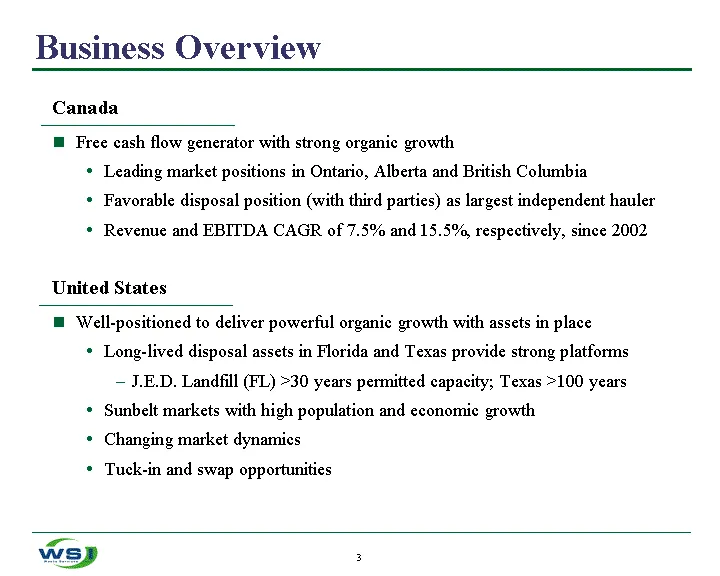
Business Overview Canada Free cash flow generator with strong organic growth Leading market positions in Ontario, Alberta and British Columbia Favorable disposal position (with third parties) as largest independent hauler Revenue and EBITDA CAGR of 7.5% and 15.5%, respectively, since 2002 United Sta
Slide 5: Company Overview: Recent History of Waste Services, Inc.
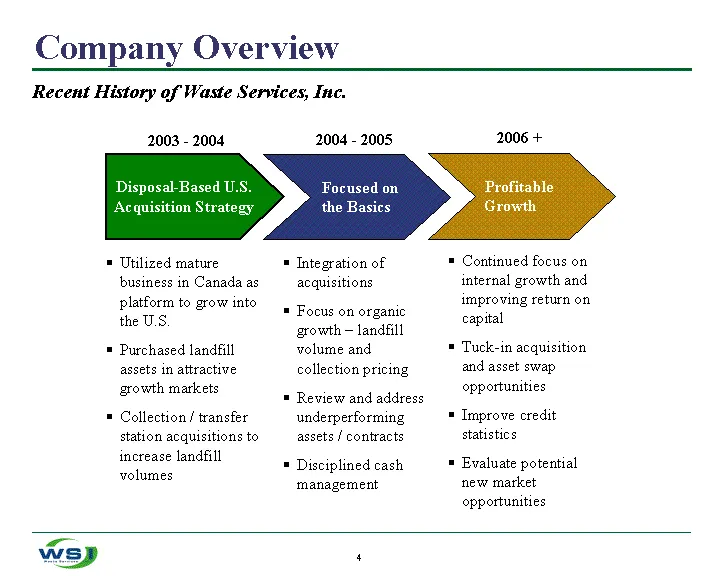
Company Overview 2003 - 2004 Utilized mature business in Canada as platform to grow into the U.S. Purchased landfill assets in attractive growth markets Collection / transfer station acquisitions to increase landfill volumes 2006 + Continued focus on internal growth and improving return on capital T
Slide 6: Senior Management Team
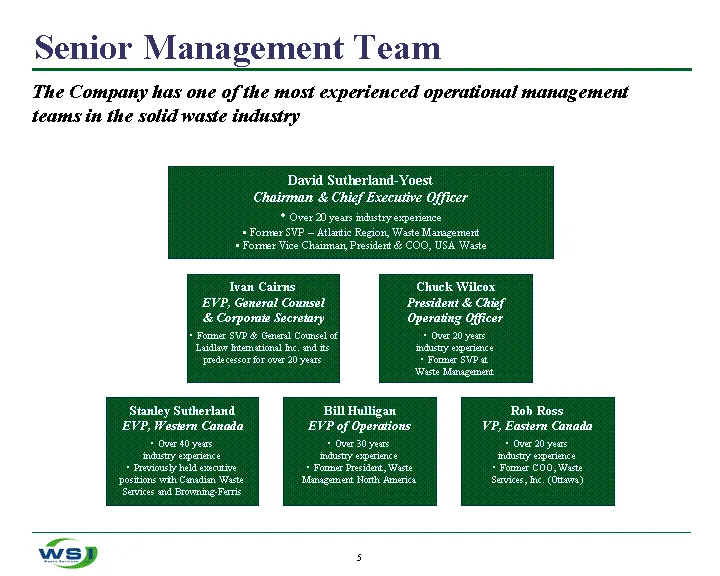
Senior Management Team The Company has one of the most experienced operational management teams in the solid waste industry David Sutherland-Yoest Chairman & Chief Executive Officer Over 20 years industry experience Former SVP - Atlantic Region, Waste Management Former Vice Chairman, President & COO
Slide 7: Diversified Revenue Base
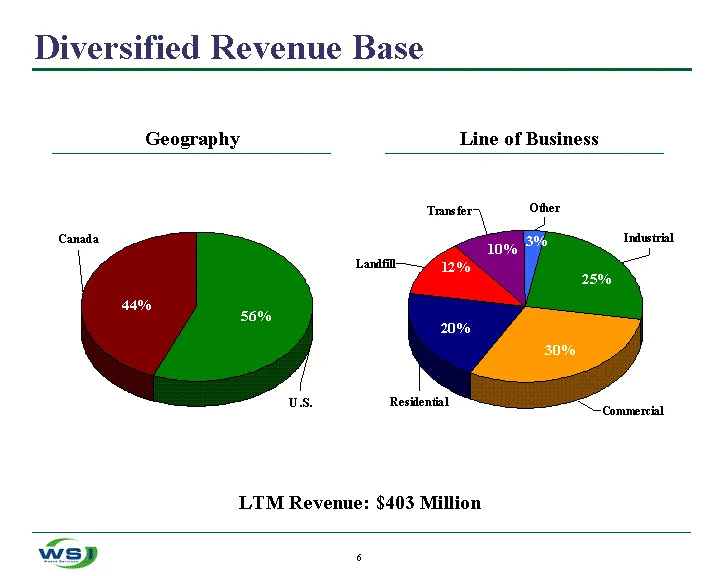
Diversified Revenue Base Geography Line of Business LTM Revenue: $403 Million
Slide 8: Key Profit Growth Drivers
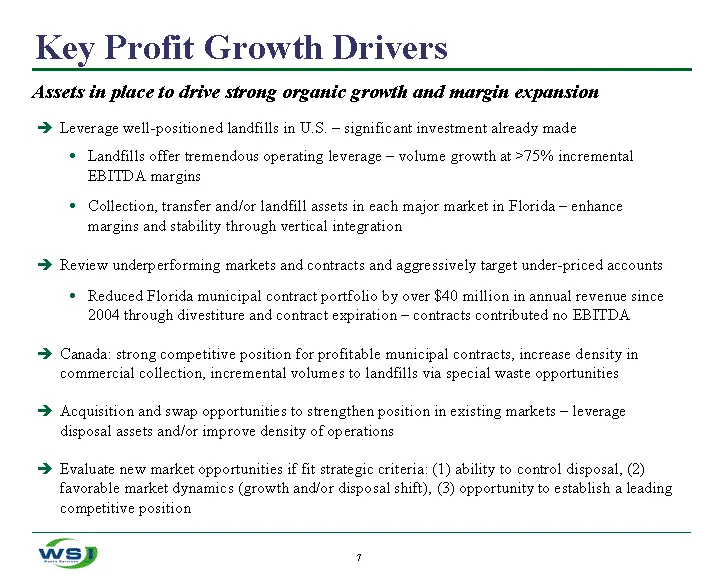
Key Profit Growth Drivers Leverage well-positioned landfills in U.S. - significant investment already made Landfills offer tremendous operating leverage - volume growth at >75% incremental EBITDA margins Collection, transfer and/or landfill assets in each major market in Florida - enhance margins an
Slide 9: Recent Company Highlights
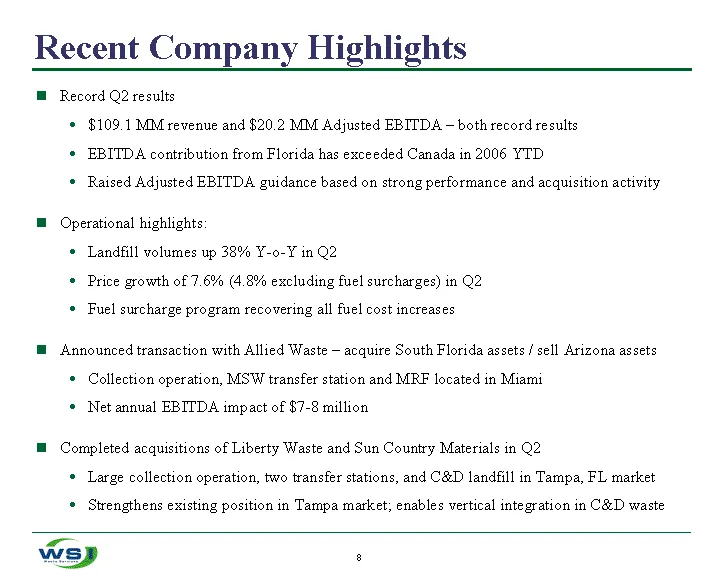
Recent Company Highlights Record Q2 results $109.1 MM revenue and $20.2 MM Adjusted EBITDA - both record results EBITDA contribution from Florida has exceeded Canada in 2006 YTD Raised Adjusted EBITDA guidance based on strong performance and acquisition activity Operational highlights: Landfill volu
Slide 10: Canada Operations - Western Canada
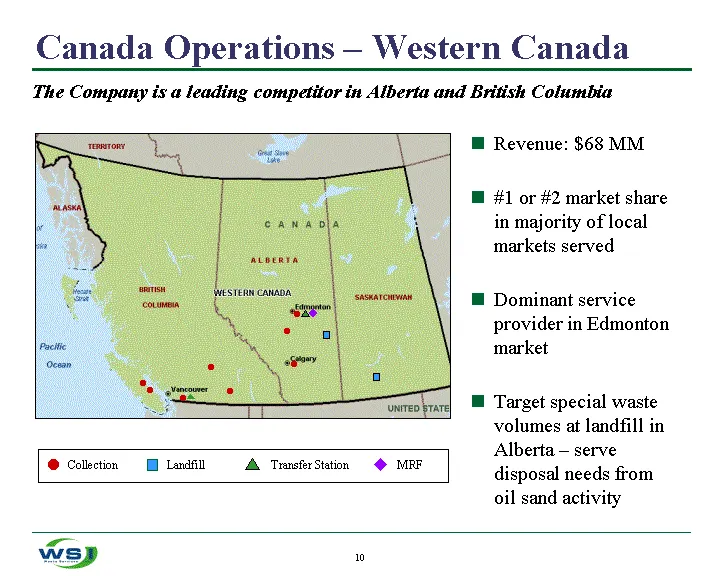
Canada Operations - Western Canada Revenue: $68 MM #1 or #2 market share in majority of local markets served Dominant service provider in Edmonton market Target special waste volumes at landfill in Alberta - serve disposal needs from oil sand activity The Company is a leading competitor in Alberta a
Slide 11: Florida Operations
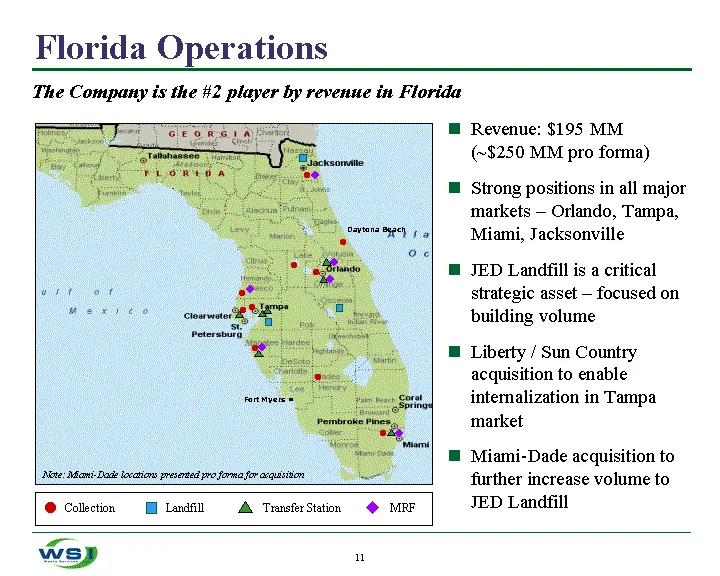
Florida Operations Revenue: $195 MM (~$250 MM pro forma) Strong positions in all major markets - Orlando, Tampa, Miami, Jacksonville JED Landfill is a critical strategic asset - focused on building volume Liberty / Sun Country acquisition to enable internalization in Tampa market Miami-Dade acquisit
Slide 12: South Florida / Arizona Transaction
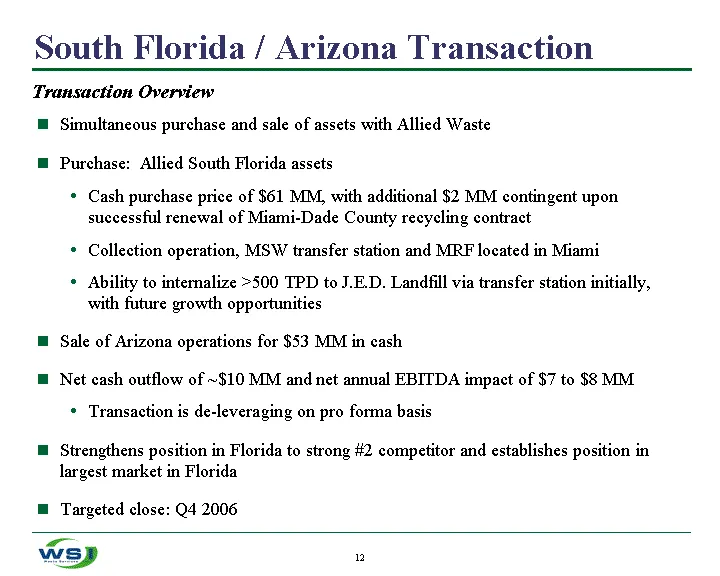
South Florida / Arizona Transaction Simultaneous purchase and sale of assets with Allied Waste Purchase: Allied South Florida assets Cash purchase price of $61 MM, with additional $2 MM contingent upon successful renewal of Miami-Dade County recycling contract Collection operation, MSW transfer stat
Slide 13: Texas Operations: Fort Bend Regional Landfill
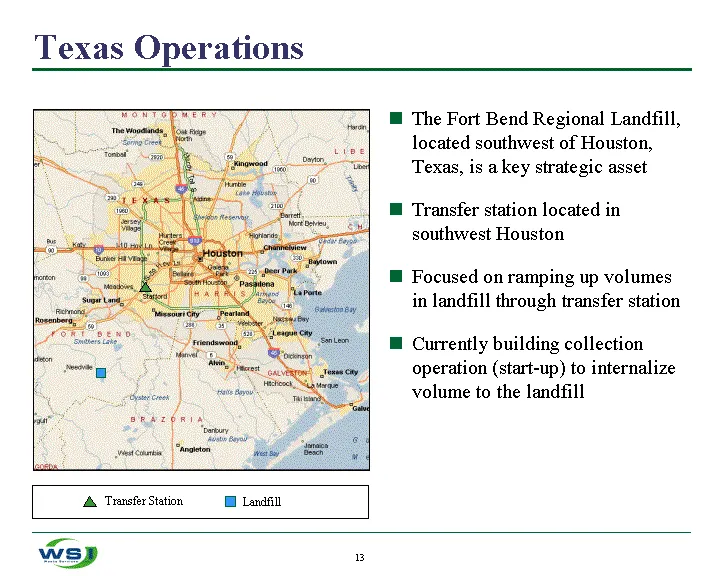
The Fort Bend Regional Landfill, located southwest of Houston, Texas, is a key strategic asset Transfer station located in southwest Houston Focused on ramping up volumes in landfill through transfer station Currently building collection operation (start-up) to internalize volume to the landfill Tex
Slide 14: Financial Summary
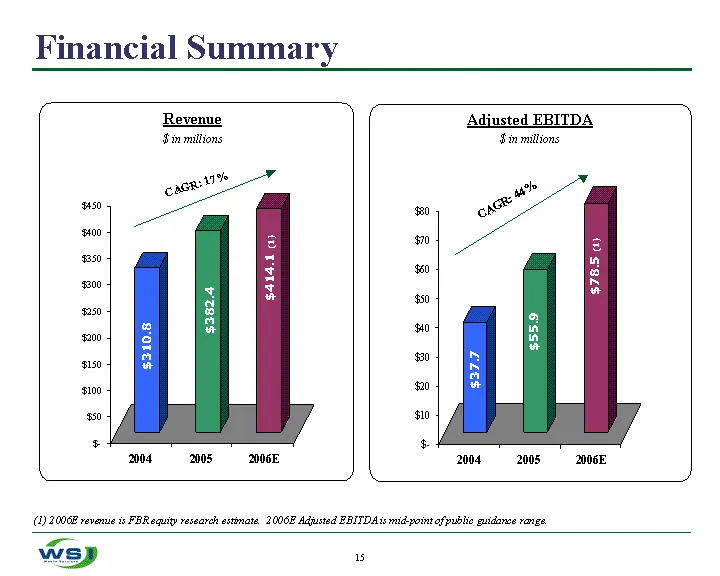
Financial Summary (1) 2006E revenue is FBR equity research estimate. 2006E Adjusted EBITDA is mid-point of public guidance range. $78.5 (1) $55.9 $382.4 $414.1 (1) $310.8 CAGR: 17% CAGR: 44% $37.7 Revenue $ in millions Adjusted EBITDA $ in millions
Slide 15: LTM Financials by Region
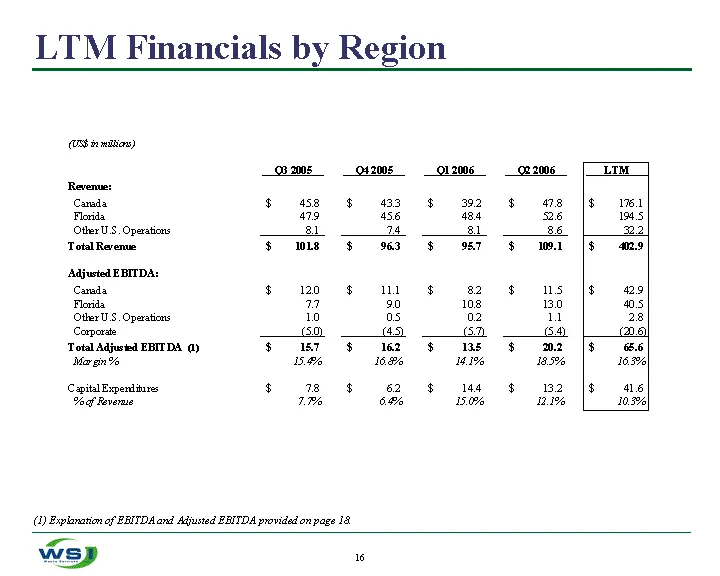
LTM Financials by Region (1) Explanation of EBITDA and Adjusted EBITDA provided on page 18.
Slide 16: Capitalization and Credit Statistics
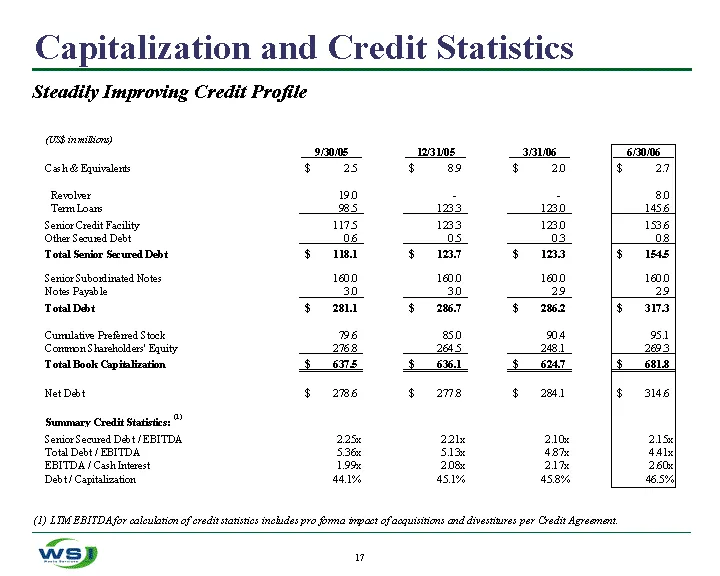
Capitalization and Credit Statistics Steadily Improving Credit Profile (1) LTM EBITDA for calculation of credit statistics includes pro forma impact of acquisitions and divestitures per Credit Agreement.
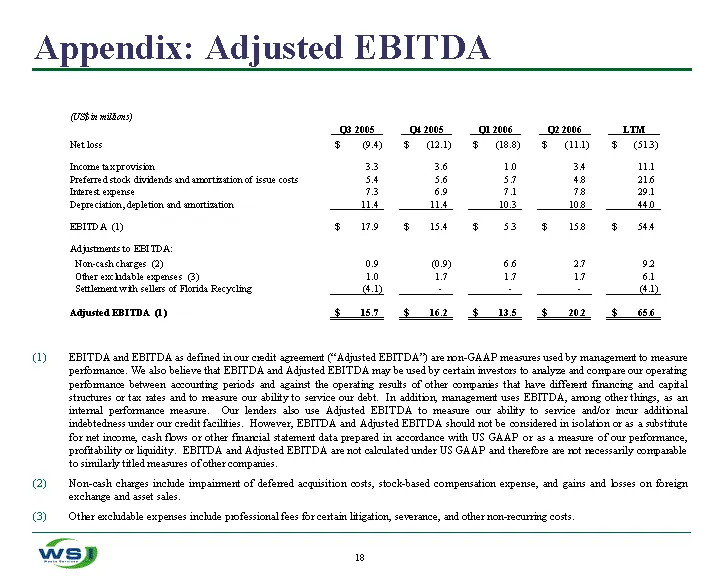
Slide 17: Appendix: Adjusted EBITDA
Appendix: Adjusted EBITDA EBITDA and EBITDA as defined in our credit agreement ("Adjusted EBITDA") are non-GAAP measures used by management to measure performance. We also believe that EBITDA and Adjusted EBITDA may be used by certain investors to analyze and compare our operating performance betwee
Source: SEC EDGAR · 8-K filed Oct 23, 2006
More decks from Waste Services Inc
 Investor Presentation (December 2008)39 slides · Dec 3, 2008
 Investor Presentation (August 2008)26 slides · Aug 7, 2008
 Credit Suisse Engineering & Environmental Services Conference 200729 slides · Jun 7, 2007
 Investor Presentation (November 2006)21 slides · Nov 28, 2006
 Investor Presentation (May 2006)21 slides · May 17, 2006
 Investor Presentation (March 2006)20 slides · Mar 15, 2006