Waste Services — Investor Presentation (December 2008)
39 slides from Waste Services's investor presentation, Dec 3, 2008
Slide 1: Waste Services Inc. Investor Presentation
Waste Services Inc. Investor Presentation
Slide 2: Safe Harbor for Forward-Looking Statements
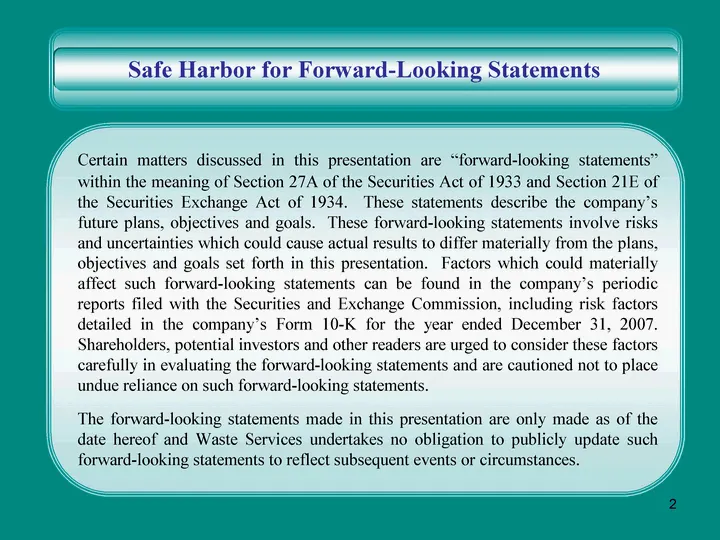
Safe Harbor for Forward-Looking Statements Certain matters discussed in this presentation are "forward-looking statements" within the meaning of Section 27A of the Securities Act of 1933 and Section 21E of the Securities Exchange Act of 1934. These statements describe the company's future plans, obj
Slide 3: Company Overview
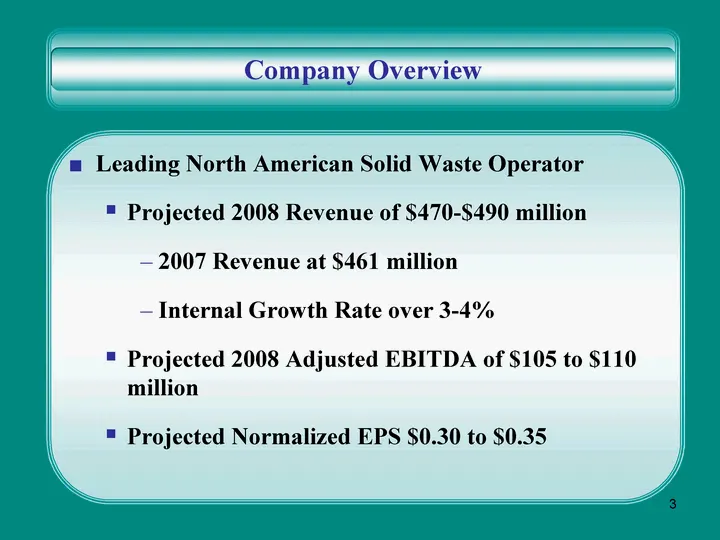
Company Overview Leading North American Solid Waste Operator Projected 2008 Revenue of $470-$490 million 2007 Revenue at $461 million Internal Growth Rate over 3-4% Projected 2008 Adjusted EBITDA of $105 to $110 million Projected Normalized EPS $0.30 to $0.35
Slide 4: Company Overview: Refinanced Credit Facilities
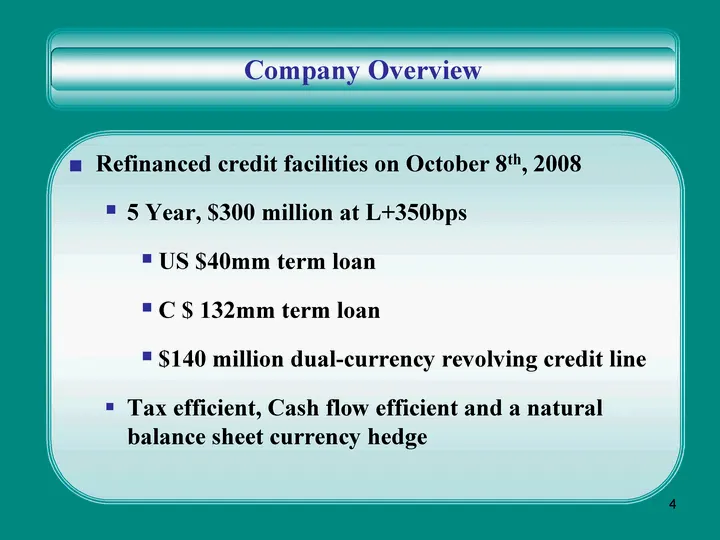
Company Overview Refinanced credit facilities on October 8th, 2008 5 Year, $300 million at L+350bps US $40mm term loan C $ 132mm term loan $140 million dual-currency revolving credit line Tax efficient, Cash flow efficient and a natural balance sheet currency hedge
Slide 5: Key Strategy - Operate in Markets with Competitive Advantages
Key Strategy - operate in markets where we can obtain competitive advantages Operational economies of scale Preferential disposal alternatives Successful business model concentrated in three vertically-integrated regions Eastern Canada - Ontario Western Canada - Alberta and British Columbia Florida
Slide 6: Company History
Formerly Known As Capital Environmental Resource Inc. Formed from merger spin-offs in Canada IPO June 1999 Ill-fated U.S. Expansion, flawed business plan Change in Control September 2001 Replacement of Board and Key management positions Migration to U.S. Corp in July 2004 - NASDAQ WSII Company Overv
Slide 7: Key Acquisitions since September 2001
Key Acquisitions since September 2001 WSI landfill in Ottawa February 2002 JED landfill in Florida May 2003 Allied North and Central Florida December 2003 Florida Recycling Services April 2004 Company Overview
Slide 8: Key Acquisitions since September 2001 (continued)
Key Acquisitions since September 2001 (continued) Liberty Hauling May 2006 Sun Country Landfill June 2006 SLD landfill and Pro Disposal December 2006 Allied Miami March 2007 WCA West Florida operation June 2007 Company Overview
Slide 9: Senior Management Team
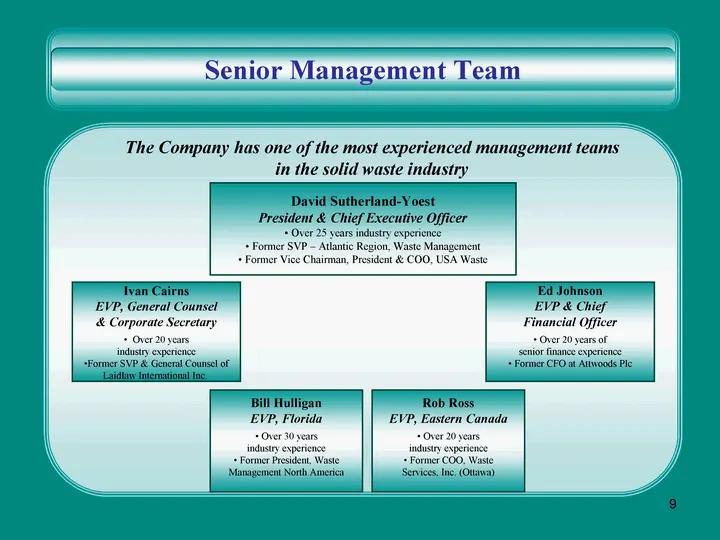
Senior Management Team The Company has one of the most experienced management teams in the solid waste industry David Sutherland-Yoest President & Chief Executive Officer Over 25 years industry experience Former SVP - Atlantic Region, Waste Management Former Vice Chairman, President & COO, USA Waste
Slide 10: Diversified Revenue Base
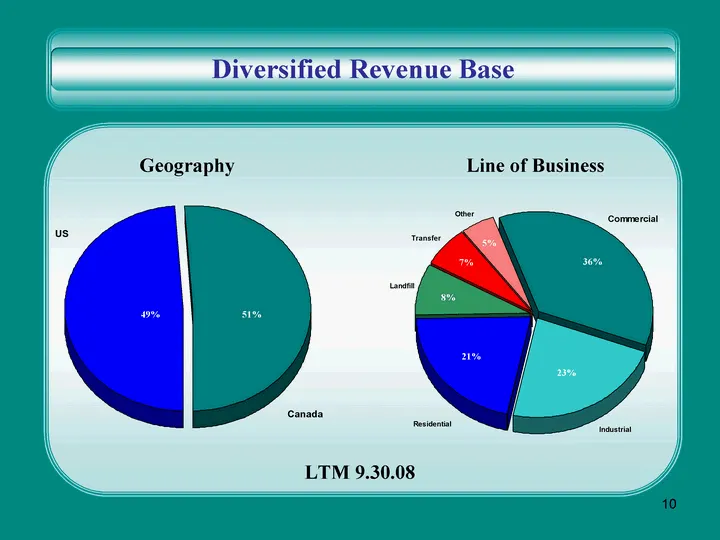
Diversified Revenue Base Geography Line of Business LTM 9.30.08
Slide 11: Business Overview: Canada
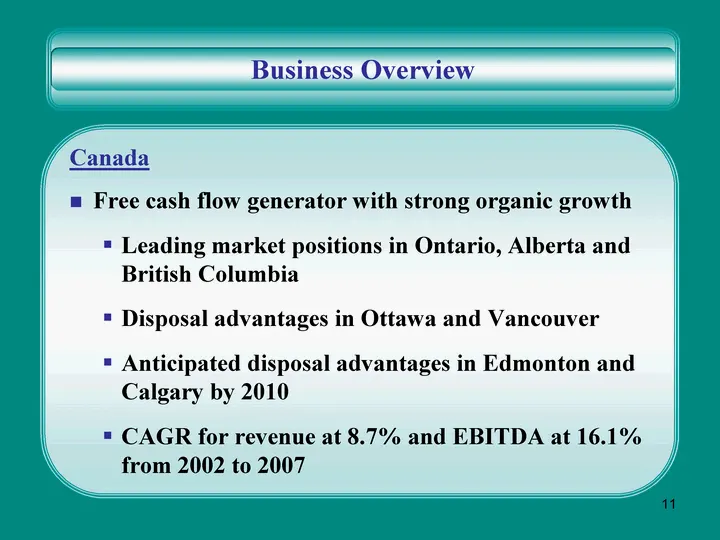
Business Overview Canada Free cash flow generator with strong organic growth Leading market positions in Ontario, Alberta and British Columbia Disposal advantages in Ottawa and Vancouver Anticipated disposal advantages in Edmonton and Calgary by 2010 CAGR for revenue at 8.7% and EBITDA at 16.1% from
Slide 12: Business Overview: United States
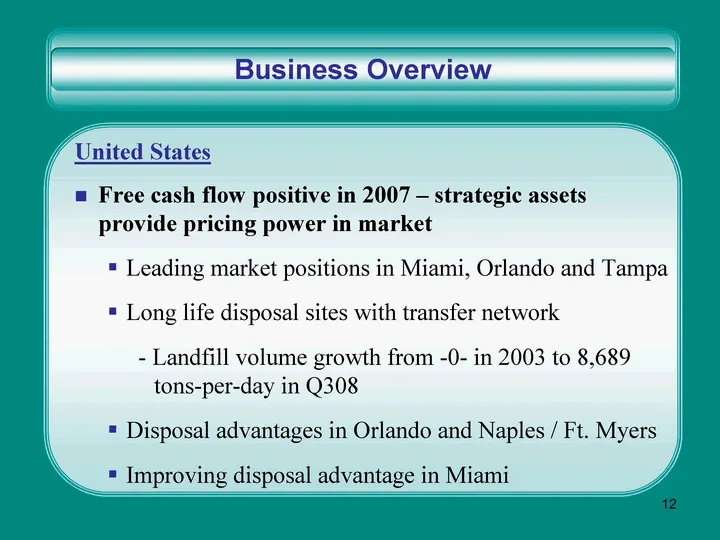
United States Free cash flow positive in 2007 - strategic assets provide pricing power in market Leading market positions in Miami, Orlando and Tampa Long life disposal sites with transfer network - - Landfill volume growth from -0- in 2003 to 8,689 tons-per-day in Q308 Disposal advantages in Orland
Slide 13: Canadian Market
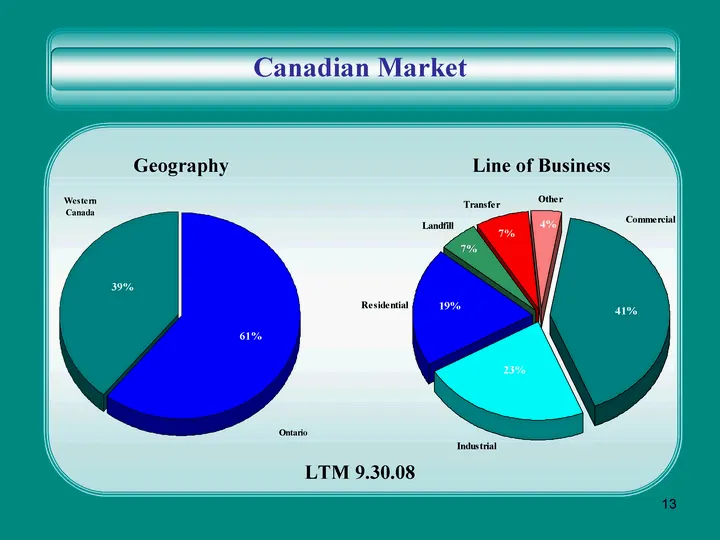
Canadian Market Geography Line of Business LTM 9.30.08
Slide 14: Canadian Strategy
Canadian Strategy Repeatable, predictable revenue stream Consistent price increases since inception Internal Revenue growth 12% from 2006 to 2007 - 11.8% YTD 2008 Gain critical regional collection density & market share Leading market share in local markets Operating cost levels provide competitive
Slide 15: Canadian Strategy: Upside to Revenue and Margin
Canadian Strategy Upside to revenue base and profit margin EBITDA Margin improved from 22.3% to 25.7% from 2004 to 2007 Pricing leverage remains strong Organic growth prospects remain strong Cost reductions under way New transfer station in Ottawa with long-term disposal source Coronation Landfill p
Slide 16: Canada Operations - Eastern Canada
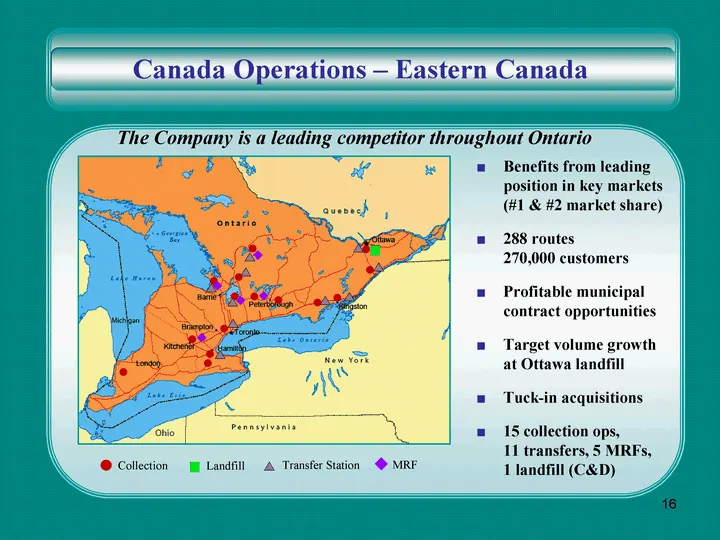
Canada Operations - Eastern Canada Benefits from leading position in key markets (#1 & #2 market share) 288 routes 270,000 customers Profitable municipal contract opportunities Target volume growth at Ottawa landfill Tuck-in acquisitions 15 collection ops, 11 transfers, 5 MRFs, 1 landfill (C&D) The
Slide 17: Canada Operations - Western Canada
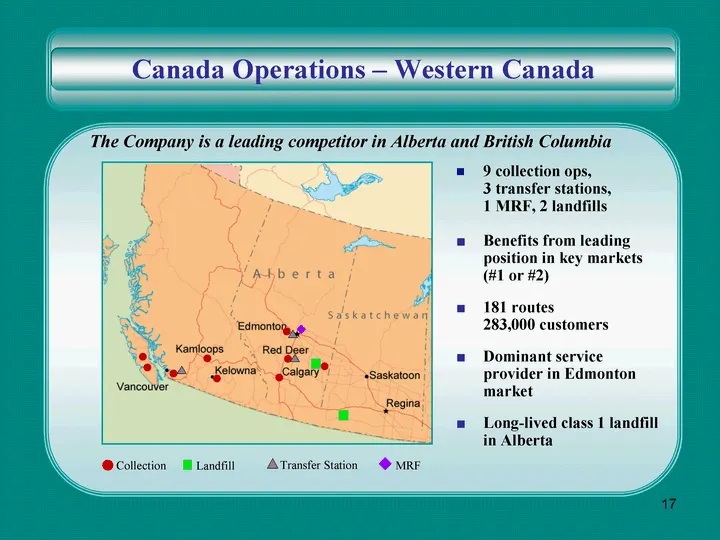
Canada Operations - Western Canada The Company is a leading competitor in Alberta and British Columbia ? ? ? ? ? ? ? ? ? 9 collection ops, 3 transfer stations, 1 MRF, 2 landfills Benefits from leading position in key markets (#1 or #2) 181 routes 283,000 customers Dominant service provider in Edmont
Slide 18: United States Market
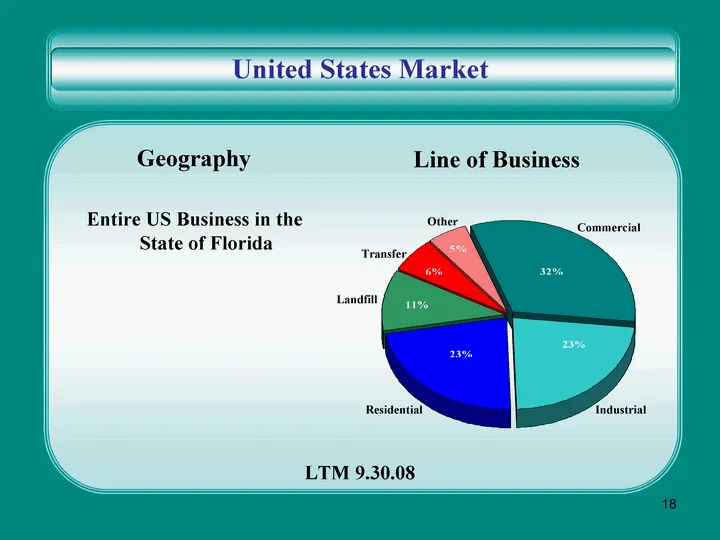
United States Market Geography Line of Business Entire US Business in the State of Florida Commercial Landfill Residential Industrial Transfer Other LTM 9.30.08
Slide 19: United States Strategy
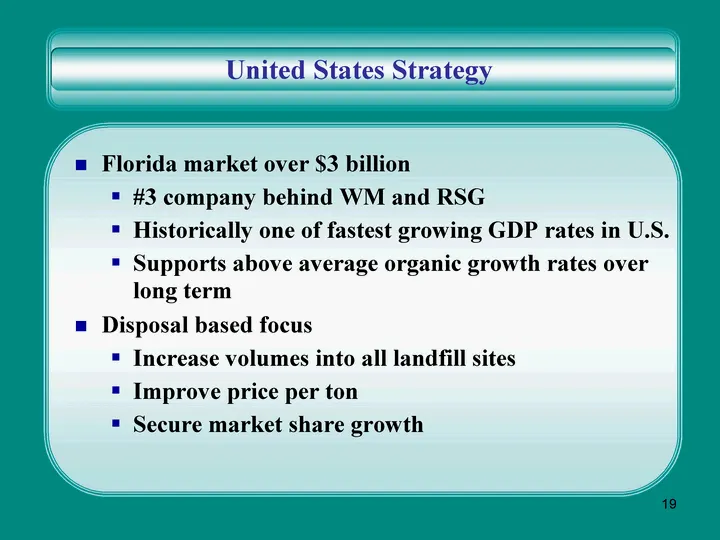
United States Strategy Florida market over $3 billion #3 company behind WM and RSG Historically one of fastest growing GDP rates in U.S. Supports above average organic growth rates over long term Disposal based focus Increase volumes into all landfill sites Improve price per ton Secure market share
Slide 20: United States Strategy: Margin Improvement
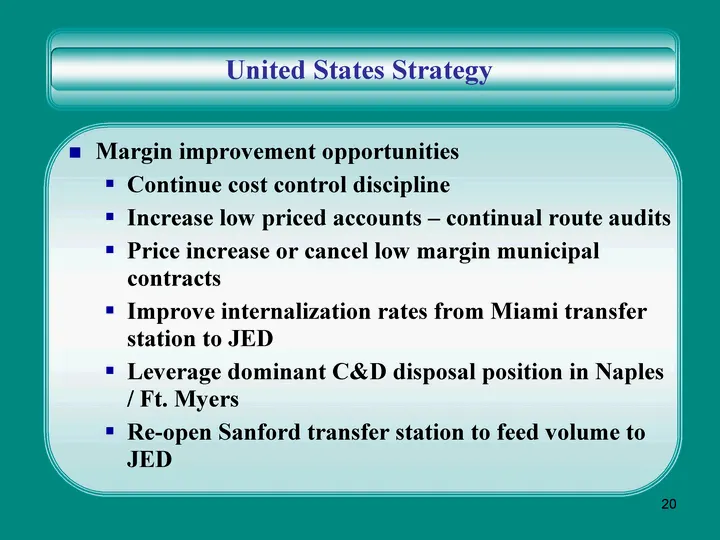
United States Strategy Margin improvement opportunities Continue cost control discipline Increase low priced accounts - continual route audits Price increase or cancel low margin municipal contracts Improve internalization rates from Miami transfer station to JED Leverage dominant C&D disposal posit
Slide 21: Florida Operations
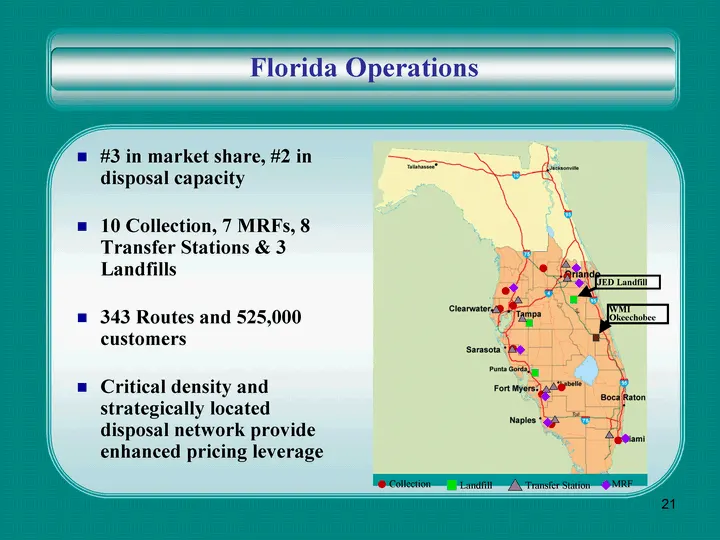
Florida Operations #3 in market share, #2 in disposal capacity 10 Collection, 7 MRFs, 8 Transfer Stations & 3 Landfills 343 Routes and 525,000 customers Critical density and strategically located disposal network provide enhanced pricing leverage ? ? ? ? ? ? ? ? ? ? ? ? ? ? ? JED Landfill WMI Okeech
Slide 22: Current Operating Environment: Headwinds
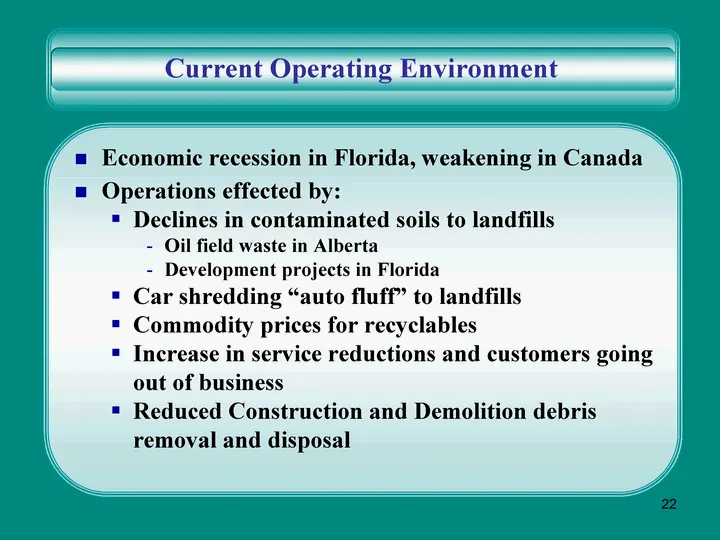
Current Operating Environment Economic recession in Florida, weakening in Canada Operations effected by: Declines in contaminated soils to landfills Oil field waste in Alberta Development projects in Florida Car shredding "auto fluff" to landfills Commodity prices for recyclables Increase in service
Slide 23: Current Operating Environment: Protections
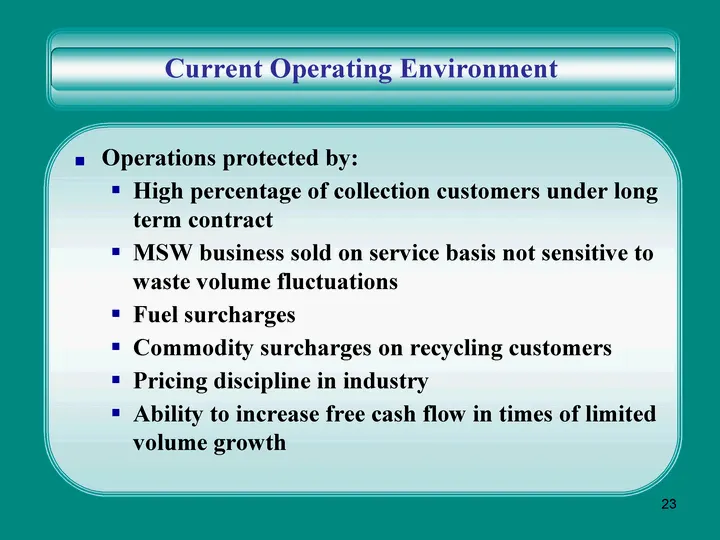
Current Operating Environment Operations protected by: High percentage of collection customers under long term contract MSW business sold on service basis not sensitive to waste volume fluctuations Fuel surcharges Commodity surcharges on recycling customers Pricing discipline in industry Ability to
Slide 24: Operating Initiatives: Cost Management
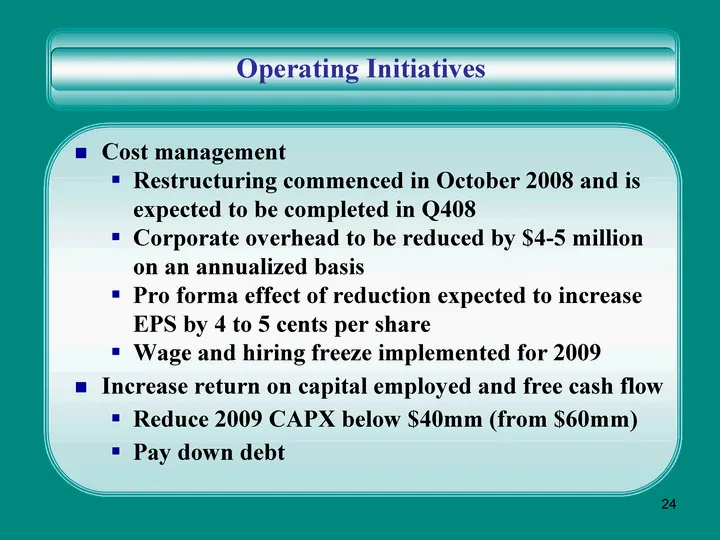
Operating Initiatives Cost management Restructuring commenced in October 2008 and is expected to be completed in Q408 Corporate overhead to be reduced by $4-5 million on an annualized basis Pro forma effect of reduction expected to increase EPS by 4 to 5 cents per share Wage and hiring freeze implem
Slide 25: Operating Initiatives: Revenue Management
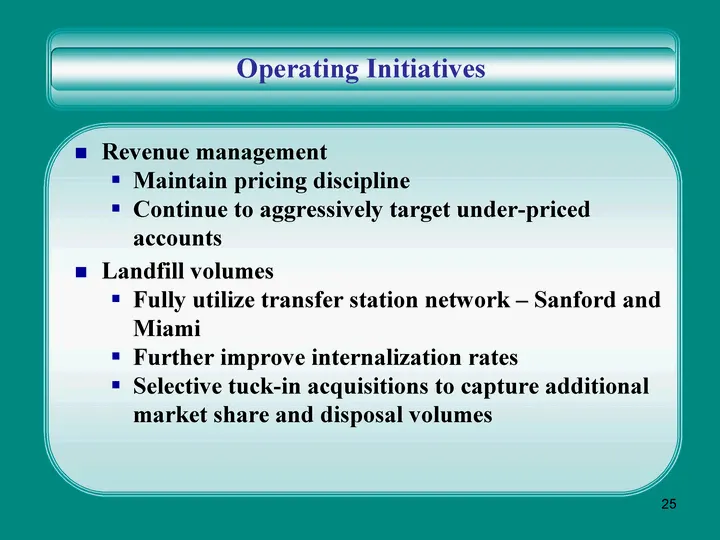
Operating Initiatives Revenue management Maintain pricing discipline Continue to aggressively target under-priced accounts Landfill volumes Fully utilize transfer station network - Sanford and Miami Further improve internalization rates Selective tuck-in acquisitions to capture additional market sha
Slide 26: WSI Finance
WSI FINANCE
Slide 27: Key Operating Trends: Strong Price Increase Results
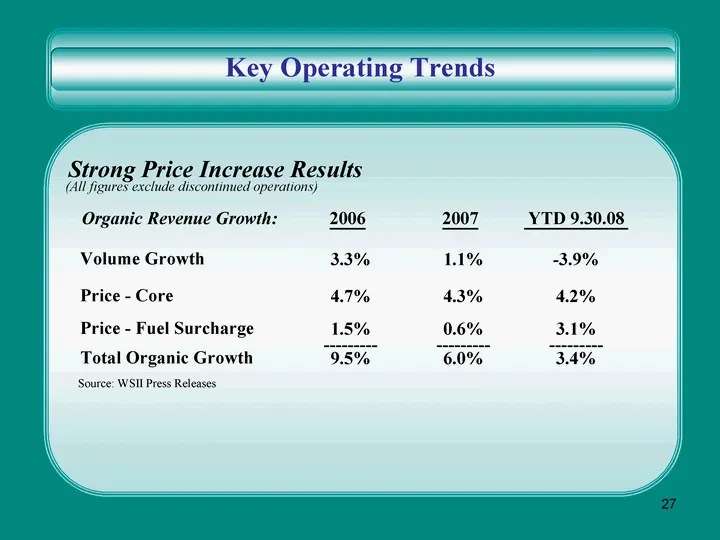
Key Operating Trends Strong Price Increase Results (All figures exclude discontinued operations)
Slide 28: Key Operating Trends: Consistent Improvement in Performance
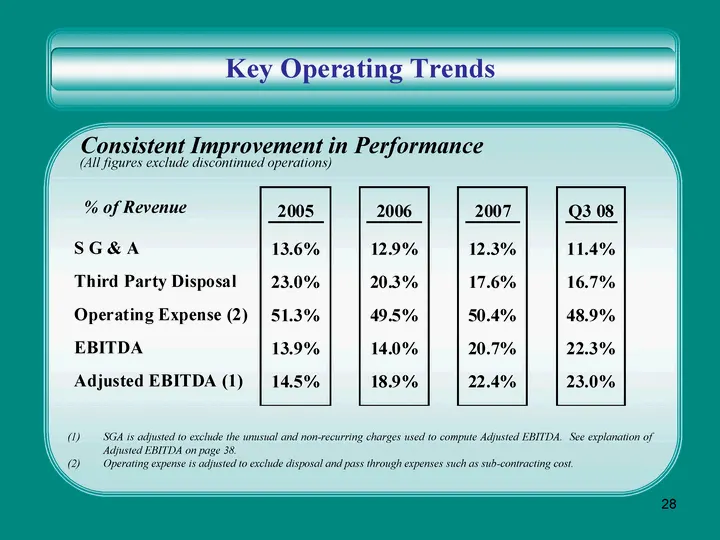
Key Operating Trends Consistent Improvement in Performance SGA is adjusted to exclude the unusual and non-recurring charges used to compute Adjusted EBITDA. See explanation of Adjusted EBITDA on page 38. Operating expense is adjusted to exclude disposal and pass through expenses such as sub-contract
Slide 29: Financial Summary
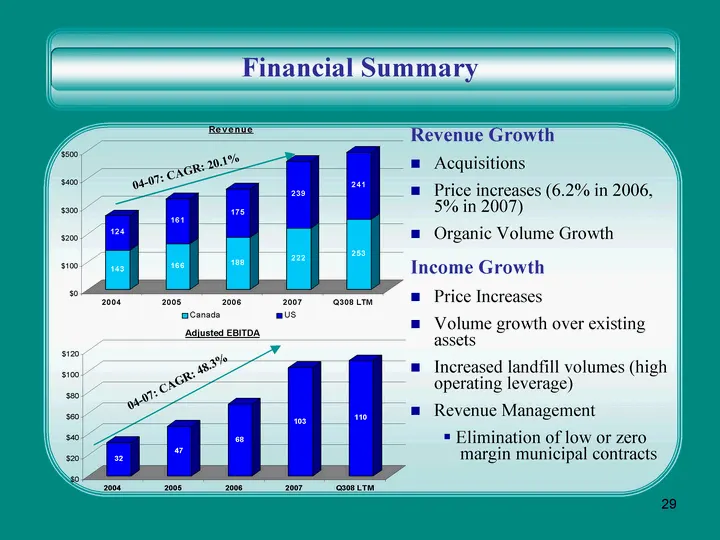
Financial Summary 04-07: CAGR: 20.1% 04-07: CAGR: 48.3% Adjusted EBITDA Revenue Growth Acquisitions Price increases (6.2% in 2006, 5% in 2007) Organic Volume Growth Income Growth Price Increases Volume growth over existing assets Increased landfill volumes (high operating leverage) Revenue Managemen
Slide 30: Interest and Taxes
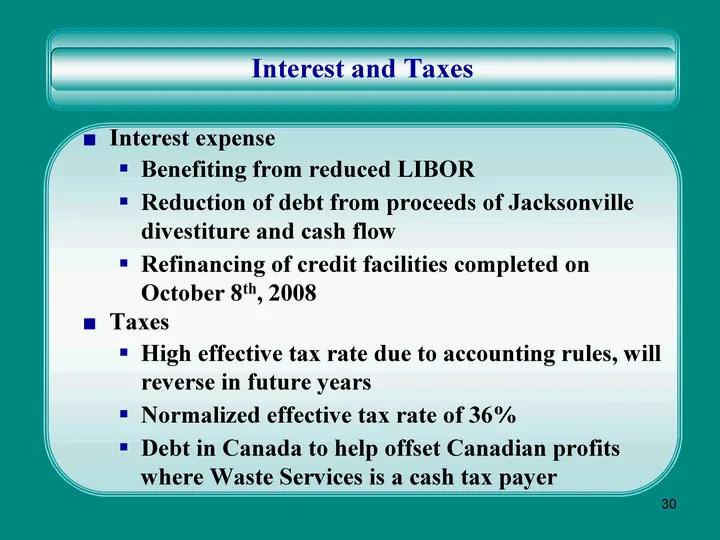
Interest and Taxes Interest expense Benefiting from reduced LIBOR Reduction of debt from proceeds of Jacksonville divestiture and cash flow Refinancing of credit facilities completed on October 8th, 2008 Taxes High effective tax rate due to accounting rules, will reverse in future years Normalized e
Slide 31: Road Map to Profits
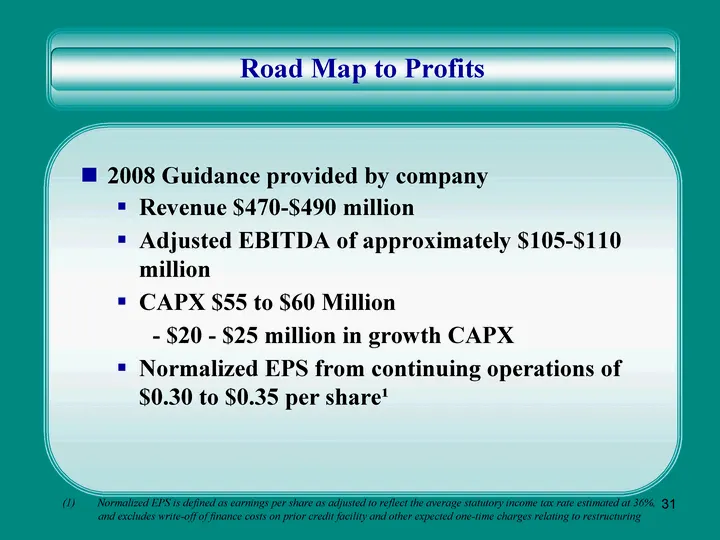
Road Map to Profits 2008 Guidance provided by company Revenue $470-$490 million Adjusted EBITDA of approximately $105-$110 million CAPX $55 to $60 Million - - $20 - $25 million in growth CAPX Normalized EPS from continuing operations of $0.30 to $0.35 per share1 (1) Normalized EPS is defined as earn
Slide 32: Adjusted EBITDA Trend
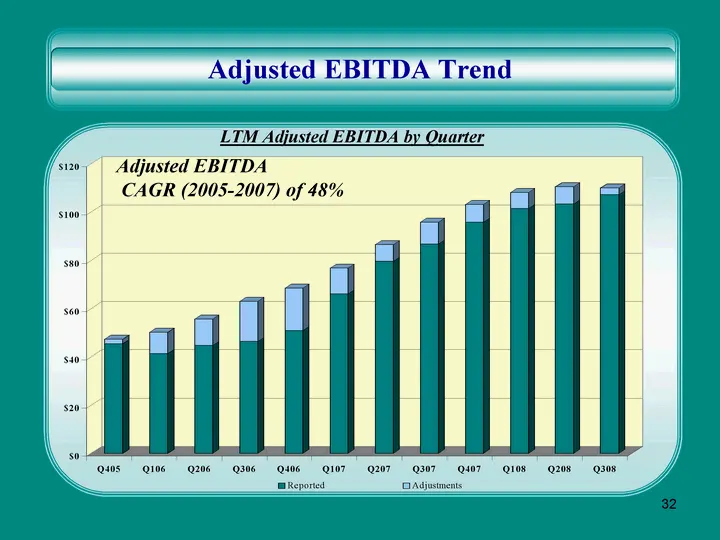
Adjusted EBITDA Trend Adjusted EBITDA CAGR (2005-2007) of 48% LTM Adjusted EBITDA by Quarter
Slide 33: Investor Considerations
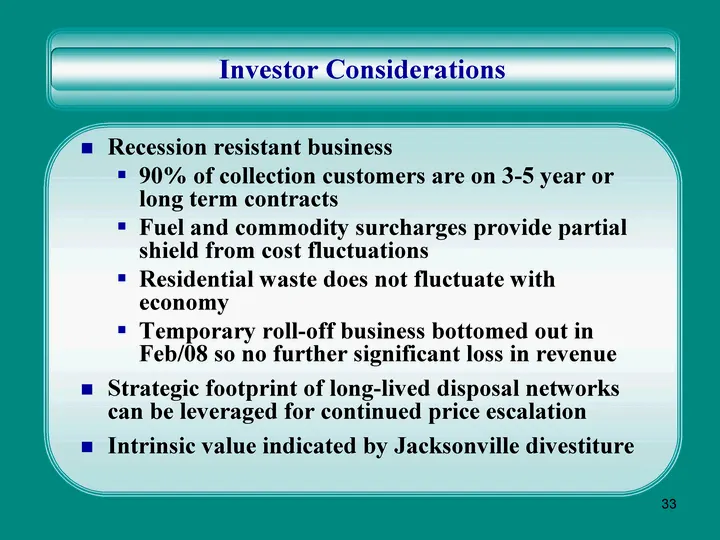
Investor Considerations Recession resistant business 90% of collection customers are on 3-5 year or long term contracts Fuel and commodity surcharges provide partial shield from cost fluctuations Residential waste does not fluctuate with economy Temporary roll-off business bottomed out in Feb/08 so
Slide 34: Financial Summary
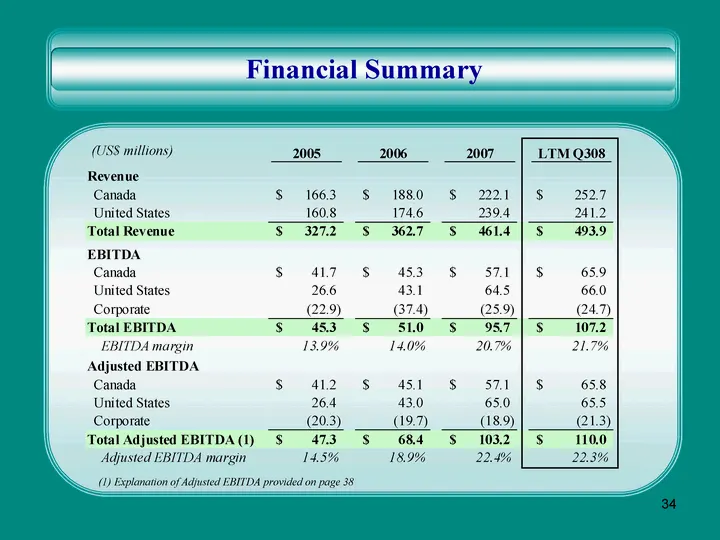
Financial Summary (1) Explanation of Adjusted EBITDA provided on page 38 (US$ millions)
Slide 35: Refinancing
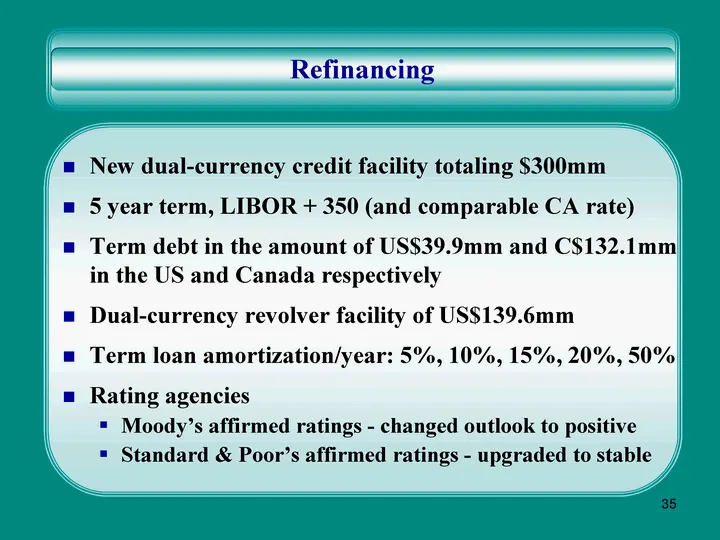
Refinancing New dual-currency credit facility totaling $300mm 5 year term, LIBOR + 350 (and comparable CA rate) Term debt in the amount of US$39.9mm and C$132.1mm in the US and Canada respectively Dual-currency revolver facility of US$139.6mm Term loan amortization/year: 5%, 10%, 15%, 20%, 50% Ratin
Slide 36: Capitalization and Credit Statistics
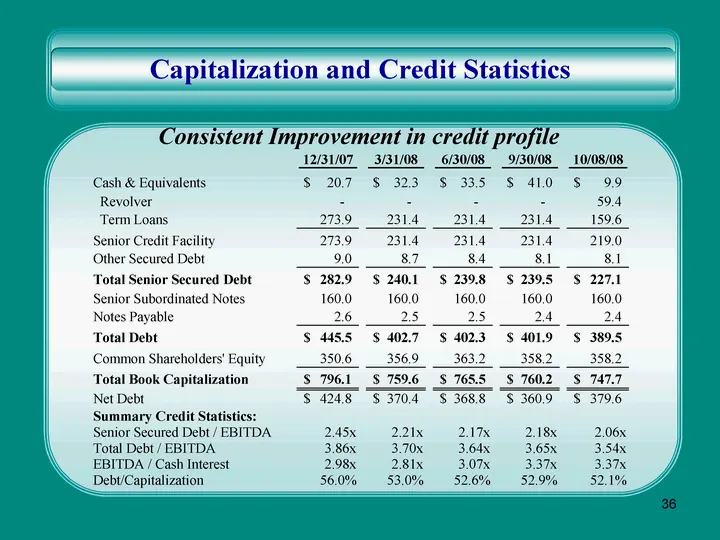
Capitalization and Credit Statistics Consistent Improvement in credit profile
Slide 37: Key Investment Themes
Key Investment Themes Stock price at substantial discount to intrinsic value Long-lived disposal assets in attractive markets Stable revenue and cash flow streams Recession-resistant business, providing a necessary and essential service Diversified revenue by geography, waste stream and customer Maj
Slide 38: Explanation of Adjusted EBITDA
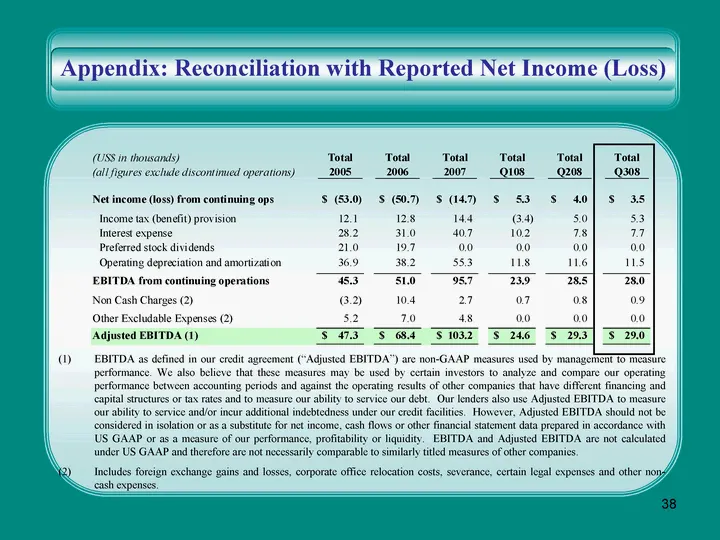
EBITDA as defined in our credit agreement ("Adjusted EBITDA") are non-GAAP measures used by management to measure performance. We also believe that these measures may be used by certain investors to analyze and compare our operating performance between accounting periods and against the operating re
Slide 39: Waste Services Inc.
Waste Services Inc. Waste Services, Disposal and Recycling
Source: SEC EDGAR · 8-K filed Dec 3, 2008
More decks from Waste Services Inc
 Investor Presentation (August 2008)26 slides · Aug 7, 2008
 Credit Suisse Engineering & Environmental Services Conference 200729 slides · Jun 7, 2007
 Investor Presentation (November 2006)21 slides · Nov 28, 2006
 Investor Presentation (October 2006)17 slides · Oct 23, 2006
 Investor Presentation (May 2006)21 slides · May 17, 2006
 Investor Presentation (March 2006)20 slides · Mar 15, 2006