Strategic Hotels and Resorts Inc
Strategic Hotels and Resorts — Investor Presentation (May 2009)
13 slides from Strategic Hotels and Resorts's investor presentation, May 19, 2009

Slide 1: Strategic Hotels & Resorts
STRATEGIC Hotels &° Resorts
Slide 2: Introduction
Introduction Identified downturn early Implemented recession tactics Secured liquidity through trough of recession Executing plans to opportunistically enhance liquidity Balance Sheet Durable amended line of credit No maturing debt until 2011 Limited capital requirements World-Class Hotels Underpinn
Slide 3: World-Class Hotels Underpinning Value
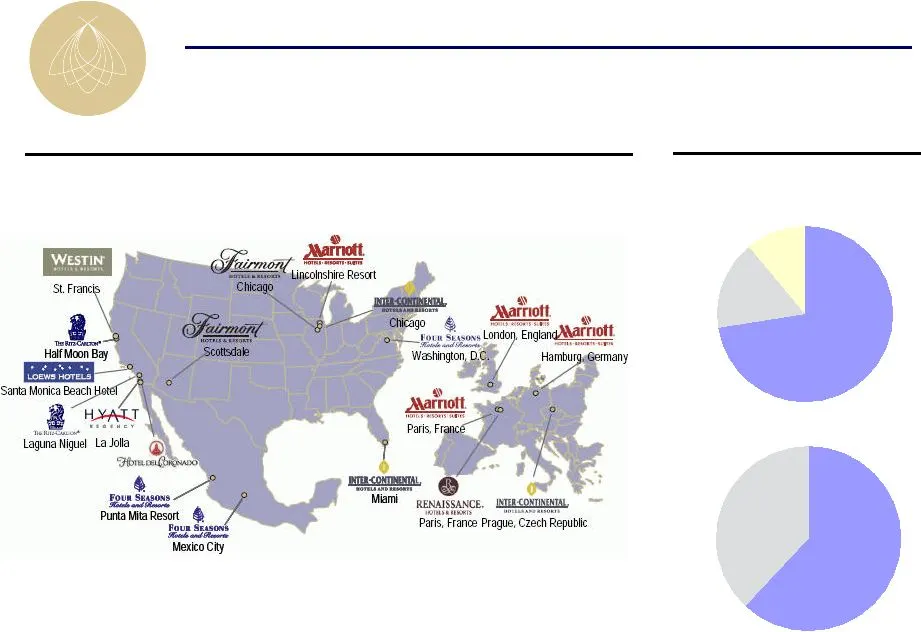
World-Class Hotels Underpinning Value Europe 16% Mexico 11% United States 73% Urban Hotels 62% Ocean Front Resorts 38% Mix of Business 2008 EBITDA Portfolio Overview 19 hotels, 8,358 rooms
Slide 4: Planning for the Worst
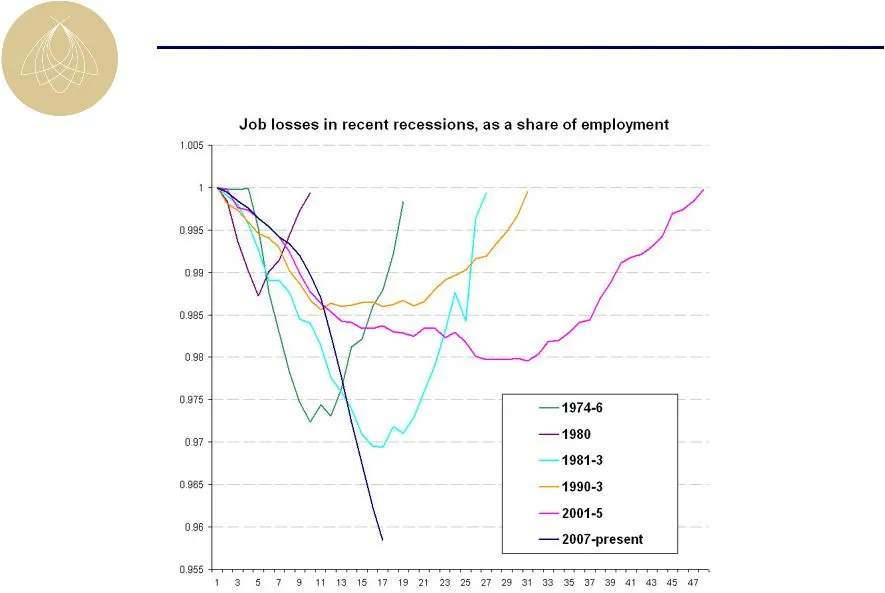
Planning for the Worst Job losses through recessions
Slide 5: 2008 was a Transition Year
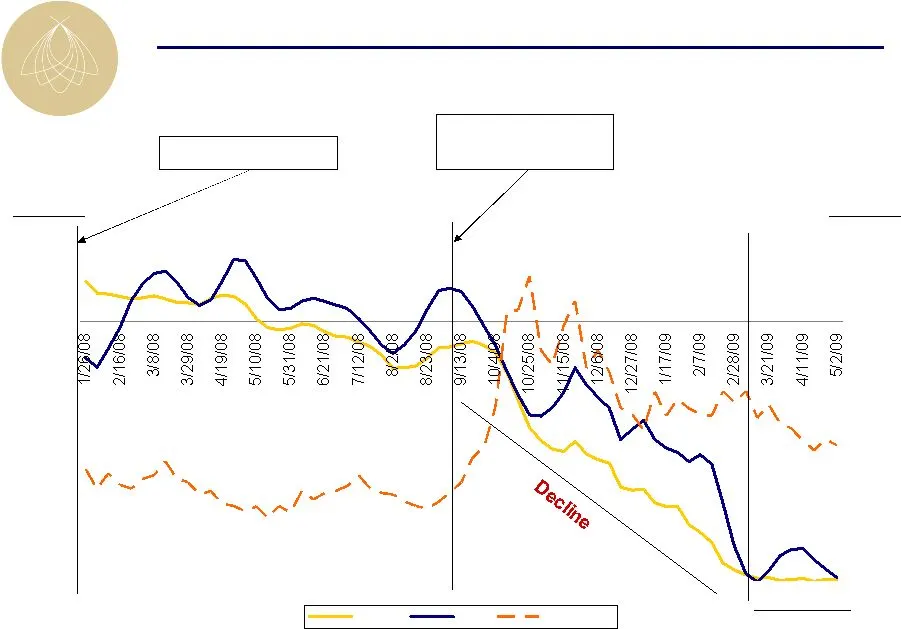
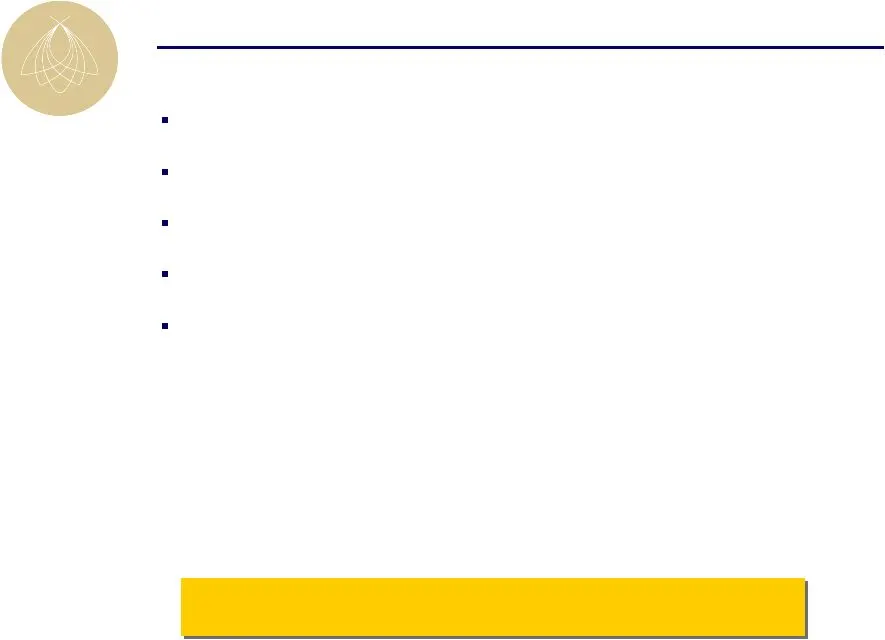
-30.0% -25.0% -20.0% -15.0% -10.0% -5.0% 0.0% 5.0% 10.0% Luxury BEE VIX Index 2008 was a Transition Year 4 Week Moving Average; Running 28 Day RevPAR Growth Stability? RevPAR Growth VIX Index 2.0% BEE RevPAR Growth -13.1% BEE RevPAR Growth Recession Begins Lehman Brothers Bankruptcy -27.9% BEE RevPA
Slide 6: Recession Tactics
Recession Tactics Innovative revenue strategies Operating systems tightened to reduce property costs Corporate G&A reductions Conserve liquidity Extract equity through sale of hotels Plan Set in Motion in Late 2007
Slide 7: BEE Outperforms Luxury Competition
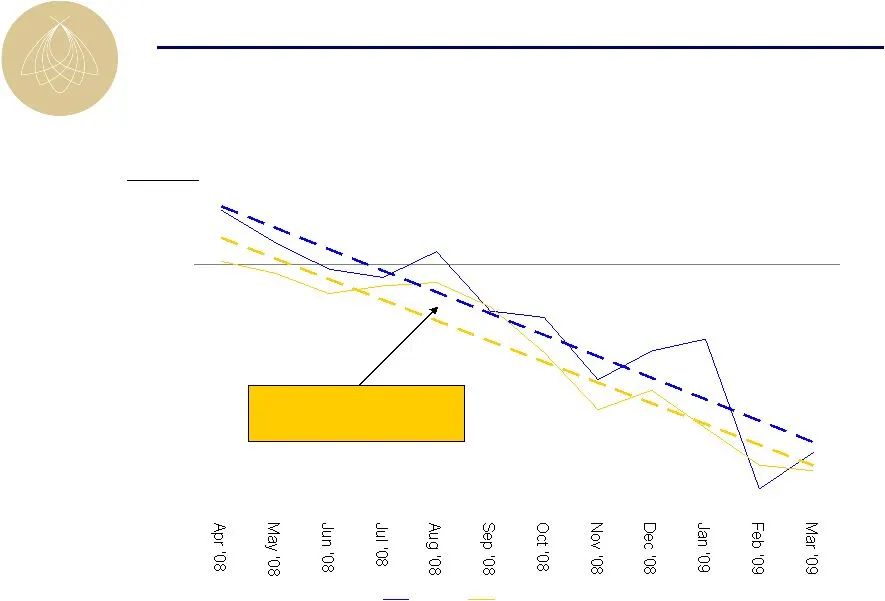
-35.0% -30.0% -25.0% -20.0% -15.0% -10.0% -5.0% 0.0% 5.0% 10.0% SHR STR US Luxury Innovative Revenue Strategies 3.9% Average BEE Outperformance RevPAR Growth BEE Outperforms Luxury Competition
Slide 8: Aggressive Asset Management and Proven Systems
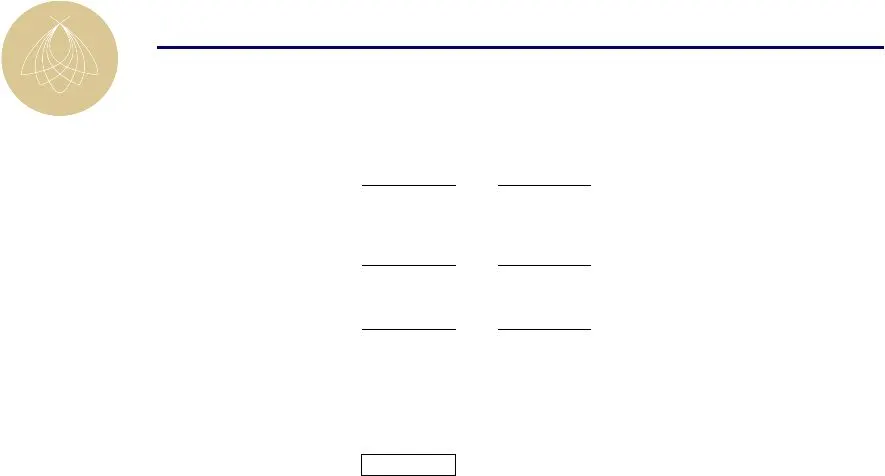
Aggressive Asset Management and Proven Systems Peers include: HST, LHO, SHO, & DRH. BEE margins exceeded peers in BEE Peers Average Daily Rate $260 $191 Revenue % % Rooms 52% 62% Food & Beverage 36% 30% Other 12% 8% Total 100% 100% Departmental Profit Mar g in Rooms 75% 76% Food & Beverage 33% 28% G
Slide 9: Aggressive Asset Management and Proven Systems
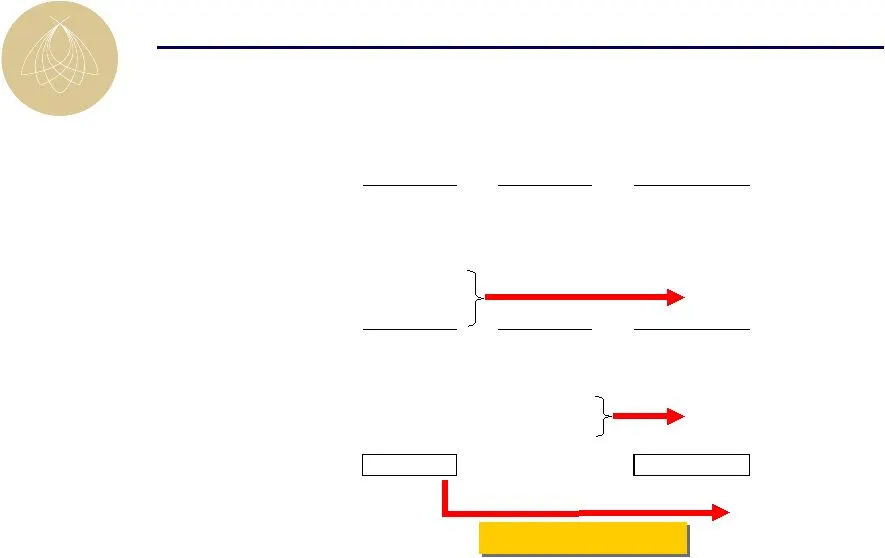
Aggressive Asset Management and Proven Systems BEE margins exceeded peers in Peers include: HST, LHO, SHO, & DRH. BEE Peers Peers @ BEE Revenue Mix Avera g e Daily Rate $260 $191 Revenue Rooms 52% 62% 52% Food & Beverage 36% 30% 36% Other 12% 8% 12% Total 100% 100% 100% Departmental Profit Mar g in
Slide 10: Conserve Liquidity
Conserve Liquidity Amended line of credit with durable terms $15 million owner funded capital plan for 2009 Target spending less than 75% of FF&E reserve allocation $100 million retention through dividend cuts Aggressive cash management
Slide 11: No Maturities Until 2011
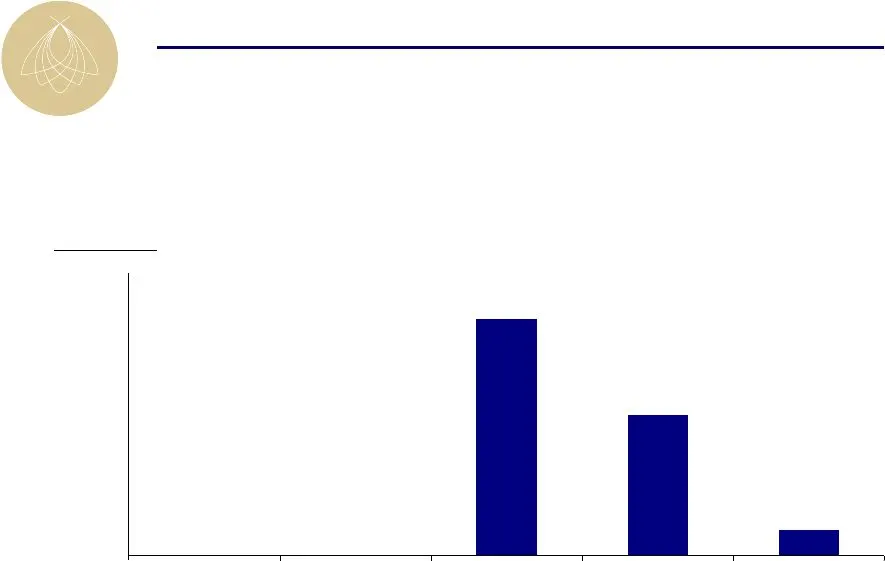
No Maturities Until 2011 Consolidated debt maturities $111 $1,007 $596 $0 $300 $600 $900 $1,200 ($ in millions) 3.9% weighted average interest rate 80% fixed rate debt
Slide 12: High-End Hotels Supported by World-Class Real Estate
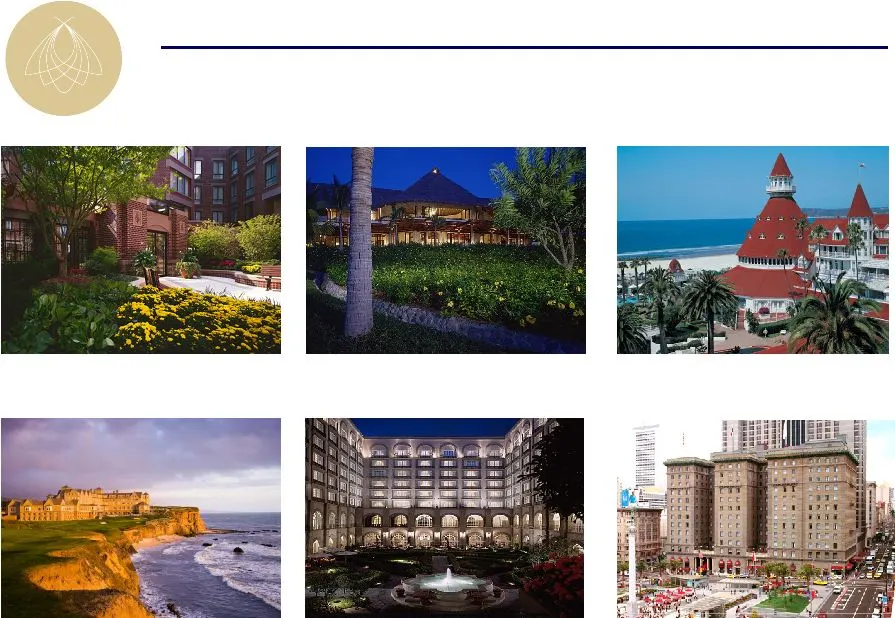
High-End Hotels Supported by World-Class Real Estate Four Seasons Washington, D.C. Four Seasons Punta Mita Four Seasons Mexico City Hotel del Coronado Ritz-Carlton Half Moon Bay Westin St. Francis

Slide 13: Strategic Hotels & Resorts
STRATEGIC Hotels &° Resorts
Source: SEC EDGAR · 8-K filed May 19, 2009
More decks from Strategic Hotels and Resorts Inc
 Investor Presentation (June 2015)43 slides · Jun 1, 2015
 Investor Presentation (February 2015)43 slides · Feb 24, 2015
 Investor Presentation (January 2015)44 slides · Jan 26, 2015
 Investor Presentation (November 2014)50 slides · Nov 5, 2014
 Investor Presentation (October 2014)50 slides · Oct 3, 2014
 Investor Day (September 2014)67 slides · Sep 22, 2014