Capital Bank Financial — Investor Presentation (September 2013)
28 slides from Capital Bank Financial's investor presentation, Sep 9, 2013
Slide 1: The Path to Performance
Exhibit 99.1 CB CAPITAL FINANCIAL The September Path to2013 Performance CORP BANK
Slide 2: Forward-Looking Information
CBmade Forward-Looking Information historical “should,” unknown statements Any that financial performance general values; population generate such 2is events. Safe the or statements all (5) economic future and Harbor loans. trends facts risks, “will,” of as our and in we or our aplans, this ability
Slide 3: Our Path to Improving Investor Returns
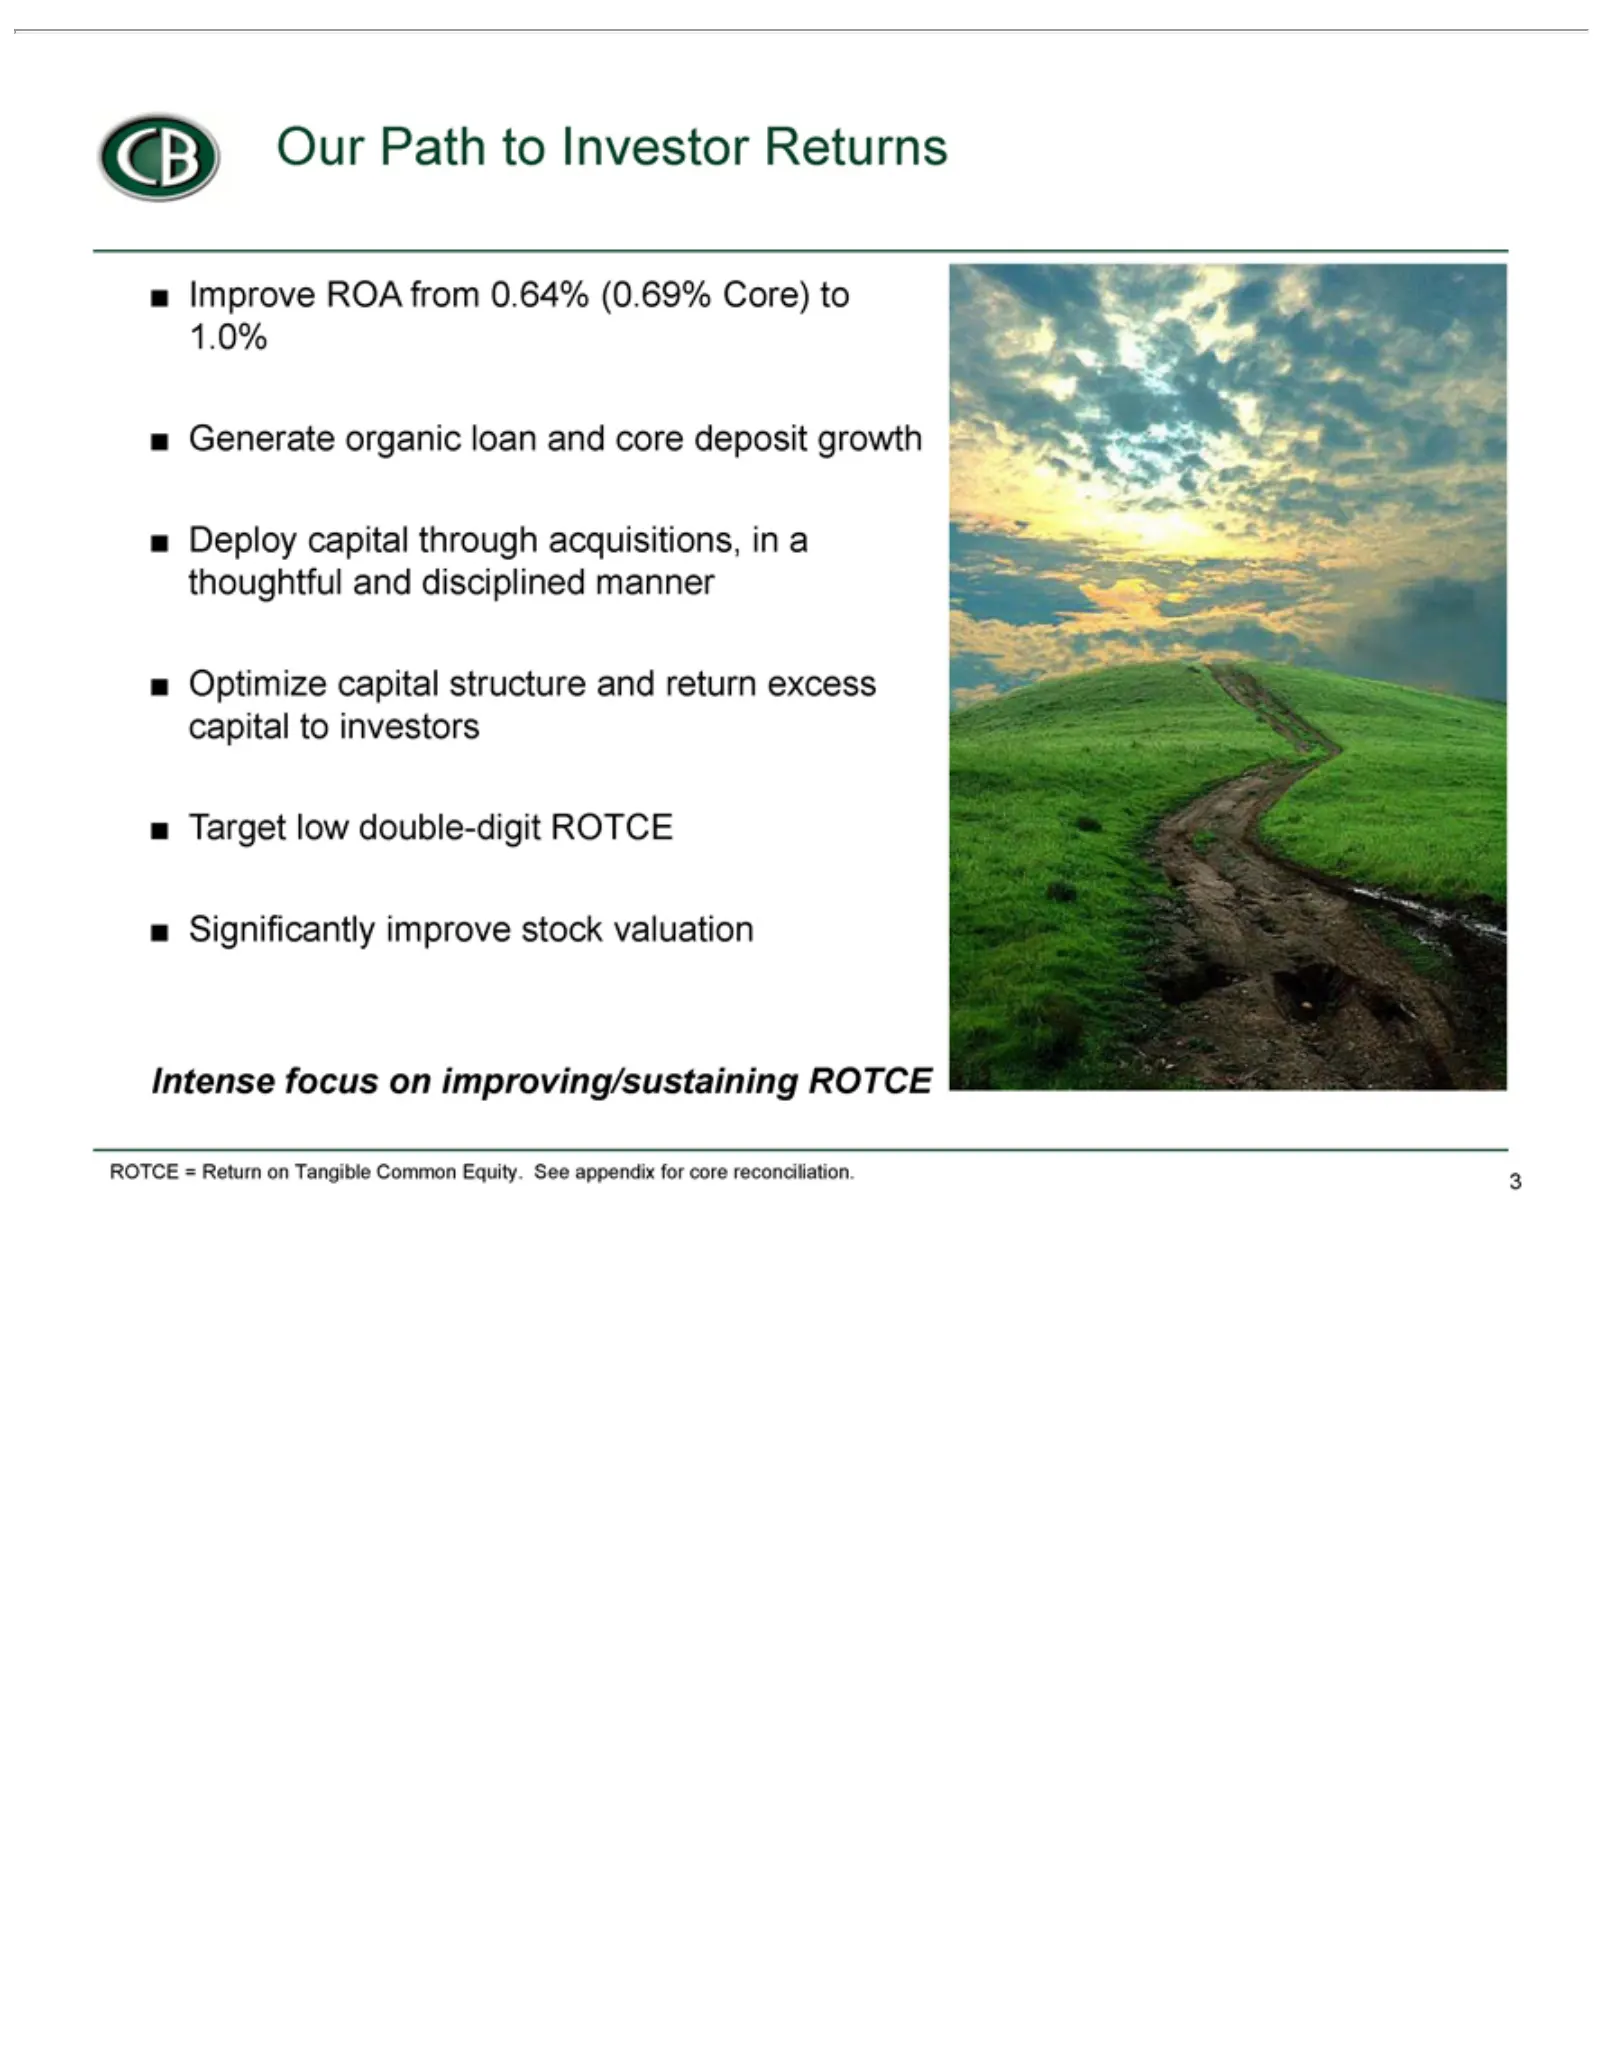
CB Ourlow Improve Generate Deploy Optimize Target Significantly Intense ROTCE focus capital Path =ROA organic capital Return double-digit improve to on from through Investor improving/sustaining structure loan on0.64% Tangible stock and acquisitions, ROTCE Returns and core (0.69% valuation Common re
Slide 4: Significant Upside Potential vs. Selected Peers
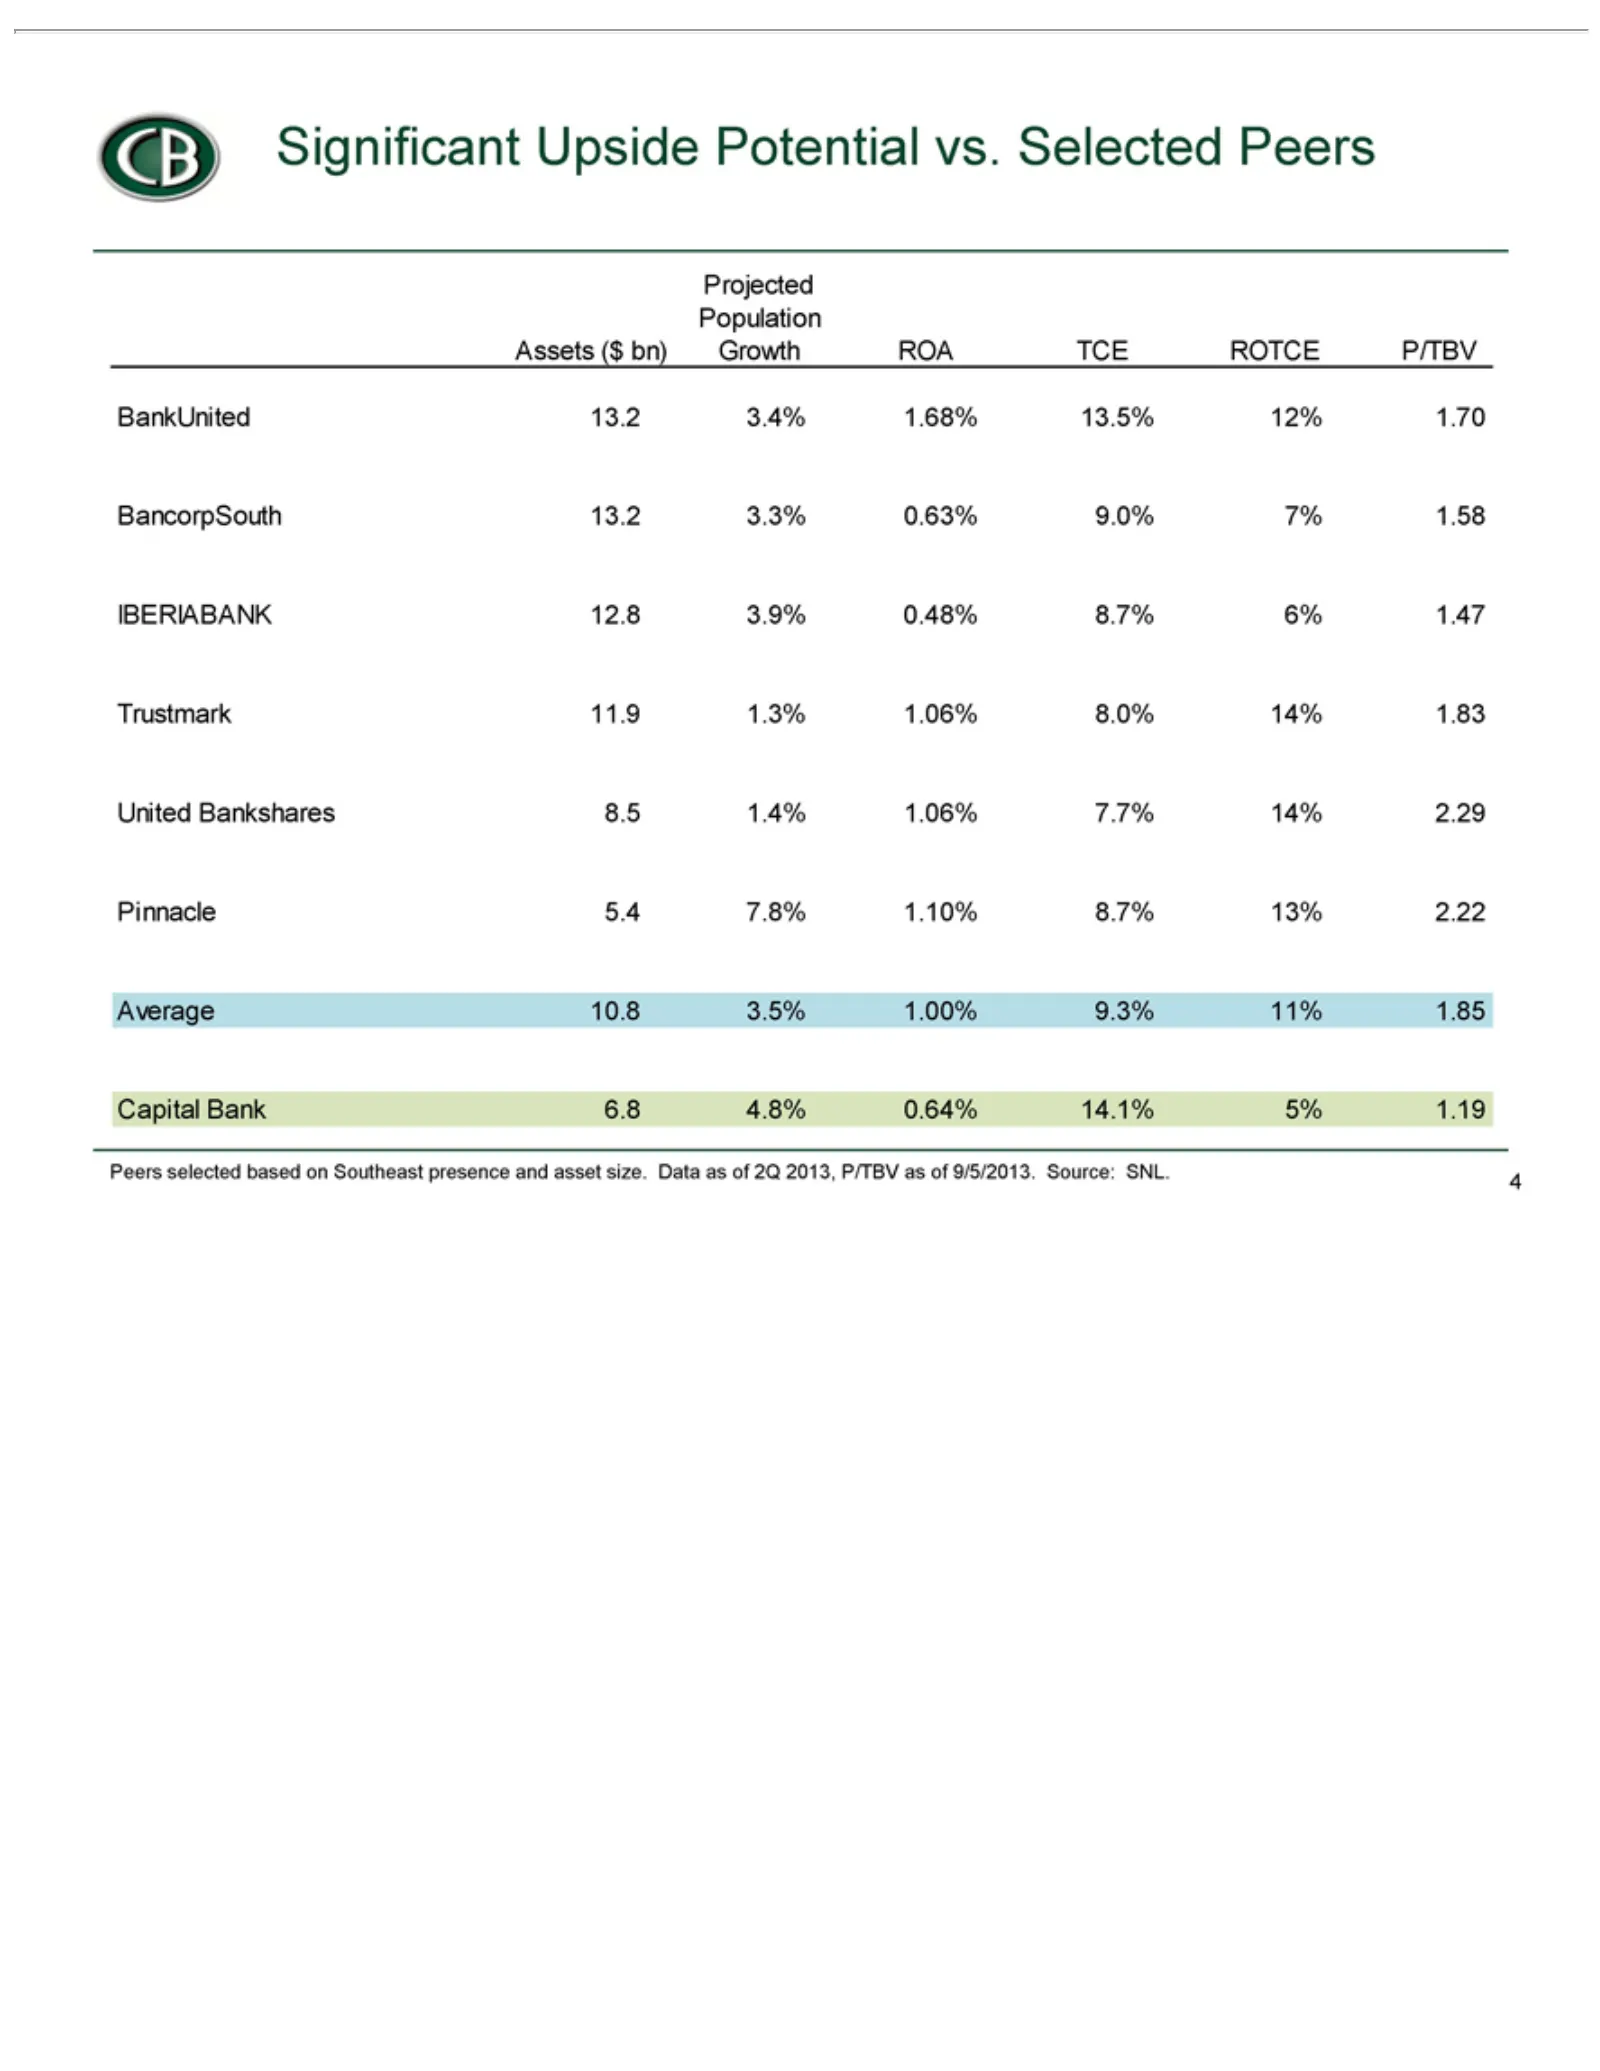
CB Significant Assets BankUnited BancorpSouth IBERIABANK Trustmark United Pinnacle Average Capital Peers selected ($ Bankshares Bank 10.8 5.4 bn) 11.9 13.2 7.8% 6.8 Projected 3.5% based 13.2 Upside 1.3% 12.8 4.8% 3.4% 1.10% 8.5 1.00% 3.3% on 3.9% 1.06% Potential 1.4% 0.64% 1.68% Population Southeast
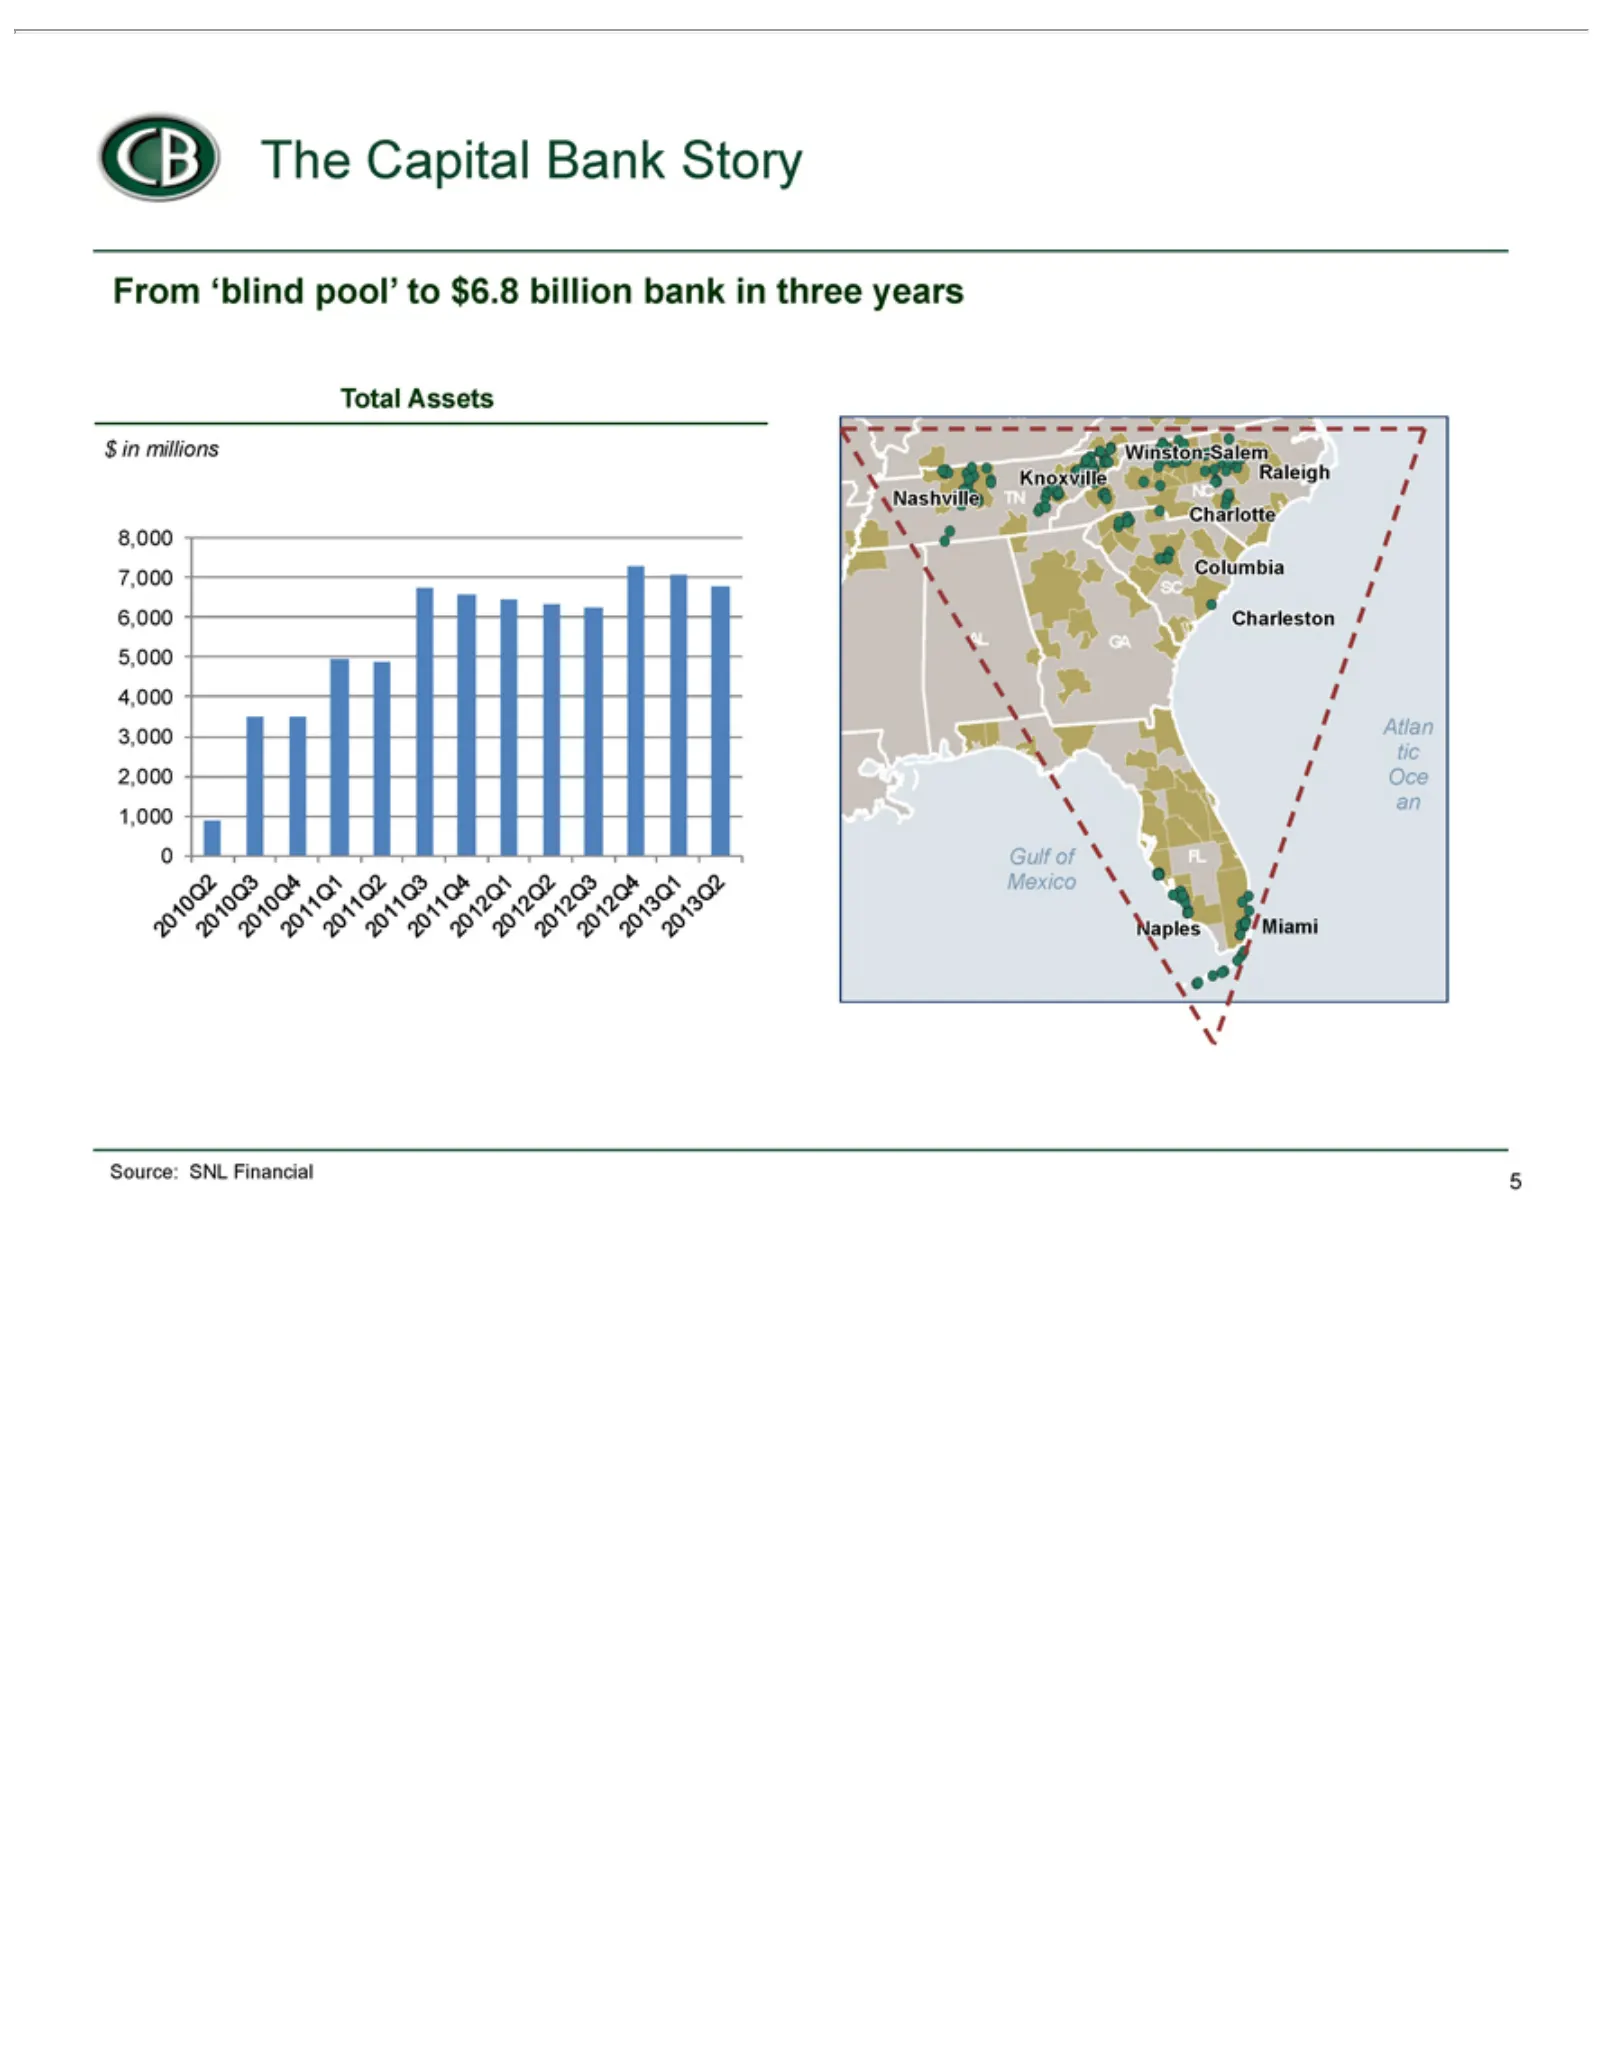
Slide 5: The Capital Bank Financial Story: $6.8 billion bank in three years
CB From 02$Total 1,000 2,000 3,000 4,000 5,000 6,000 7,000 8,000 Gulf Miami Naples Charleston Columbia Charlotte Nashville Knoxville Raleigh Winston-Salem 2013Q2 2013Q1 2012Q4 2012Q3 2012Q2 2012Q1 2011Q4 2011Q3 2011Q2 2011Q1 2010Q4 2010Q3 Atlantic Source: 010Q2 in The millions of Assets ‘blind Mexic
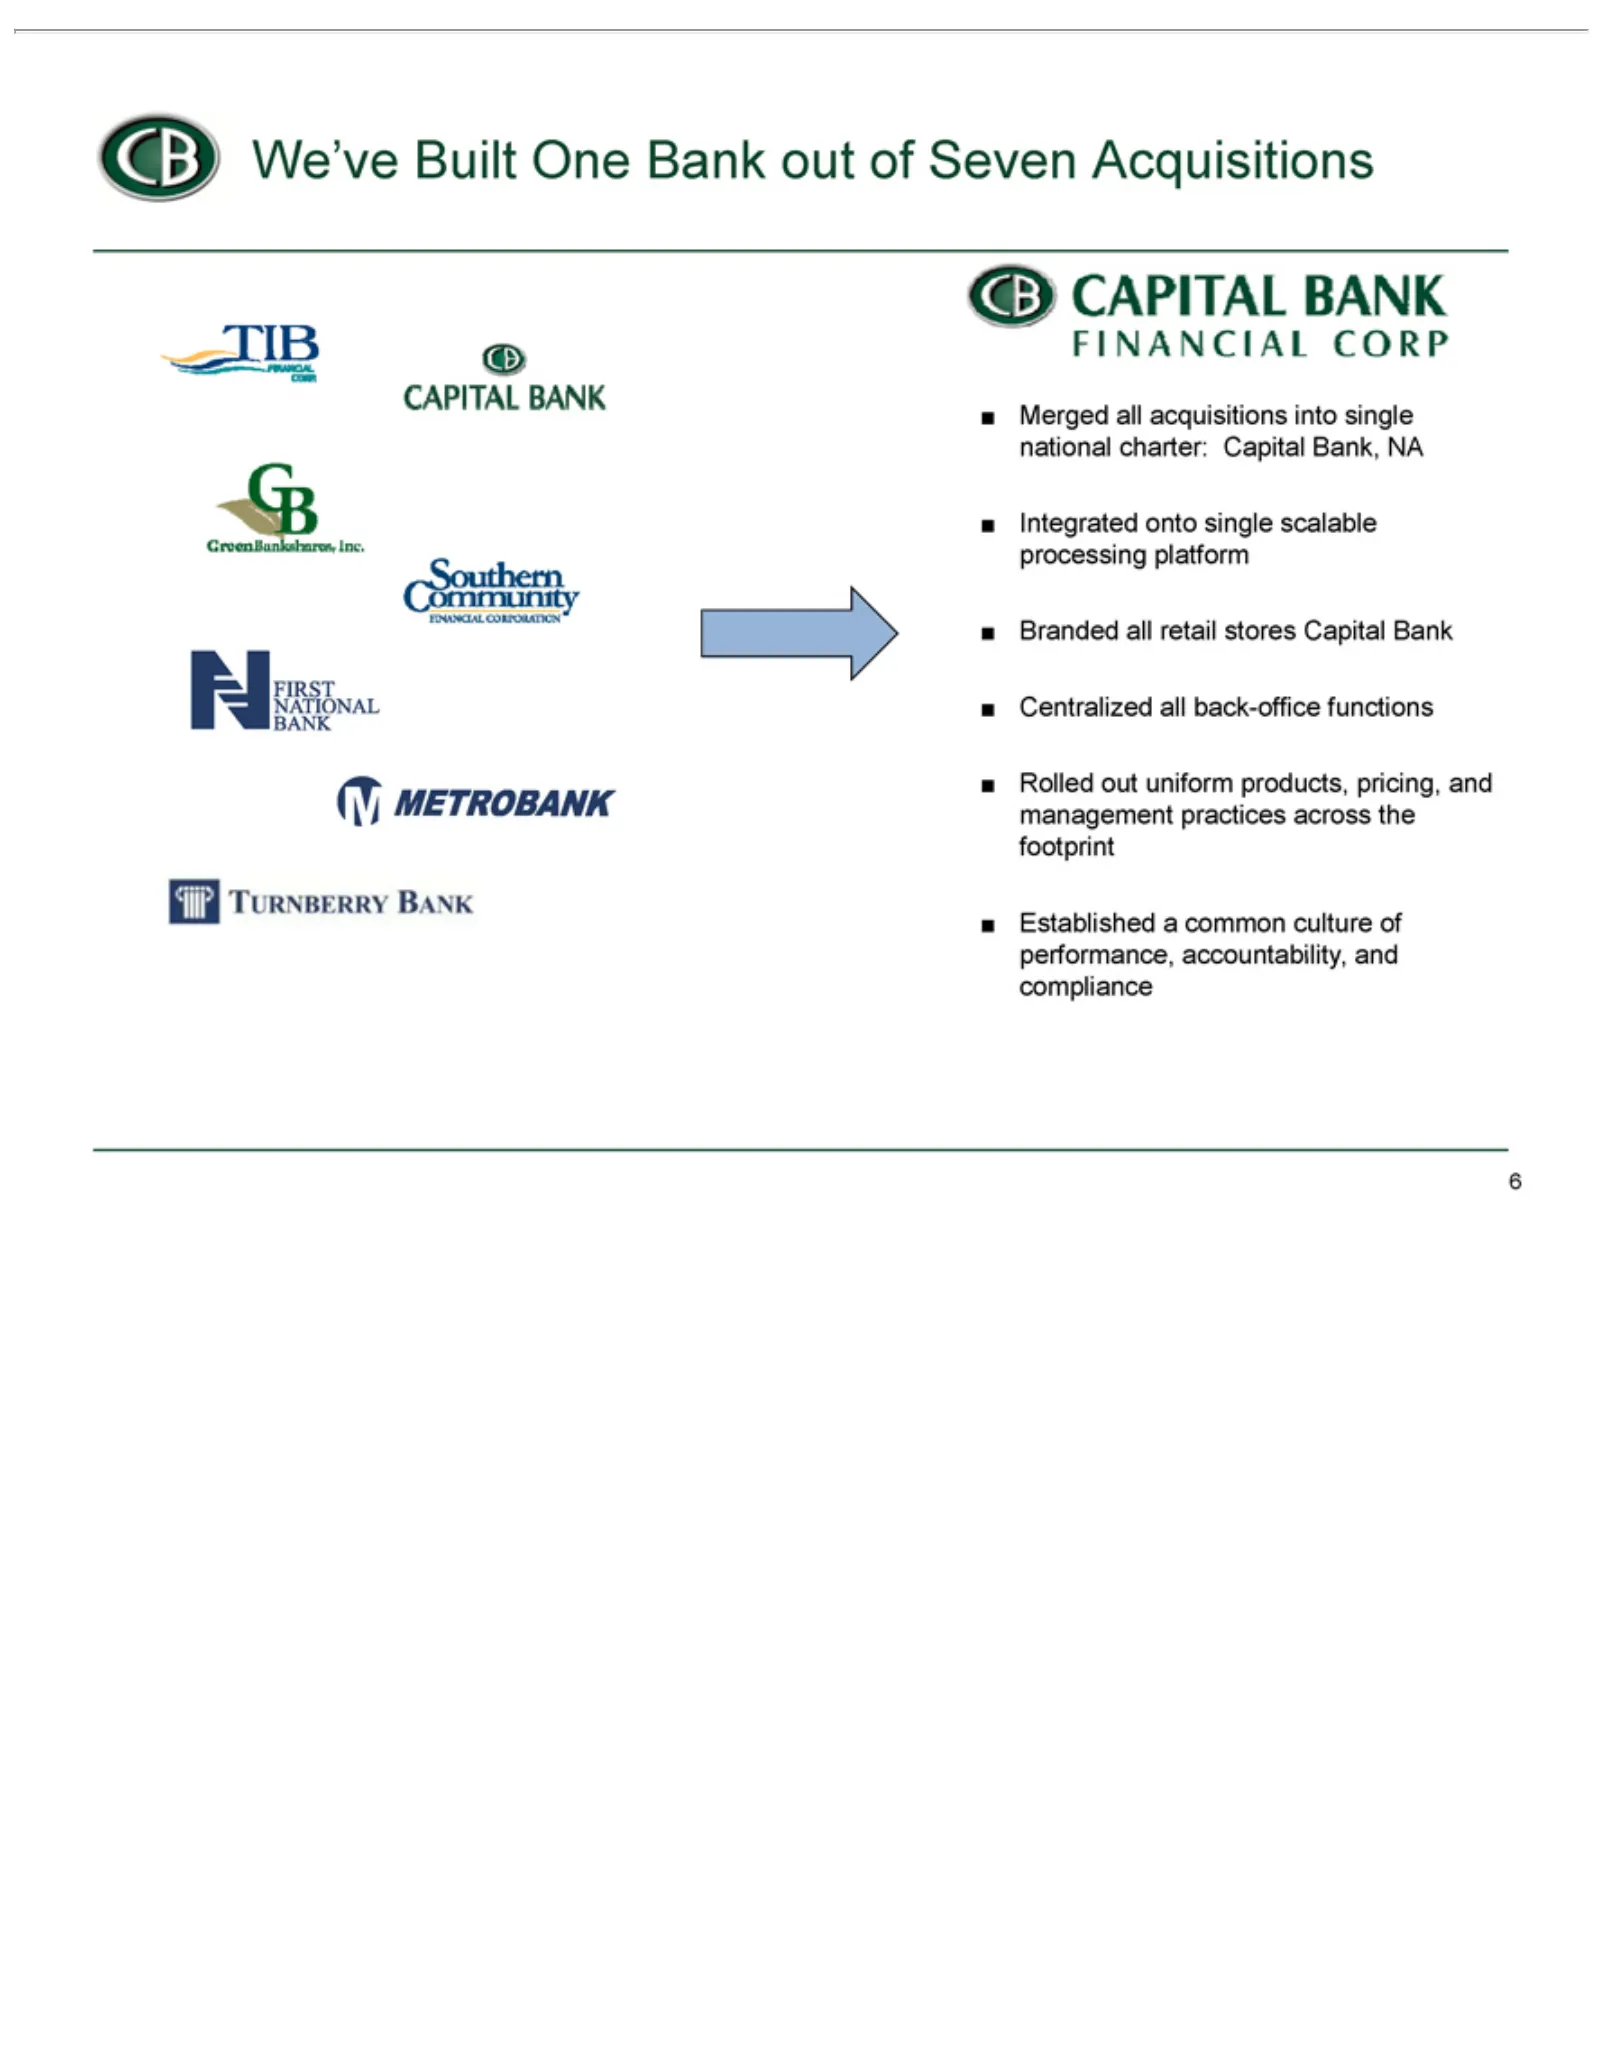
Slide 6: Seven Acquisitions Integrated into One Bank
TIB GB Southern N M TURNBERRY CB FINANCIAL Merged Integrated Branded Centralized Rolled 6Established FIRST METROBANK We’ve CAPITAL GreenBankshares, FINANCIAL out all all Community NATIONAL onto Built uniform acquisitions all aretail common CORP BANK back-office BANK single One stores CORP. products,
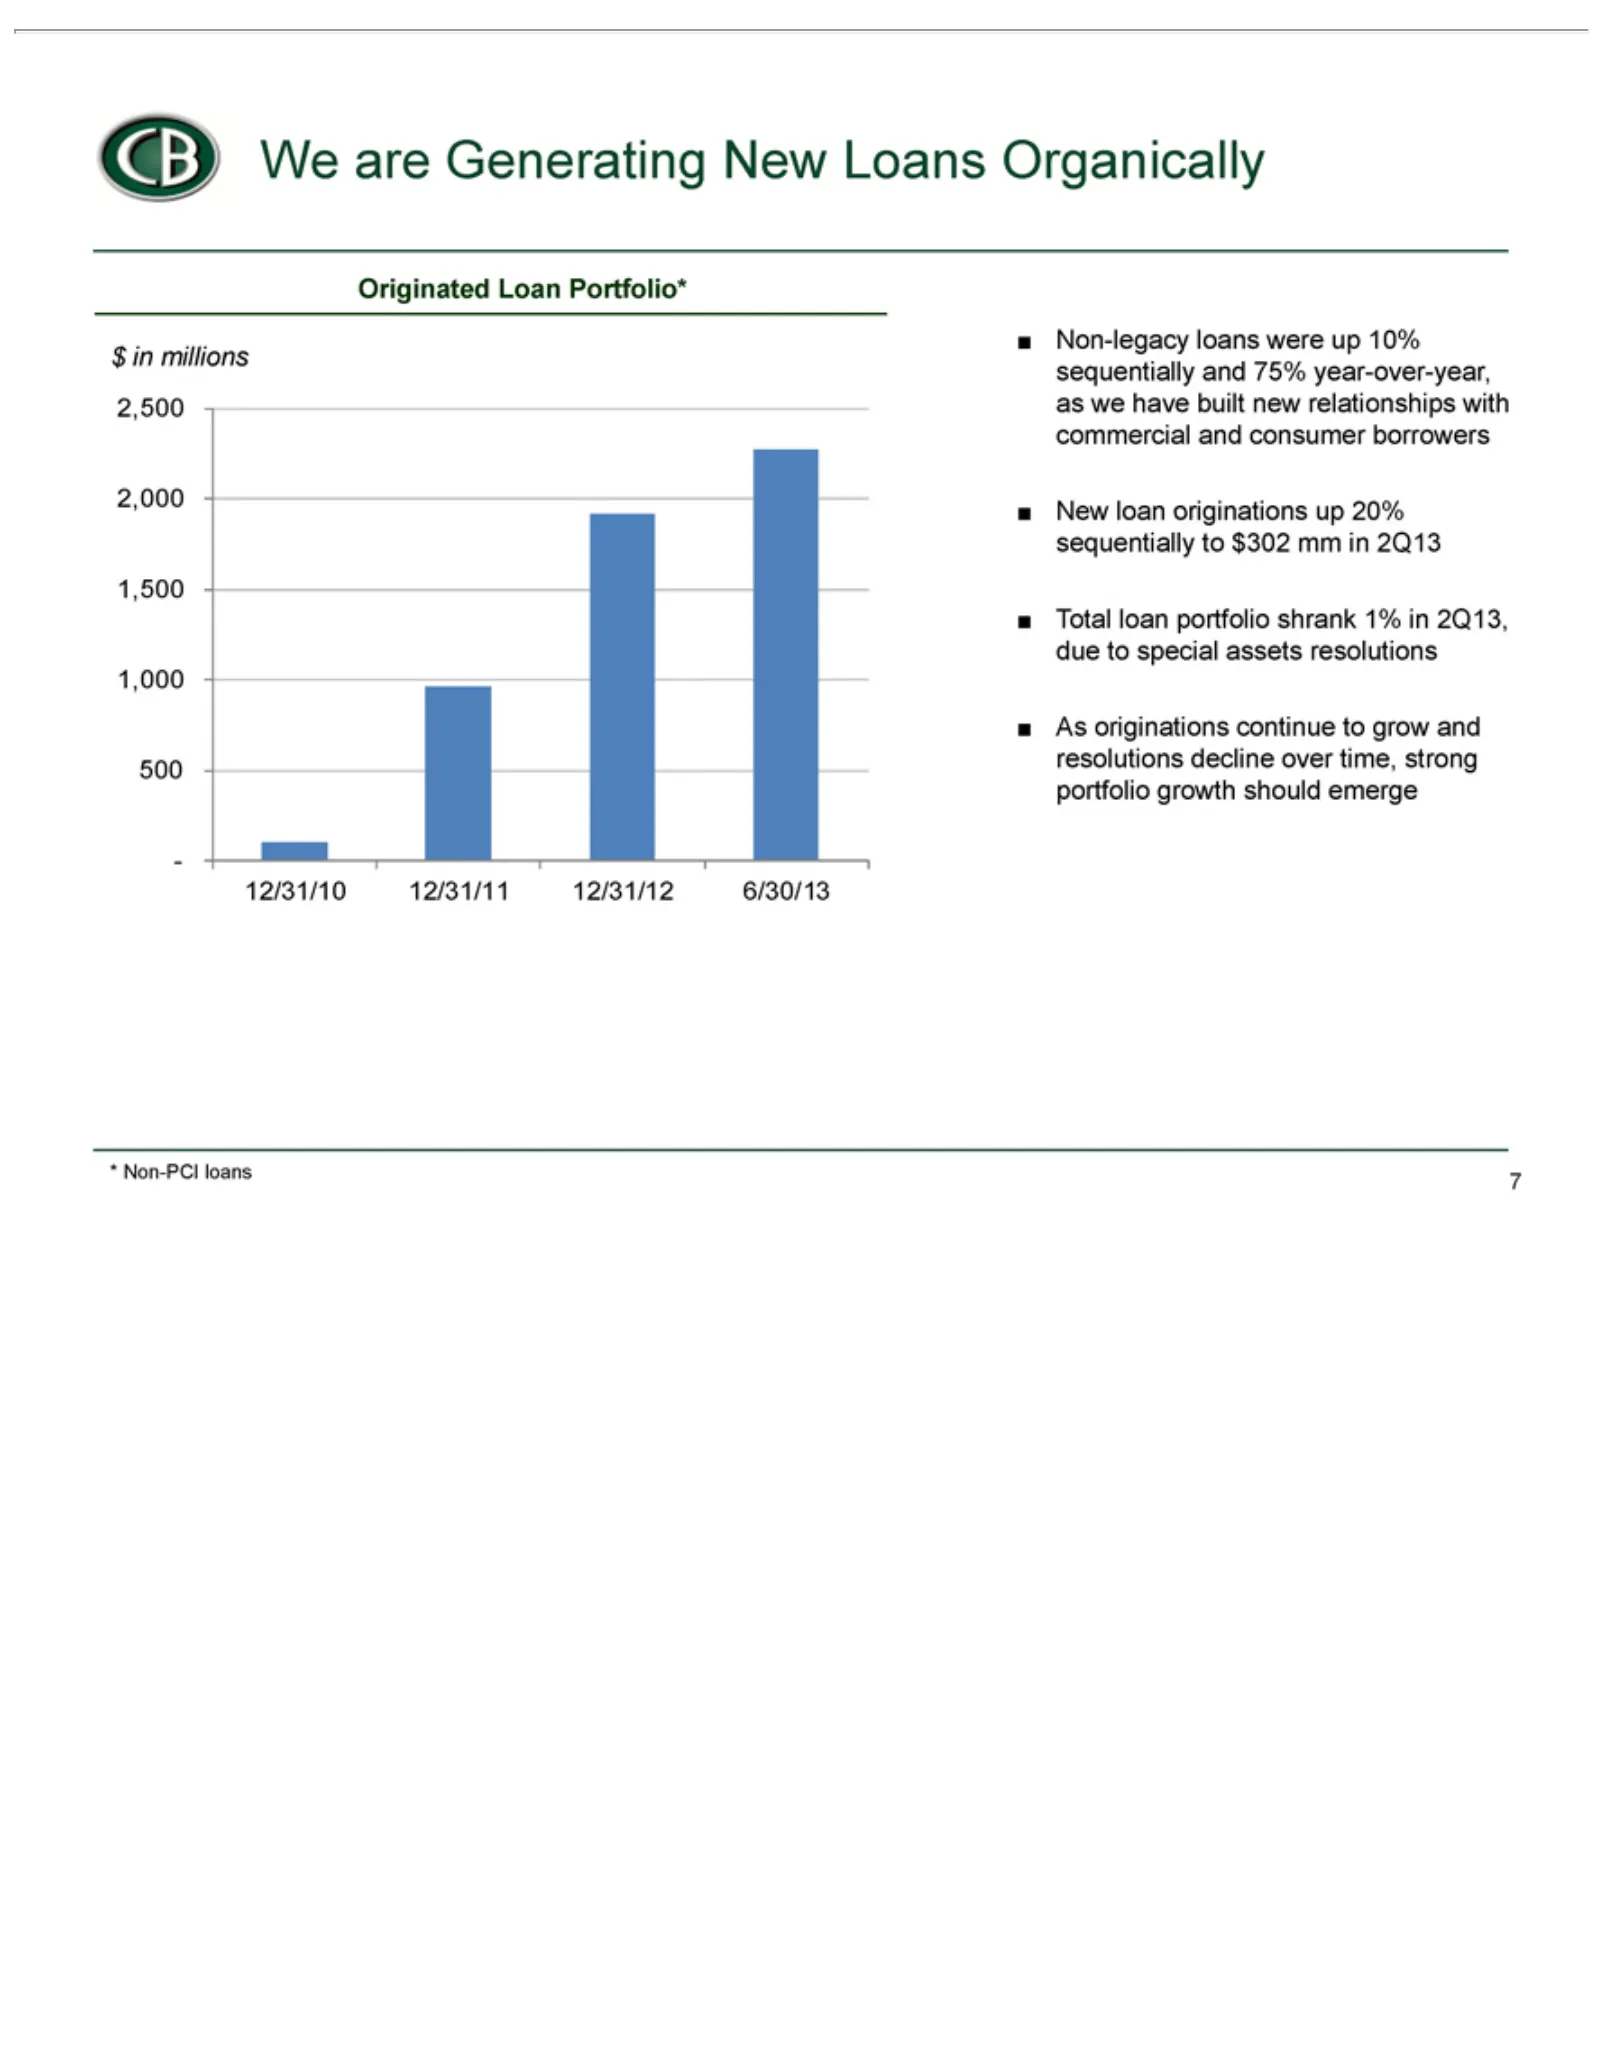
Slide 7: Generating New Loans Organically
CB -1$Originated 500 1,000 1,500 2,000 2,500 Non-legacy New Total 7*As 2/31/10 inoriginations Non-PCI We millions loan loan are 12/31/11 originations portfolio Loan Generating loans loans continue Portfolio* were 12/31/12 shrank up New upto20% 10% 1% grow 6/30/13 Loans sequentially insequentially an
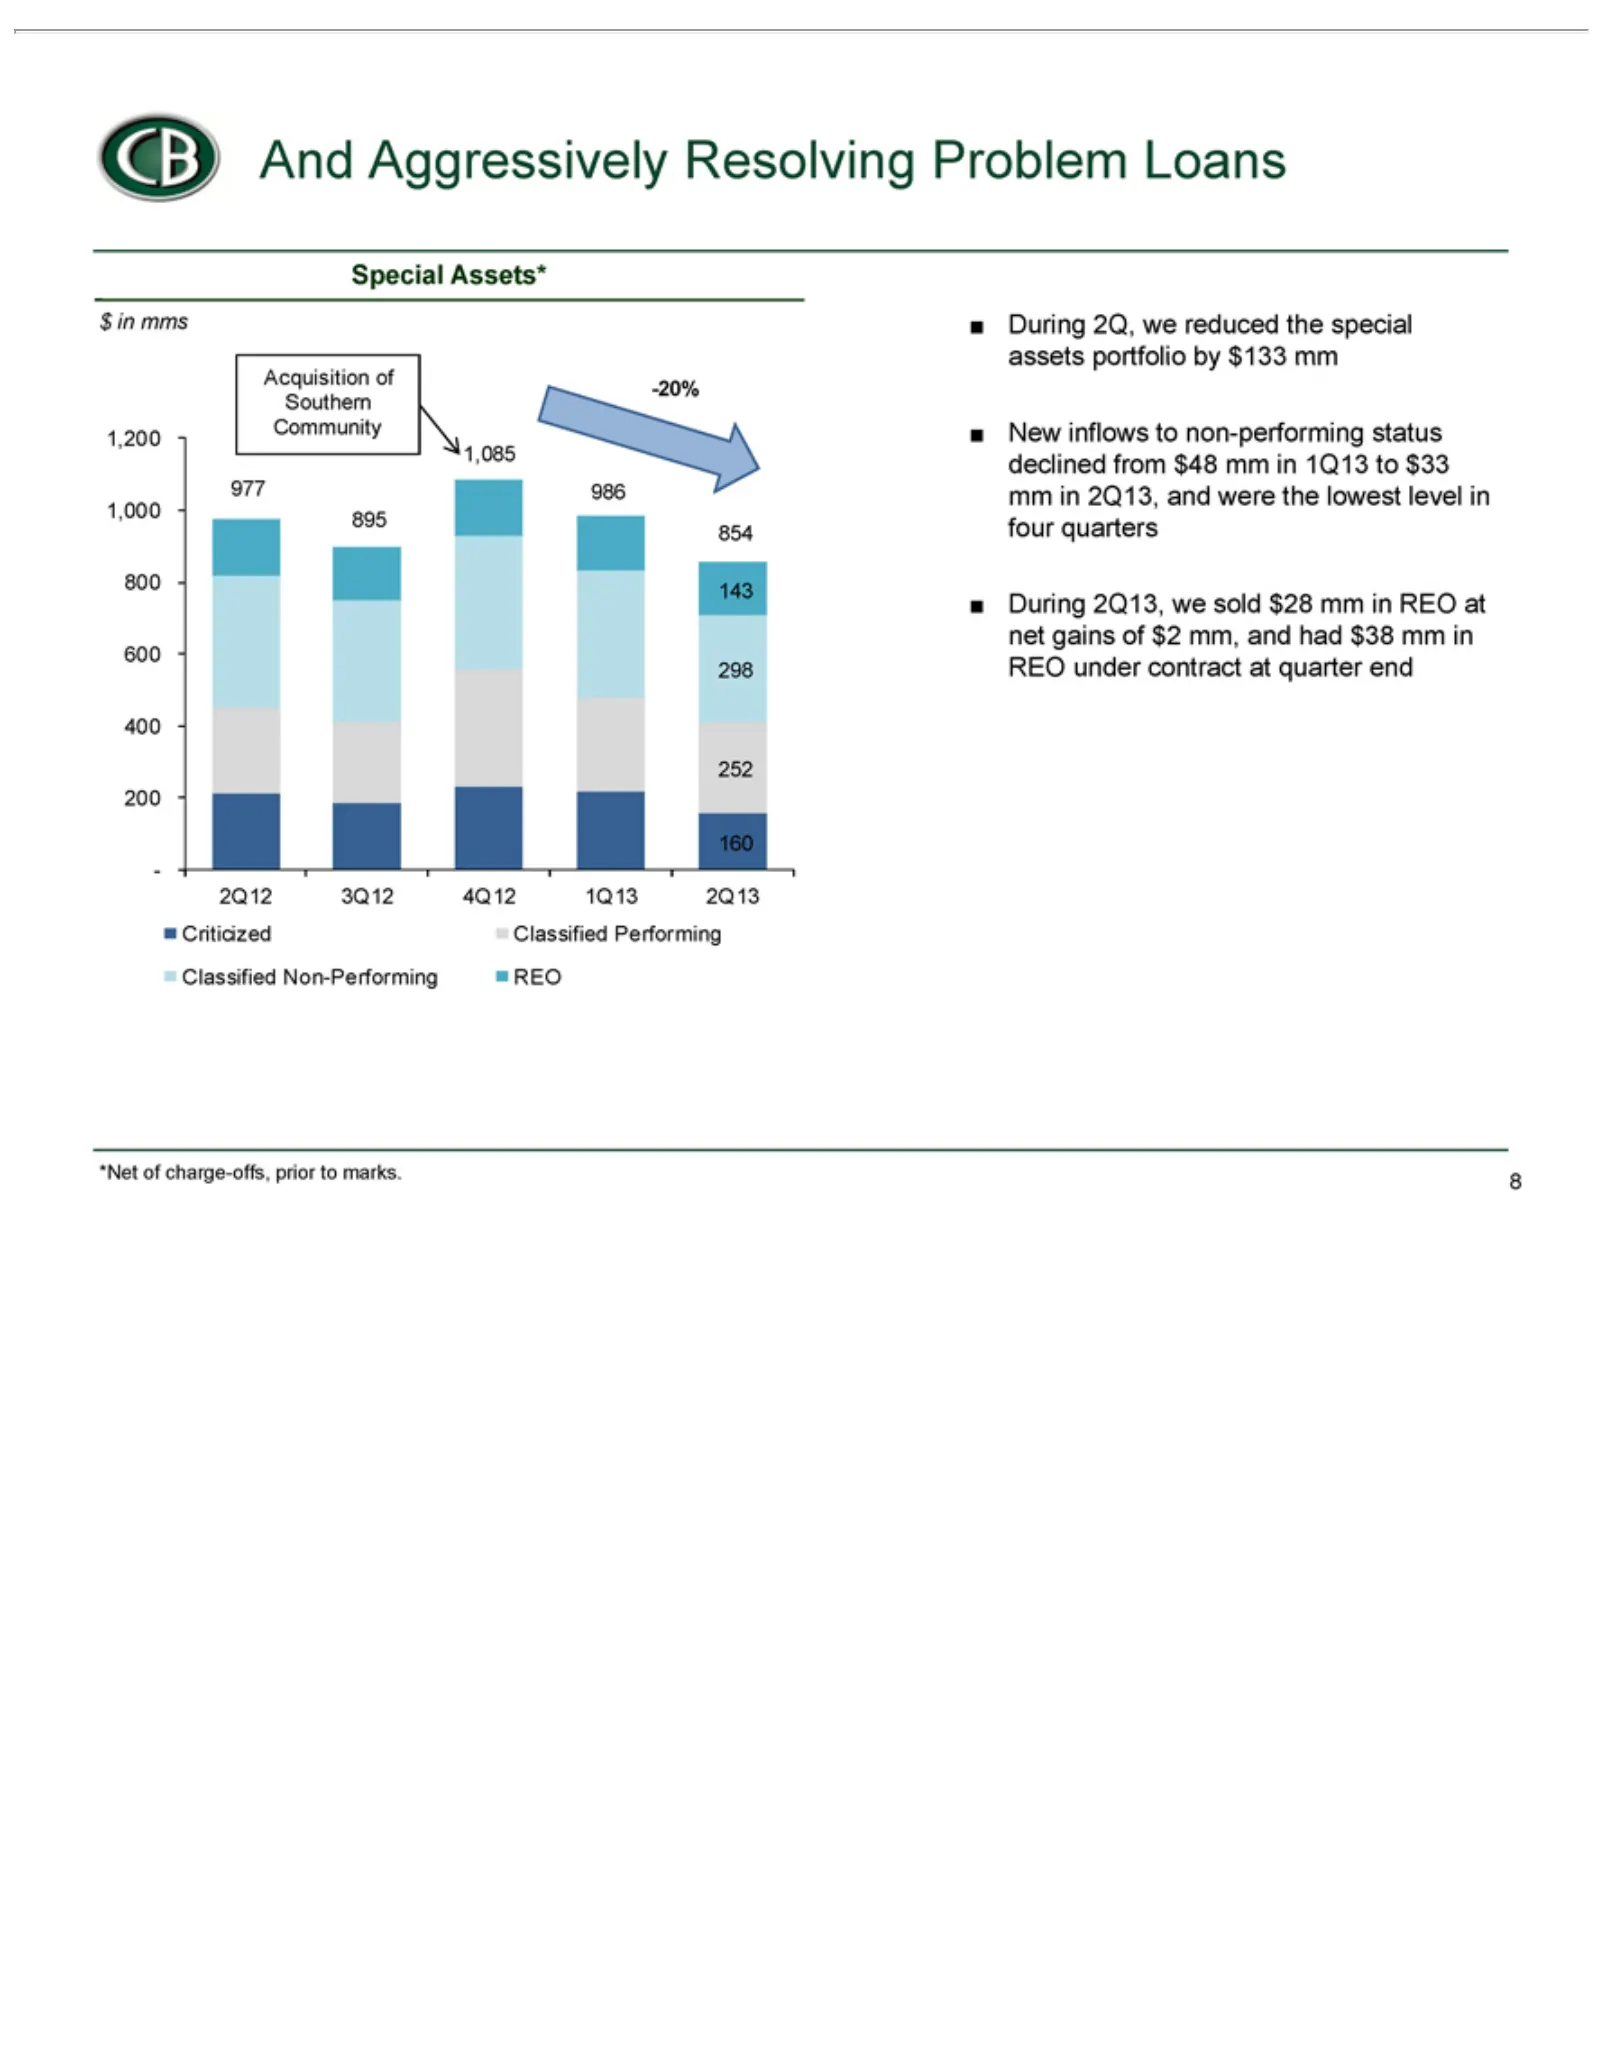
Slide 8: Aggressively Resolving Special Assets
CB $Special Acquisition 977 1,200 -2-20% 160 200 252 400 298 600 143 800 1,000 Criticized Classified REO New During 8*Net Q12 inAnd 895 mms inflows of 3Q12 2Q, 2Q13, Assets* charge-offs, Aggressively 1,085 Performing Non-Performing we of 4Q12 towe Southern 986 reduced non-performing sold 1Q13 854 pr
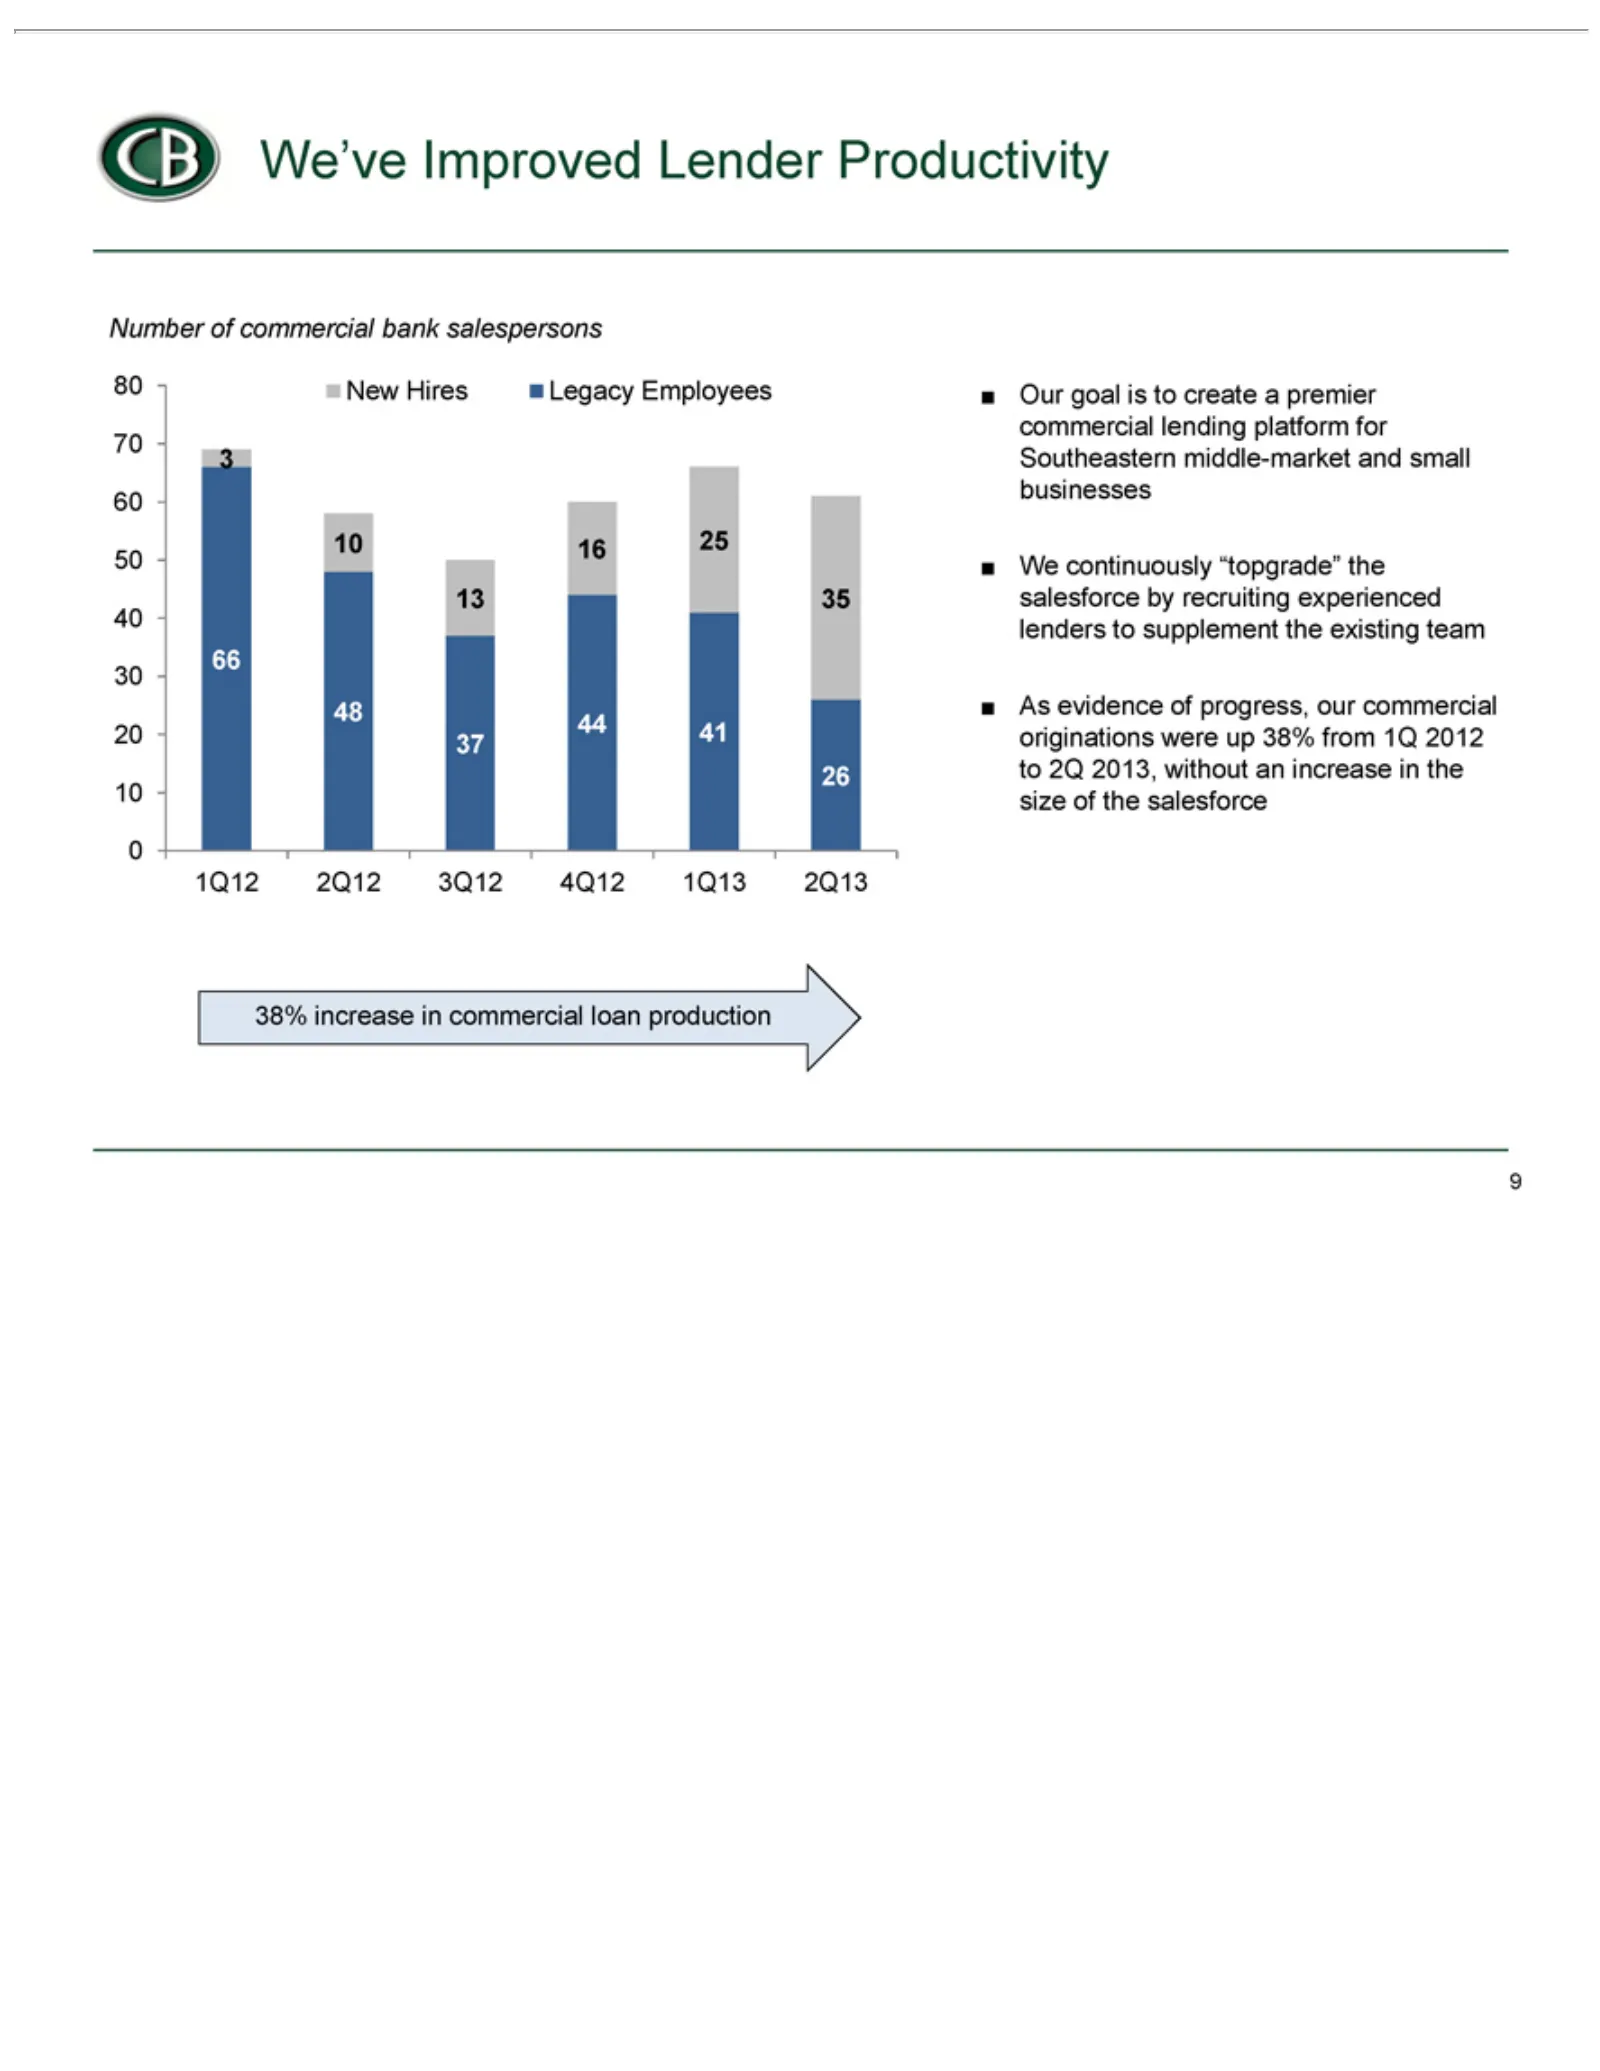
Slide 9: Improved Commercial Lender Productivity
CB Number New Legacy 380 66 1Q12 38% Our We 9As 1048 70 evidence continuously We’ve goal 13 increase Hires 2Q12 60Employees 3716 of 50 44 isImproved 25 commercial to 3Q12 40 41 ofin create 35 progress, 30 26 commercial “topgrade” 4Q12 20aLender 10 premier bank 1Q13 0our loan the Productivity commerc
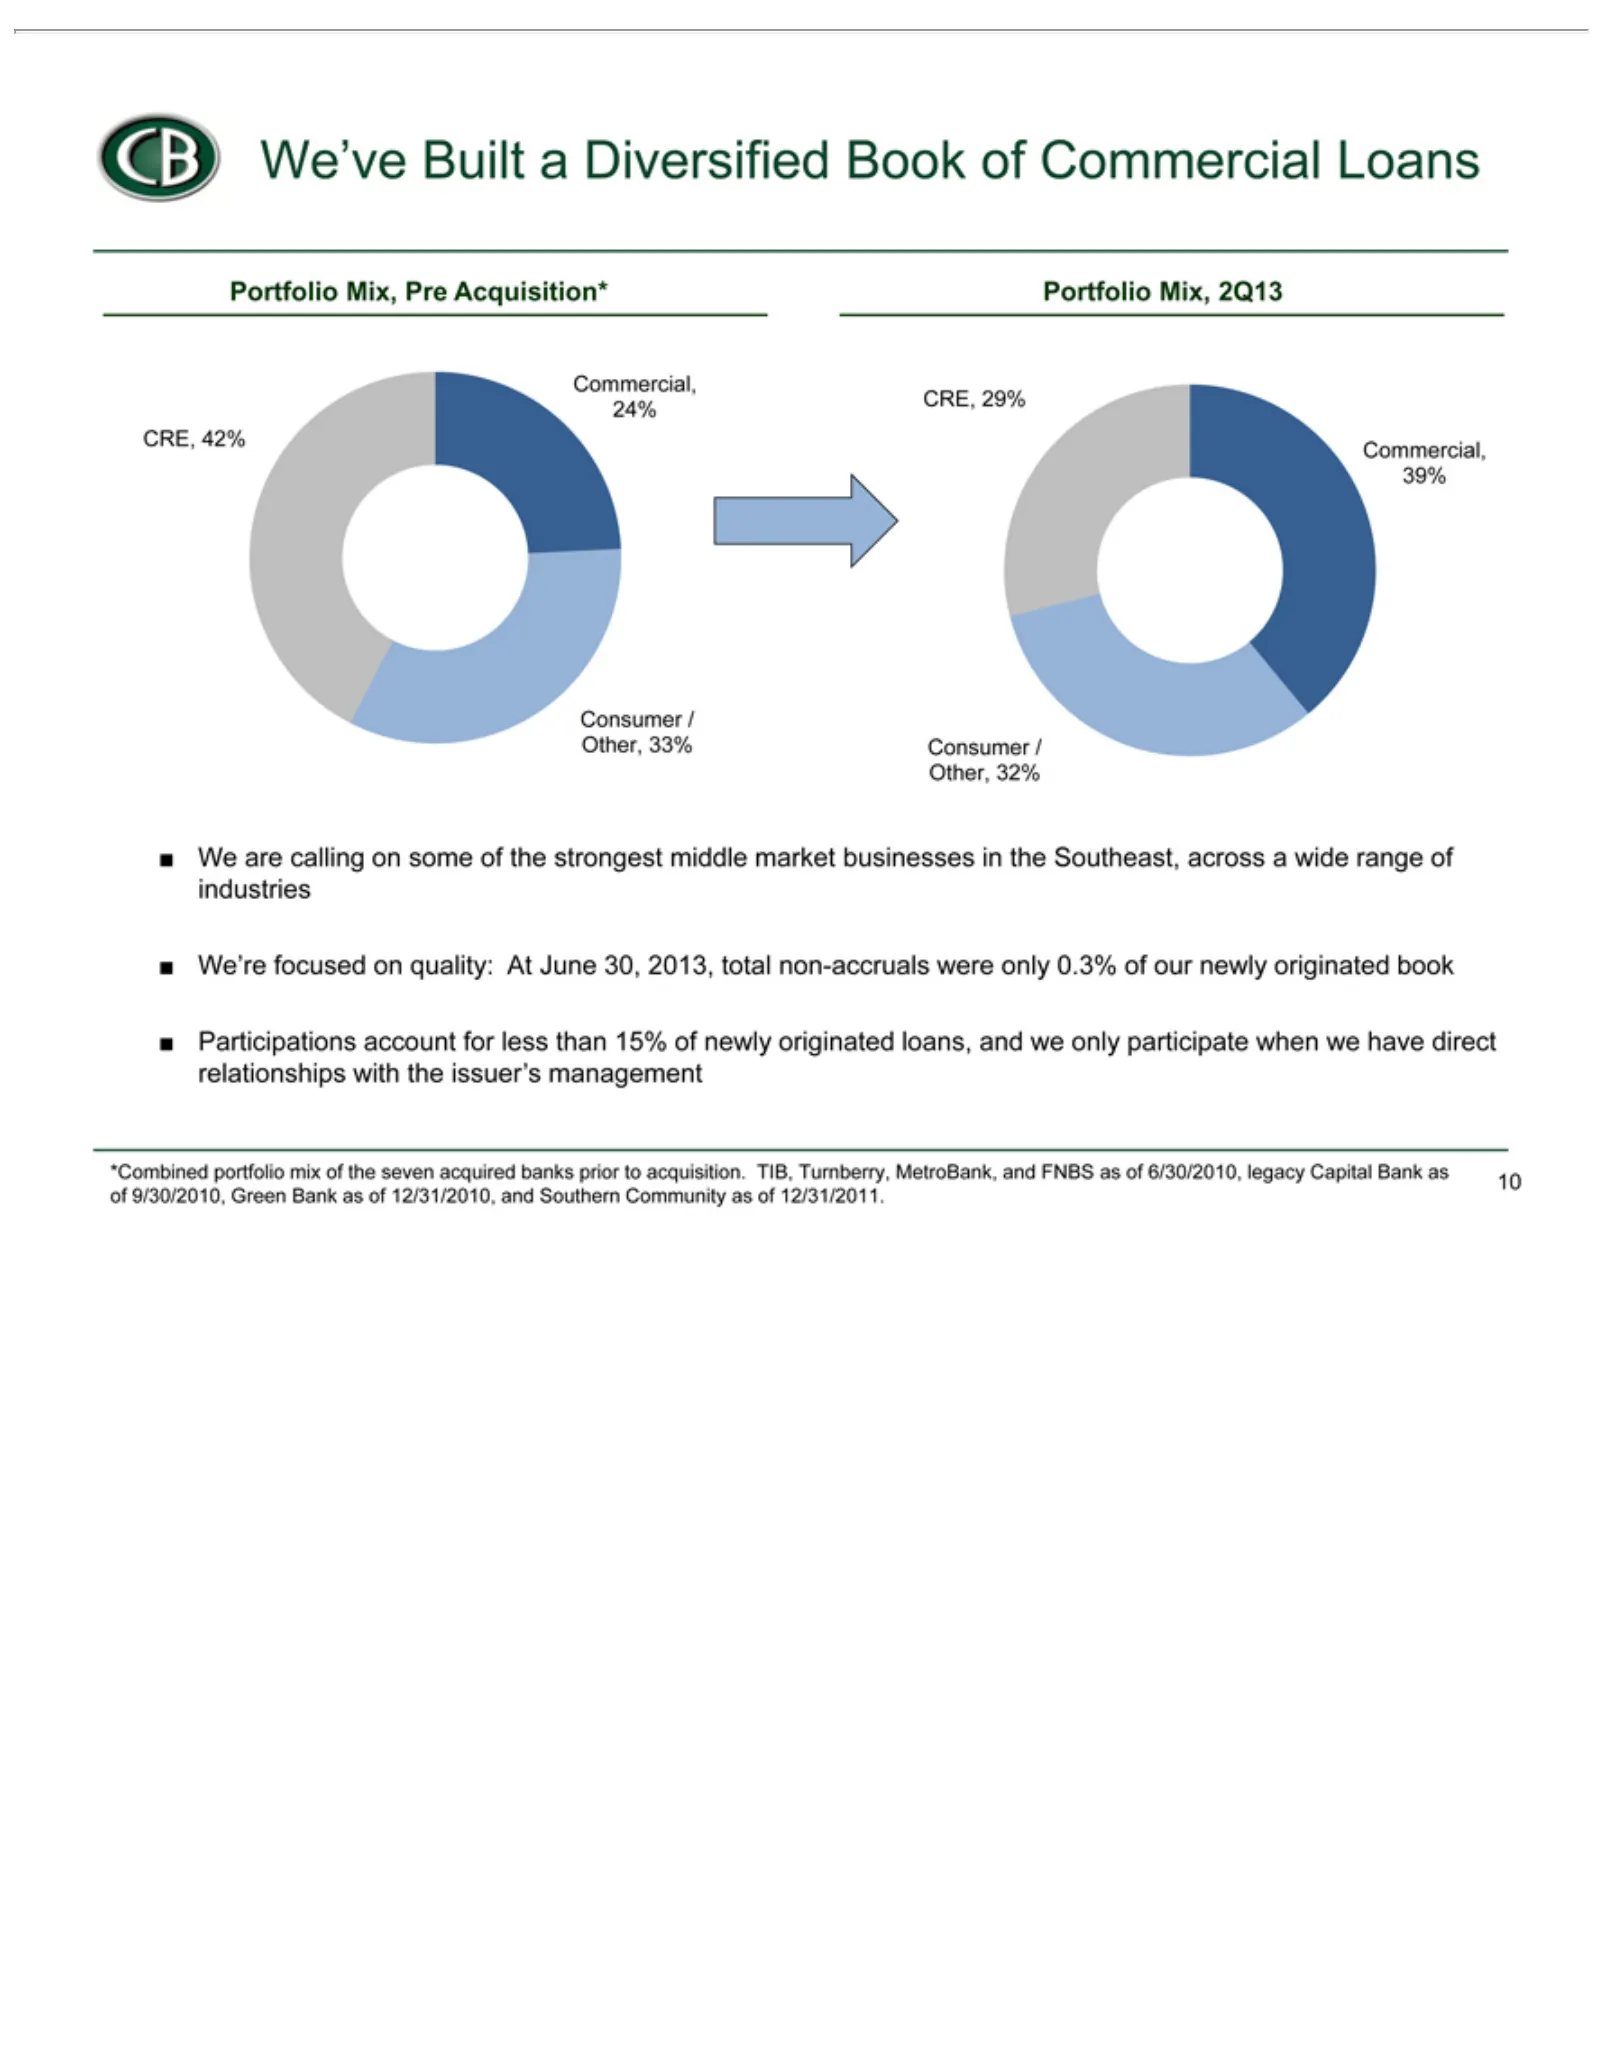
Slide 10: Diversified Loan Portfolio Mix
CB are Portfolio CRE, Commercial, Consumer We We’re Participations *Combined Community 10 We’ve 42% 29% focused calling Mix, /Built Other, portfolio as39% 24% account Pre 2Q13 on ofa 12/31/2011. some quality: Diversified Acquisition* 33% 32% mix for ofof less At thethe June Book strongest than seven
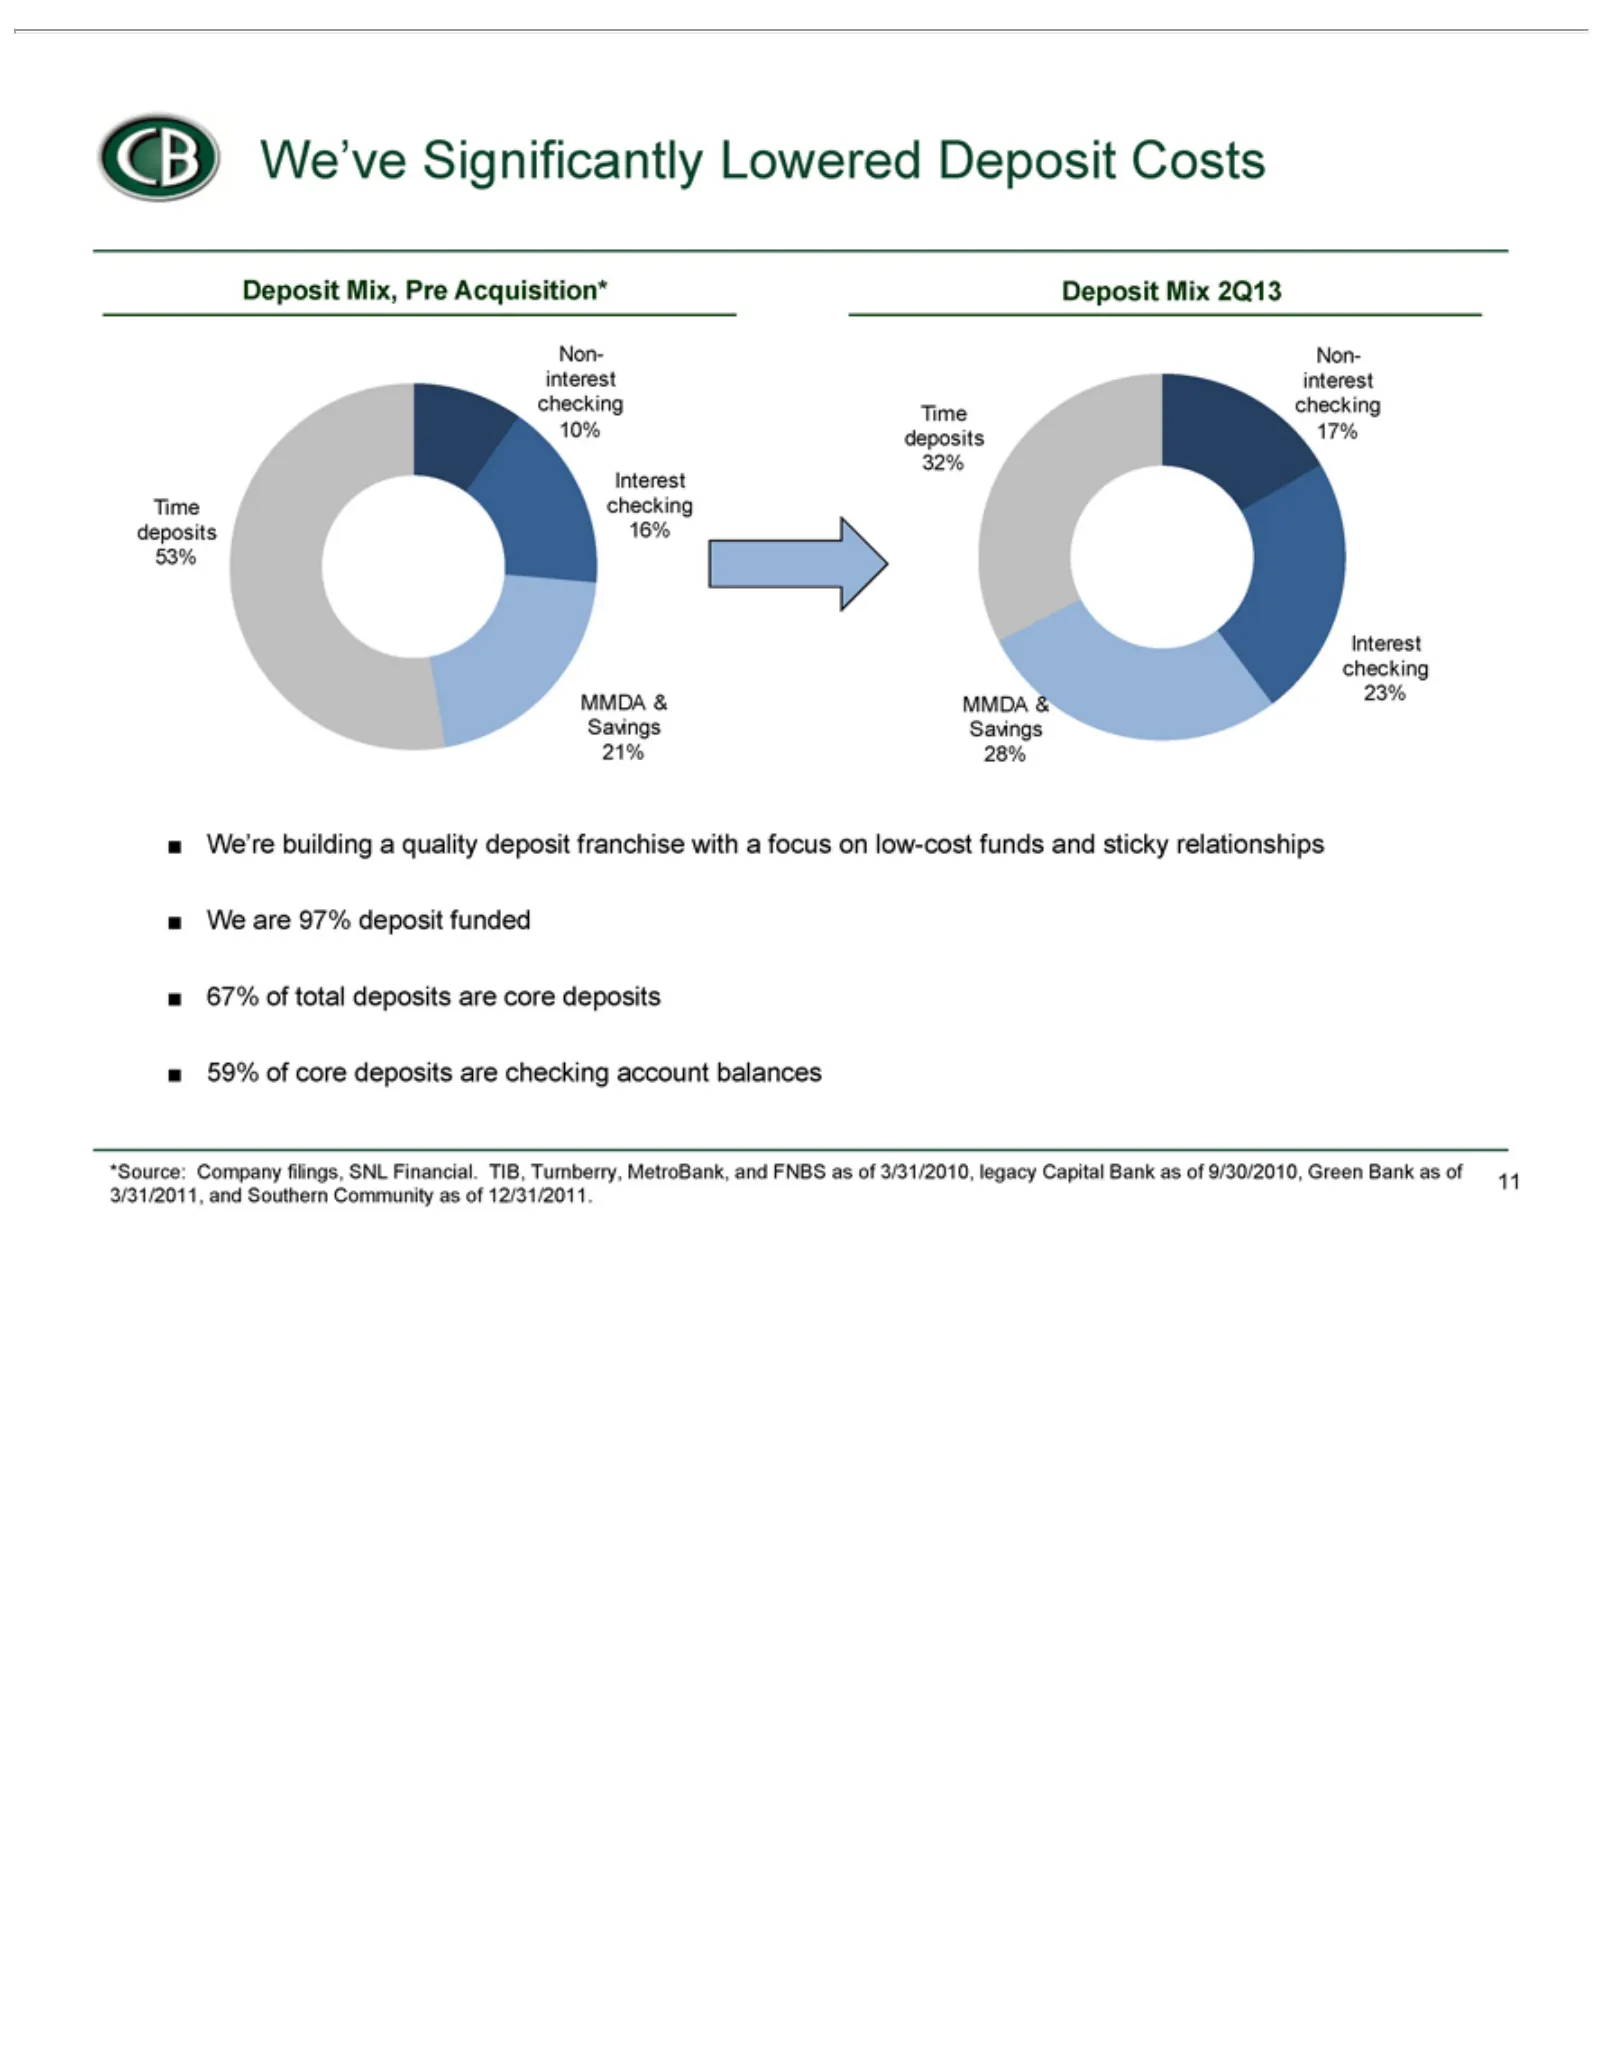
Slide 11: Deposit Mix Significantly Improved
CB are Deposit Time MMDA Non-interest Interest We’re We 67% 59% *Source: 11 We’ve of deposits building 97% total core checking Mix, Mix &Company Significantly Savings deposit deposits checking 2Q13 Pre 53% 32% a quality Acquisition* 16% 23% 21% 28% filings, funded are 10% 17% Lowered deposit checkin
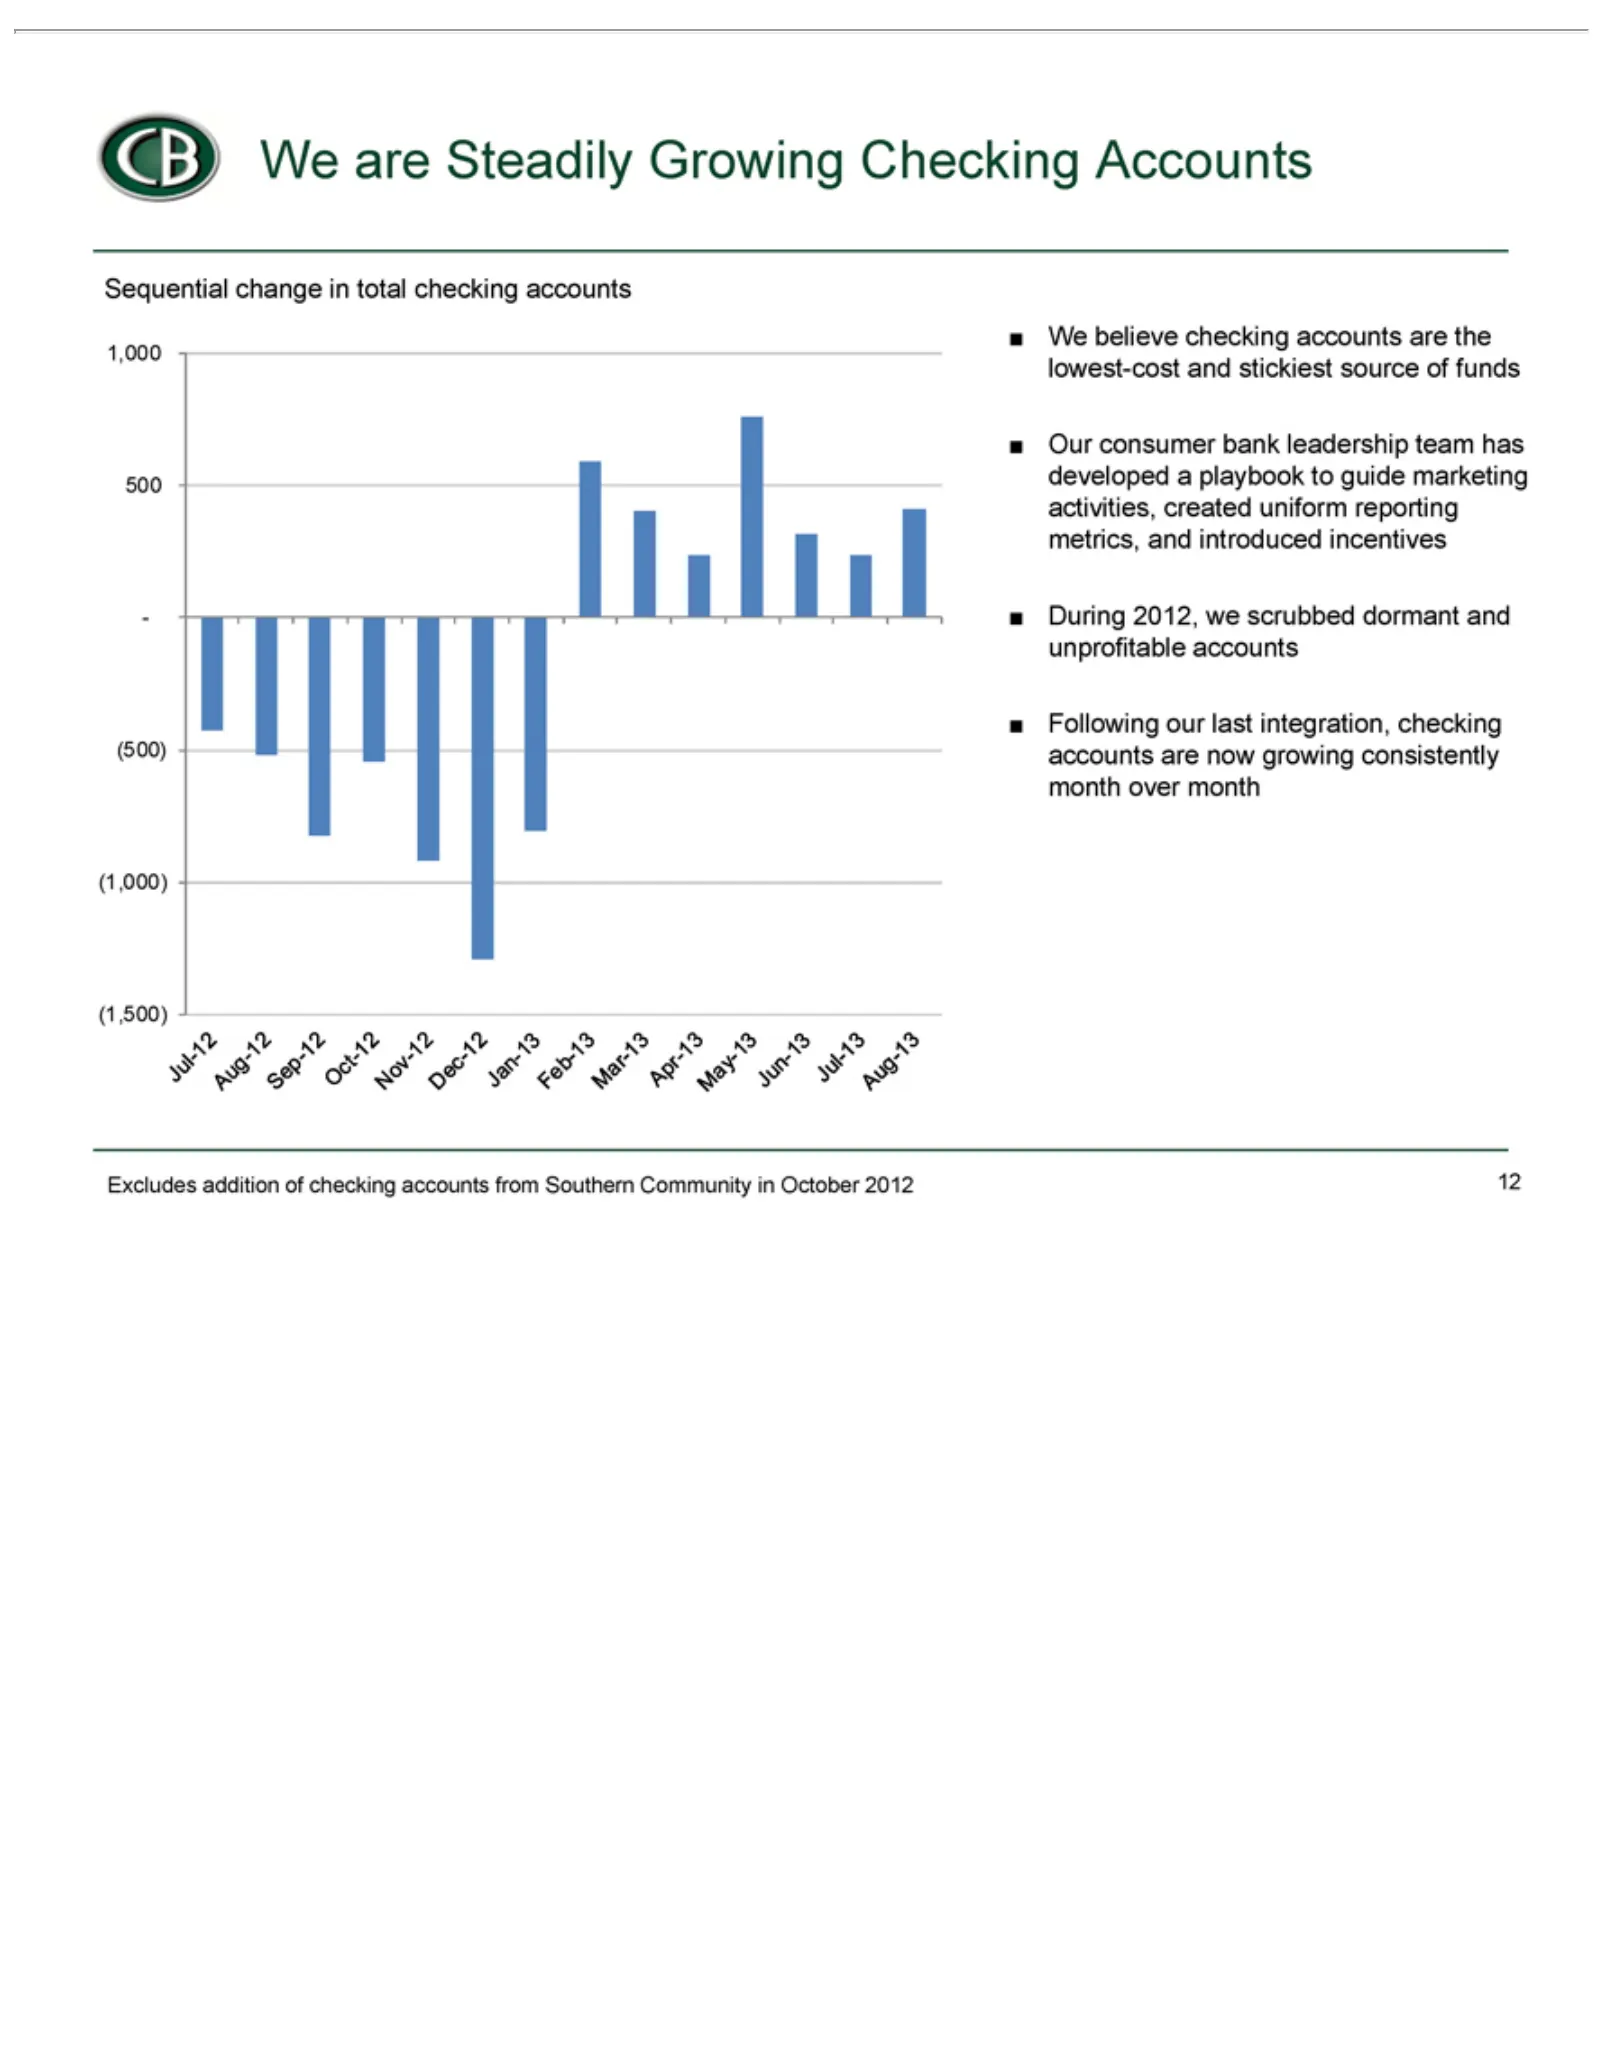
Slide 12: Steadily Growing Checking Accounts
CB believe Sequential 1,000 We Aug-13 Jul-13 Jun-13 May-13 Apr-13 Mar-13 Feb-13 Jan-13 Dec-12 Nov-12 Oct-12 Sep-12 Aug-12 Jul-12 Our During Following Excludes 12 We consumer 500 2012, areaddition -our change Steadily checking (500) we bank lastscrubbed (1,000) of in integration, Growing leadership c
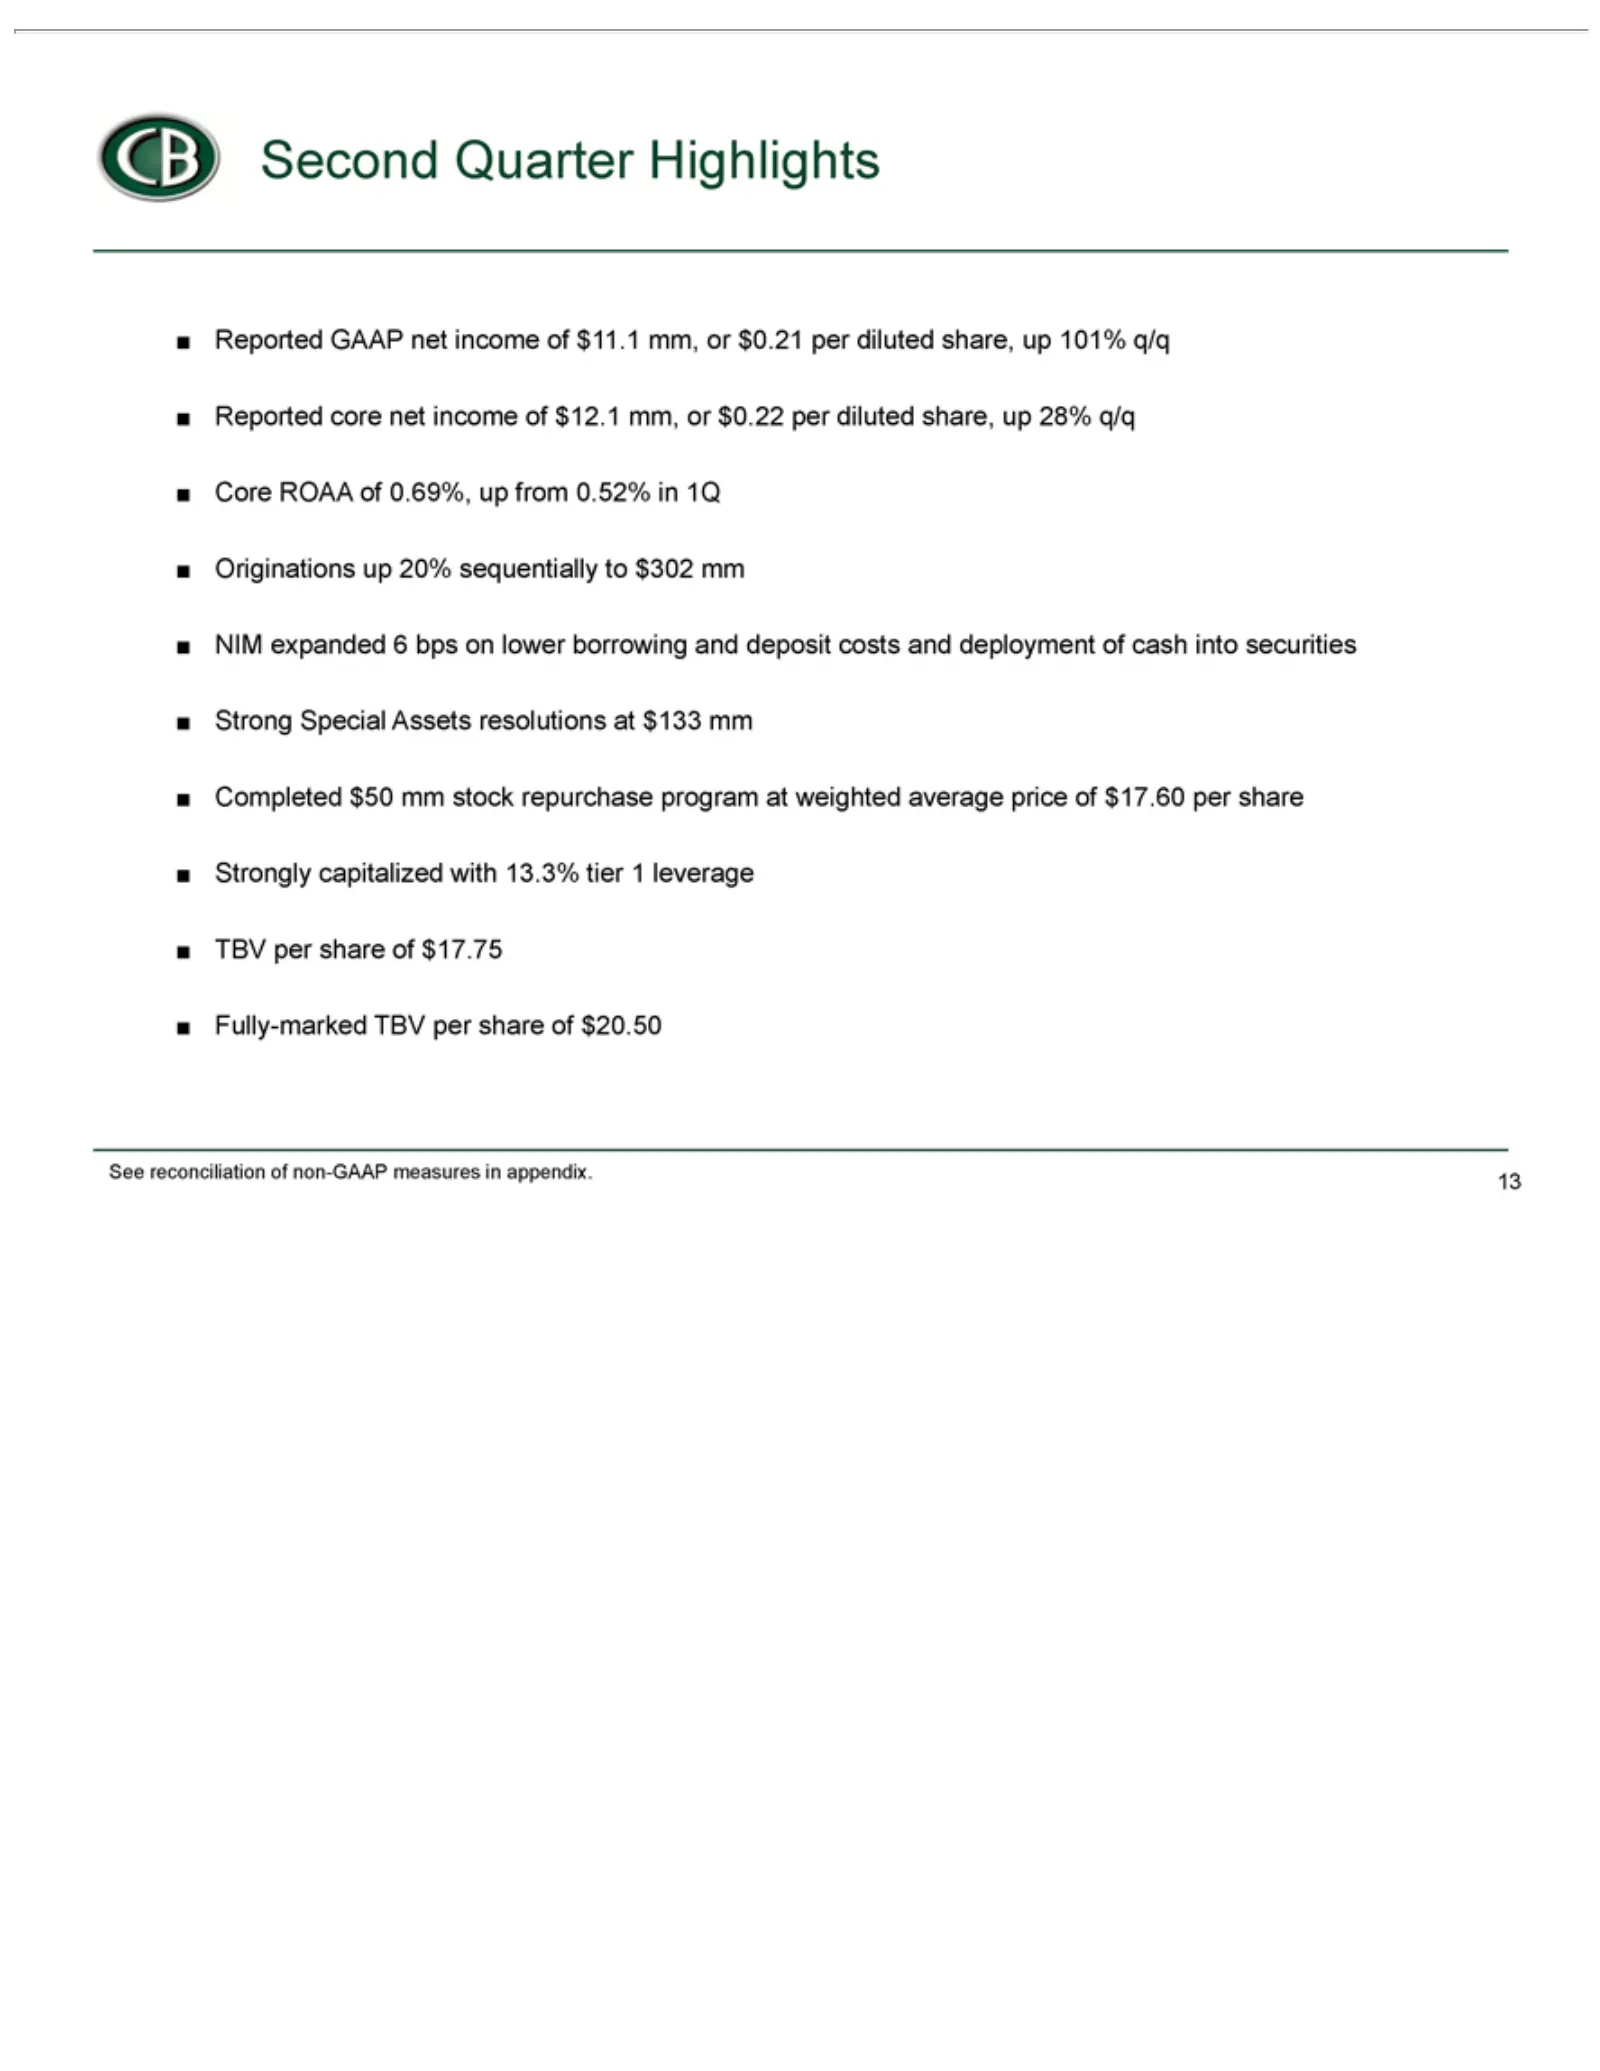
Slide 13: Second Quarter Highlights
CB Second Reported Core Originations NIM Strong Completed Strongly TBV Fully-marked See 13 reconciliation ROAA expanded per Special capitalized share GAAP core $50 Quarter of upTBV net Assets of 60.69%, mm 20% net bps $17.75 income ofper Highlights stock with income non-GAAP sequentially on resoluti
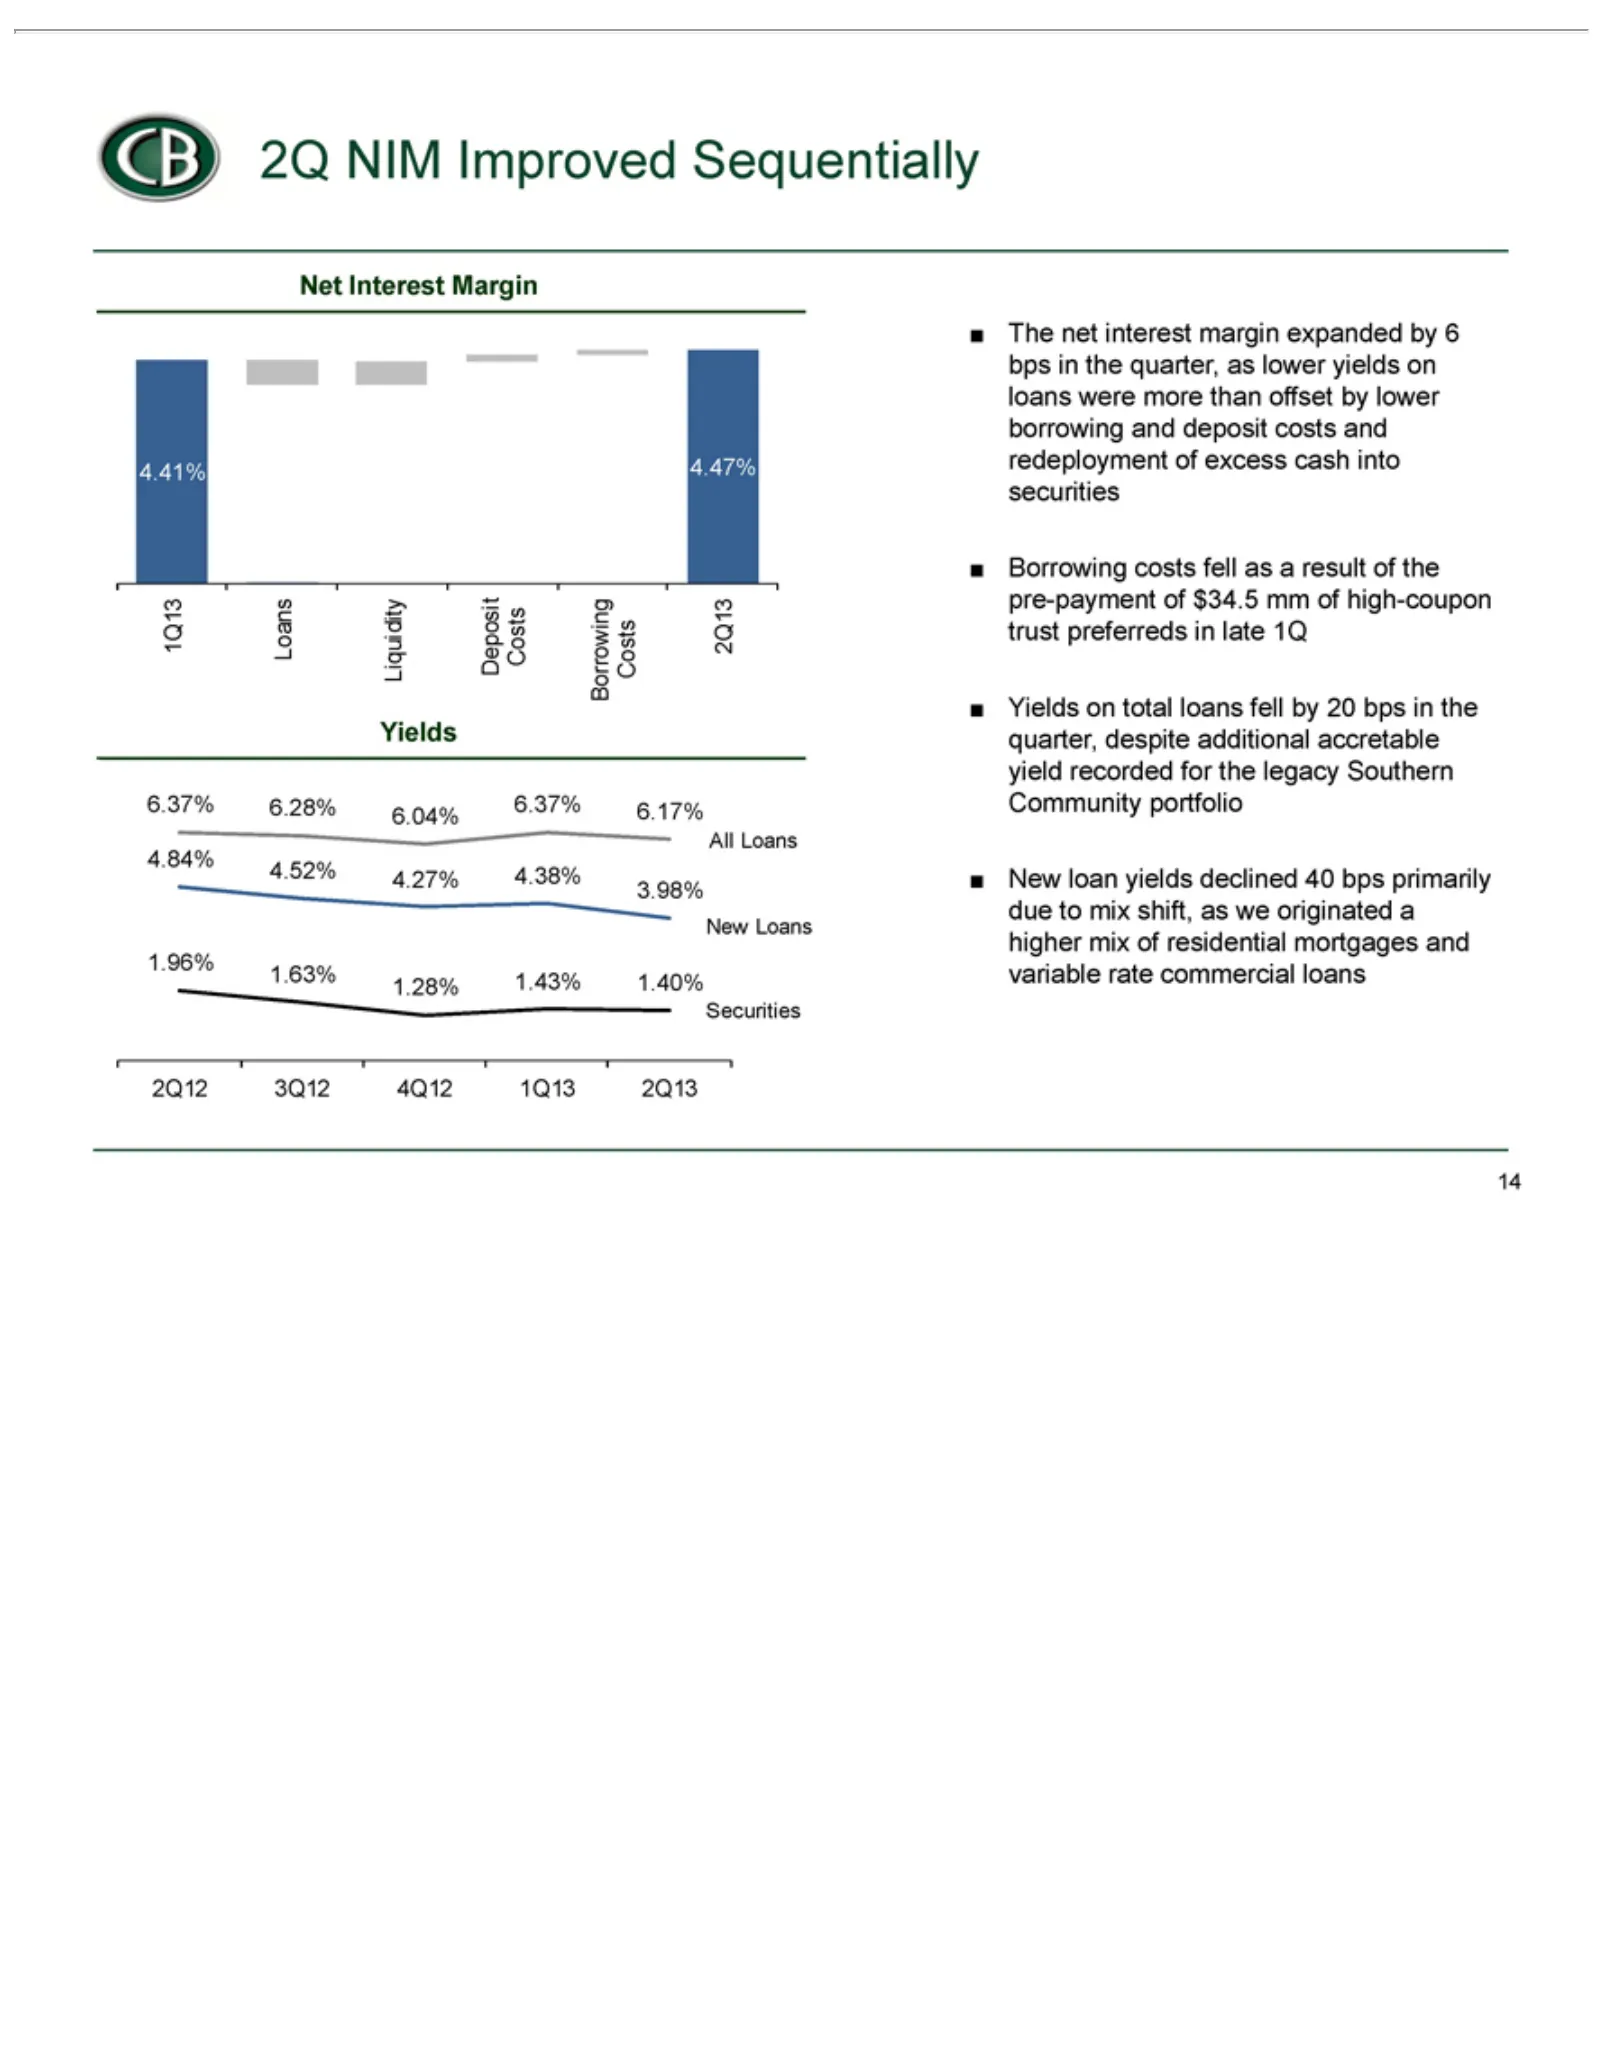
Slide 14: Net Interest Margin Expanded
CB Loans Net 4.41% Deposit Liquidity Loans All 6.17% 6.04% 6.28% 6.37% 3.98% 4.38% 4.27% 4.52% 4.84% The 2Q13 1Q13 4Q12 3Q12 2Q12 Securities 1.40% 1.43% 1.28% 1.63% 1.96% Borrowing Yields New 14 2Q Interest net Loans loan on 4.47% NIM interest Costs total yields Costs costs Margin Improved loans mar
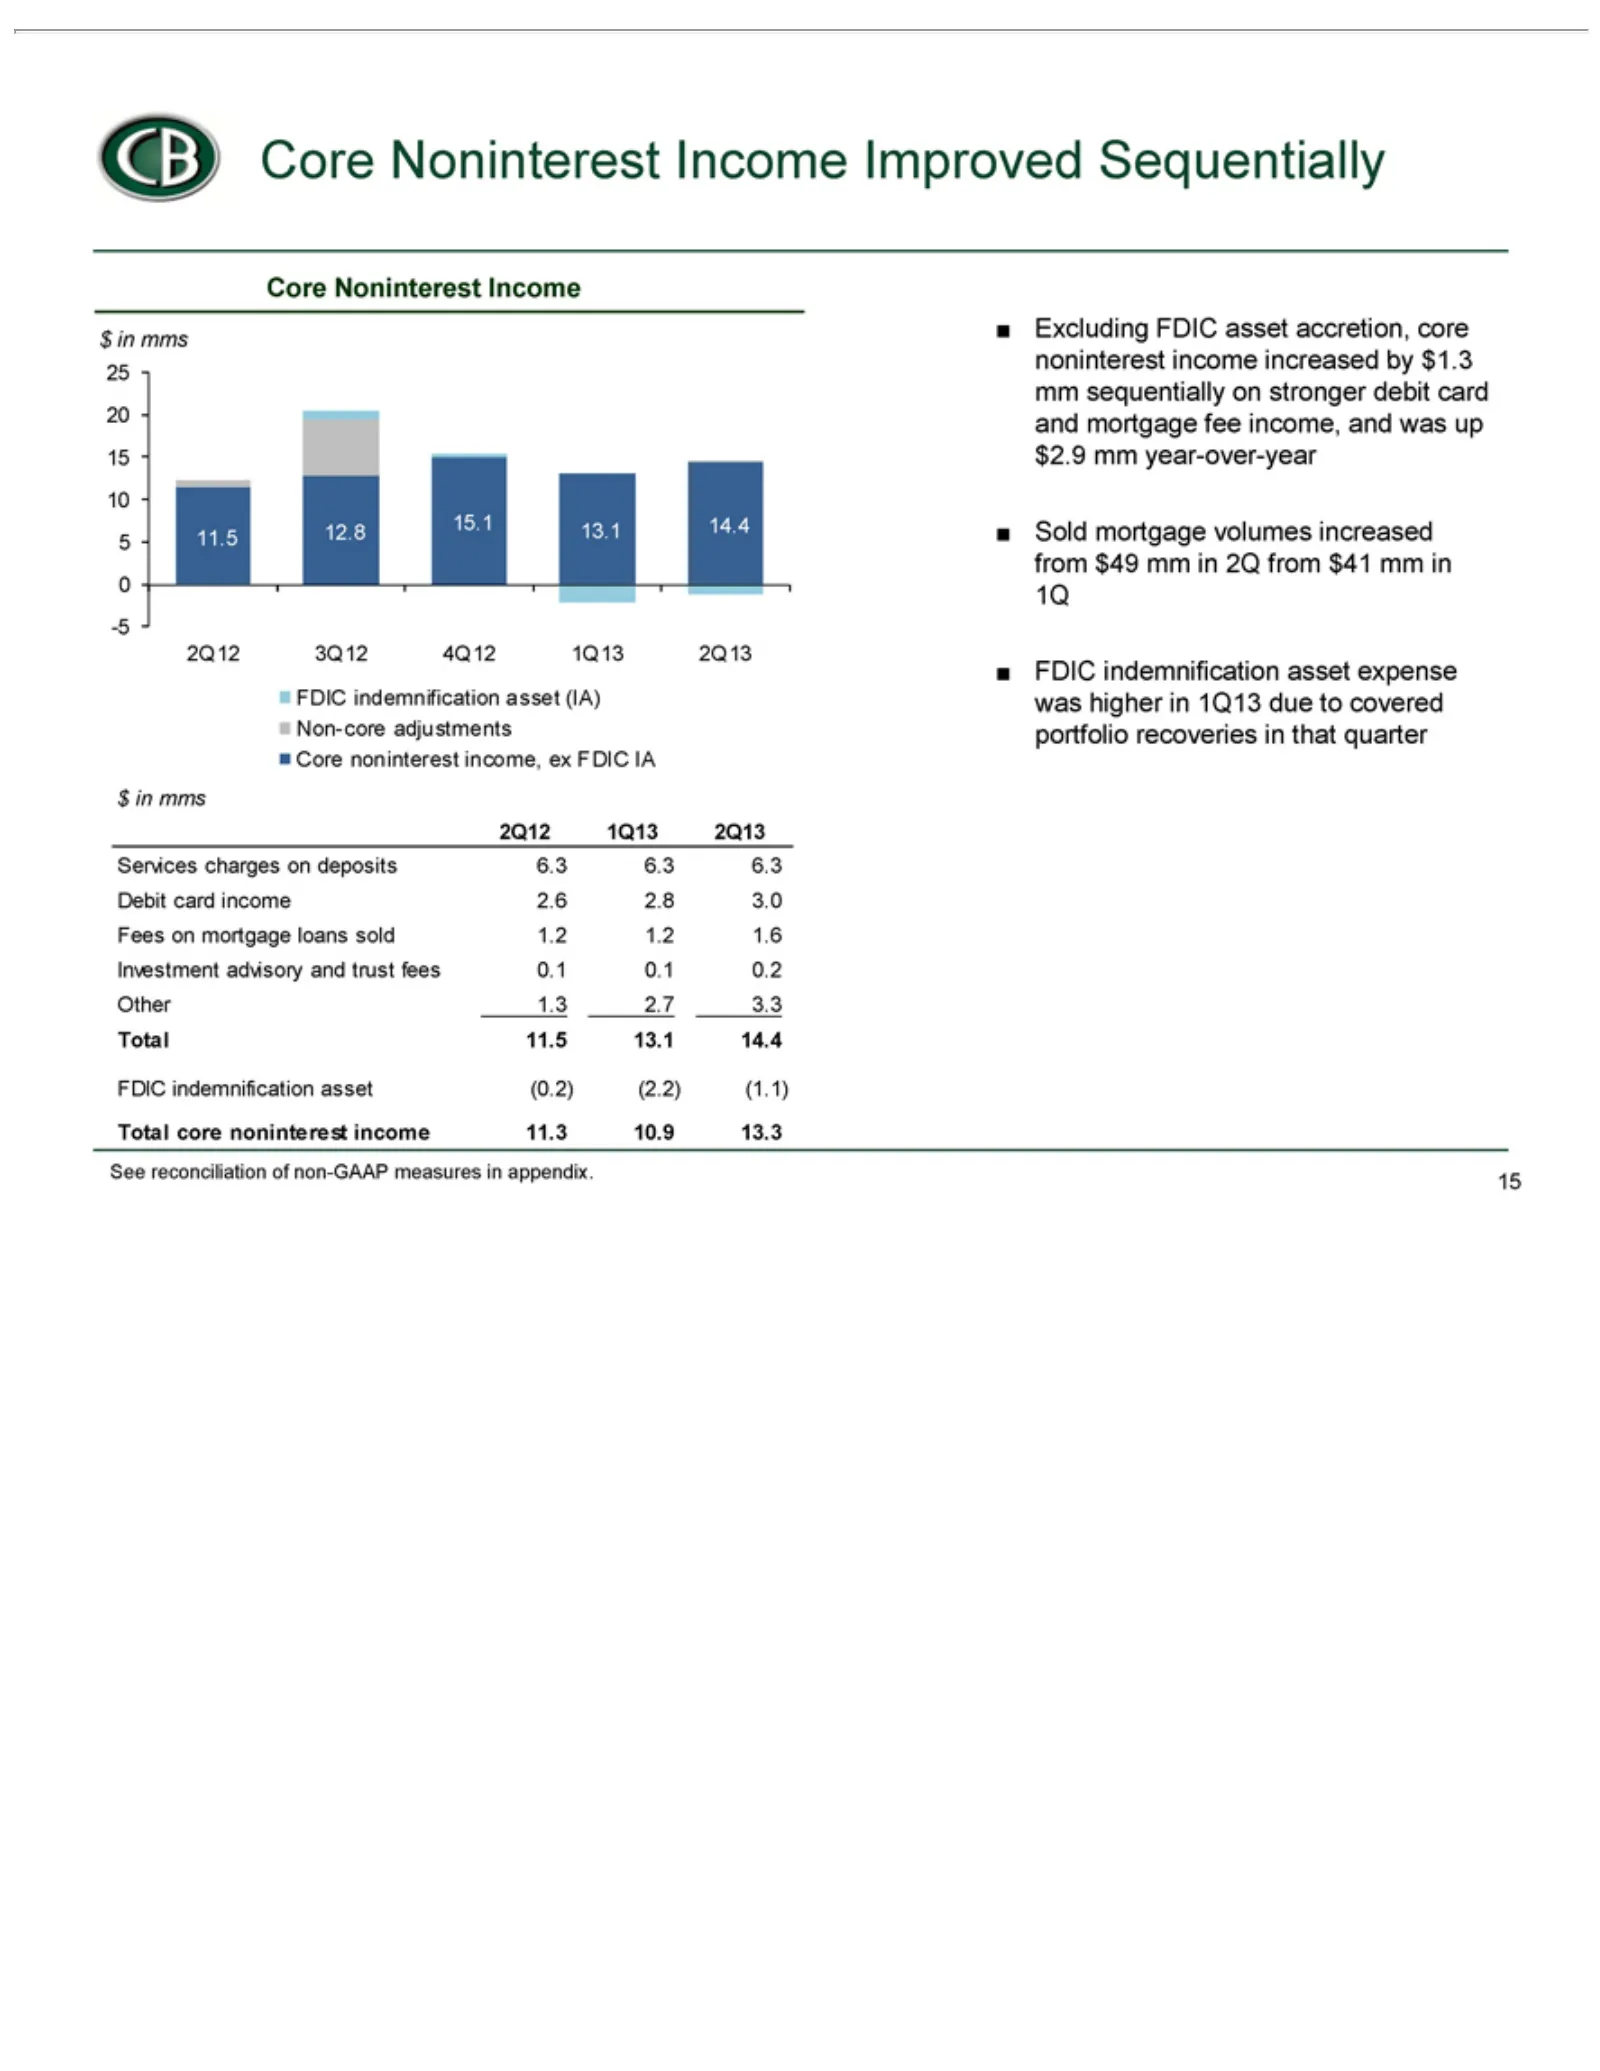
Slide 15: Core Noninterest Income Improved
CB 25 4Q12 3Q12 14.4 13.1 15.1 12.8 11.5 Non-core $Core Services 2Q13 1Q13 2Q12 Debit Fees Investment Other Total See Excluding Sold FDIC 15in20 Core reconciliation mms on mortgage Noninterest noninterest 11.5 core card 15 1.3 indemnification mortgage charges 10 Noninterest adjustments 2.7 13.1 noni
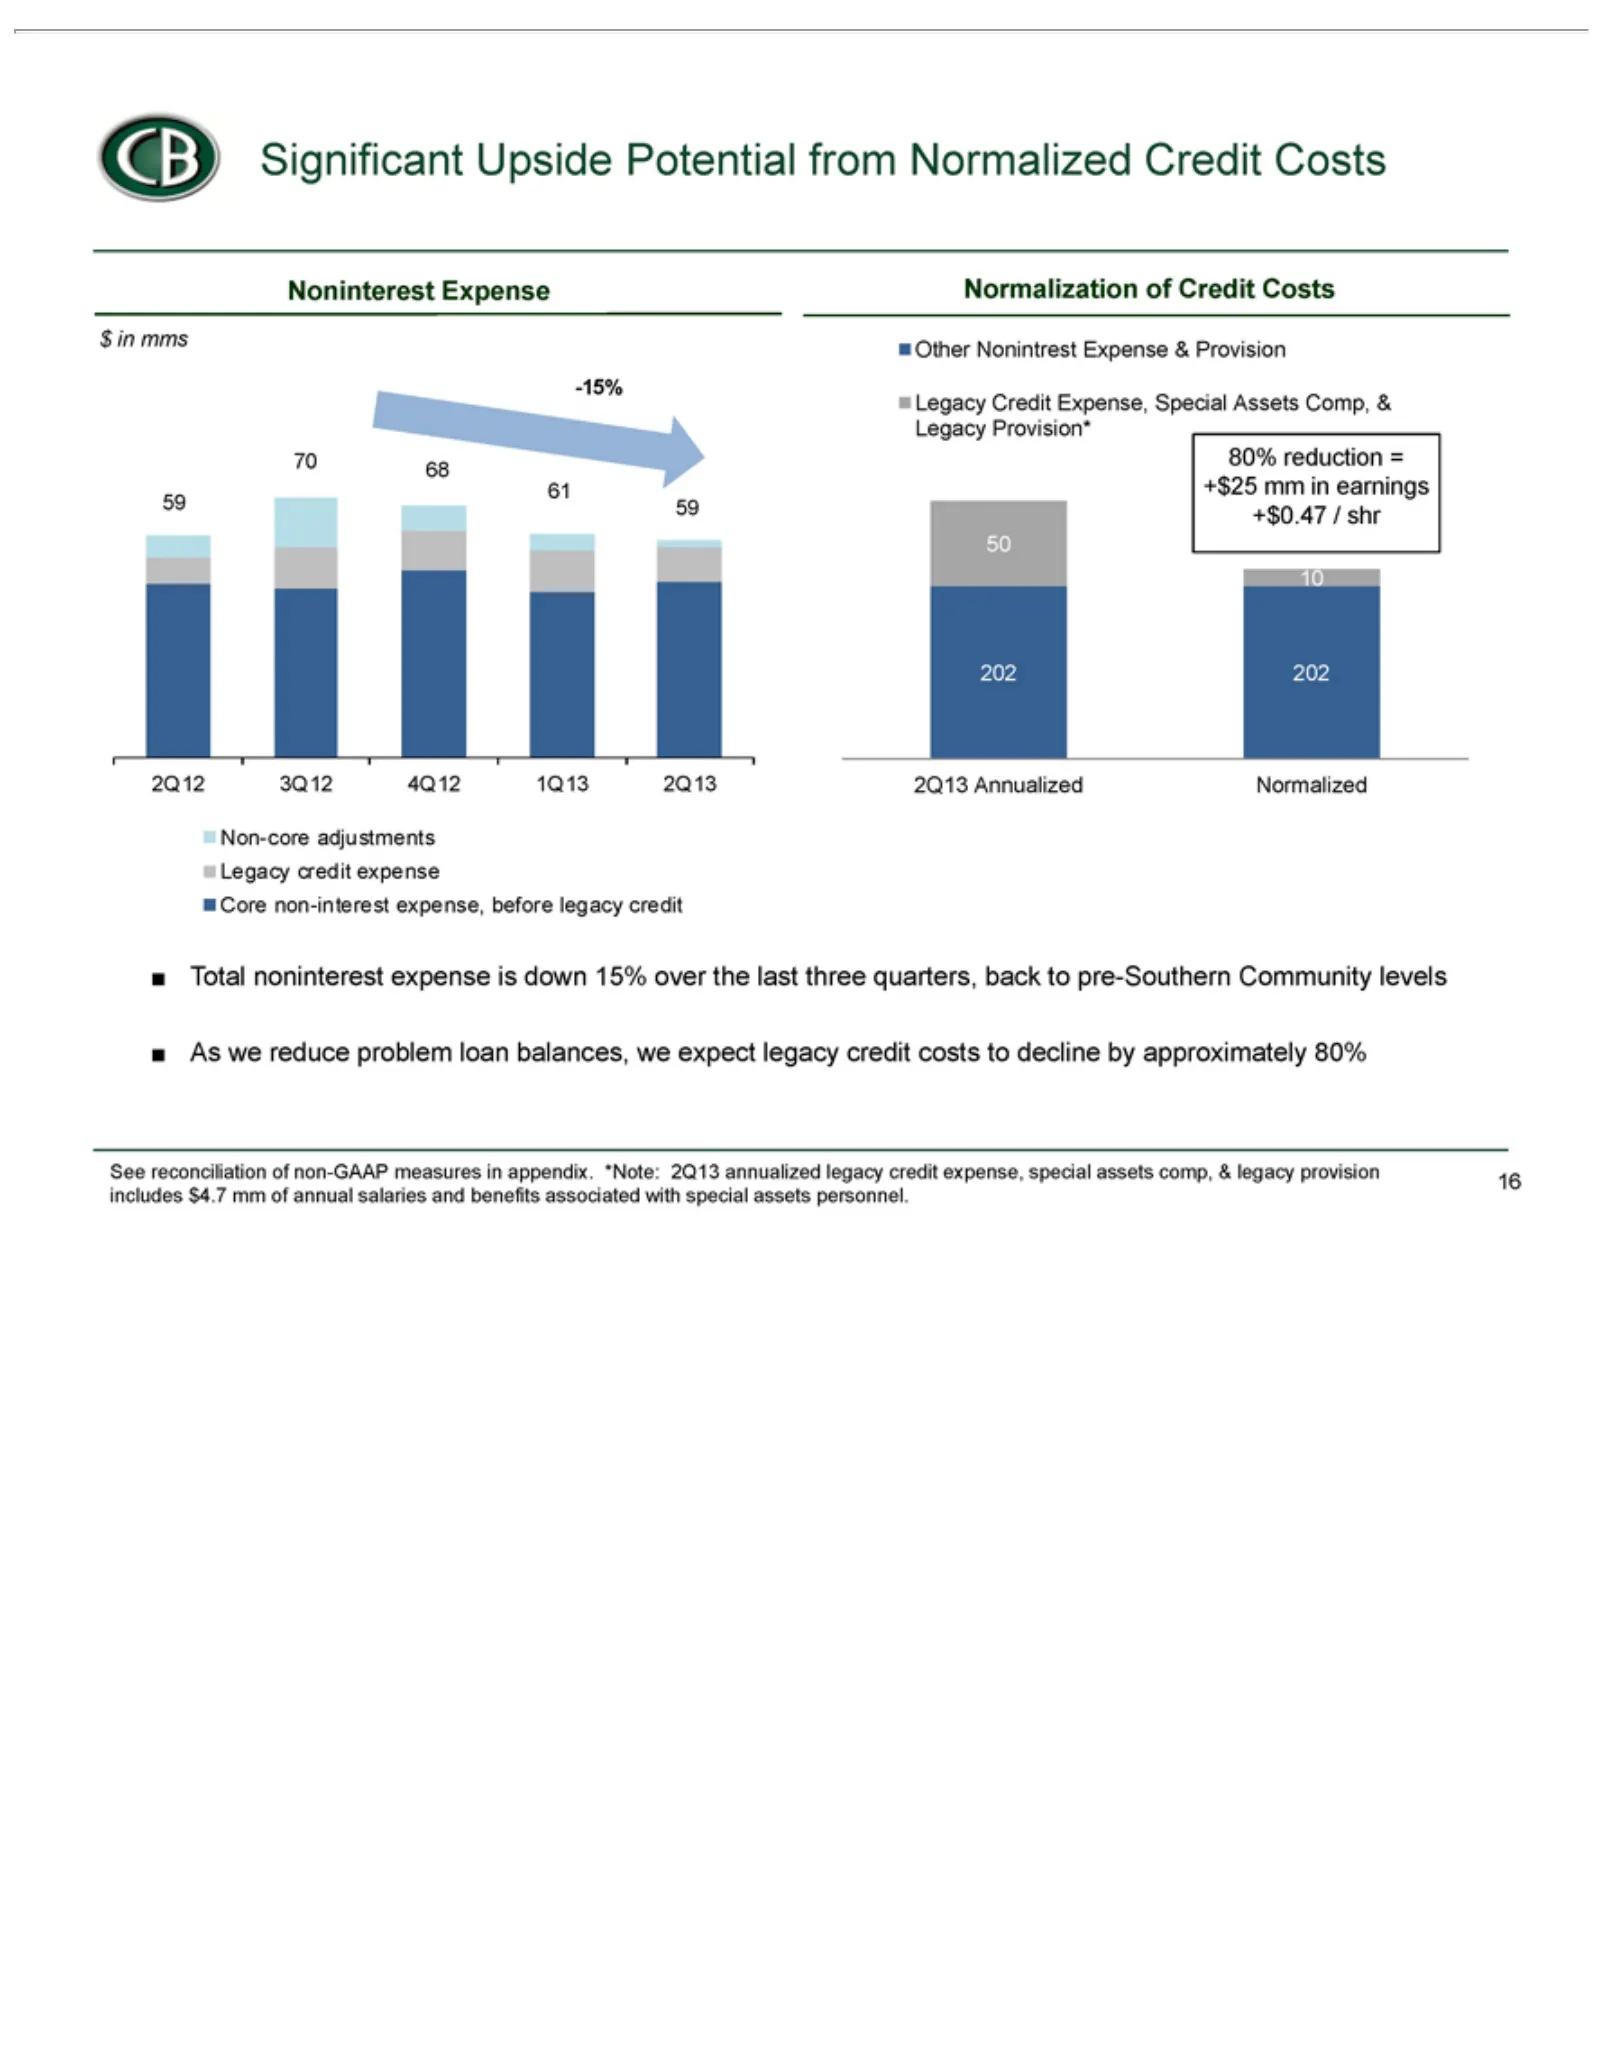
Slide 16: Significant Reduction in Noninterest Expense
CB $Noninterest 59 -15% 2Q12 Normalization Other 80% 50 202 2Q13 Non-core Legacy Core Total As See assets 16in10 70 we Significant reconciliation 202 mms reduction non-interest noninterest Annualized 3Q12 68 Nonintrest personnel. reduce Credit credit 61 adjustments Expense 4Q12 59problem expense Exp
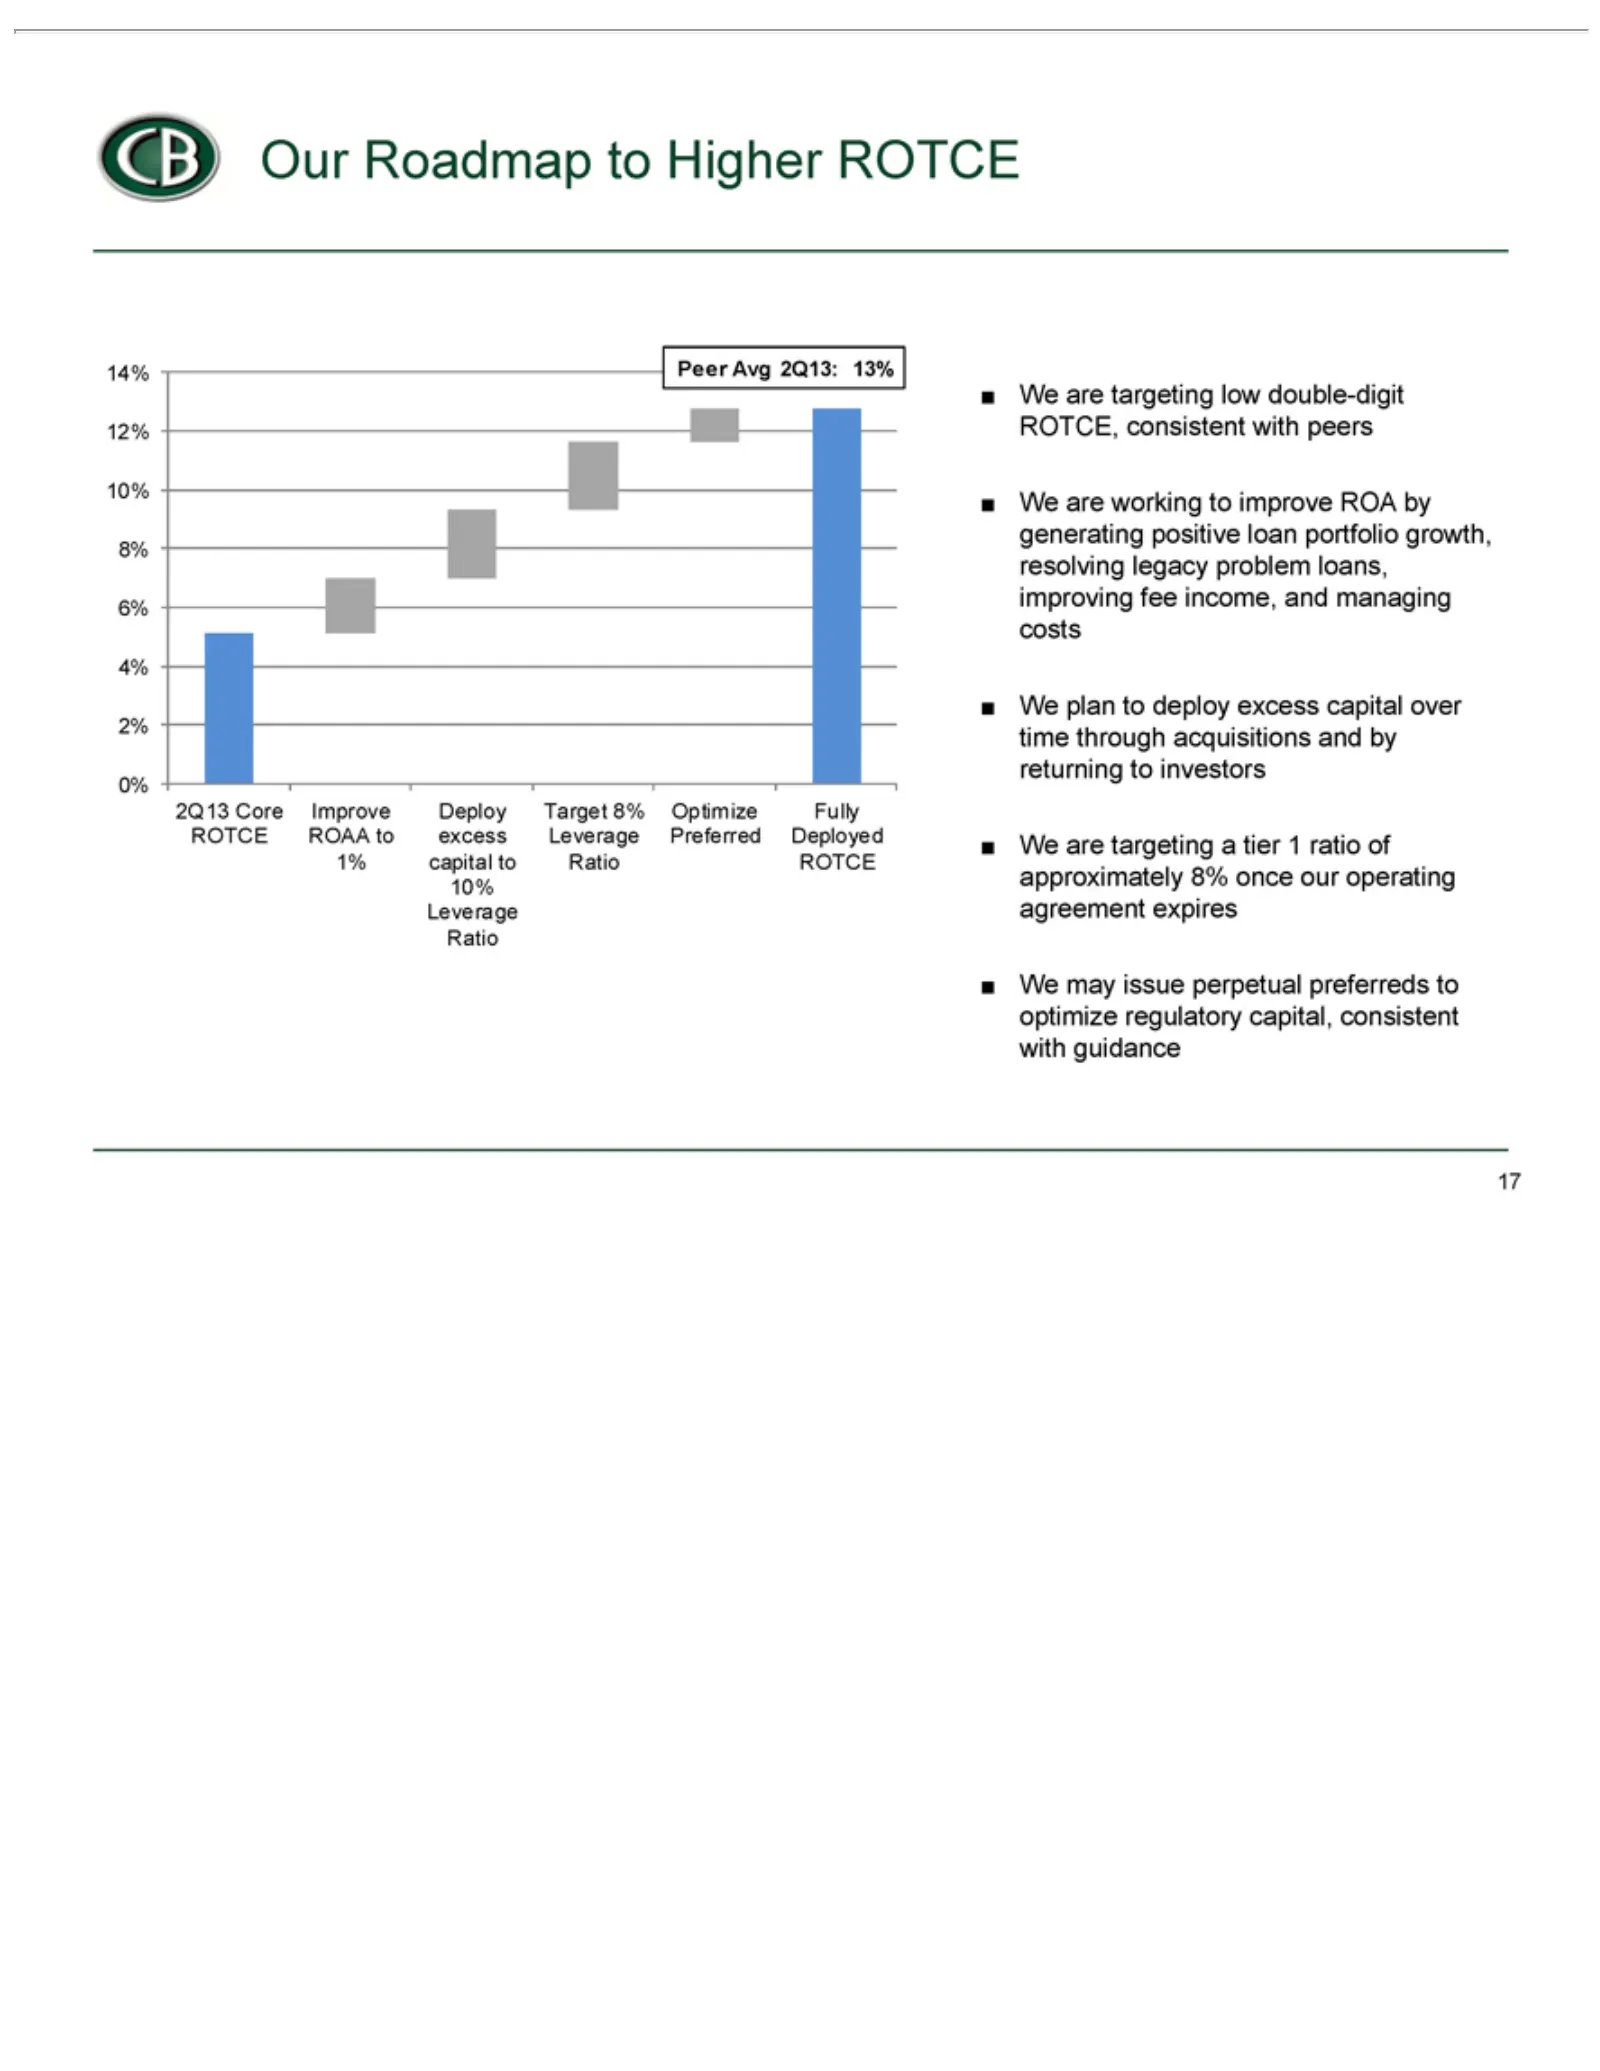
Slide 17: Roadmap to Improve ROTCE
CB may Peer 2Q13 0% 2% 4% 6% 8% 10% 12% 14% Improve Deploy Target Optimize Fully We 17 plan are Our Avg Deployed Core 8% working targeting excess Roadmap to issue ROAA 2Q13: Preferred Leverage deploy ROTCE perpetual capital ROTCE to 13% alow to tier excess improve 1%Ratio Higher double-digit to 1 pr
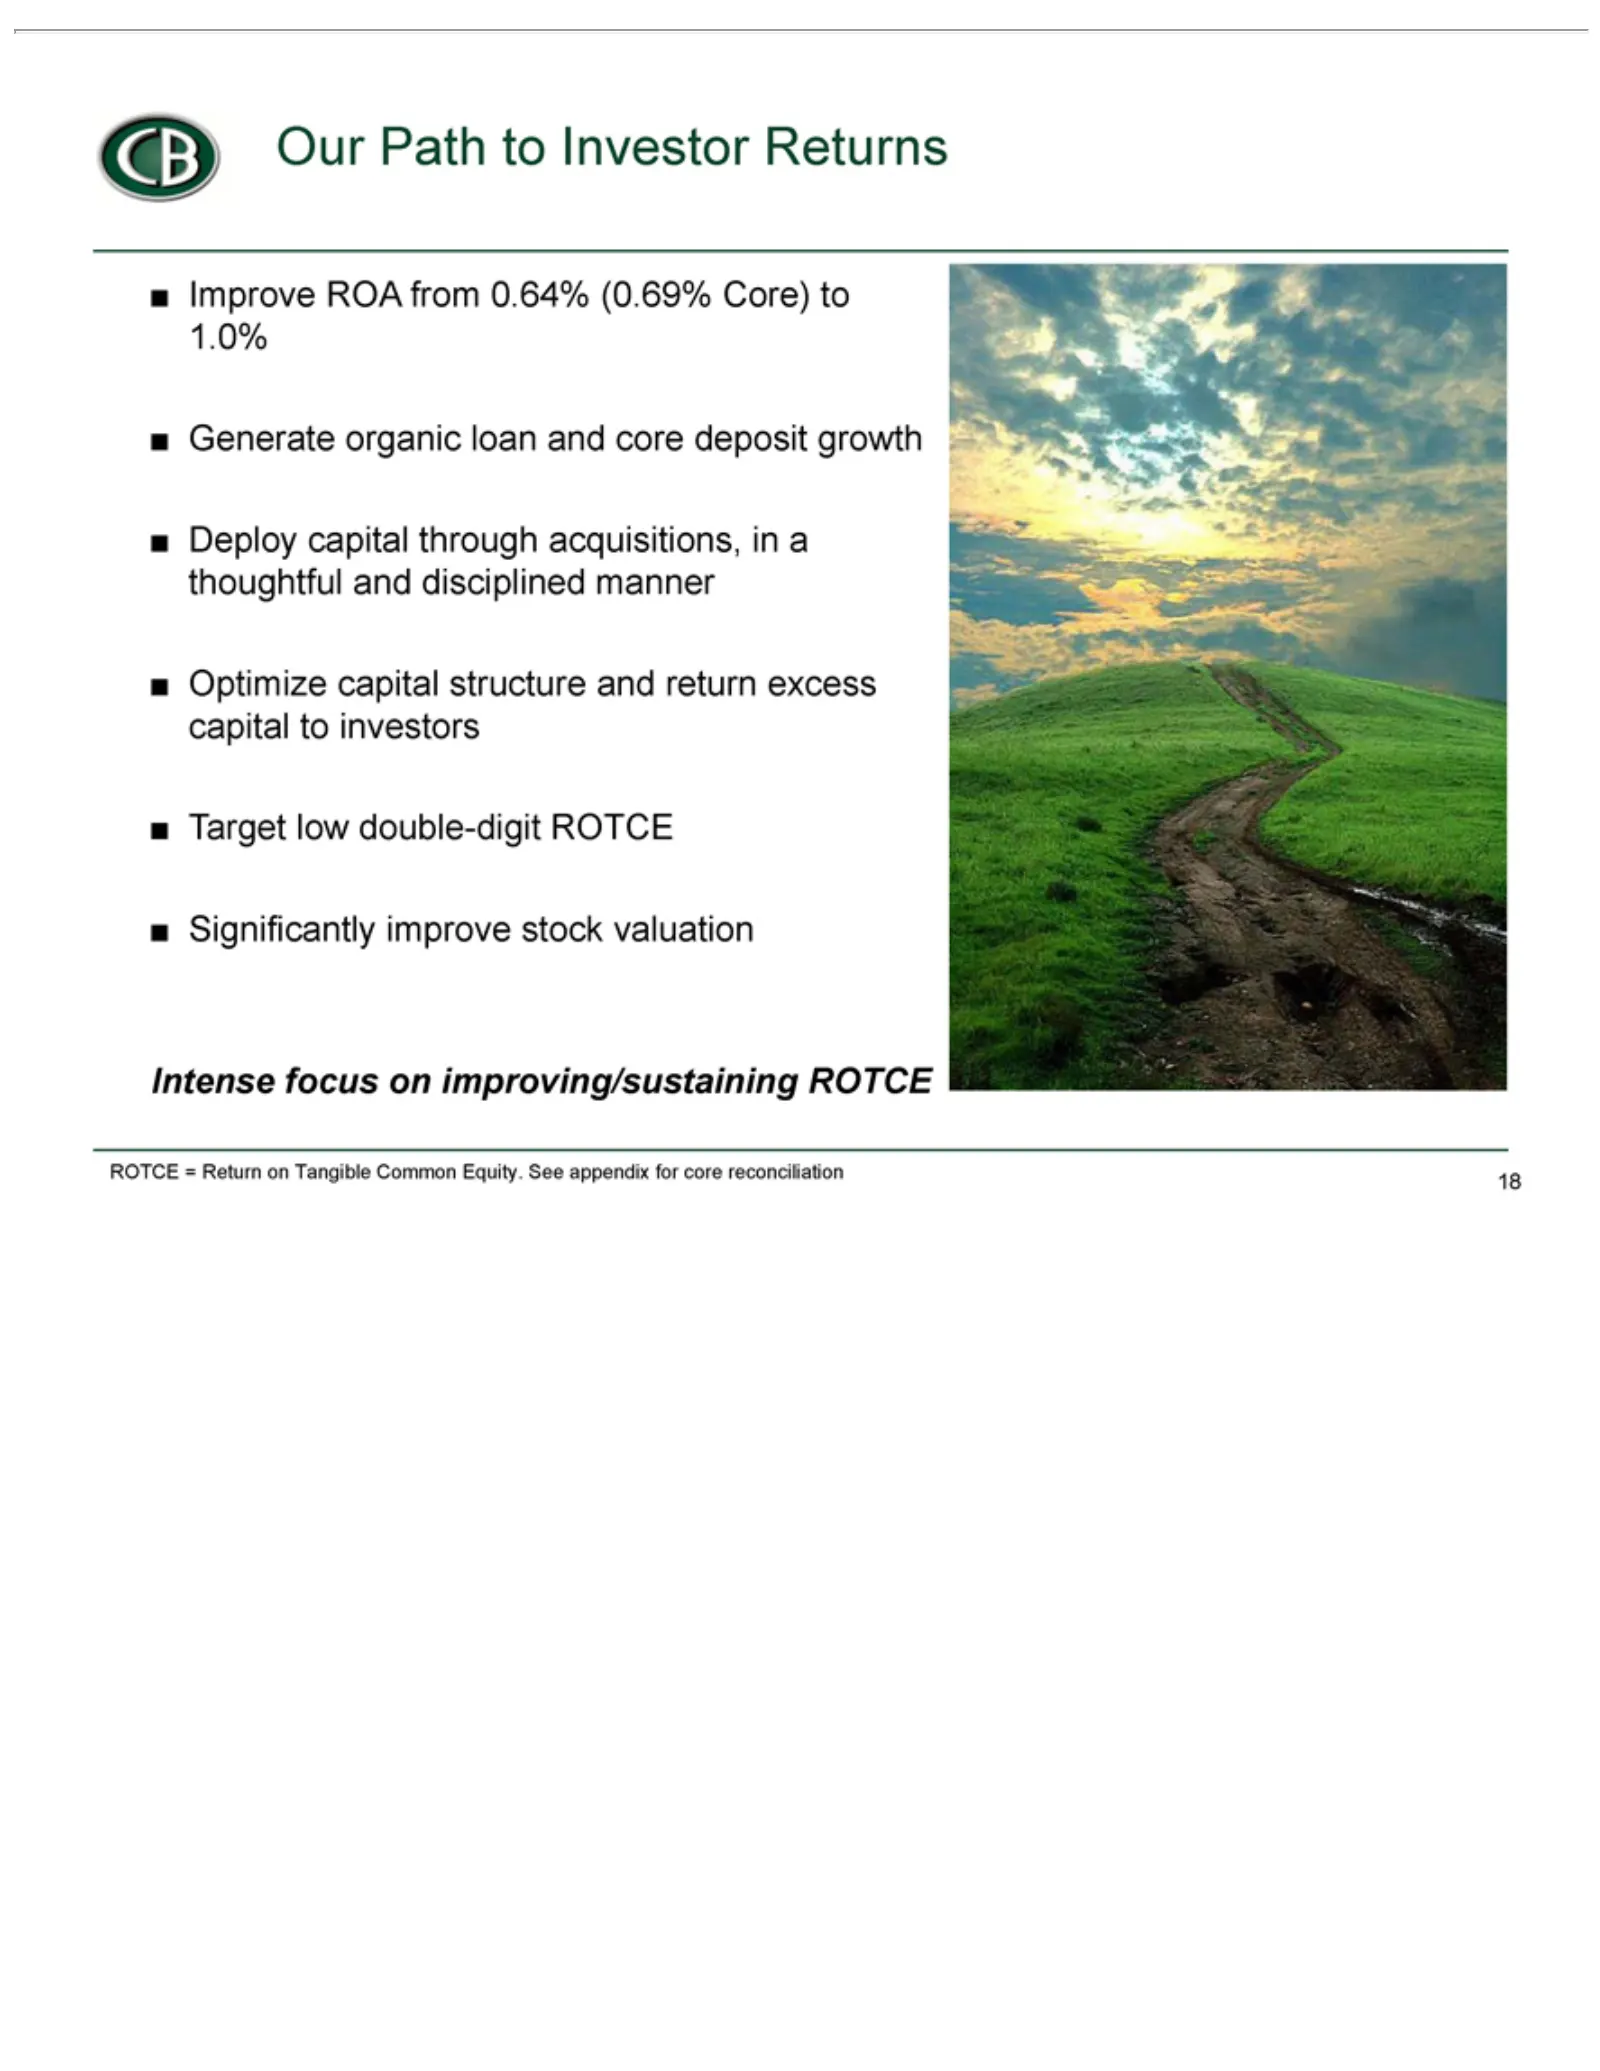
Slide 18: Our Path to Improving Investor Returns
CB Ourlow Improve Generate Deploy Optimize Target Significantly Intense ROTCE 18 focus capital Path =ROA organic capital Return double-digit improve to on from through Investor improving/sustaining structure loan on0.64% Tangible stock and acquisitions, ROTCE Returns and core (0.69% valuation Common
Slide 19: Appendix
19 Appendix CB
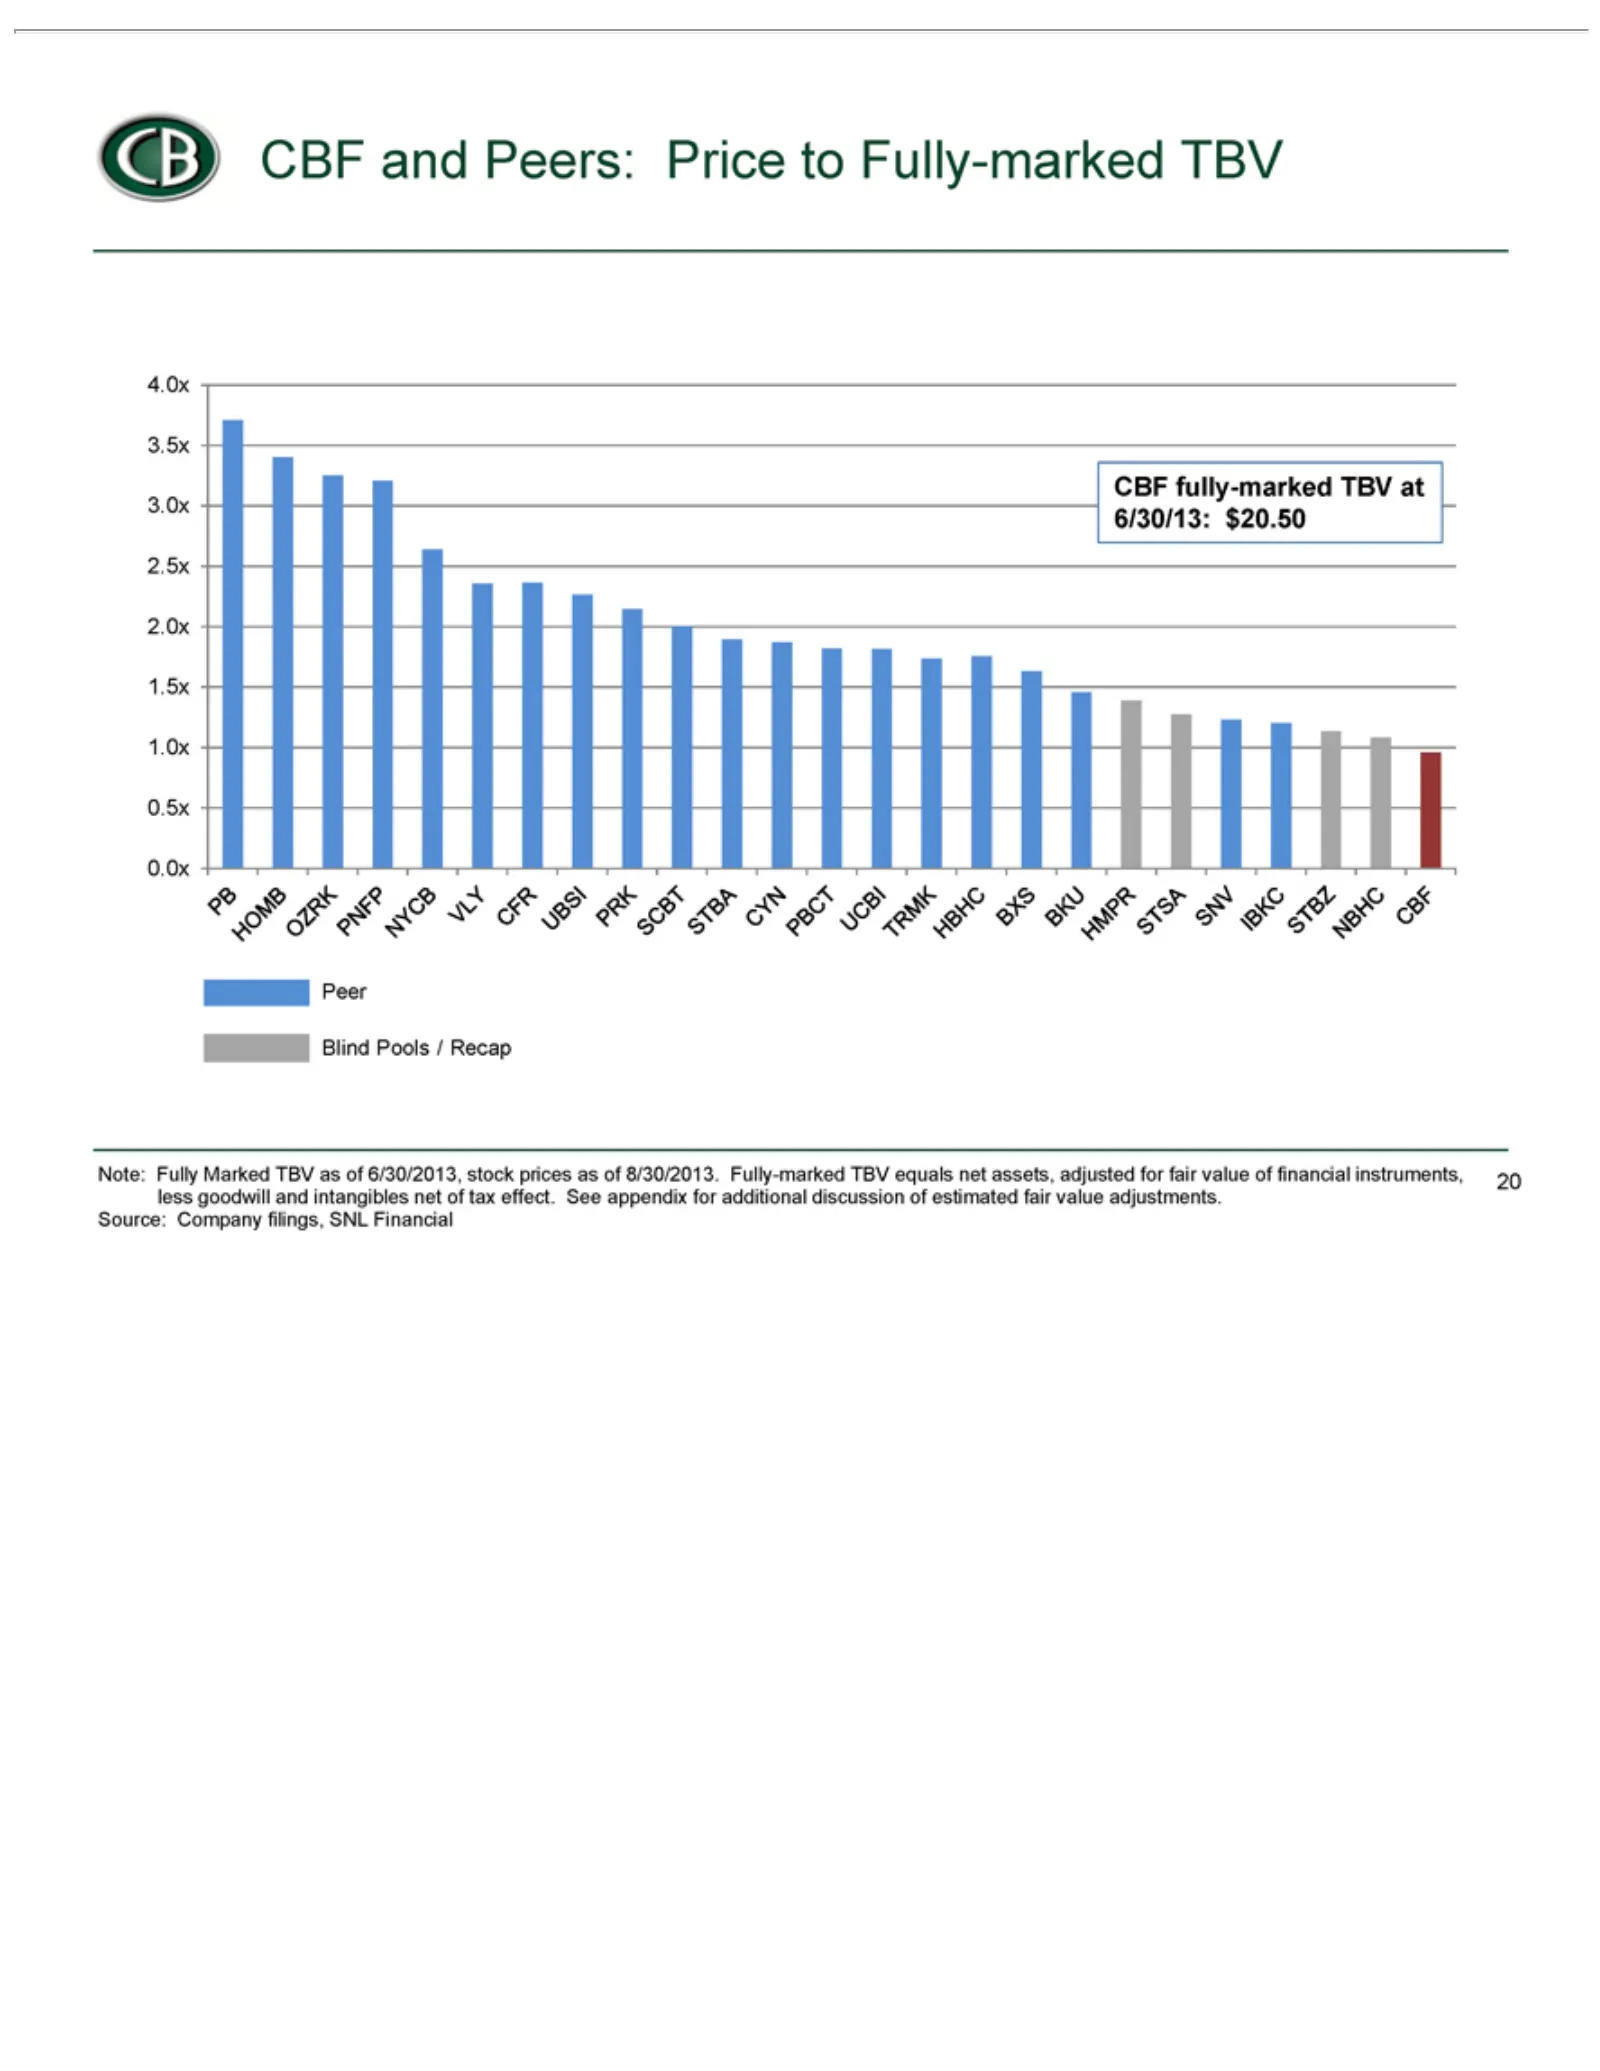
Slide 20: Additional Peer Comparison
CB additional Blind Peer CBF NBHC STBZ IBKC SNV STSA HMPR BKU BXS HBHC TRMK UCBI PBCT CYN STBA SCBT PRK UBSI CFR VLY NYCB PNFP OZRK HOMB PB 0.0x 0.5x 1.0x 1.5x 2.0x 2.5x 3.0x 3.5x 4.0x Note: for Source: 20 CBF fully-marked Fully Pools Company andMarked / Peers: Recap discussion filings, TBV Price TB
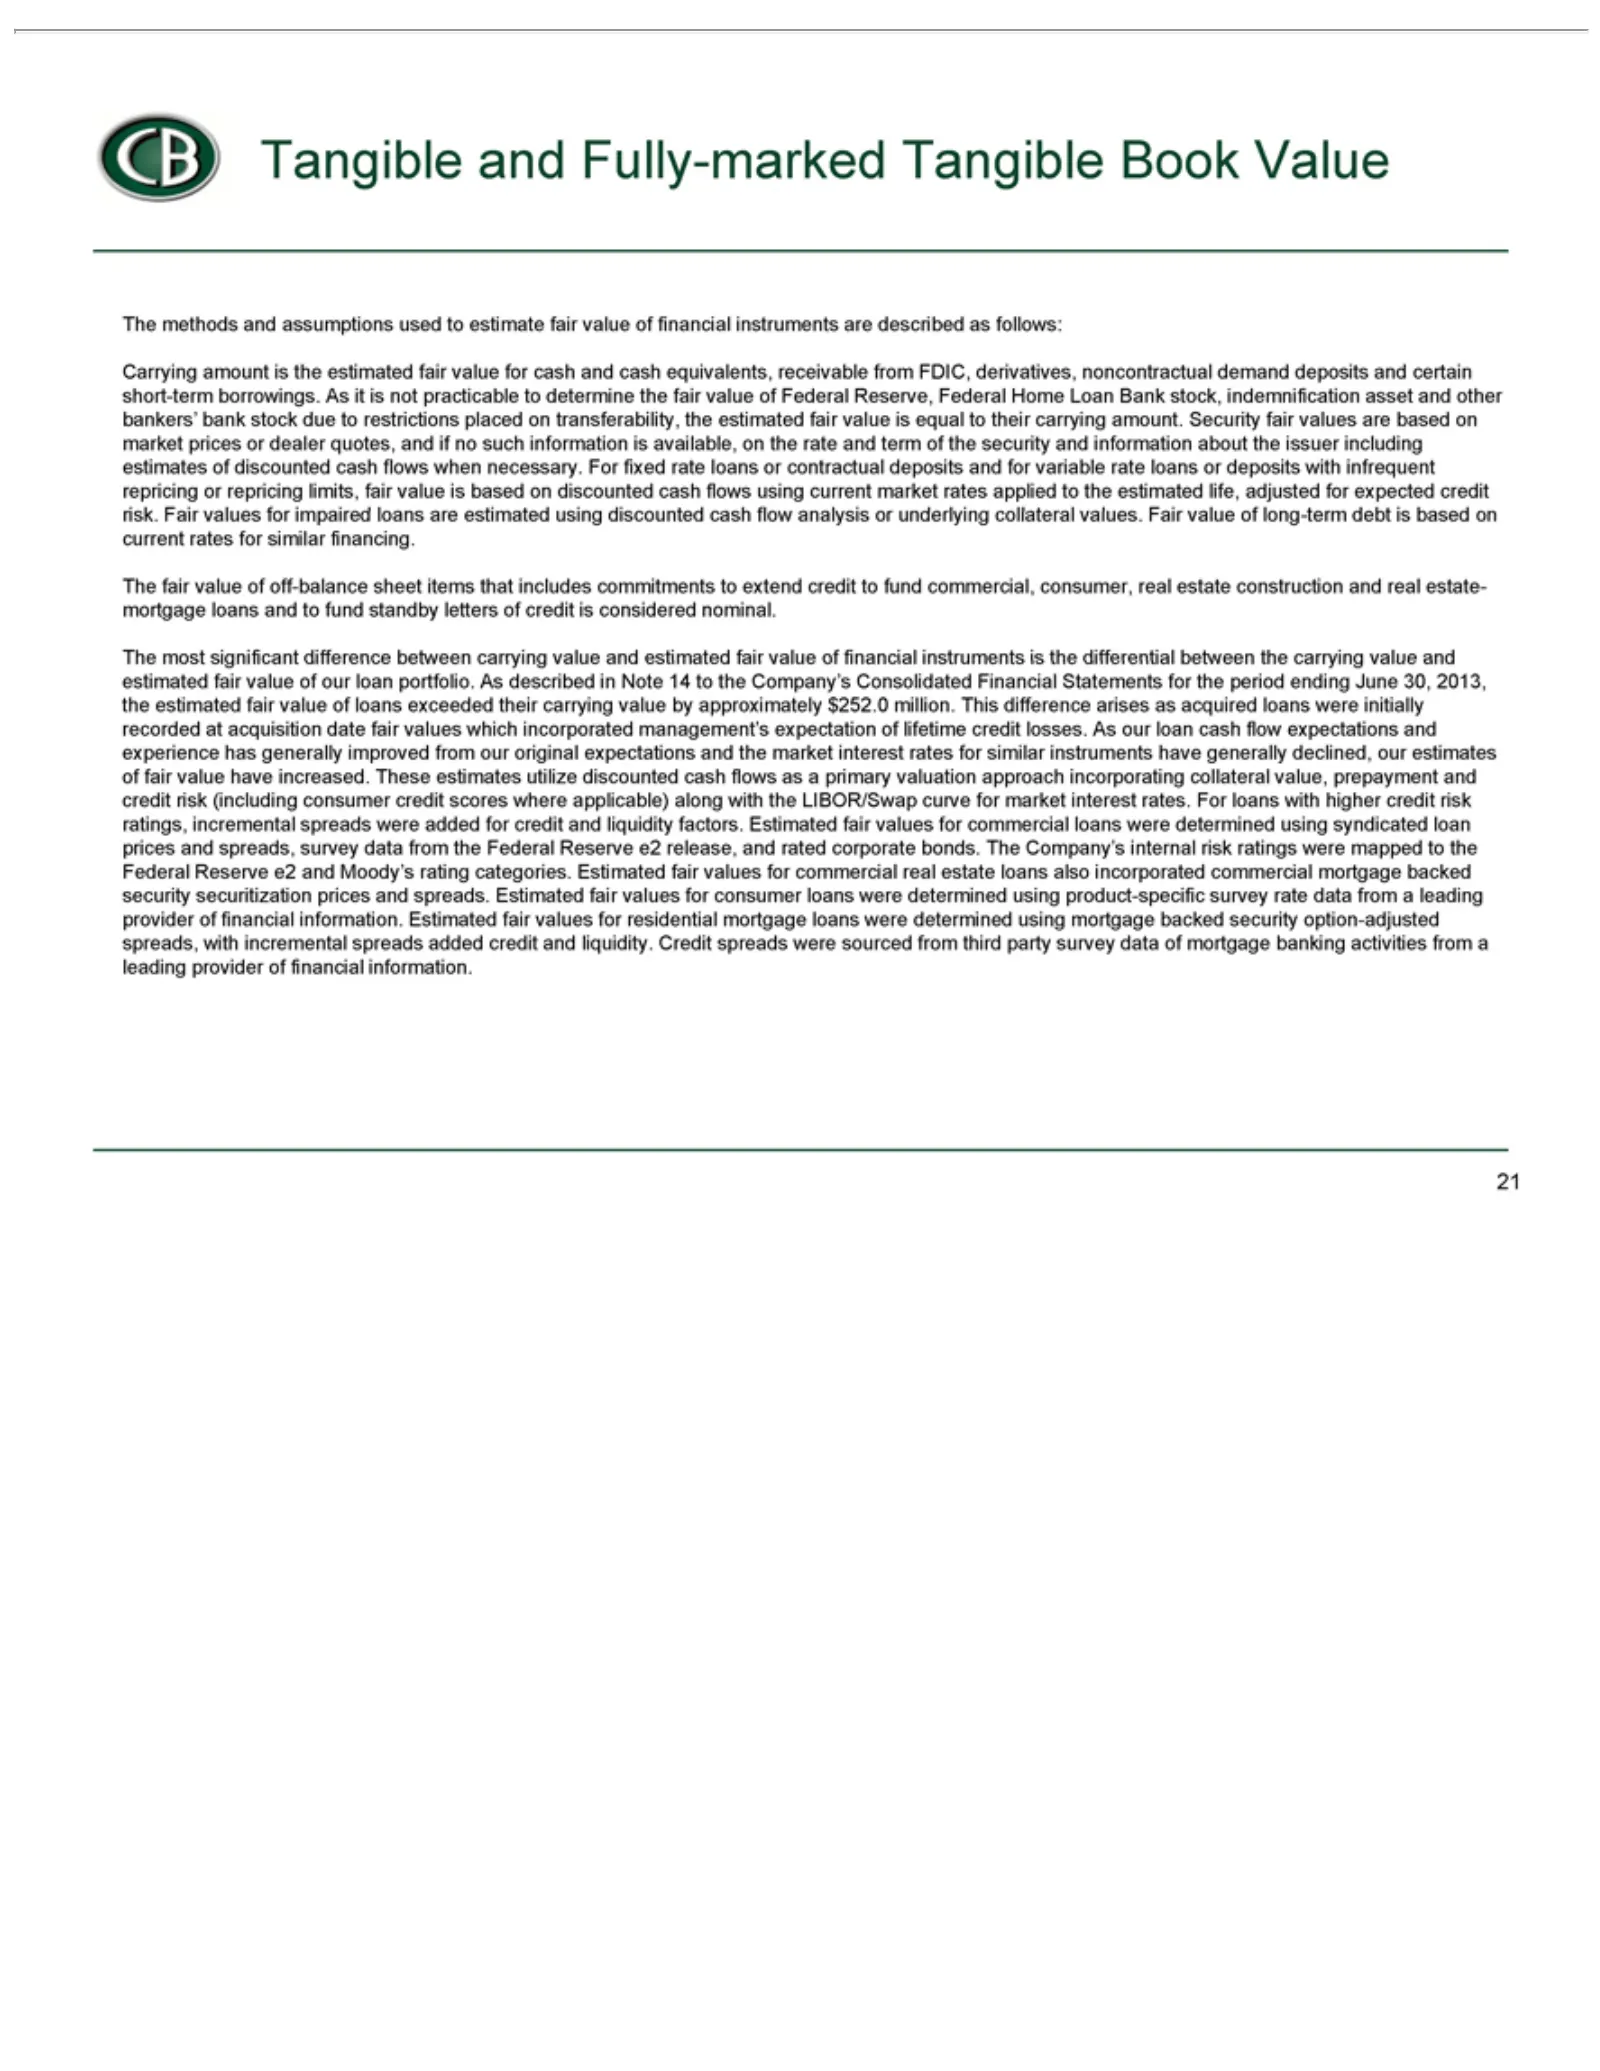
Slide 21: Fully-Marked Tangible Book Value: fair value methodology
Tangible Carrying fair Security when applied current considered The 14 acquired from valuation credit Reserve incorporated financial were 21 tovalue methods fair most sourced our the necessary. risk rates to value e2 fair loans and information. Company’s original amount approach significant of the r
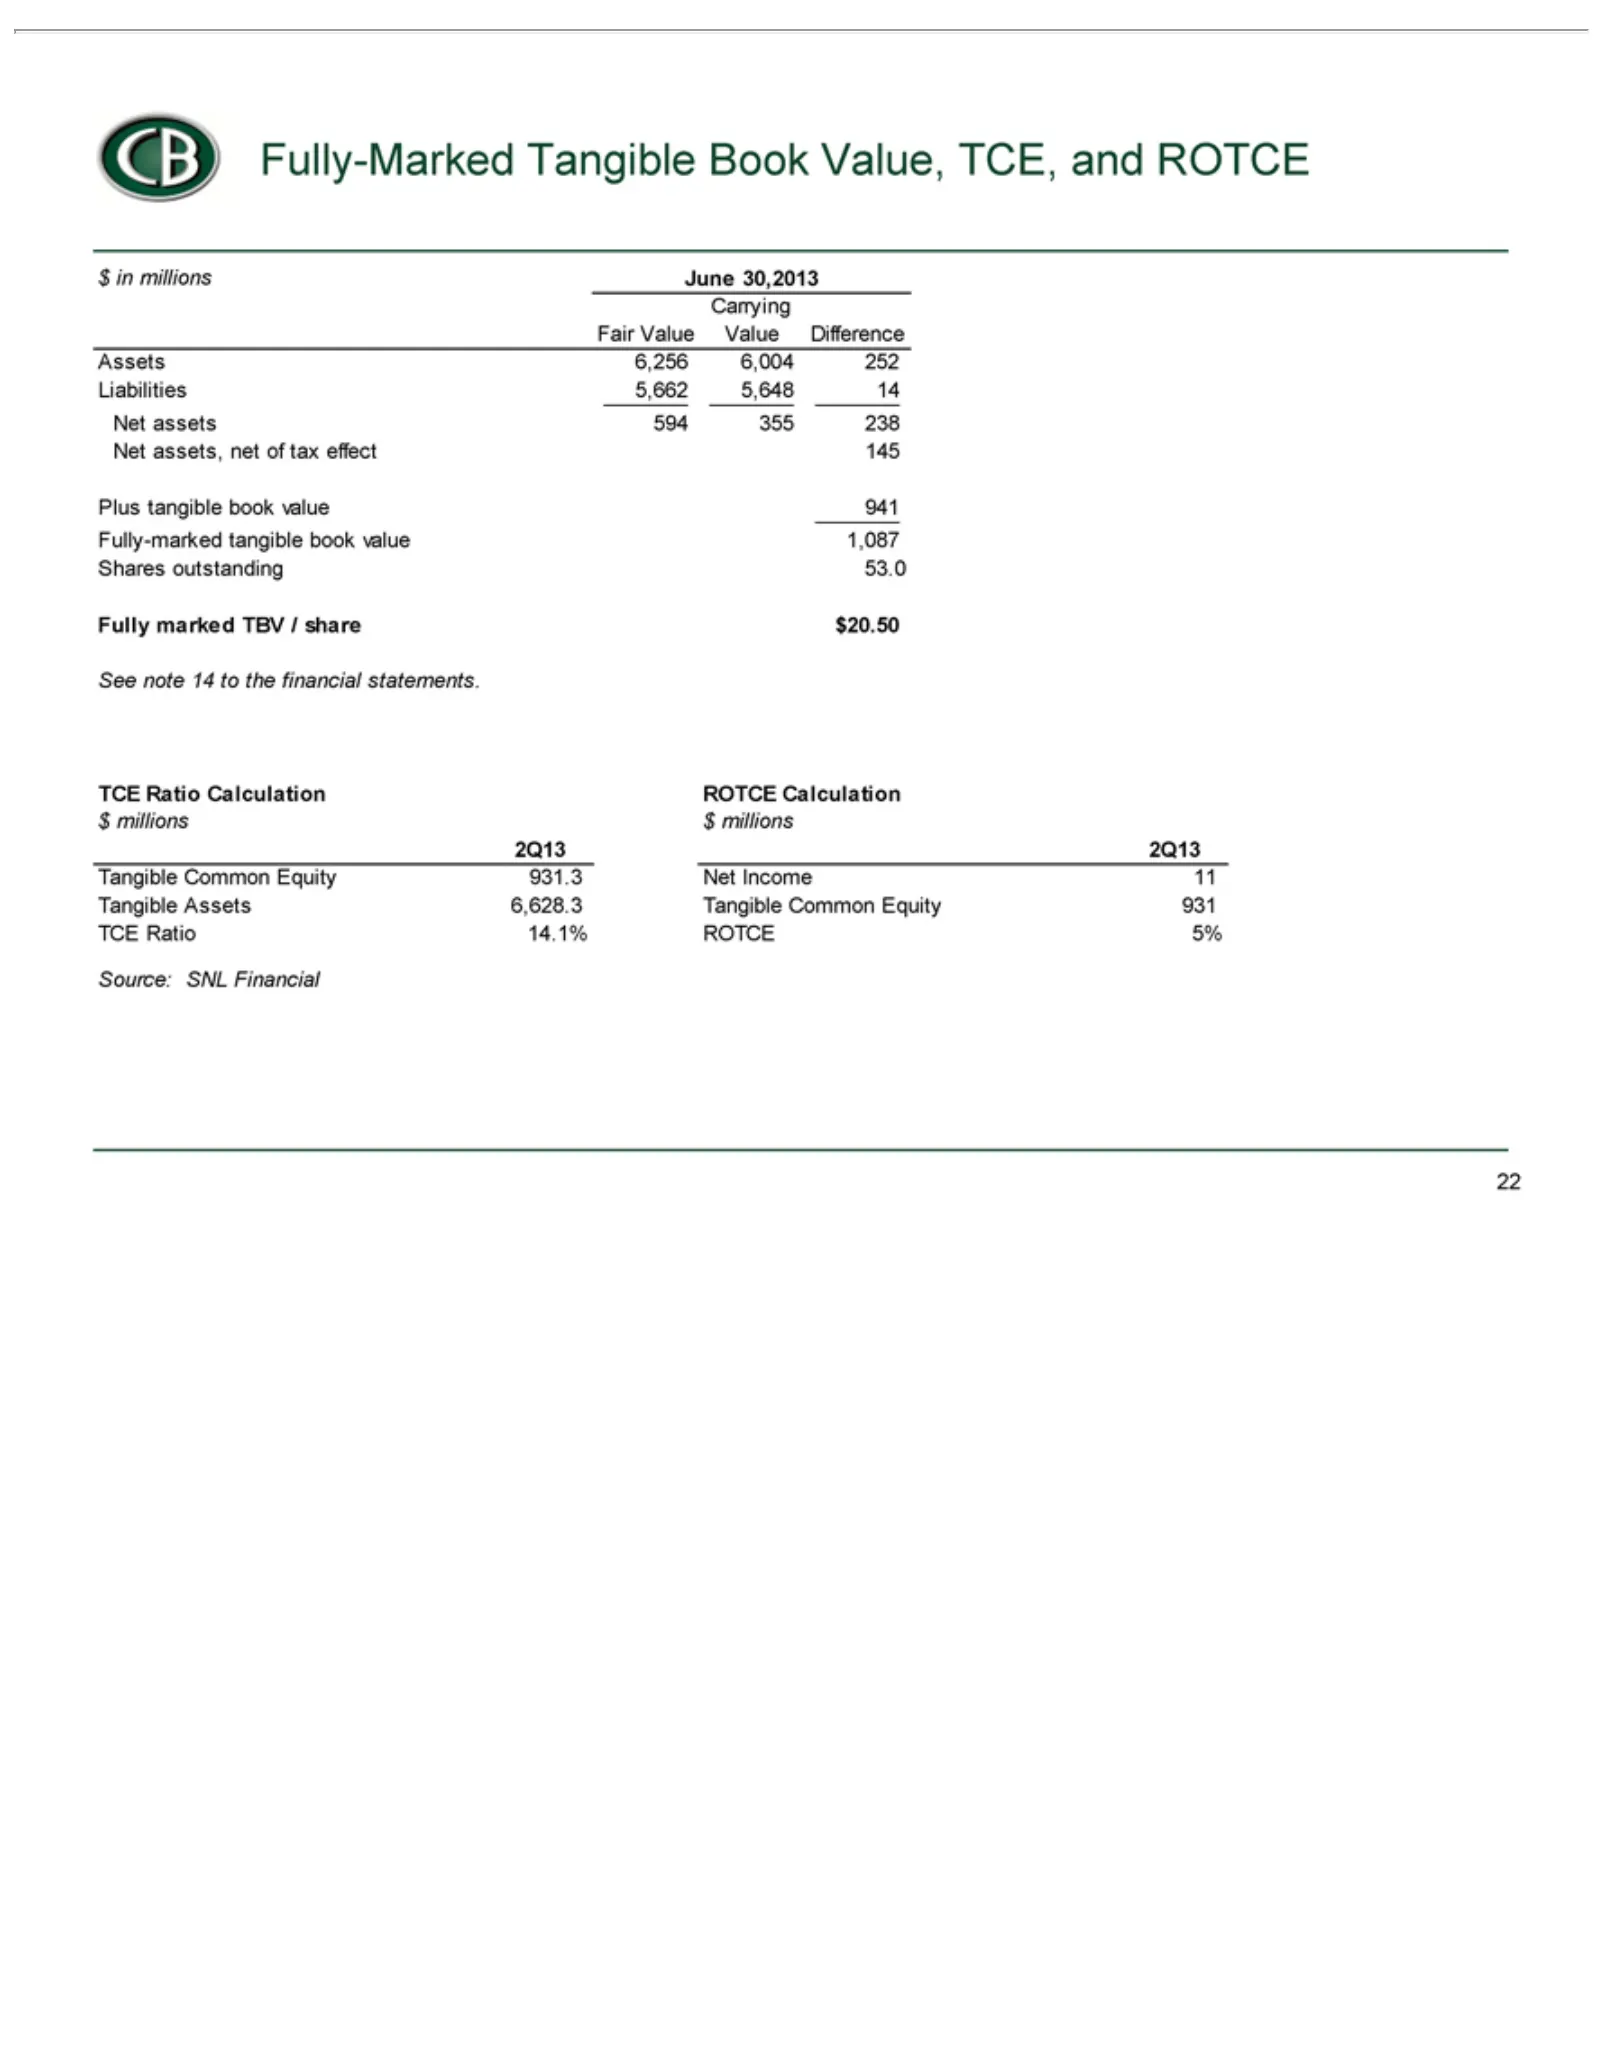
Slide 22: Fully-Marked Tangible Book Value, TCE, and ROTCE
CB Fair Carrying Assets Liabilities Plus Fully-marked Shares Fully See $TCE Net 2Q13 Tangible ROTCE Source: 22in Fully-Marked millions assets assets, note Income millions Value tangible Ratio marked 6,256 outstanding SNL Calculation 5% 14 Assets Common 594 5,662 Value net Calculation 14.1% to 11 Jun
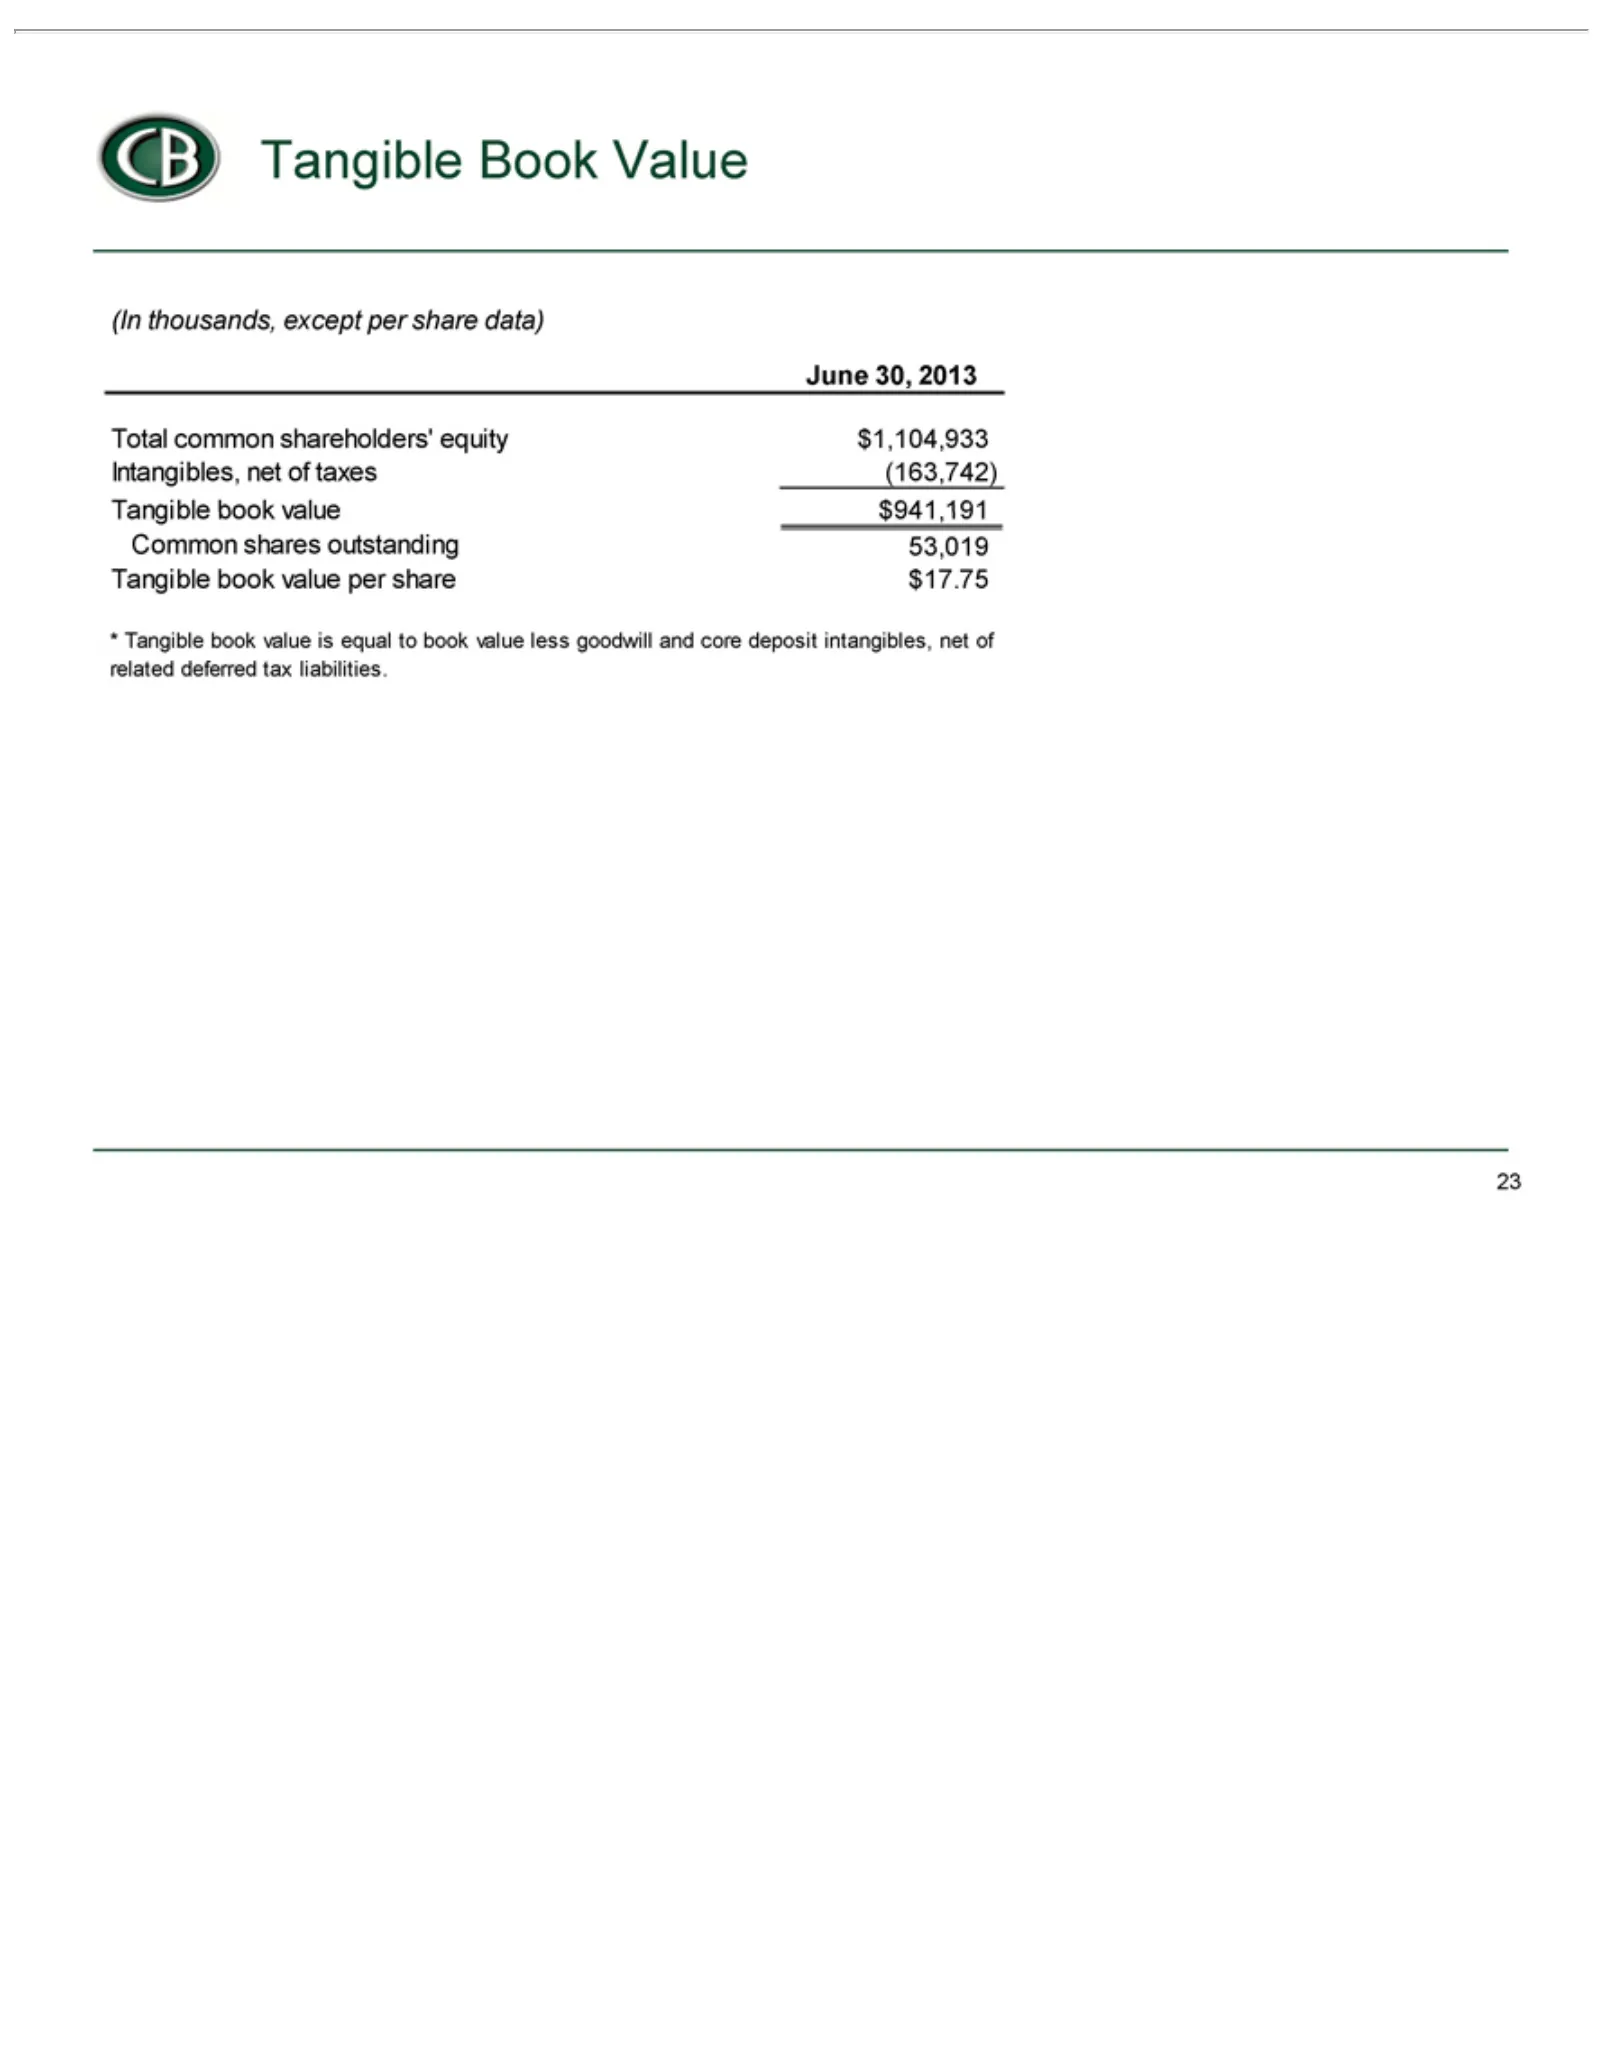
Slide 23: Tangible Book Value Calculation
CB (In June Total Intangibles, Common *Tangible 23 Tangible thousands, Tangible 30, common 2013 book shares book net Book except value shareholders’ of value outstanding taxes Value $941,191 per per is(163,742) share equal share equity 53,019 $17.75 to data) book $1,104,933 value less goodwill and c
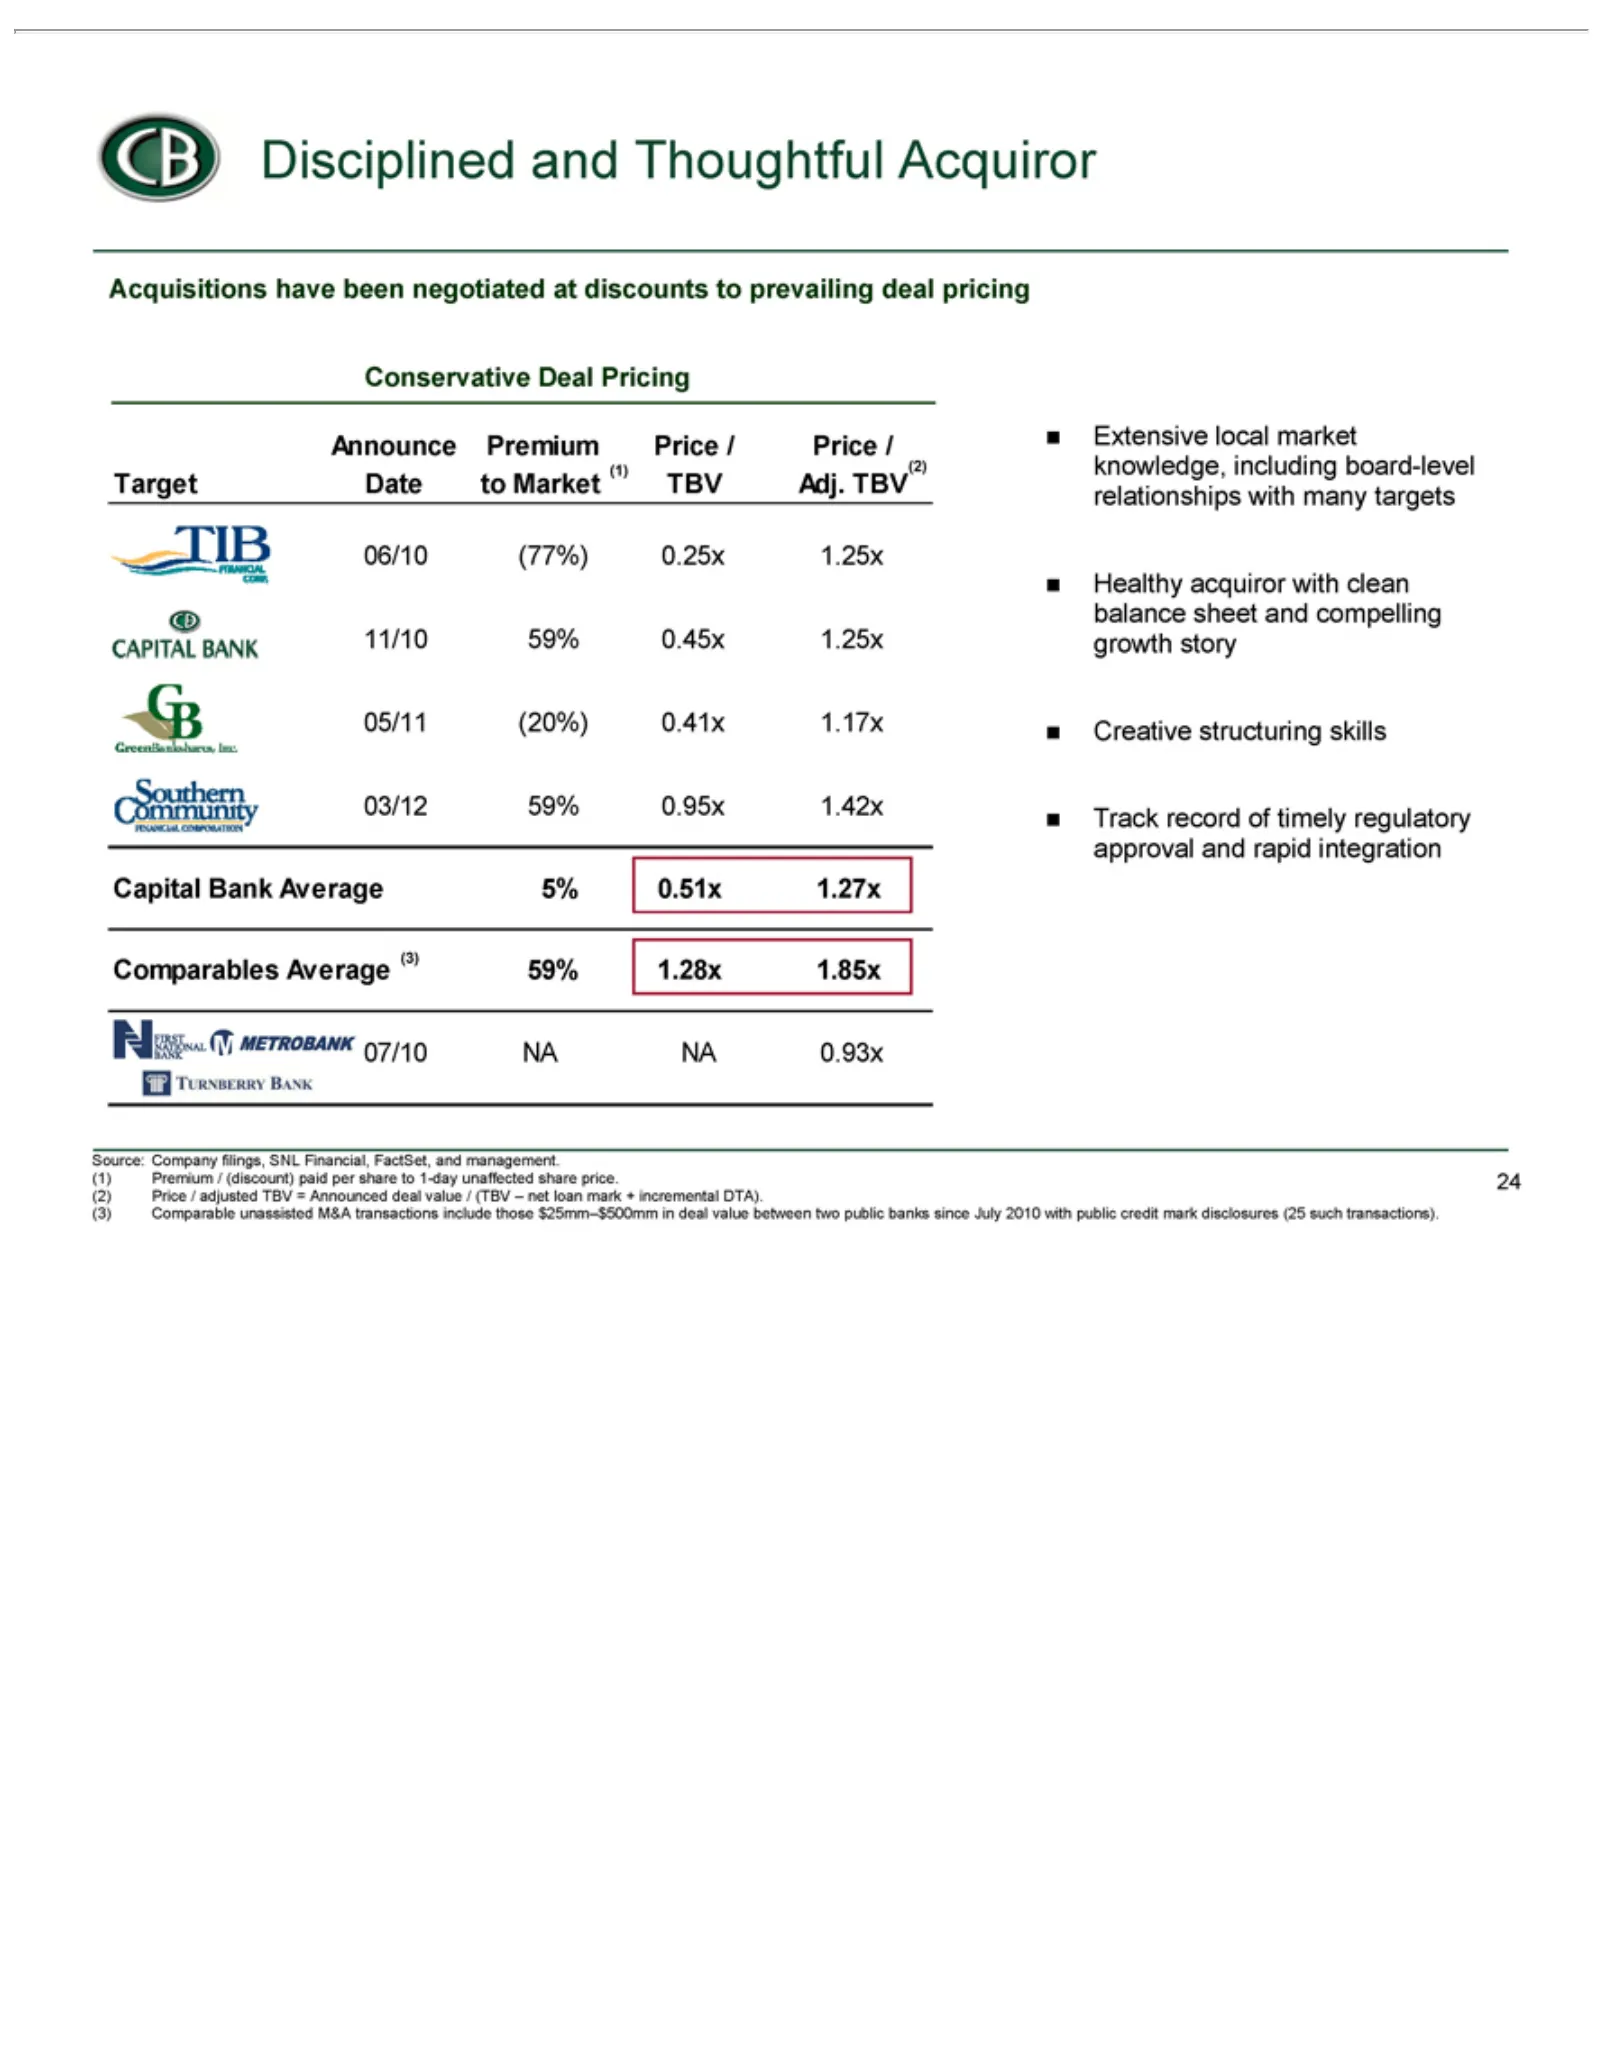
Slide 24: Comparable Acquisitions
CB Comparable Acquisitions Conservative Target TIB GreenBankshares Southern Capital Comparables First Extensive Healthy Creative Track Source: (1) (2) (3) 24 Premium Price Disciplined Financial National record Announce Bank Company acquiror structuring /Community local adjusted have /of Average 11/1
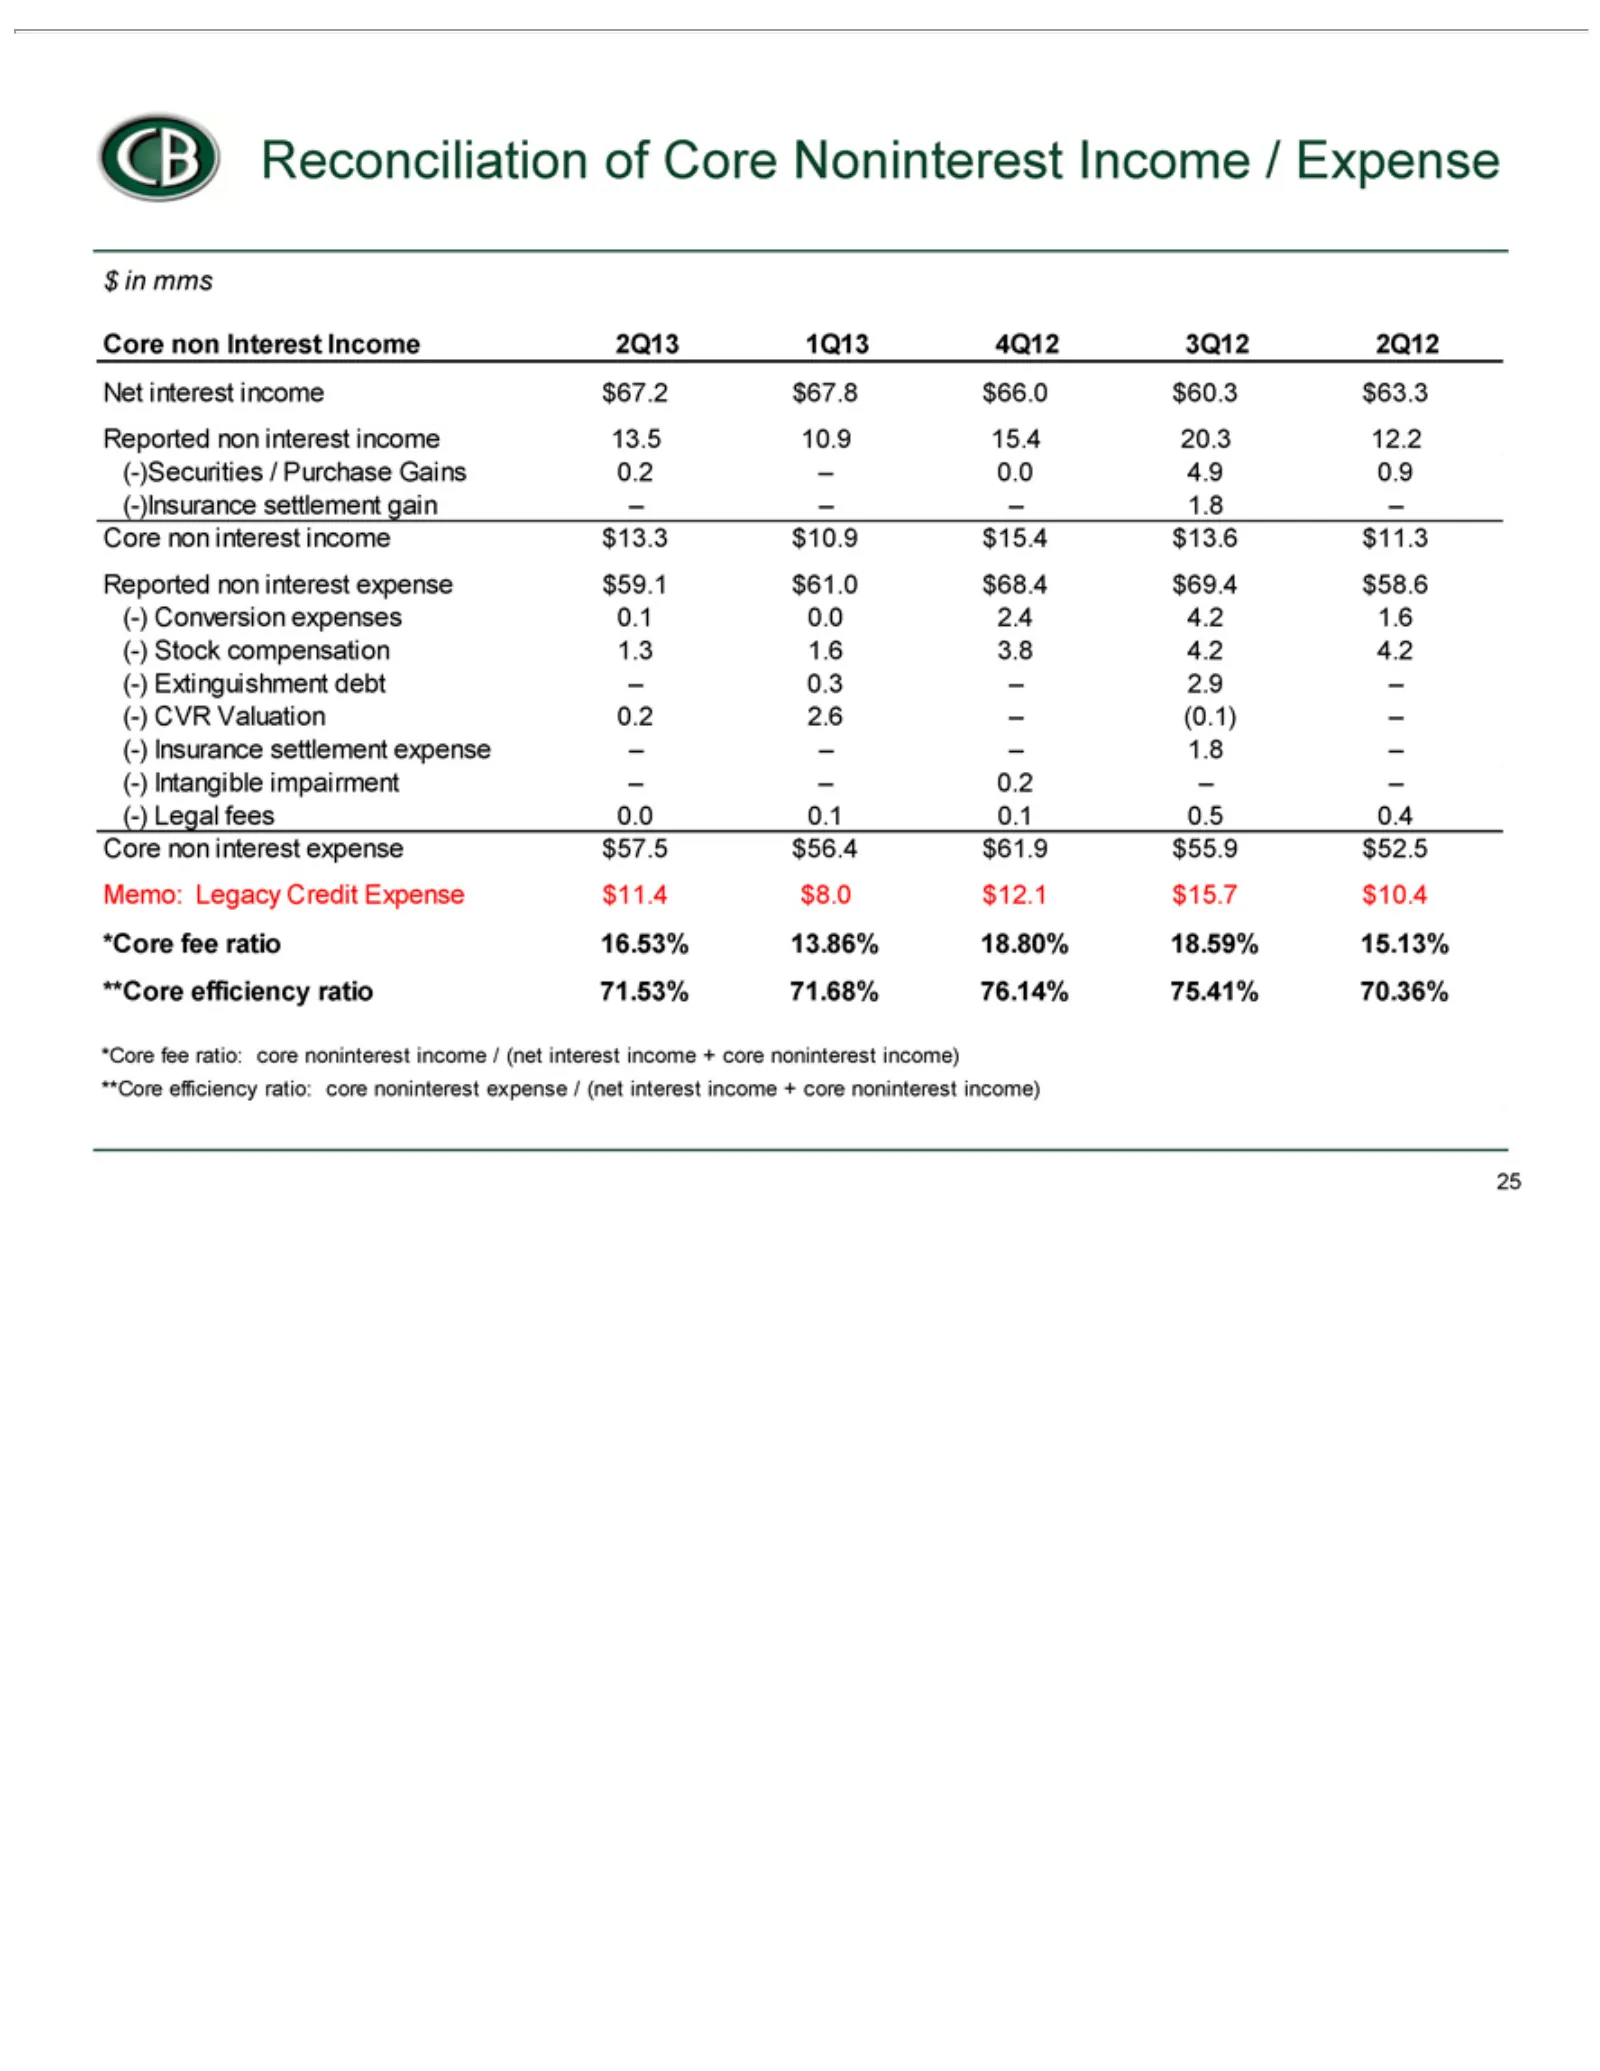
Slide 25: Core Expense Reconciliation
$CB expenses $13.6 (-) Core Memo: *Core **Core 25inLegal CVR Insurance Intangible Reconciliation mms non $69.4 fee Legacy efficiency Valuation fees (-) interest Core ratio ratio: 4.2 Stock settlement impairment 0.0 non 16.53% Credit 4.2 core 0.1 expense ratio ratio: 0.2 compensation of Interest 2.9
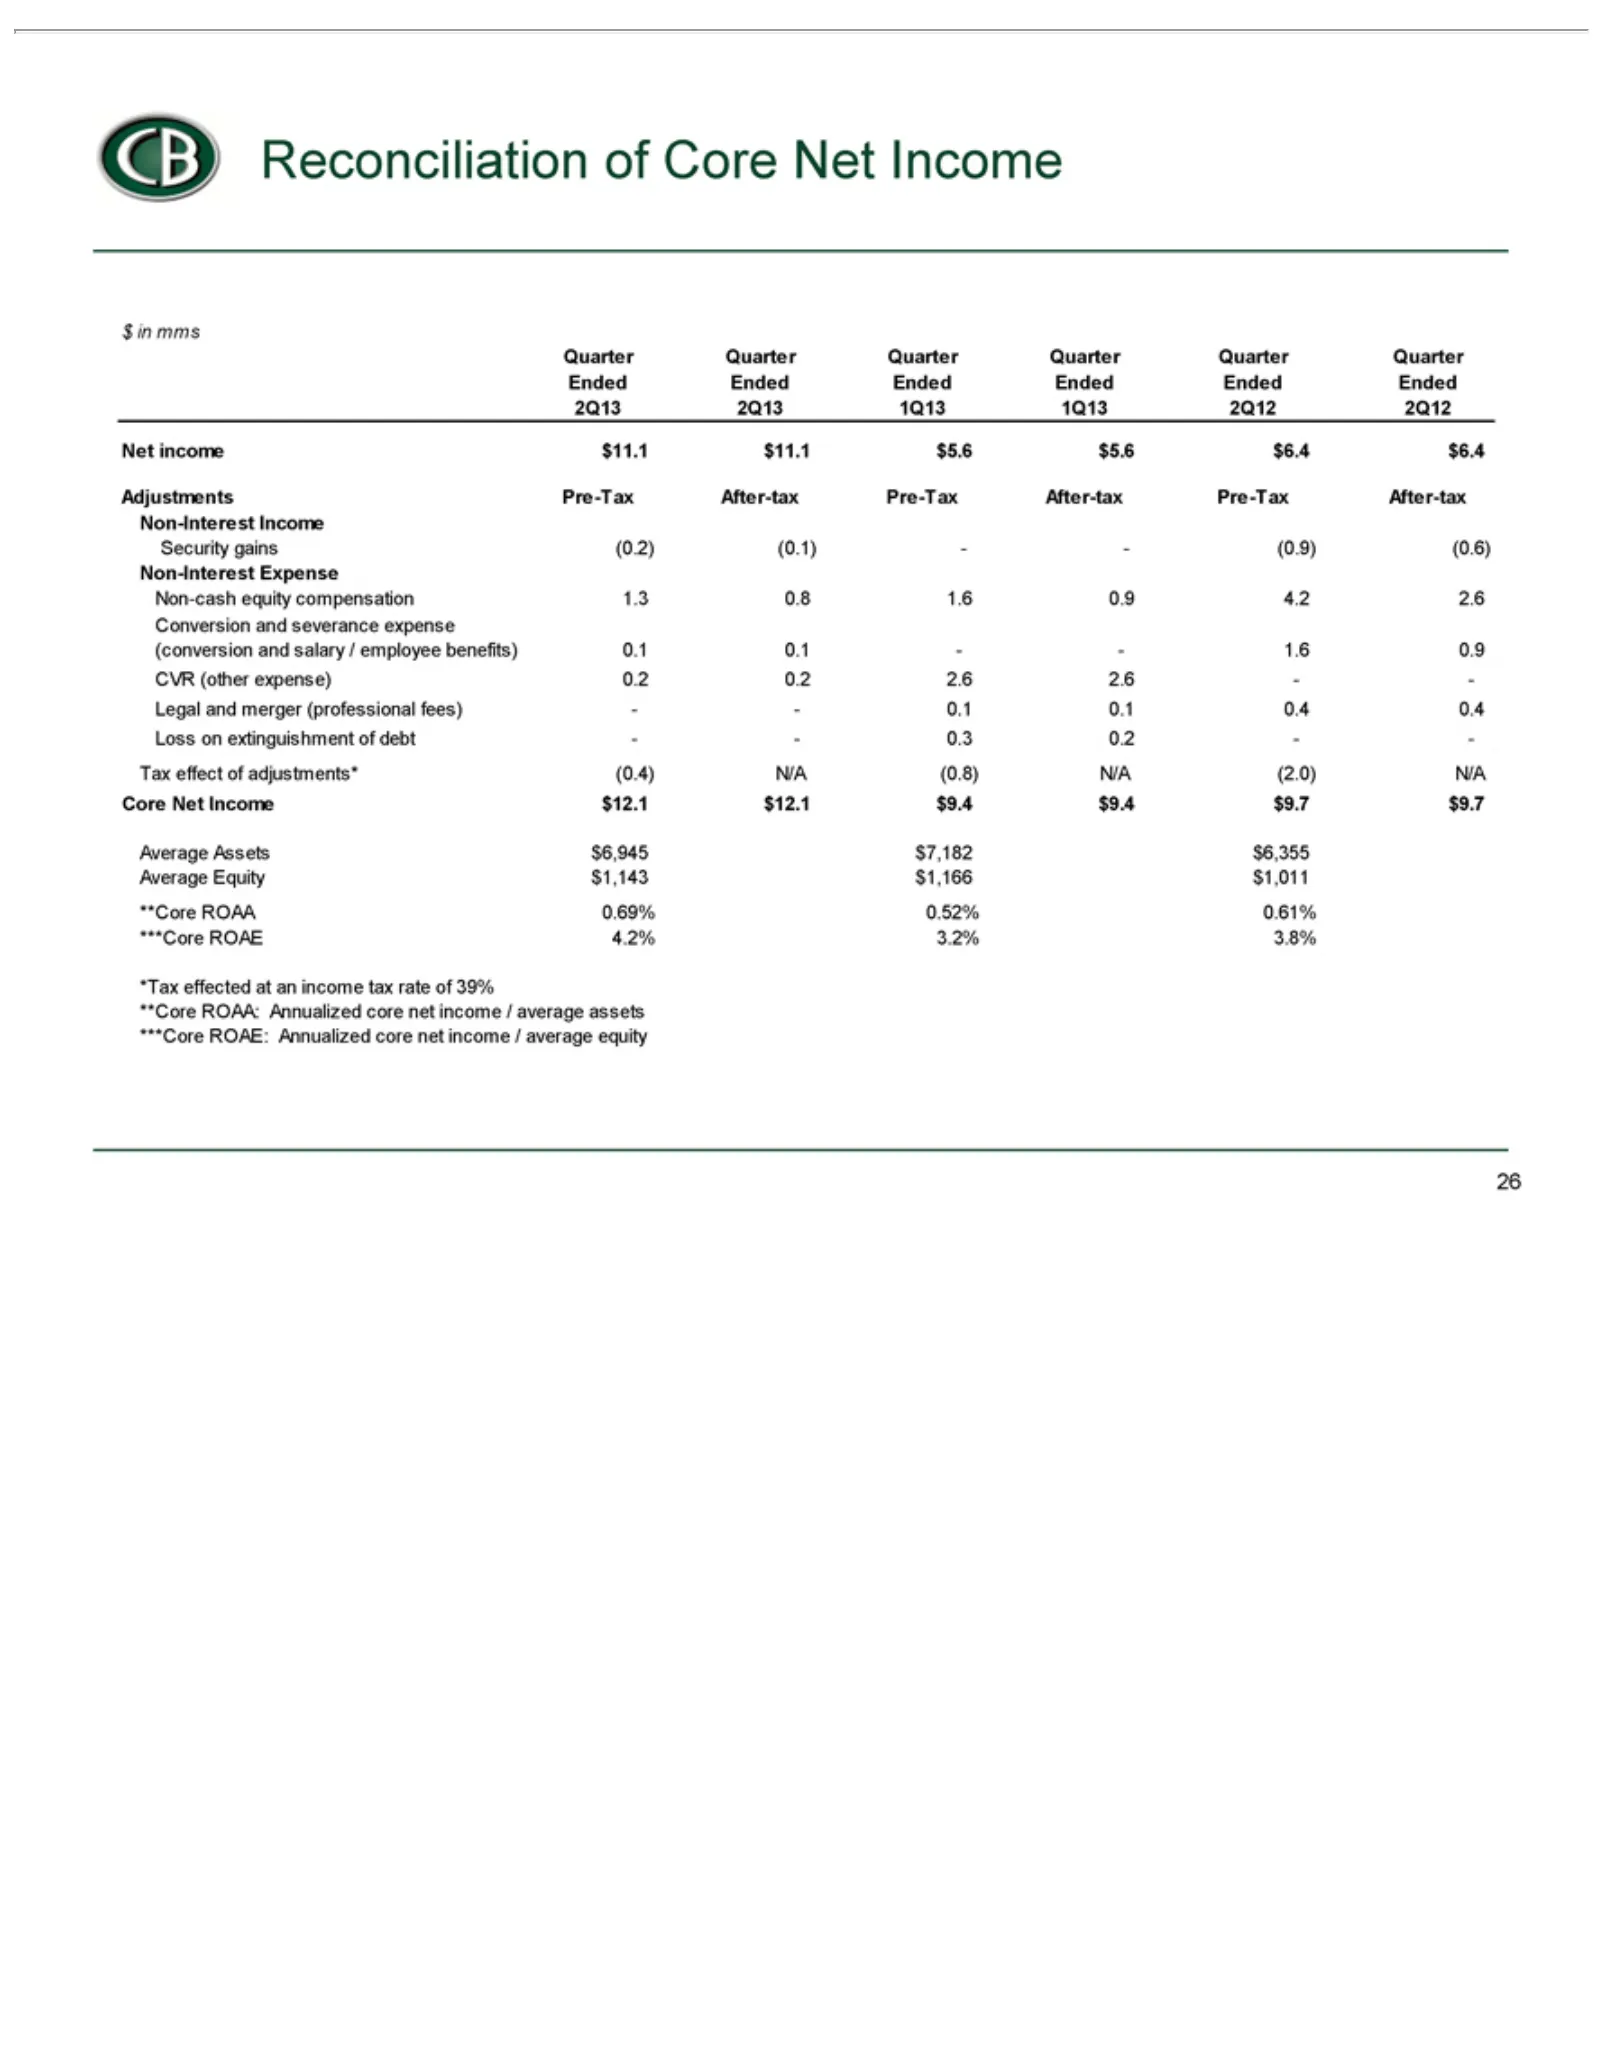
Slide 26: Core Income Reconciliation
$CB Quarter Ended 2Q13 Net Adjustments Security Non-Interest Non-cash Conversion (conversion CVR Legal Loss Tax Core Average *Tax **Core ***Core 26in Reconciliation income effect mms on Net effected (other 2Q13 and Ended ROAA ROAA: Quarter extinguishment Assets Equity gains ROAE ROAE: Income equity
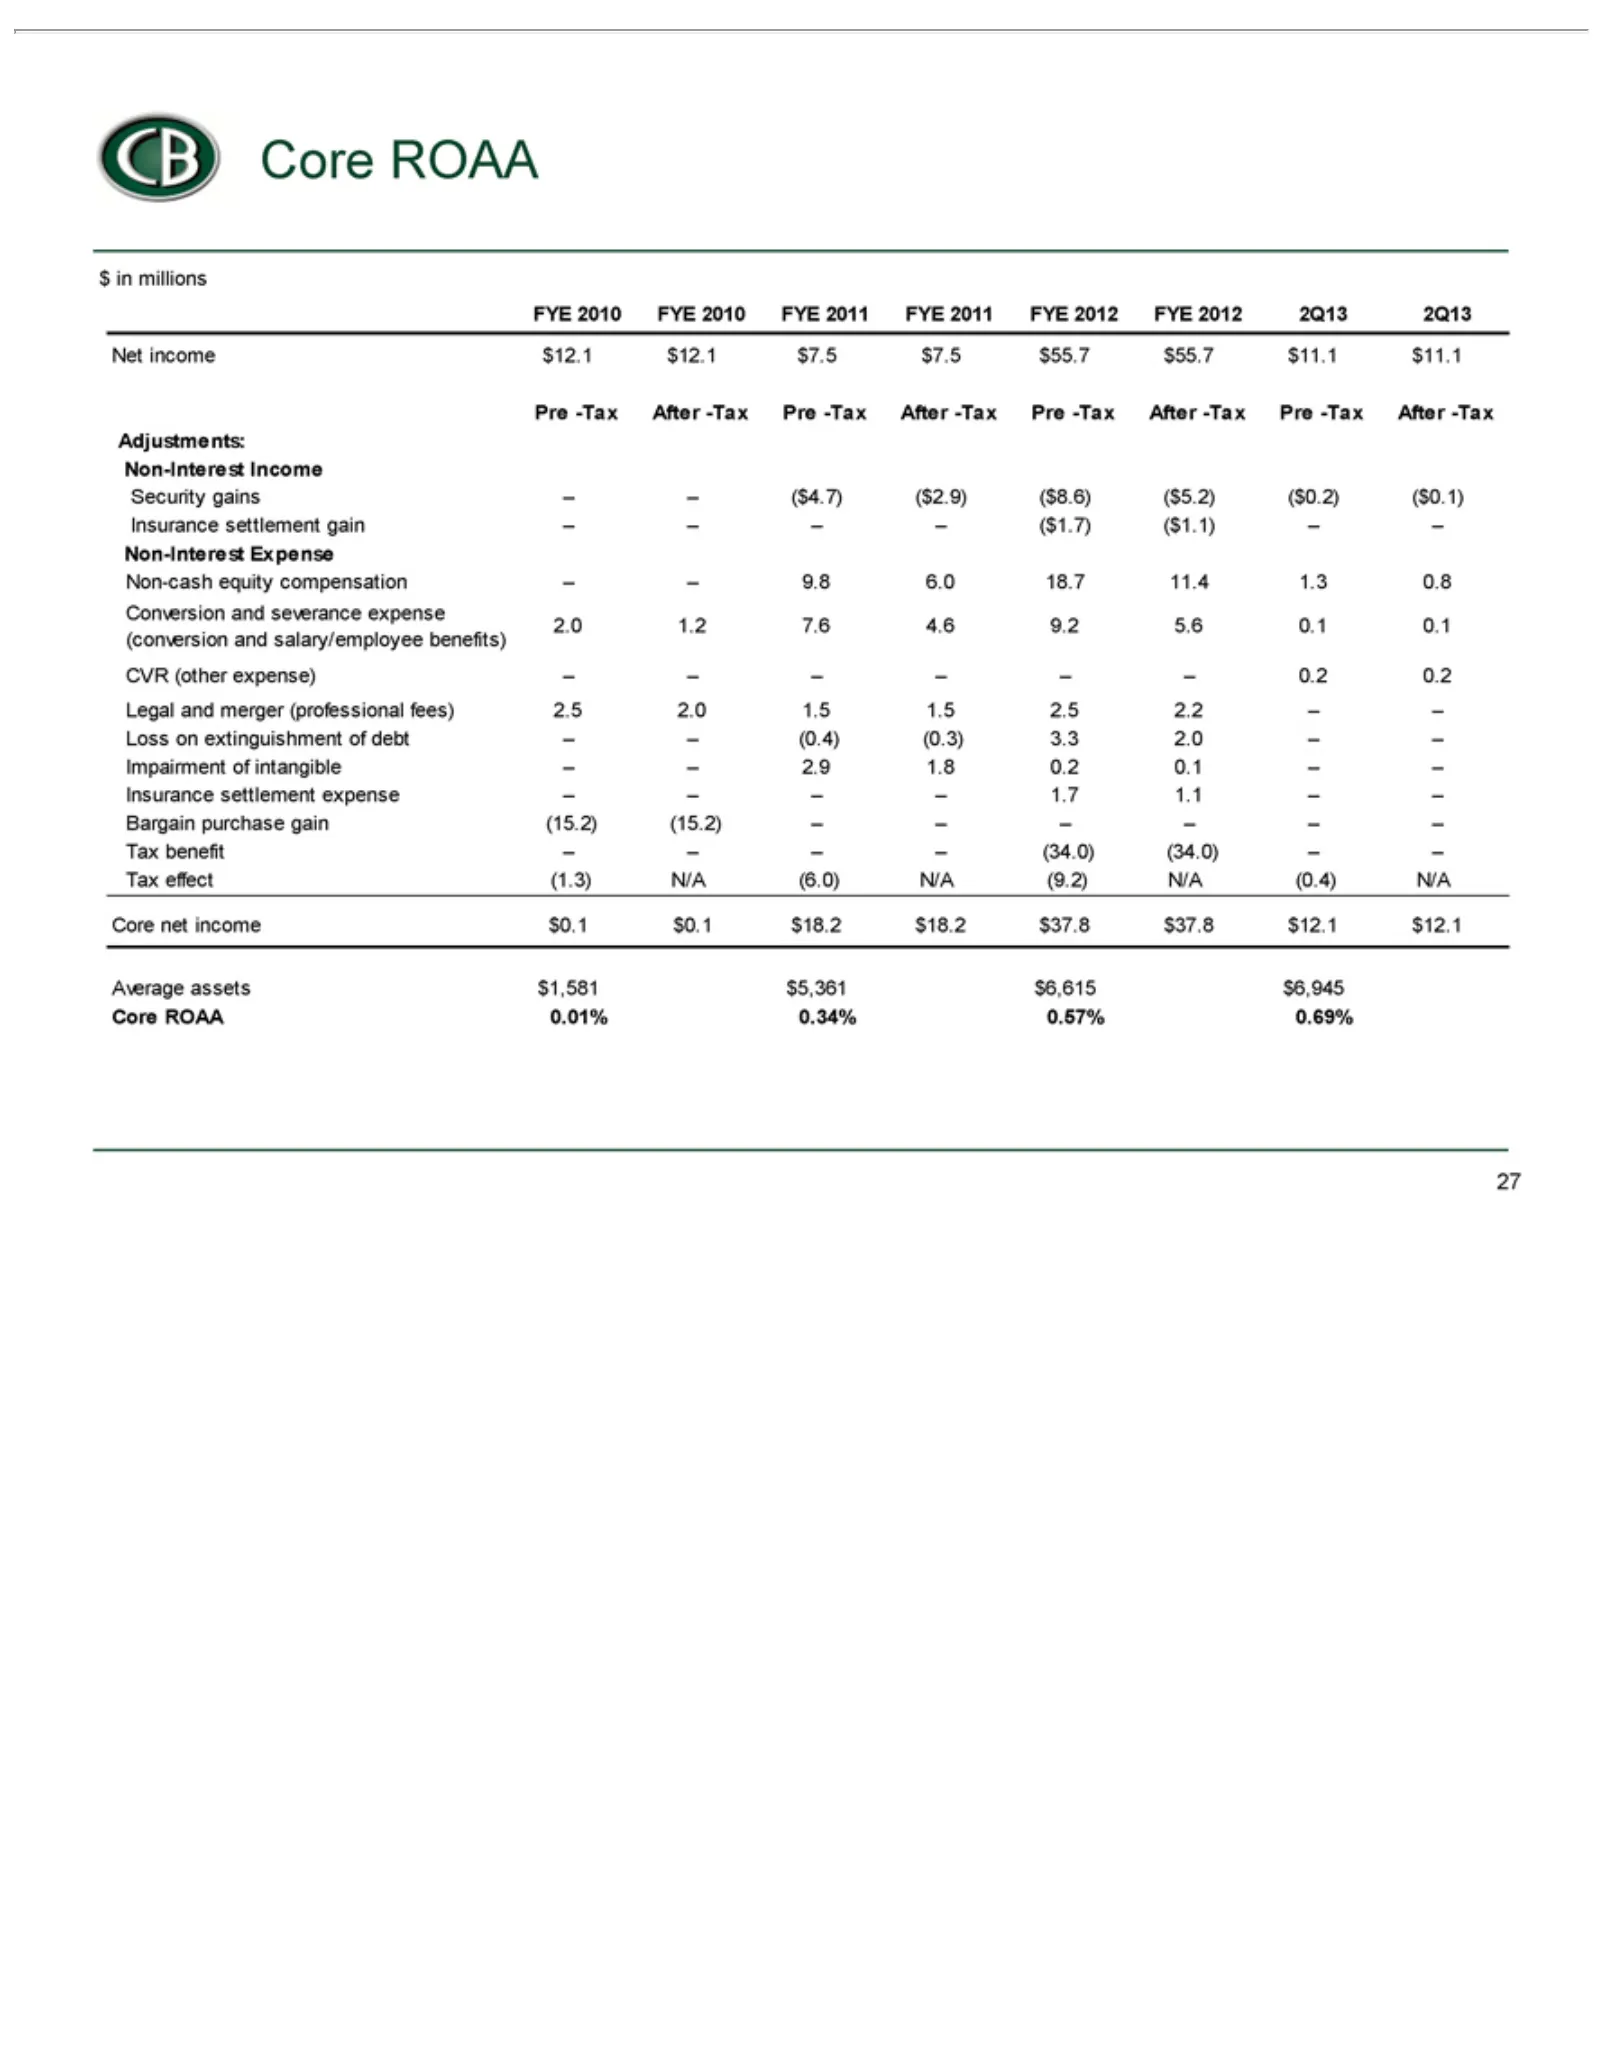
Slide 27: Annual Core Income Reconciliation
$CB FYE Net Pre Adjustments: Security Non-Interest Non-cash Conversion (conversion CVR Legal Loss Impairment Insurance Bargain Tax Average Core 27in -Tax Core income benefit effect millions 2010 on net ROAA (other and extinguishment purchase assets gains After income ROAA equity settlement merger (1
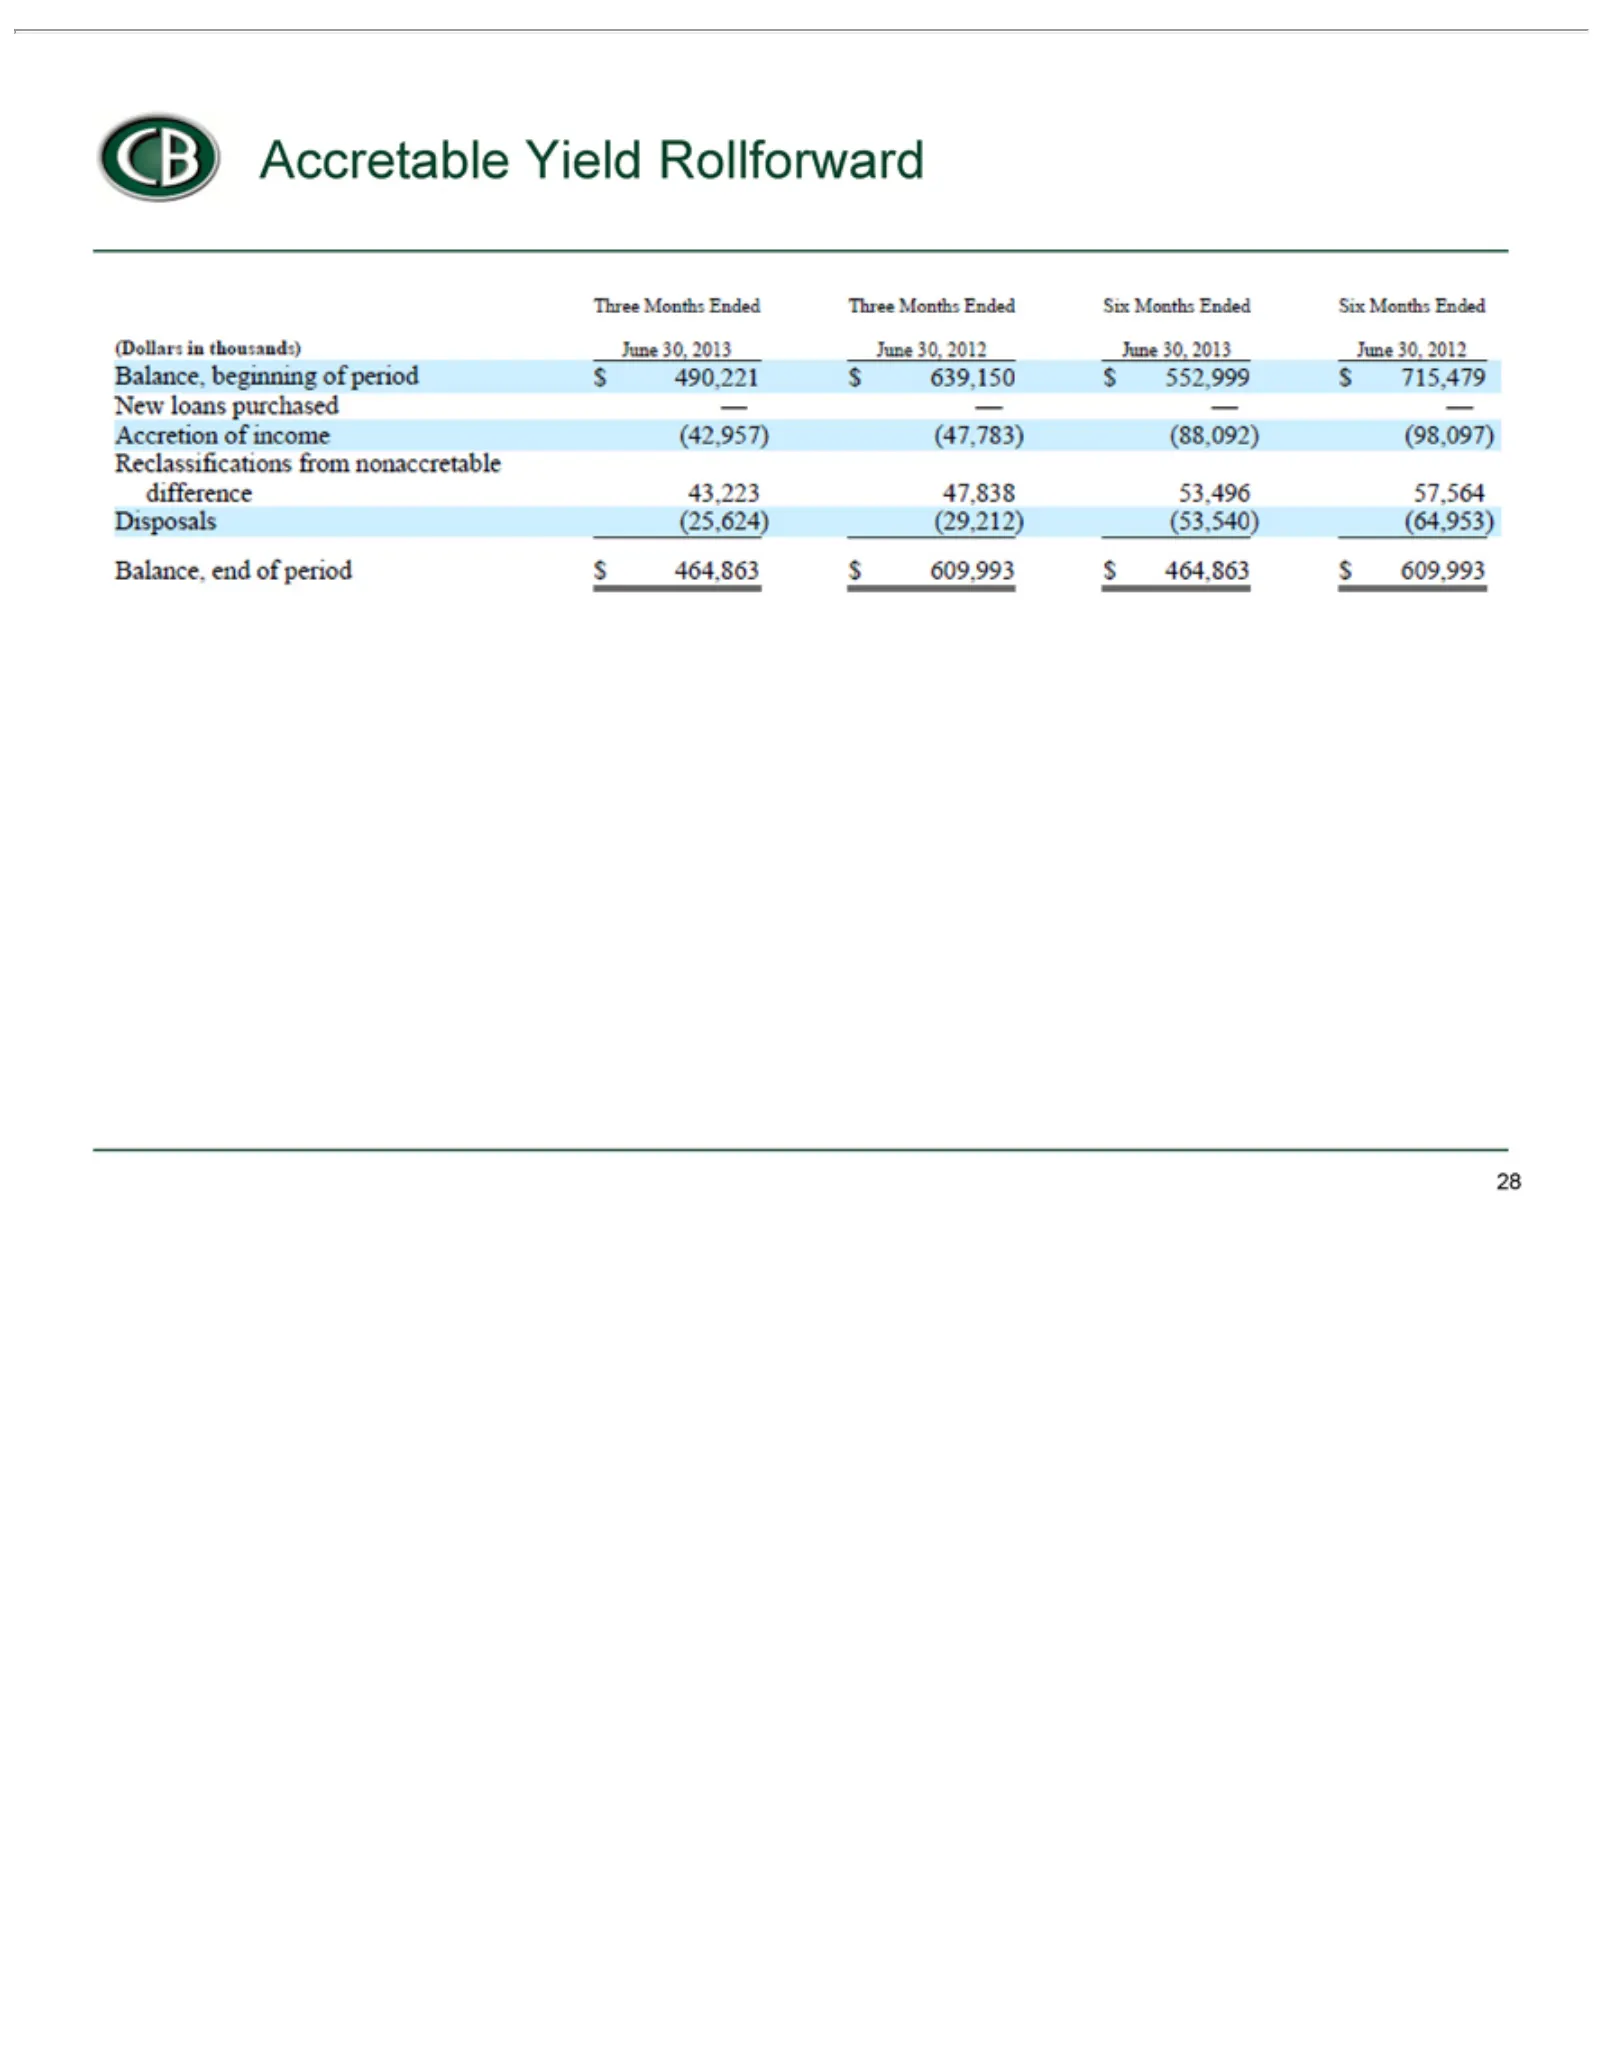
Slide 28: Accretable Yield Rollforward
CB Accretable (Dollars New Accretion Reclassifications Disposals Balance, 28 loans in beginning end (25,624) of purchased thousands) income ofYield period from (29,212) of(42,957) Rollforward —period Three nonaccretable $464,863 —— (53,540) Months $490,221 (47,783) —$609,993 Ended difference (64,953
Source: SEC EDGAR · 8-K filed Sep 9, 2013
More decks from Capital Bank Financial Corp
 Q2 2017 Earnings Presentation22 slides · Jul 14, 2017
 Morgan Stanley Financial Services Conference 201715 slides · Jun 13, 2017
 Merger or Acquisition (June 2017)27 slides · Jun 6, 2017
 Merger or Acquisition (May 2017)17 slides · May 4, 2017
 Q1 2017 Earnings Presentation21 slides · Apr 21, 2017
 Q4 2016 Earnings Presentation25 slides · Jan 26, 2017