Airtran — Raymond James Growth Airline Conference 2008
23 slides from Airtran's conference presentation, Feb 6, 2008
Slide 1: Raymond James January 31, 2008 Growth Airline Conference
Raymond James January 31, 2008 Growth Airline Conference Exhibit 99.1

Slide 2: Safe Harbor
2 Safe Harbor Certain of the statements contained herein should be considered “forward-looking statements,” including within the meaning of the Private Securities Litigation Reform Act of 1995. These forward-looking statements may be identified by words such as “may”, “will”, “expect,” “intend,” “in

Slide 3: What Will You Learn About AirTran Today?
3 What Will You Learn About AirTran Today? How are we different from other low cost carriers? Can we earn a profit if oil stays at $90/bbl? Can your costs still go lower? How much can unit revenues really go up? Where do you see opportunities with ancillary revenues? What opportunities exist in a co

Slide 4: What Makes AirTran Different?
4 What Makes AirTran Different? Unique product with Business Class on every flight Stable and experienced management team Extremely low non-fuel unit costs and high quality service Consistently profitable Have been able to profitably diversify our business Both a hub and a significant point to point

Slide 5
Slide 6: AirTran Has Very Low Costs
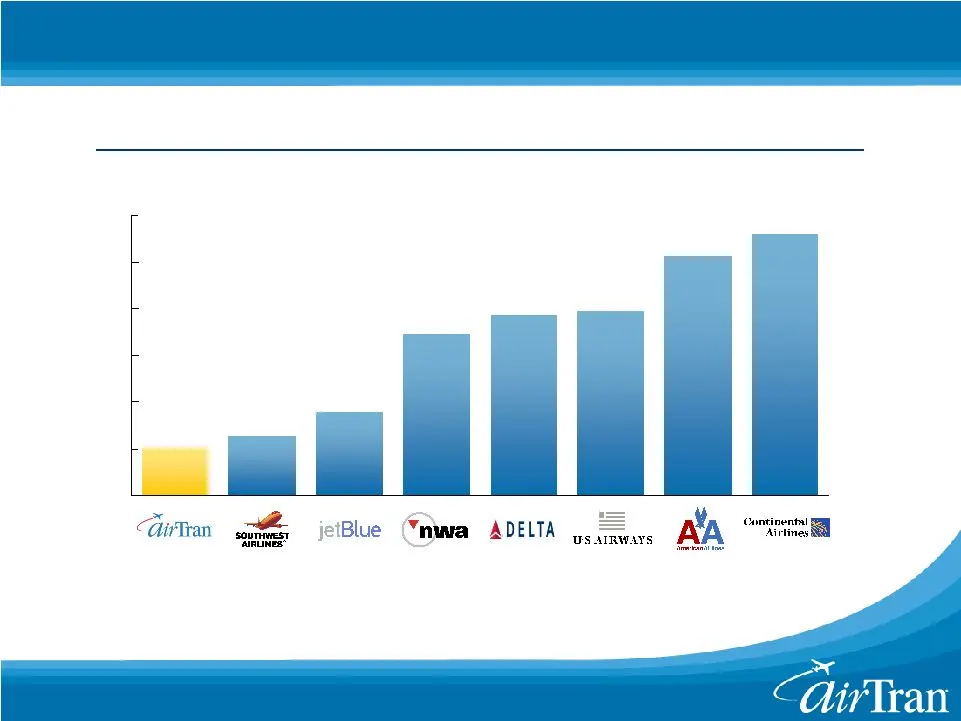
6 AirTran Has Very Low Costs (cents) While legacy costs are down, gap remains large * Excludes fuel and special items Industry Cost Comparison Non-Fuel Unit Costs at 694 Miles for the First Nine Months of 2007

Slide 7: How We Improve Our Low Cost Advantage
7 How We Improve Our Low Cost Advantage Flexible and productive workforce at all levels FTE’s per aircraft is 59.3 Young, simplified fleet Future orders at below market prices Efficient use of facilities Competition for heavy maintenance contracts Low cost distribution Over 70% of sales are directly
Slide 8: Consecutive Year Of Cost Reductions
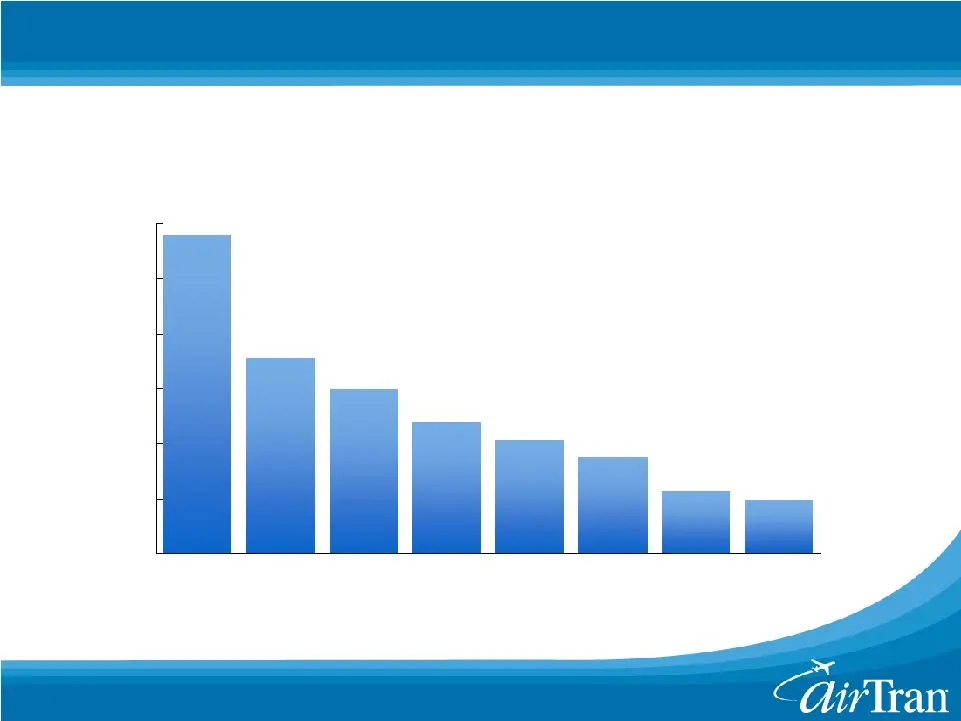
8 7 th Consecutive Year Of Cost Reductions 5.75 6.00 6.25 6.50 6.75 7.00 7.25 2001 2002 2003 2004 2005 2006 2007 2008E * Excludes non-recurring special items (cents per mile) AirTran’s Non-Fuel Unit Cost Trend

Slide 9: AirTran Offers Low Costs And High Quality
9 AirTran Offers Low Costs And High Quality 0.19 2 of 18 0.82 8 of 20 4.01 2 of 20 76.7% 5 of 20 2007 0.08 2 of 18 0.65 8 of 18 4.81 5 of 18 74.6% 10 of 18 2006 0.37 5 of 18 1.09 11 of 19 3.45 2 of 19 71.4% 17 of 19 2005 Invol Denied Boarding Consumer Complaints Mishandled Baggage On-Time Year DOT A
Slide 10: AirTran Network 2000
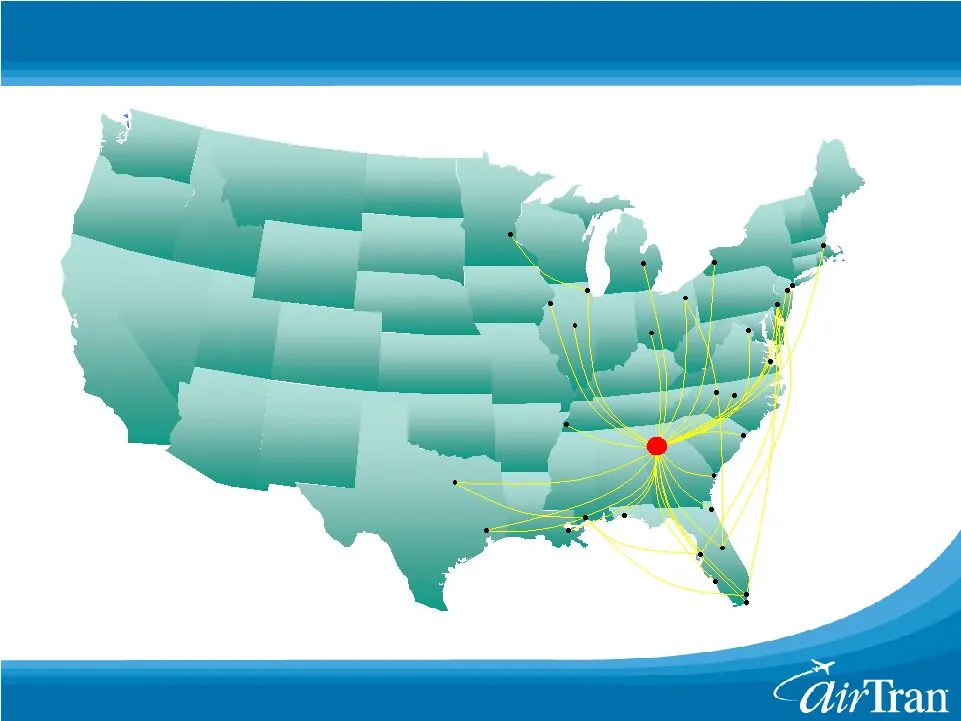
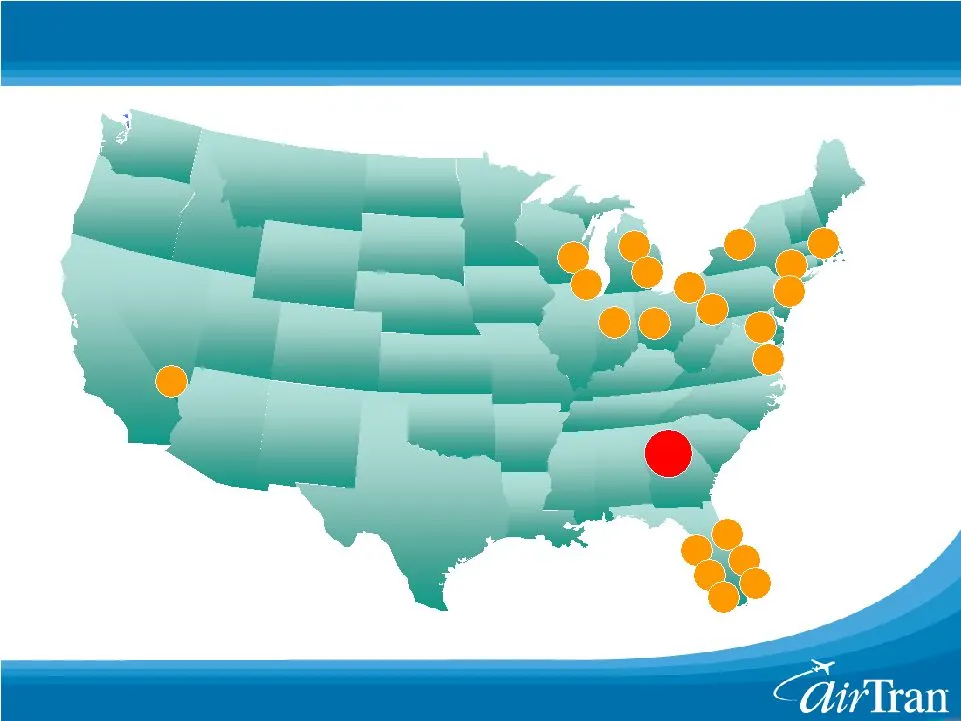
10 AirTran Network 2000 Boston Boston Buffalo Buffalo Newark Newark New York City New York City Philadelphia Philadelphia Washington, D.C. (IAD) Washington, D.C. (IAD) Newport News Newport News Dayton Dayton Ft. Lauderdale Ft. Lauderdale New Orleans New Orleans Houston Houston Bloomington Bloomingto
Slide 11: AirTran Atlanta Network 2008
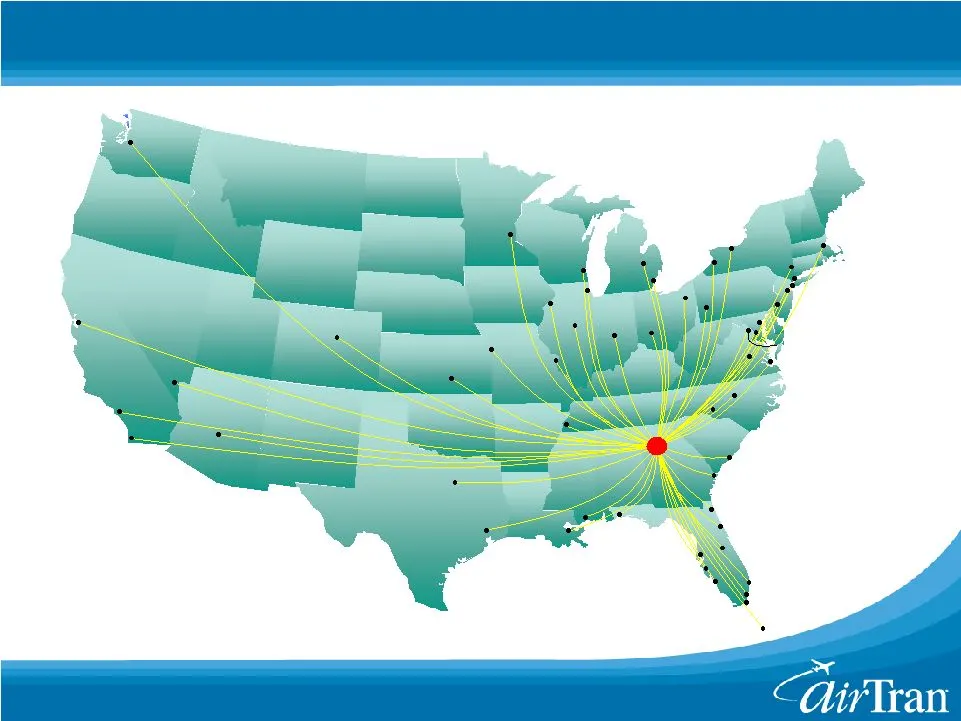
11 AirTran Atlanta Network 2008 Boston Boston Rochester Rochester Dallas/Ft. Worth Dallas/Ft. Worth Newark Newark Ft. Lauderdale Ft. Lauderdale West Palm Beach West Palm Beach Sarasota Sarasota San Juan San Juan Pensacola Pensacola Orlando Orlando Daytona Beach Daytona Beach Jacksonville Jacksonvill
Slide 12: Atlanta Is The World's Largest LCC Hub
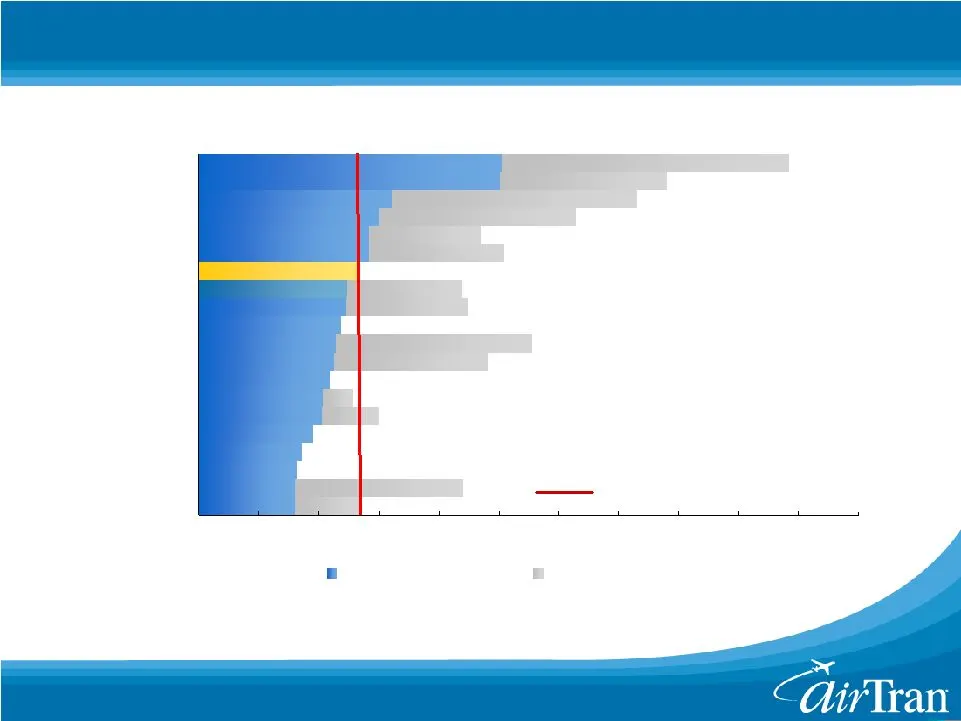
12 Atlanta Is The World’s Largest LCC Hub 1,000 1,100 UAUA - San Francisco LCC - Philadelphia LUV - Baltimore JBLU - New York LUV - Phoenix LCC - Phoenix AMR - Miami LCC - Chicago AMR - Chicago LCC - Charlotte LUV - Las Vegas UAUA - Denver CAL - Newark AAI - Atlanta NWA - Detroit NWA - Minneapolis U
Slide 13: Successful Diversification - Non-Atlanta 2008
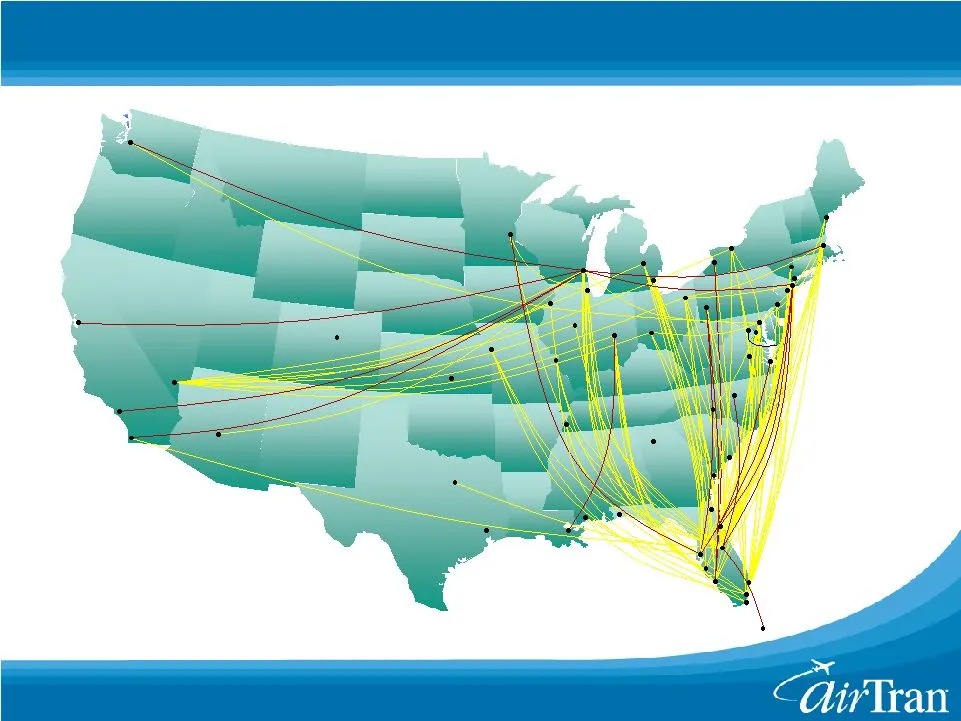
13 Successful Diversification - Non-Atlanta 2008 Portland Portland Boston Boston Dallas/Ft. Worth Dallas/Ft. Worth Newark Newark Ft. Lauderdale Ft. Lauderdale West Palm Beach West Palm Beach Sarasota Sarasota San Juan San Juan Pensacola Pensacola Tampa Tampa Ft. Myers Ft. Myers Miami Miami Richmond
Slide 14: Successful Diversification – Network 2008
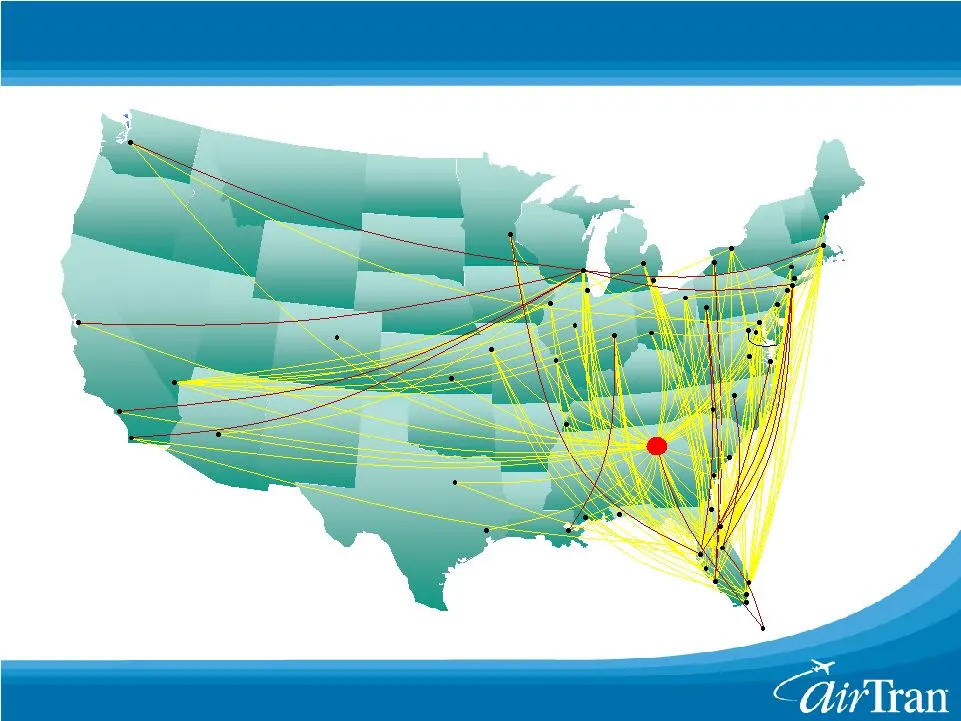
14 Successful Diversification – Network 2008 Portland Portland Boston Boston Dallas/Ft. Worth Dallas/Ft. Worth Newark Newark Ft. Lauderdale Ft. Lauderdale West Palm Beach West Palm Beach Sarasota Sarasota San Juan San Juan Pensacola Pensacola Tampa Tampa Ft. Myers Ft. Myers Miami Miami Atlanta Atlan
Slide 15: Network Breadth Improves Cost And Revenue
15 54 Network Breadth Improves Cost And Revenue Orlando Orlando Atlanta Atlanta Baltimore Baltimore Tampa Tampa West Palm Beach West Palm Beach Newport News Newport News Akron / Akron / Canton Canton Boston Boston Ft. Lauderdale Ft. Lauderdale Indianapolis Indianapolis Chicago Chicago Dayton Dayton

Slide 16: Sustained Industry Discipline Is Likely
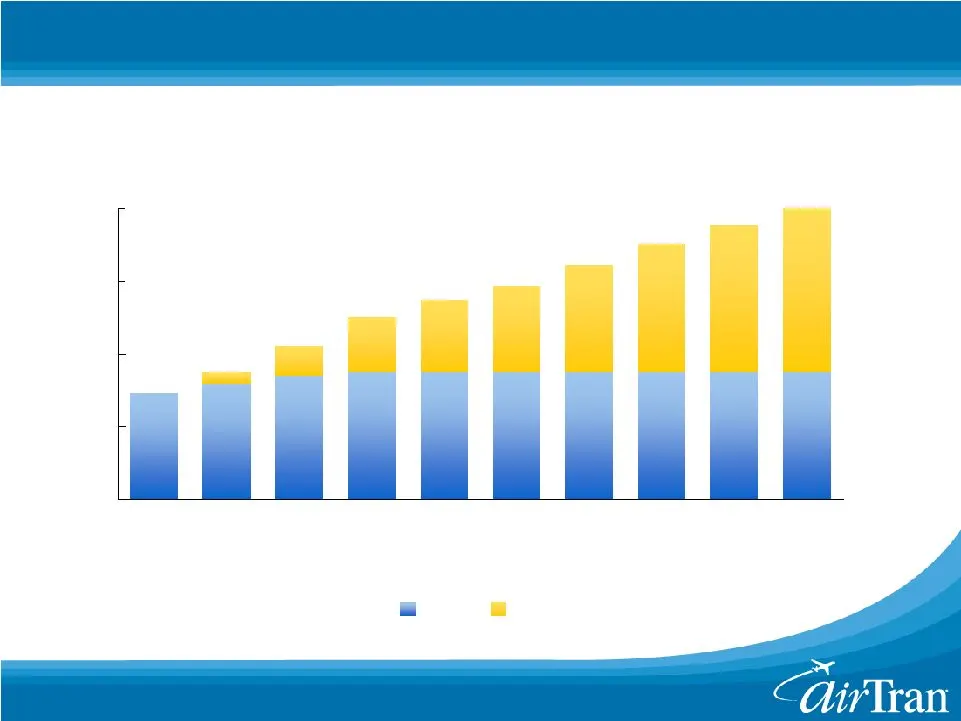
16 Sustained Industry Discipline Is Likely Capacity Growth Will Remain Low Efficient aircraft are not available Domestic has limited profitability for most majors AirTran has restructured 737 delivery schedule $90+ crude oil will bring further scrutiny of fleet plans
Slide 17: Fleet Plan Allows For Manageable Growth
17 Fleet Plan Allows For Manageable Growth 2003 2004 2005 2006 2007 2008 2009 2010 2011 2012 717s 737s Aircraft Currently 137 Aircraft: 87 717s / 50 737s 8% 9% 10% 9% 11% 20% 24% 28% 19% 22% ASM Growth
Slide 18: Reduced Growth Improves Unit Revenues
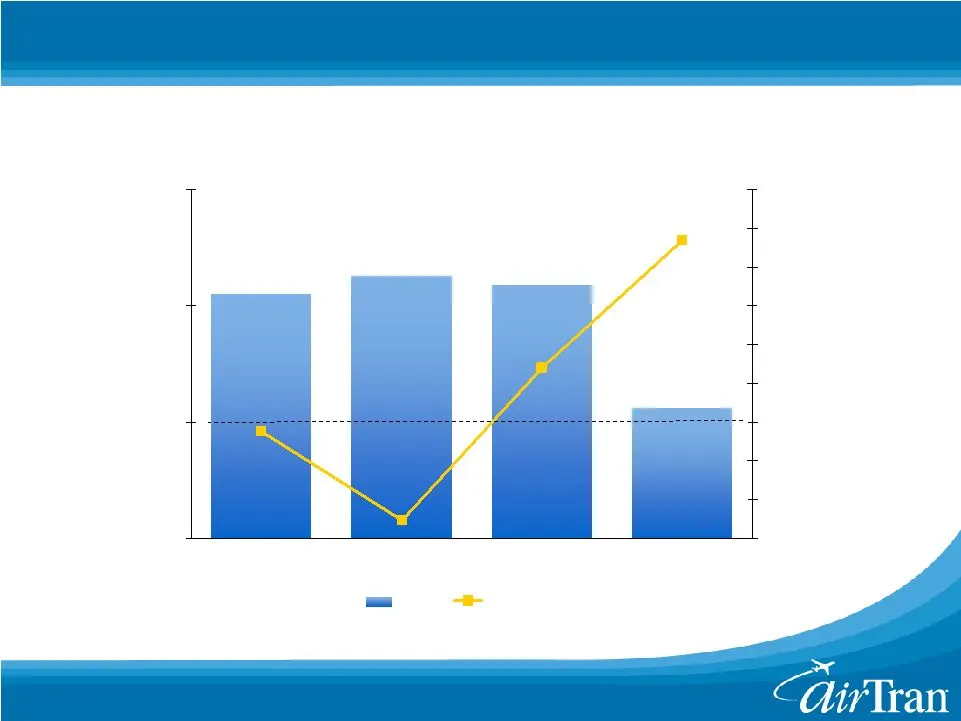
18 -0.5% 2.8% -5.1% Reduced Growth Improves Unit Revenues 20.5% 21.3% 20.9% 15.6% 9.4% 10% 15% 20% 25% Q107 Q207 Q307 Q407 -6% -4% -2% 0% 2% 4% 6% 8% 10% 12% ASMs PAX RASM ASM Growth PAX RASM Growth

Slide 19: How Else Can We Grow RASM
19 How Else Can We Grow RASM Investments in Pricing and Yield Management Ancillary revenues Seasonal capacity reductions Fare increases / fuel surcharges 1% growth in passenger RASM needed for every $2.50 increase in crude oil

Slide 20: Industry M&A Would Be Favorable To AirTran
20 Industry M&A Would Be Favorable To AirTran Any combination will provide benefits Redundant domestic capacity will be cut Well positioned to take advantage of divestitures Will likely result in a wider cost advantage for AirTran
Slide 21: Significant Redundant Legacy Capacity
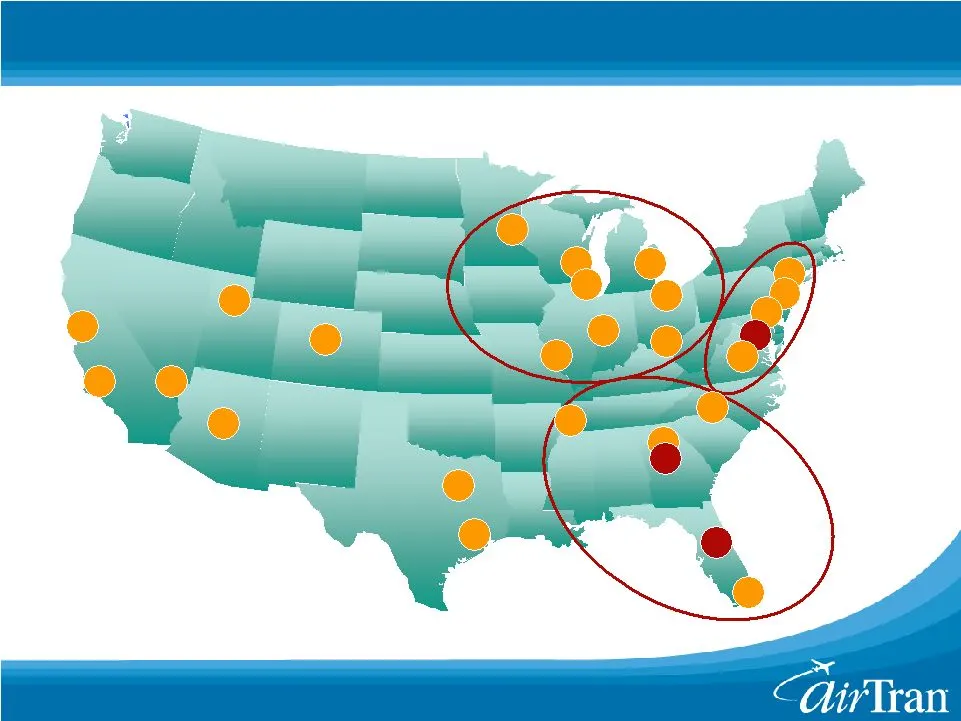
21 Significant Redundant Legacy Capacity Salt Lake City - Salt Lake City - - DAL DAL Las Vegas - Las Vegas - - LCC LCC Legacy Hub Redundancies San Francisco - San Francisco - - UAUA UAUA Los Angeles - Los Angeles - - UAUA UAUA Chicago - Chicago - - AMR AMR Denver - Denver - -

Slide 22: Summary
22 Summary AirTran is a different kind of low cost carrier Unique product, extremely low costs, consistently profitable, successful diversification Significant growth opportunities remain Ideal fleet for mid-market expansion Legacy M&A likely to reduce domestic capacity Well positioned for high oil
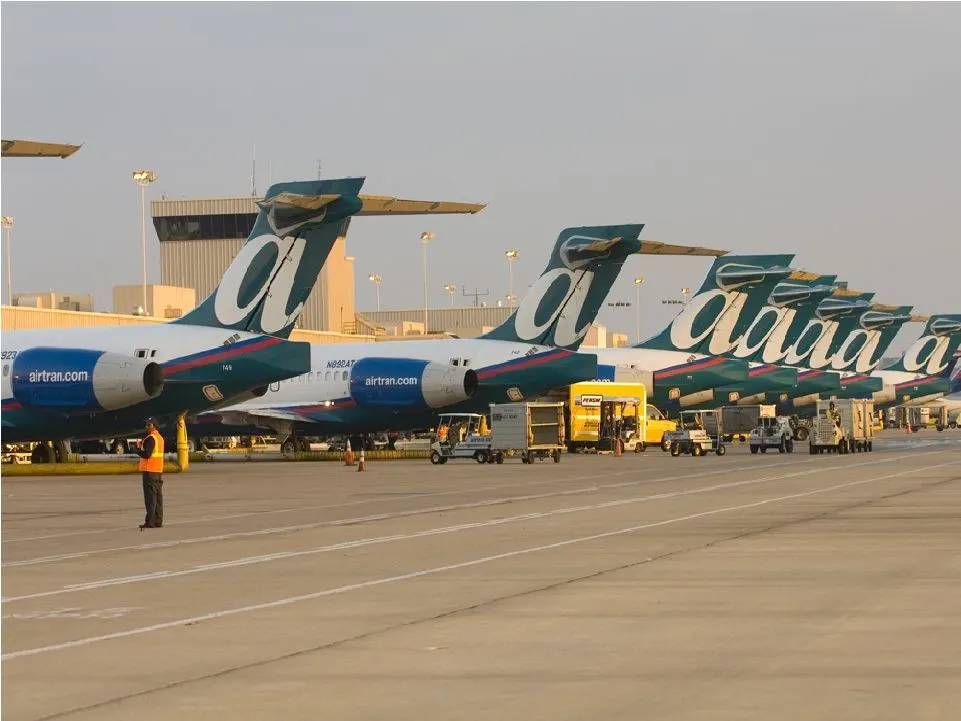
Slide 23
Source: SEC EDGAR · 8-K filed Feb 6, 2008
More decks from Airtran Holdings Inc
 Merger or Acquisition (September 2010)21 slides · Sep 27, 2010
 Bank of America - Merrill Lynch Global Transportation Conference 201025 slides · Jun 15, 2010
 Shareholder Meeting (May 2010)33 slides · May 18, 2010
 Investor Presentation (May 2010)26 slides · May 13, 2010
 JP Morgan Aviation, Transportation and Defense Conference 201025 slides · Mar 9, 2010
 Raymond James 2010 Growth Airline Conference25 slides · Feb 4, 2010