Airtran — Raymond James 2010 Growth Airline Conference
25 slides from Airtran's conference presentation, Feb 4, 2010

Slide 1: Raymond James 2010 Growth Airline Conference
February 2010 Raymond James 2010 Growth Airline Conference February 2010 Raymond James 2010 Growth Airline Conference

Slide 2: Safe Harbor
2 Safe Harbor Certain of the statements contained herein should be considered “forward-looking statements,” including within the meaning of the Private Securities Litigation Reform Act of 1995. These forward-looking statements may be identified by words such as “may”, “will”, “expect,” “intend,” “in
Slide 3: AirTran Investment Highlights
3 AirTran Investment Highlights n Great combination of low costs, diversified network, and high quality ― Lowest cost major airline in the U.S. ― Ranked #1 in the Airline Quality Rating n Company has been successfully repositioned for good times and bad ― Acted quickly to mitigate record high oil in

Slide 4: AirTran Product: Low Fares and Major Airline Amenities
4 AirTran Product: Low Fares and Major Airline Amenities n Business Class on every flight n Assigned seating n Wi-Fi on every flight n Over 100 channels of free XM Satellite Radio n Oversized luggage bins n Friendly Crew Members n Broad distribution network n New aircraft - average age is 7 years

Slide 5: AirTran is Well Prepared for Economic Recovery
5 AirTran is Well Prepared for Economic Recovery n Industry leading low costs n Conservative fleet plan and modest growth n Strong ancillary revenues ― Less dependent on initial sale to passenger n Better diversified network ― Fewer price sensitive connections, less exposure to any single competitor
Slide 6: AirTran's Cost Advantage Remains Strong
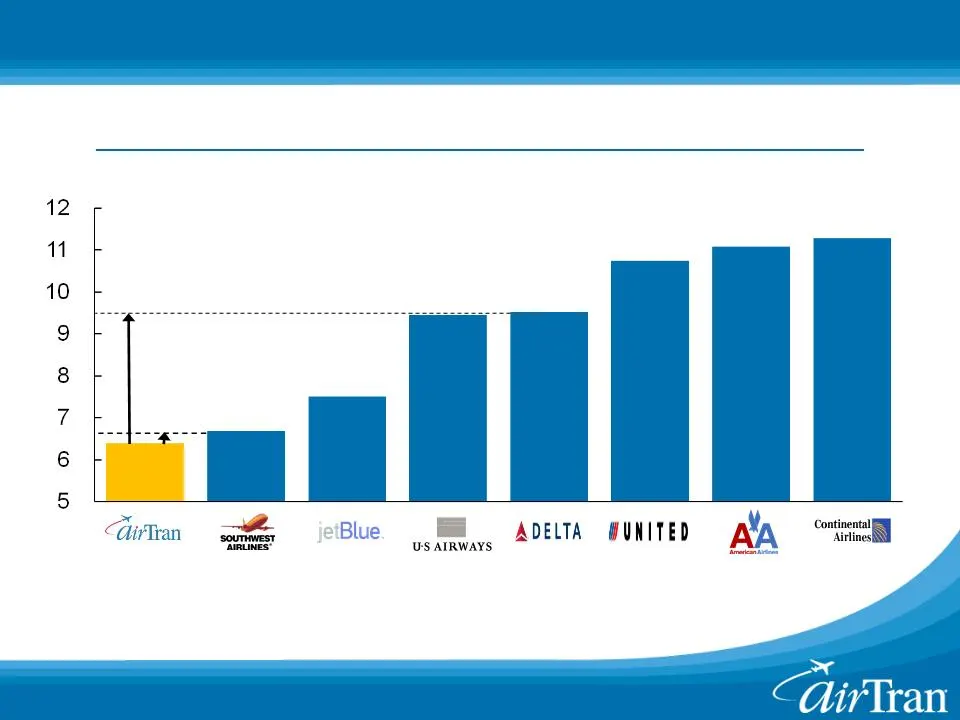
6 AirTran’s Cost Advantage Remains Strong (Cents) Note: Excludes fuel and special items Industry Cost Comparison Non-Fuel Unit Costs at 738 Miles for 2009 49% Higher 5% Higher

Slide 7: AirTran Has High Quality & Industry Leading Low Costs
AirTran AirTran AirTran AirTran AirTran 7 2007 2006 2005 2008 2009 AirTran Has High Quality & Industry Leading Low Costs JetBlue Independence Southwest United America West Northwest Continental Alaska American JetBlue Southwest United Alaska America West Northwest American Continental ATA JetBlue No
Slide 8: Fleet Plan Well-Suited for Economic Uncertainty
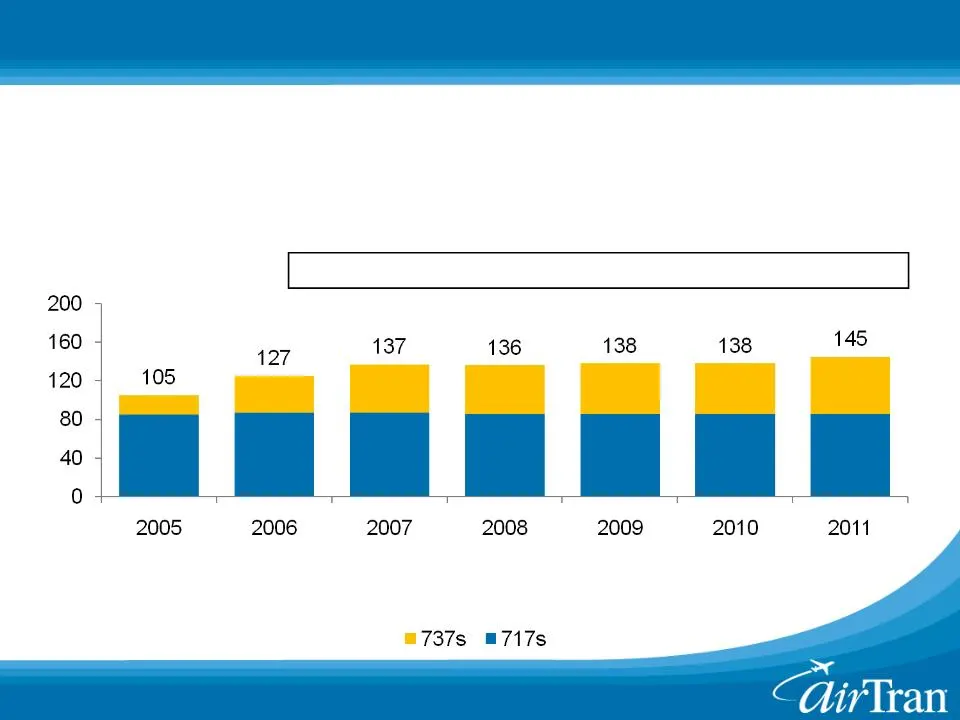
8 Fleet Plan Well-Suited for Economic Uncertainty 28% 24% 20% 5% (2)% 3-4% 3-4% (Aircraft) Previous Plan: n Currently 138 aircraft: 86 717s / 52 737-700s ― Deferred / sold 47 aircraft from 2008-2011 fleet plan ― Reduced capital requirements by nearly $1 billion through 2010 ― No permanent aircraft f

Slide 9: AirTran Has Successfully Diversified Its Network
9 AirTran Has Successfully Diversified Its Network % ASMs 2000 2002 2004 2006 2008 2010E Atlanta 91% 76% 67% 64% 58% 47% Florida 29% 35% 34% 38% 45% 41% Baltimore 0% 13% 13% 9% 11% 13% Milwaukee 0% 3% 3% 2% 7% 13% Caribbean 0% 1% 1% 0% 3% 6% Daily Flights 278 362 492 650 713 713 Note: Totals >100% a
Slide 10: AirTran Had a Regional Route Network in 2000
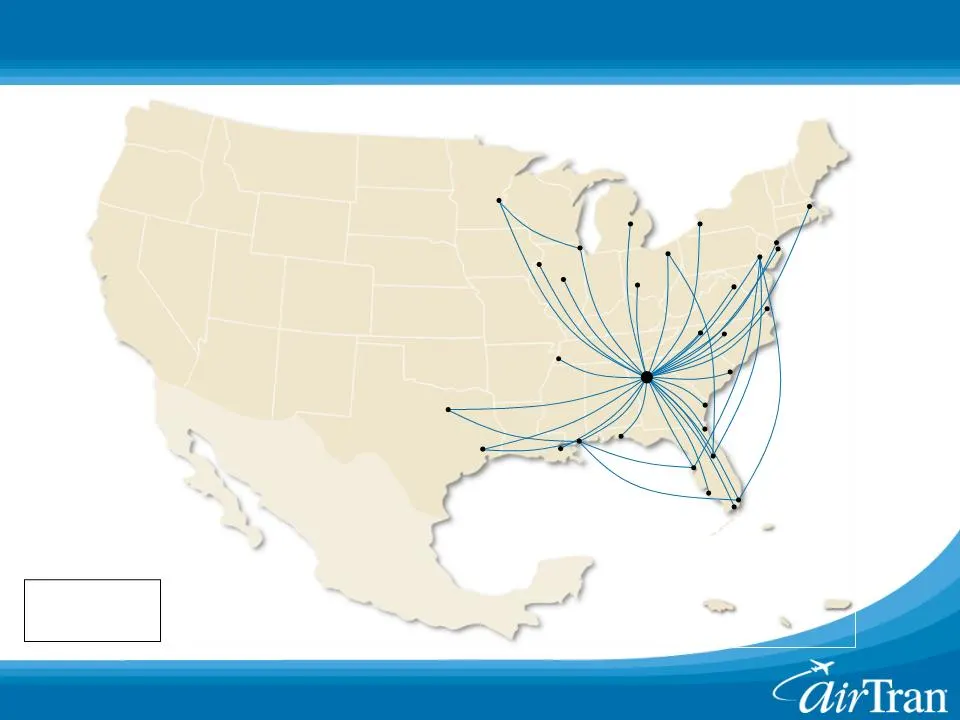
10 AirTran Had a Regional Route Network in 2000 Boston Flint Moline Buffalo Dayton Dallas/Ft. Worth Houston New Orleans Memphis Bloomington Minneapolis Akron/ Canton Newport News New York (LGA) Ft. Lauderdale Gulfport/Biloxi Fort Walton Beach Miami Ft. Myers Orlando Jacksonville Savannah Myrtle Beac
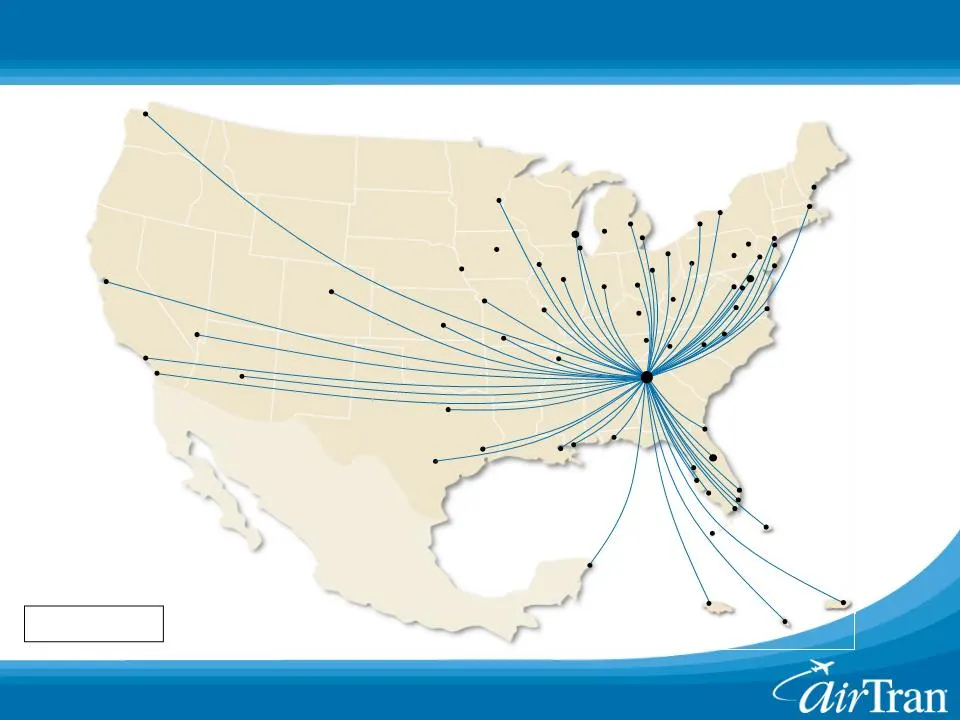
Slide 11: AirTran's 2009 Atlanta Network Has Grown
11 AirTran’s 2009 Atlanta Network Has Grown to 57 Cities Boston Dallas/Ft. Worth Las Vegas Denver Minneapolis San Antonio Houston San Juan Cancun Montego Bay Aruba Pittsburgh Newport News Rochester Kansas City Columbus Akron/ Canton San Diego Los Angeles Phoenix Seattle San Francisco Milwaukee Molin
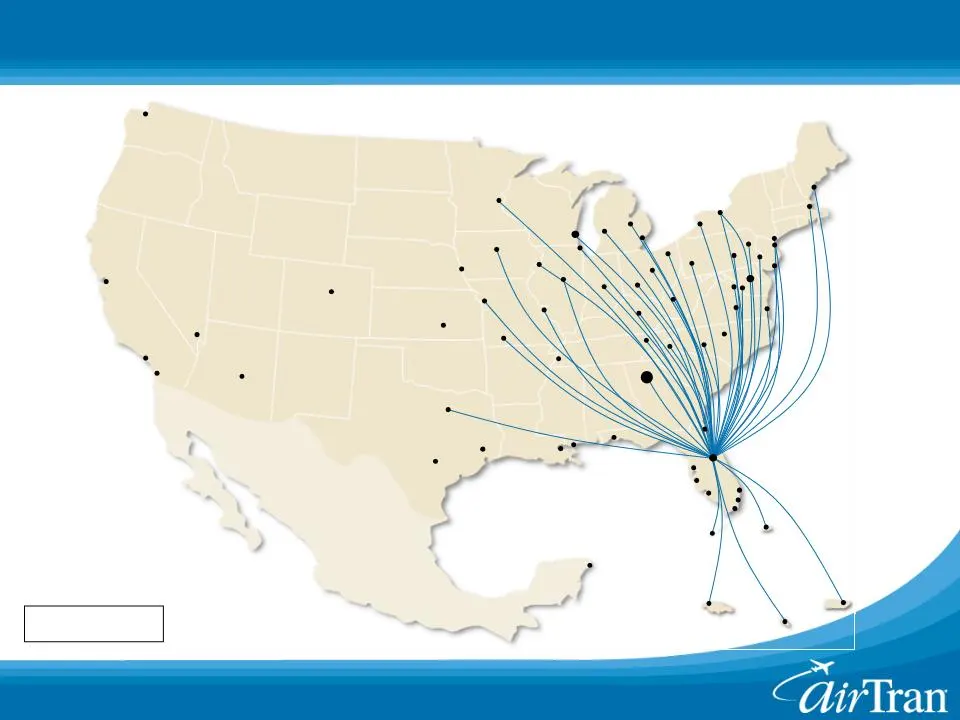
Slide 12: AirTran Now Serves the Most Destinations from Orlando
12 AirTran Now Serves the Most Destinations from Orlando Portland Dallas/Ft. Worth Las Vegas Minneapolis San Antonio Houston San Juan Montego Bay Aruba Rochester San Diego Los Angeles Seattle San Francisco Branson Wichita New Orleans Cancun White Plains New York (LGA) Philadelphia Atlantic City Wash
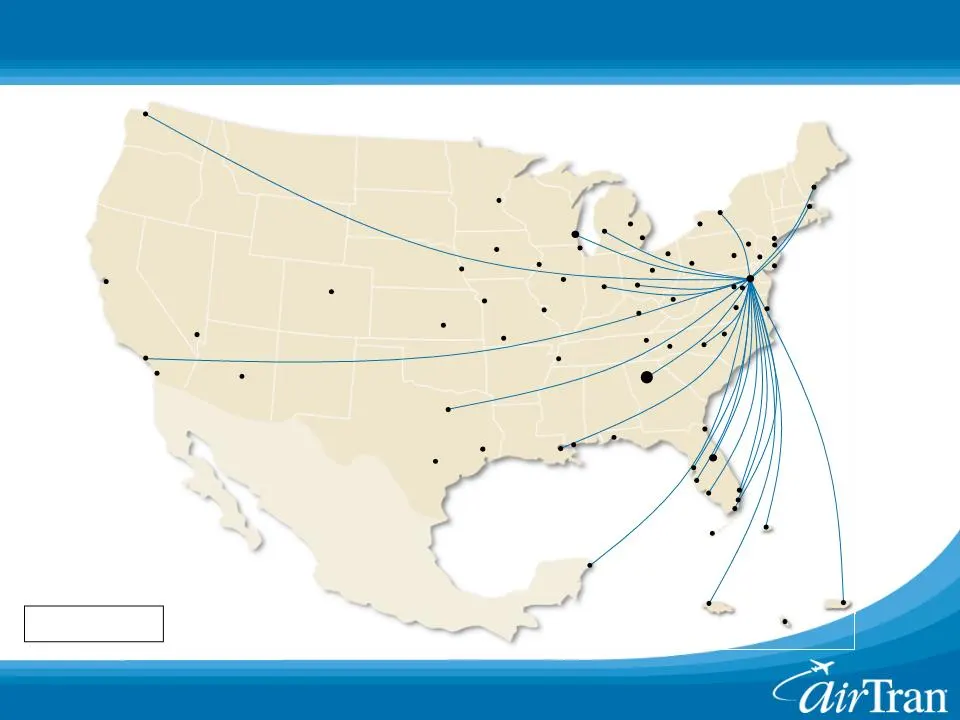
Slide 13: AirTran Capitalized on Baltimore's Capacity Reductions
13 AirTran Capitalized on Baltimore’s Capacity Reductions Portland Dallas/Ft. Worth Las Vegas Minneapolis San Antonio Houston San Juan Montego Bay Aruba Rochester San Diego Los Angeles Seattle San Francisco Branson Wichita New Orleans Cancun White Plains New York (LGA) Philadelphia Atlantic City Was
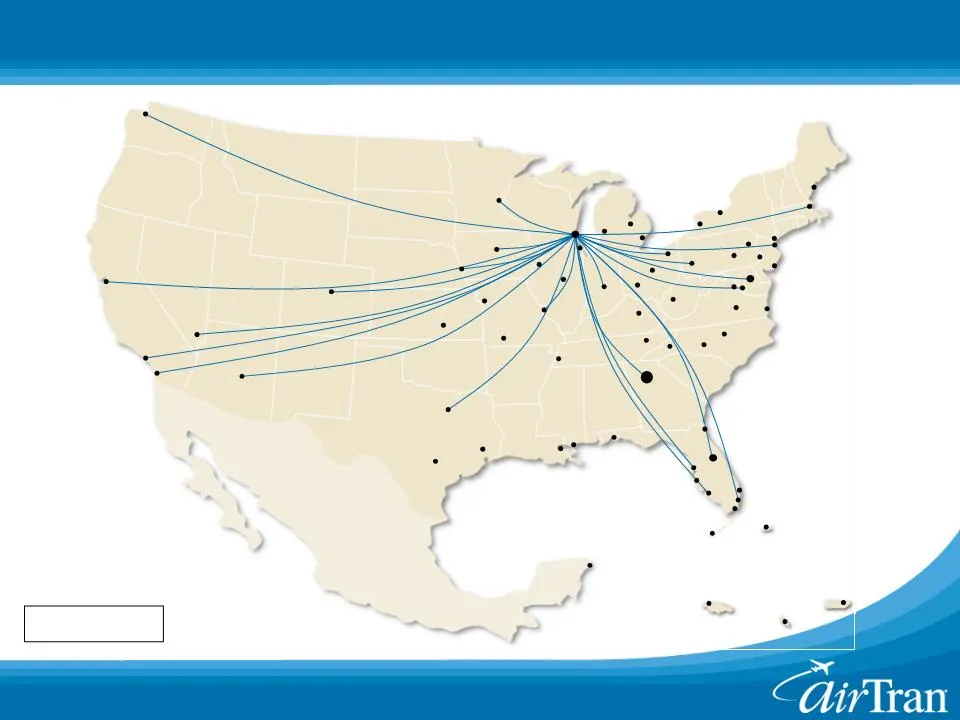
Slide 14: AirTran is Now Milwaukee's Largest Mainline Carrier
14 AirTran is Now Milwaukee’s Largest Mainline Carrier Portland Dallas/Ft. Worth Las Vegas Minneapolis San Antonio Houston San Juan Montego Bay Aruba Rochester San Diego Los Angeles Seattle San Francisco Branson Wichita New Orleans Cancun White Plains New York (LGA) Philadelphia Atlantic City Washin
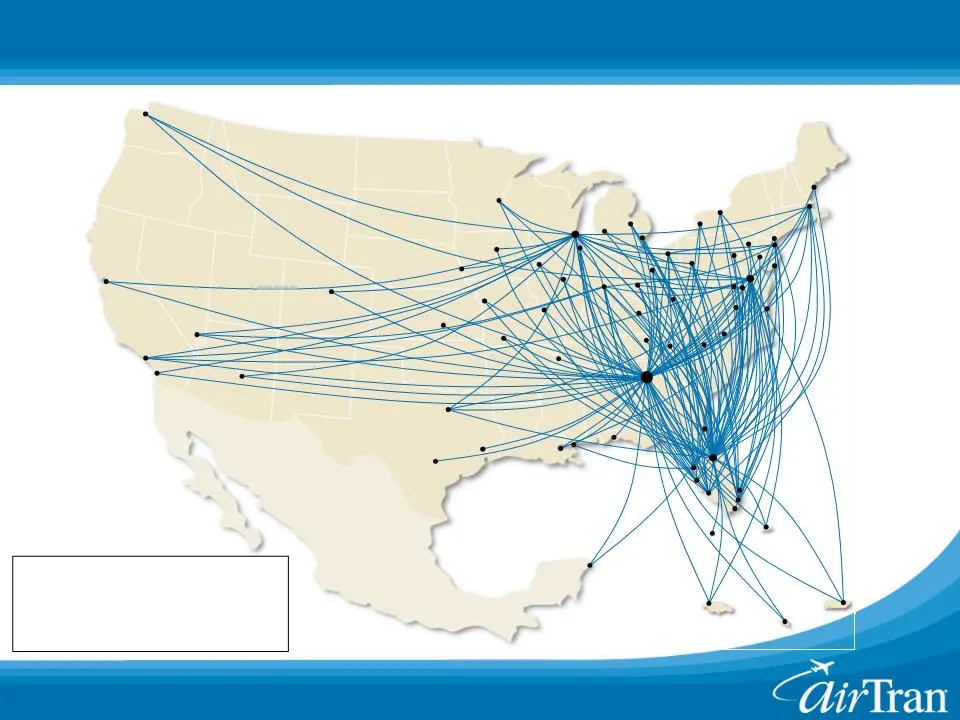
Slide 15: AirTran's 2010 Network is Nationwide and Diversified
15 AirTran’s 2010 Network is Nationwide and Diversified Portland Dallas/Ft. Worth Las Vegas Minneapolis San Antonio Flint Houston San Juan Montego Bay Aruba Rochester San Diego Los Angeles Seattle San Francisco Branson Wichita New Orleans Cancun White Plains New York (LGA) Philadelphia Atlantic City
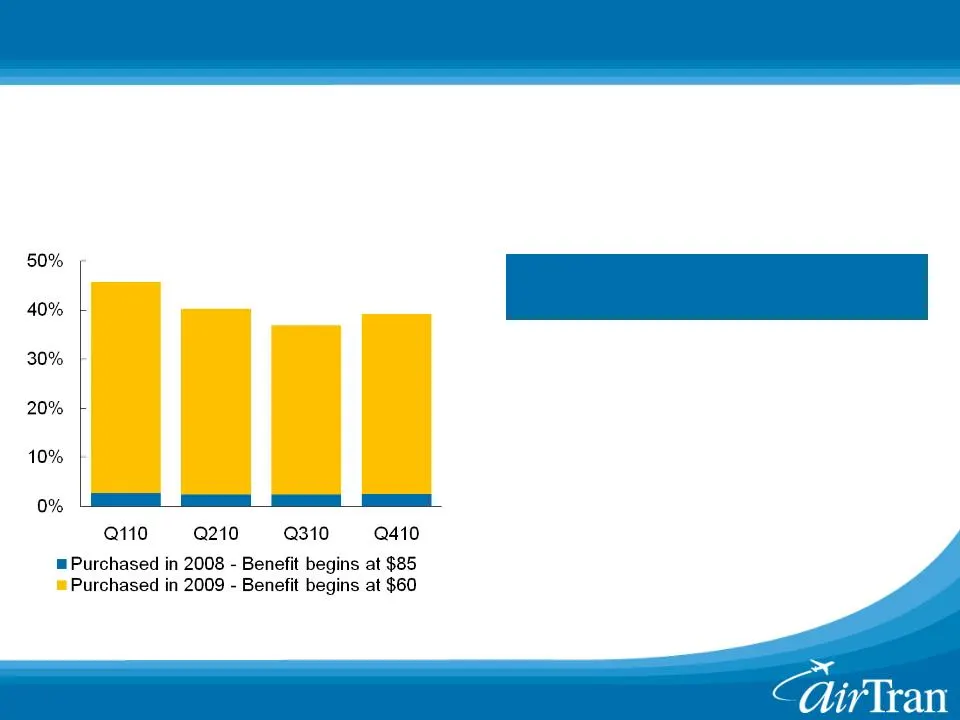
Slide 16: AirTran is Committed to Reducing Fuel Cost Volatility
16 16 Crude Price Period Hedge % $50 $70 $90 Q110 46% $62 $73 $80 Q210 40% $62 $75 $83 Q310 37% $65 $77 $88 Q410 39% $65 $77 $88 2010 40% $63 $75 $84 AirTran is Committed to Reducing Fuel Cost Volatility n Hedge portfolio was restructured in 2008 n One of few airlines to actively hedge in 2009 Examp
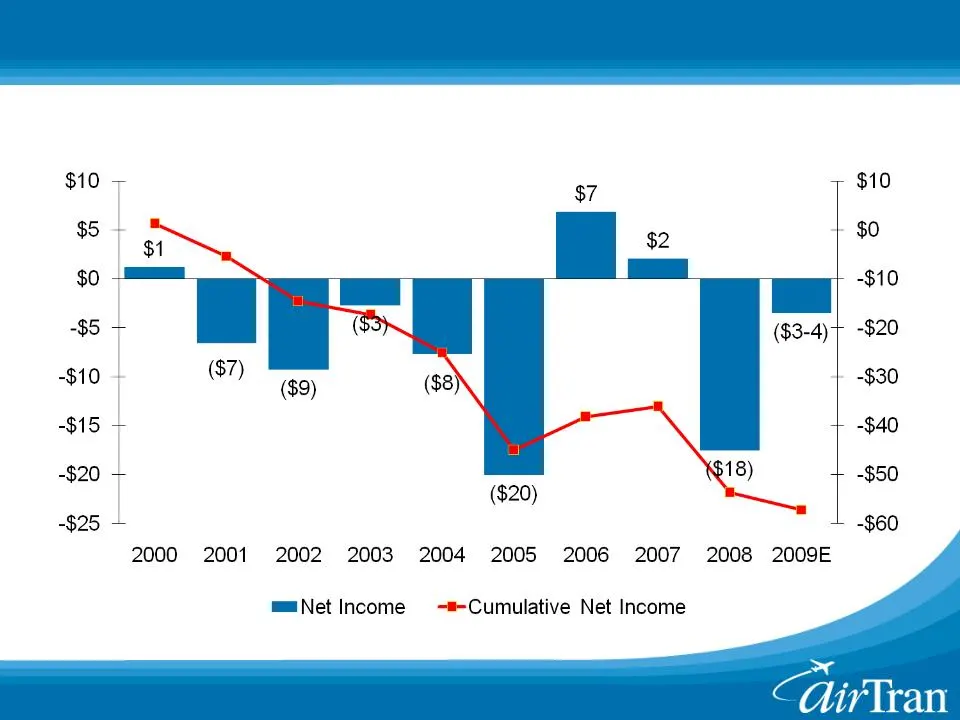
Slide 17: Legacy Airline's Domestic Networks Remain Unprofitable
17 Legacy Airline’s Domestic Networks Remain Unprofitable (Billions) (Billions) Legacy Airline Domestic Net Income Source: DOT Form 41 Filings and company reported financials Annual Cumulative
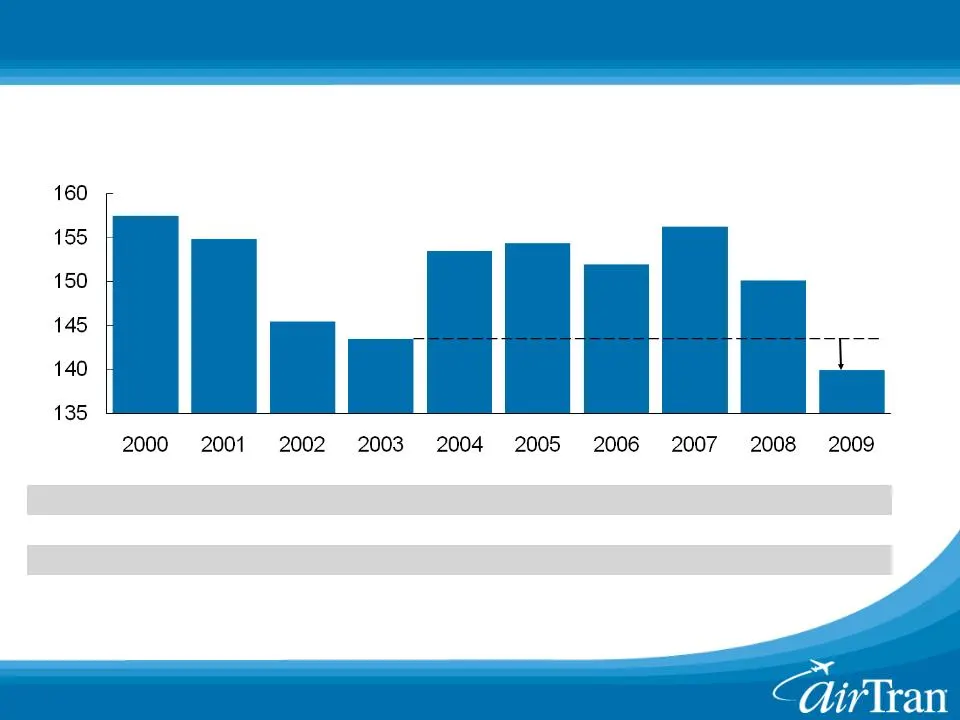
Slide 18: Domestic Capacity Now at Lowest Level in Over a Decade
18 18 82% 79% 76% 72% 69% 64% 61% 59% 57% 56% 6% 7% 8% 10% 12% 14% 14% 14% 14% 15% 12% 14% 16% 18% 19% 22% 25% 27% 29% 29% Domestic Capacity Now at Lowest Level in Over a Decade Source: DOT Form 41 Filings (Trillions) Continental U.S. Available Seat Miles Legacy Regional LCC (2%)
Slide 19: Industry Losses Result in Disciplined Domestic Capacity
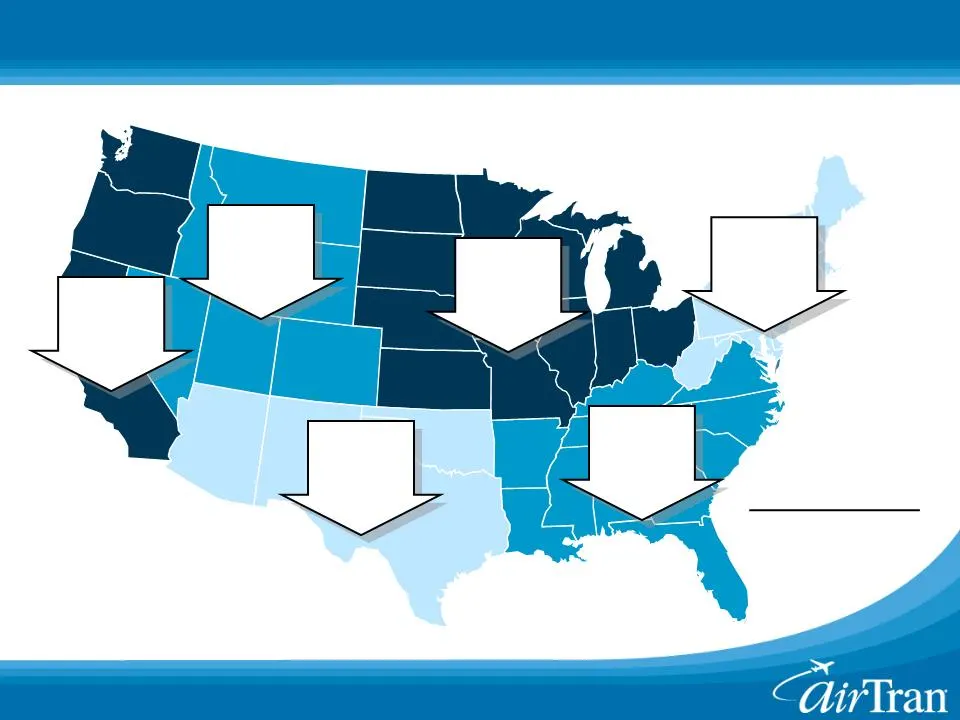
19 Industry Losses Result in Disciplined Domestic Capacity AirTran Southwest Delta +5% +1% -13% Domestic Capacity 2010 vs. 2007 Northeast -9% Midwest -13% Southwest -9% Mountain -11% West -11% South -10% Domestic Capacity Change 2010 vs. 2007 Source: DOT Form 41 Filings
Slide 20: AirTran Yr/Yr Growth is Diversified Beyond Milwaukee
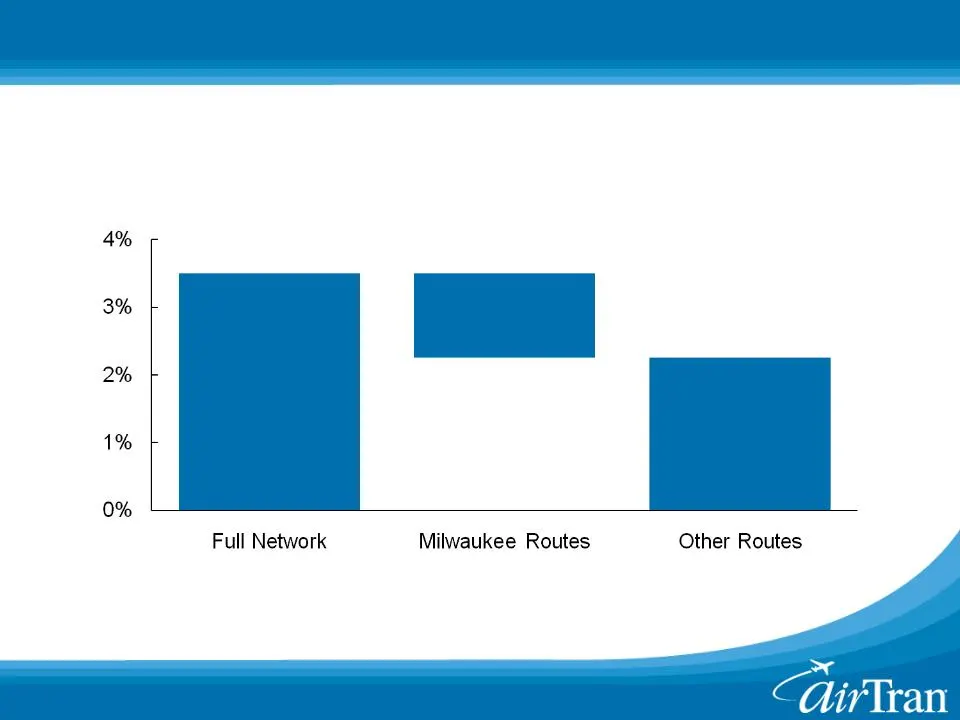
20 AirTran Yr/Yr Growth is Diversified Beyond Milwaukee 3 - - 4 % 1 - - 1½ % 2 - - 2½ % (ASM Growth) AirTran 2010 Available Seat Mile Growth
Slide 21: AirTran's Milwaukee Network Has Matured
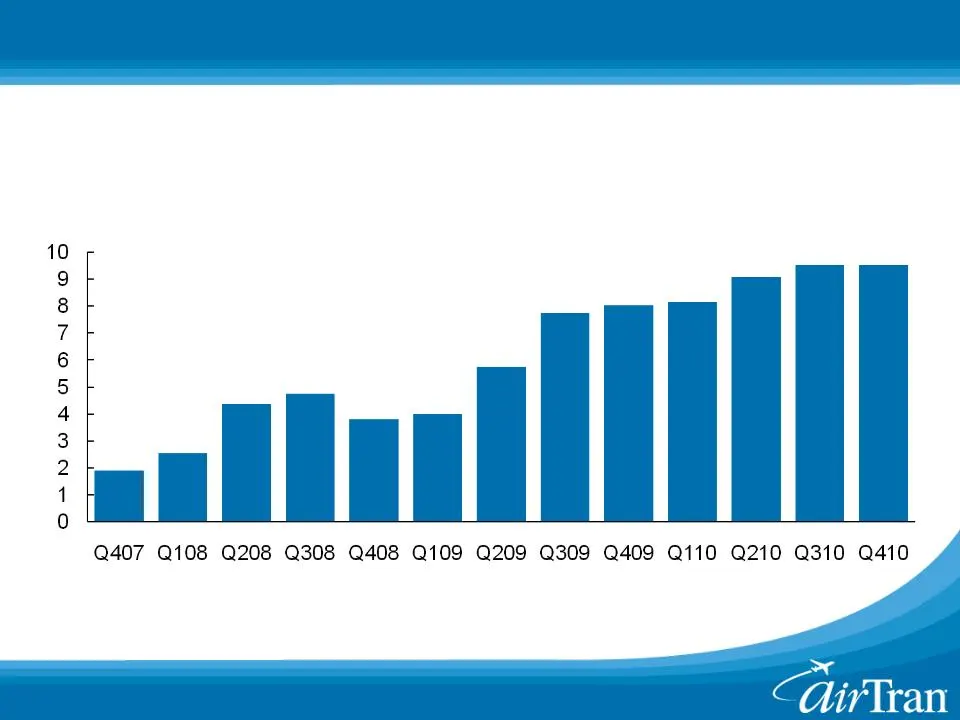
21 AirTran’s Milwaukee Network Has Matured (ASMs in Millions) AirTran Milwaukee Daily ASMs n AirTran now serves 18 of the top 20 markets
Slide 22: Milwaukee Plays Big Role in Downsized Chicago Region
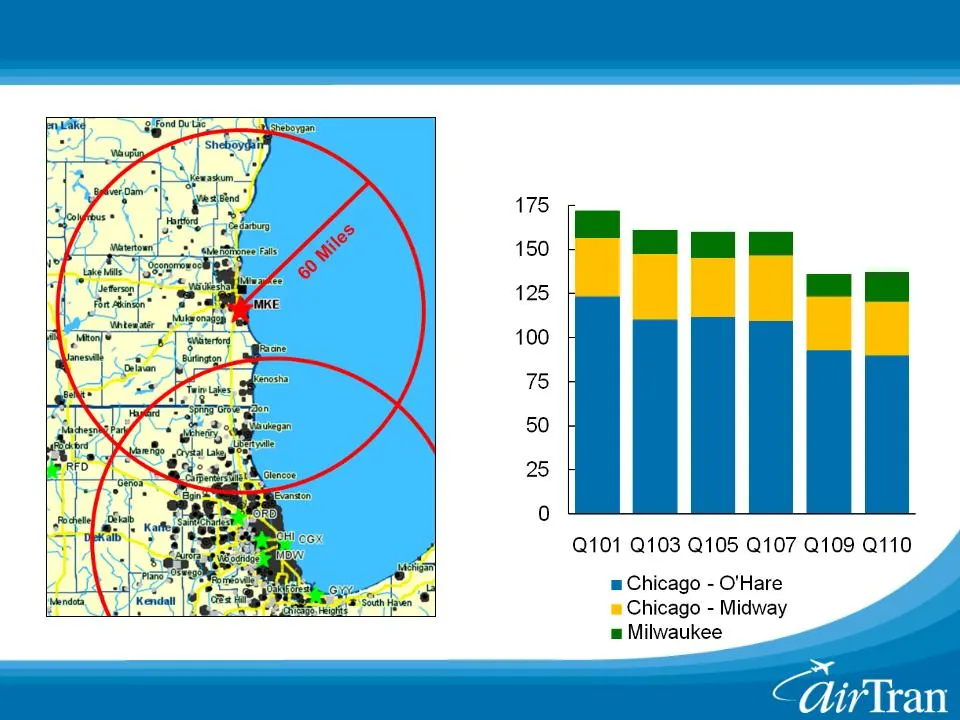
22 Milwaukee Plays Big Role in Downsized Chicago Region (Daily Seats 000s) Chicago / Milwaukee Region Capacity Milwaukee population: 3.4 million

Slide 23: Outlook for AirTran Remains Positive
23 Outlook for AirTran Remains Positive n Track record of profitability was restored in 2009 ― Record net income in 2009 ― Consumers are increasingly value-oriented ― Softening consumer demand has been offset by lower fuel, capacity reductions, and strong growth in ancillary revenues n Significant n

Slide 24: AirTran Investment Summary
24 AirTran Investment Summary n Industry leading low costs and a high quality product drives strong 2009 profitability across multiple market segments n Significant cost advantage resulting in share shift in leisure markets ― Business Class / Wi-Fi / Assigned Seats appeal to high-yielding travelers

Slide 25
Source: SEC EDGAR · 8-K filed Feb 4, 2010
More decks from Airtran Holdings Inc
 Merger or Acquisition (September 2010)21 slides · Sep 27, 2010
 Bank of America - Merrill Lynch Global Transportation Conference 201025 slides · Jun 15, 2010
 Shareholder Meeting (May 2010)33 slides · May 18, 2010
 Investor Presentation (May 2010)26 slides · May 13, 2010
 JP Morgan Aviation, Transportation and Defense Conference 201025 slides · Mar 9, 2010
 Next Generation Equity Research Airlines Conference (December 2009)26 slides · Dec 10, 2009