Spirit Realty Capital — NAREIT Investor Presentation June 2020
38 slides from Spirit Realty Capital's conference presentation, Jun 1, 2020
Slide 1: NAREIT Investor Presentation June 2020
NAREIT Investor Presentation June 2020 Exhibit 99.1
Slide 2: Q2 2020 Update
Q2 2020 Update
Slide 3: Impact of states reopening
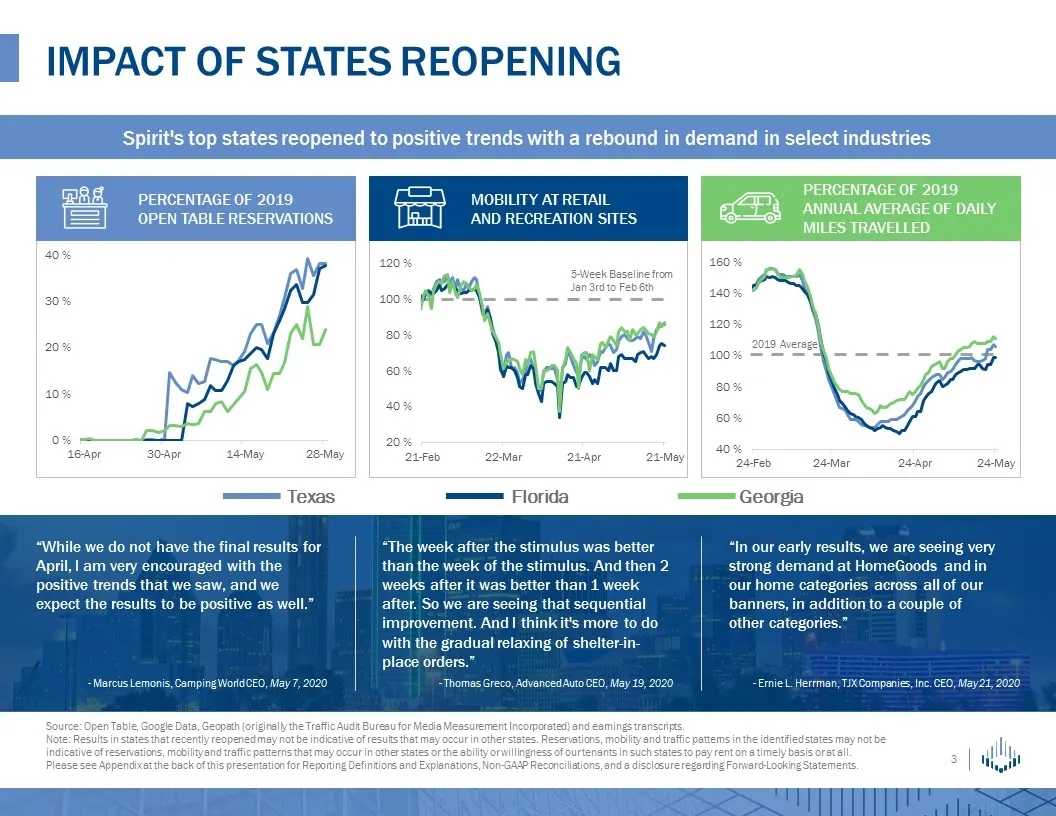
Impact of states reopening Source: Open Table, Google Data, Geopath (originally the Traffic Audit Bureau for Media Measurement Incorporated) and earnings transcripts. Note: Results in states that recently reopened may not be indicative of results that may occur in other states. Reservations, mobilit
Slide 4: Miles traveled April vs. May 2020
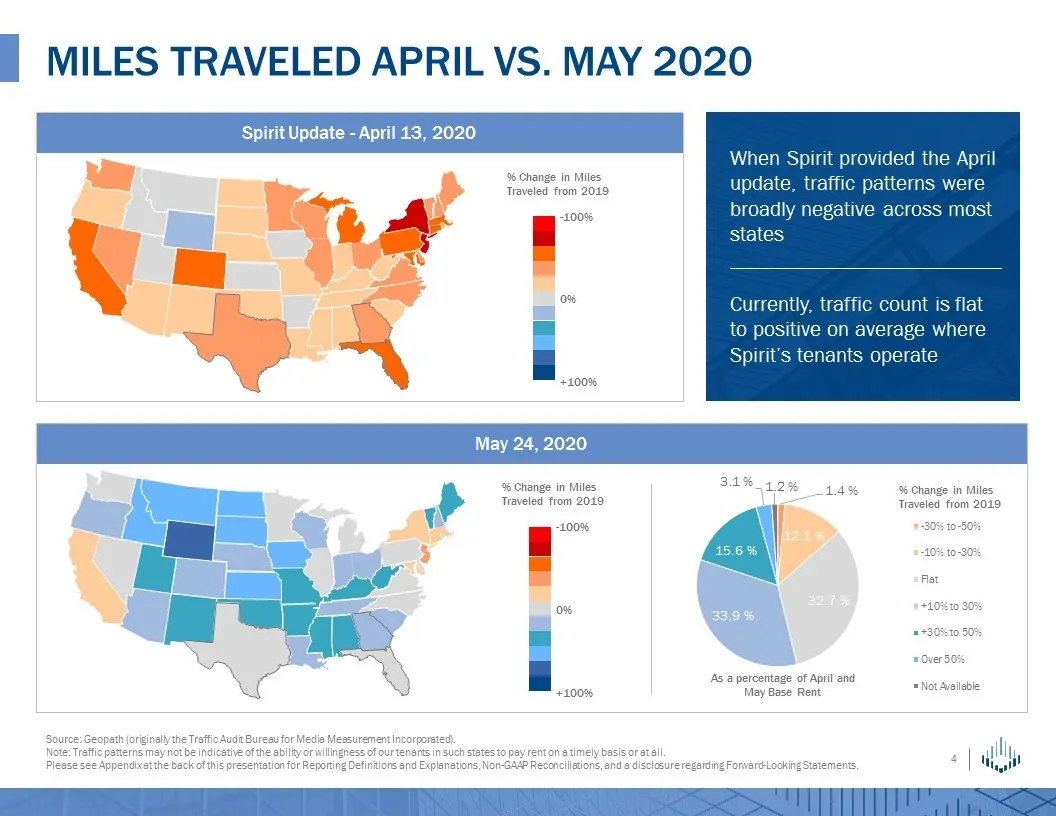
Miles traveled April vs. may 2020 Source: Geopath (originally the Traffic Audit Bureau for Media Measurement Incorporated). Note: Traffic patterns may not be indicative of the ability or willingness of our tenants in such states to pay rent on a timely basis or at all. Please see Appendix at the bac
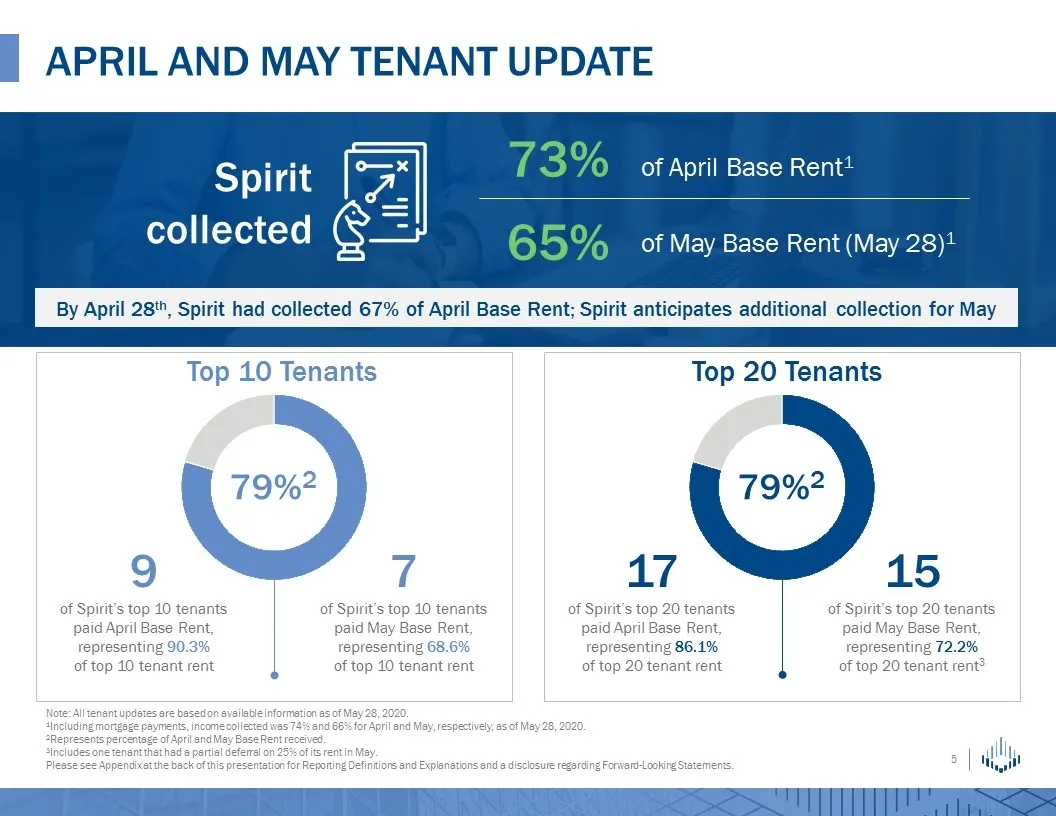
Slide 5: April and May tenant update
April and may tenant update Note: All tenant updates are based on available information as of May 28, 2020. 1Including mortgage payments, income collected was 74% and 66% for April and May, respectively, as of May 28, 2020. 2Represents percentage of April and May Base Rent received. 3Includes one te
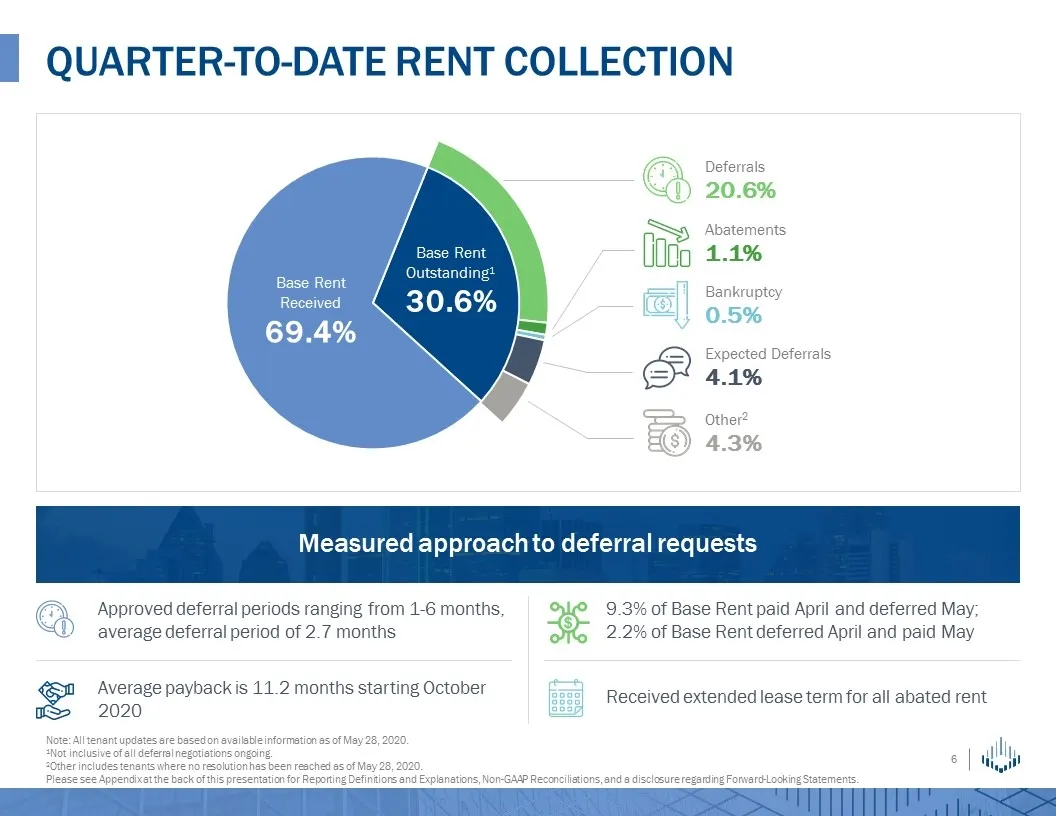
Slide 6: Quarter-to-date rent collection
Quarter-to-date rent collection Deferrals20.6% 1.1% Expected Deferrals4.1% Other24.3% Bankruptcy0.5% Measured approach to deferral requests Approved deferral periods ranging from 1-6 months, average deferral period of 2.7 months 9.3% of Base Rent paid April and deferred May; 2.2% of Base Rent deferr
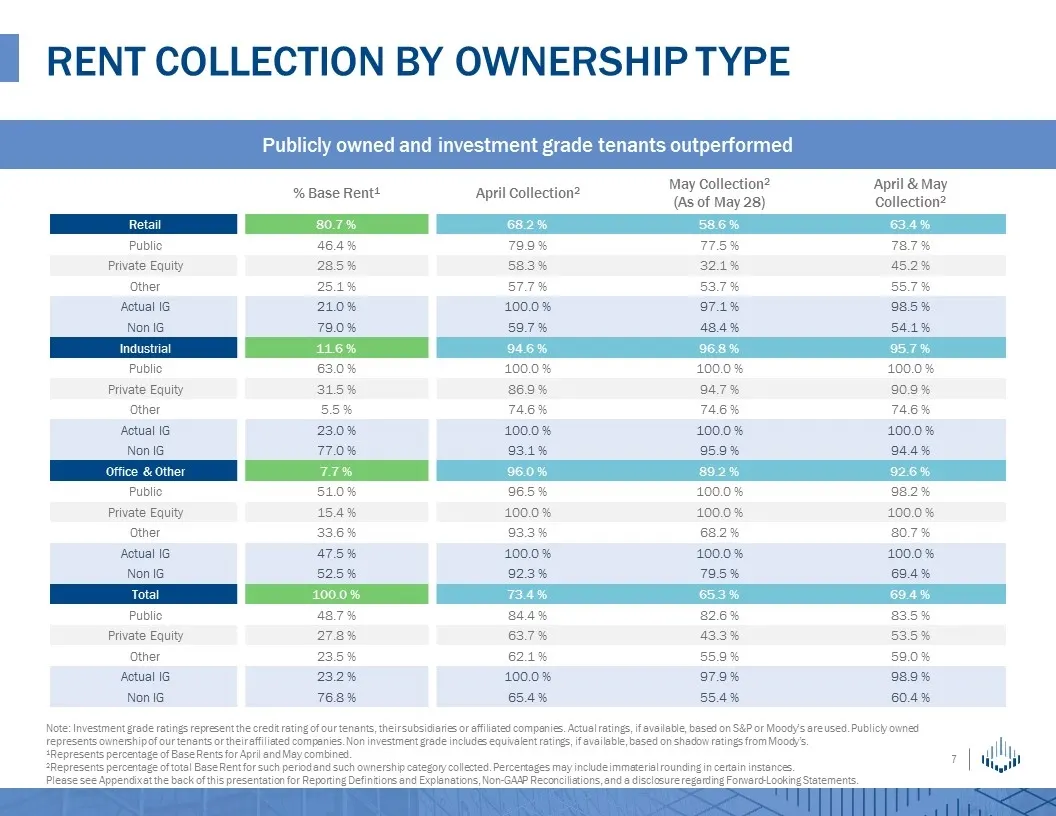
Slide 7: Rent collection by ownership type
Rent collection by ownership type % Base Rent1 April Collection2 May Collection2 (As of May 28) April & May Collection2 Retail 80.7 % 68.2 % 58.6 % 63.4 % Public 46.4 % 79.9 % 77.5 % 78.7 % Private Equity 28.5 % 58.3 % 32.1 % 45.2 % Other 25.1 % 57.7 % 53.7 % 55.7 % Actual IG 21.0 % 100.0 % 97.1 % 9
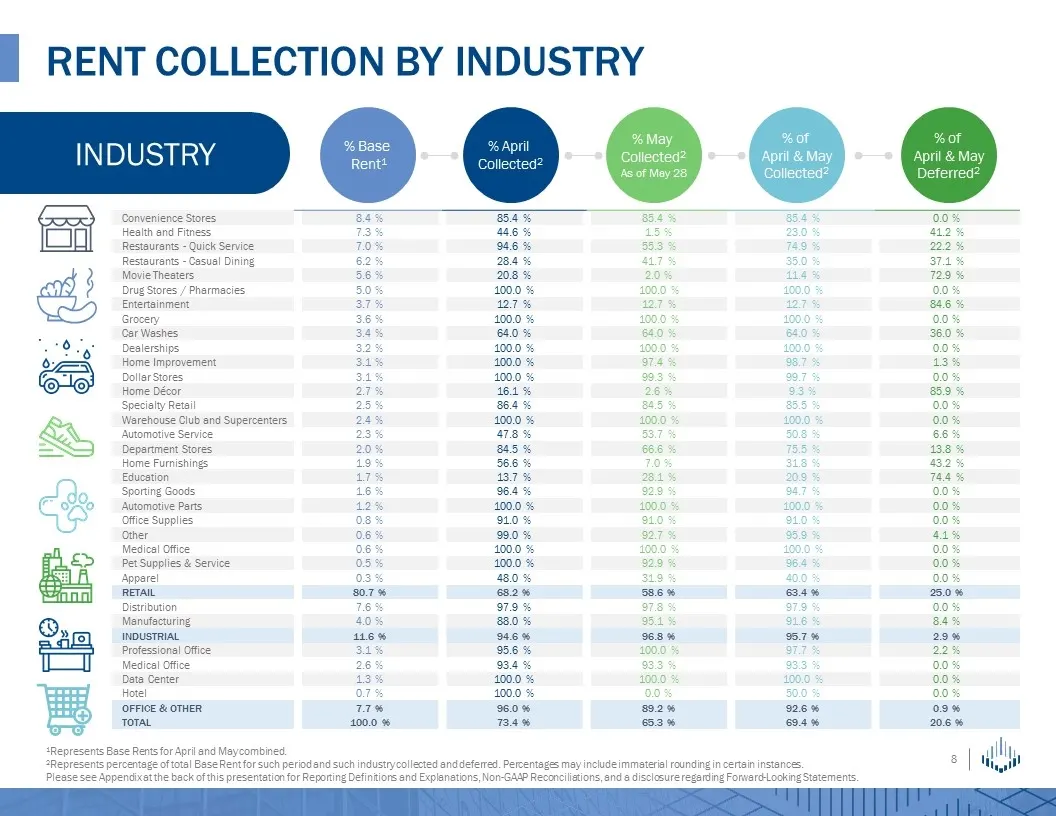
Slide 8: Rent collection by industry
Rent collection by industry Convenience Stores 8.4 % 85.4 % 85.4 % 85.4 % 0.0 % Health and Fitness 7.3 % 44.6 % 1.5 % 23.0 % 41.2 % Restaurants - Quick Service 7.0 % 94.6 % 55.3 % 74.9 % 22.2 % Restaurants - Casual Dining 6.2 % 28.4 % 41.7 % 35.0 % 37.1 % Movie Theaters 5.6 % 20.8 % 2.0 % 11.4 % 72.
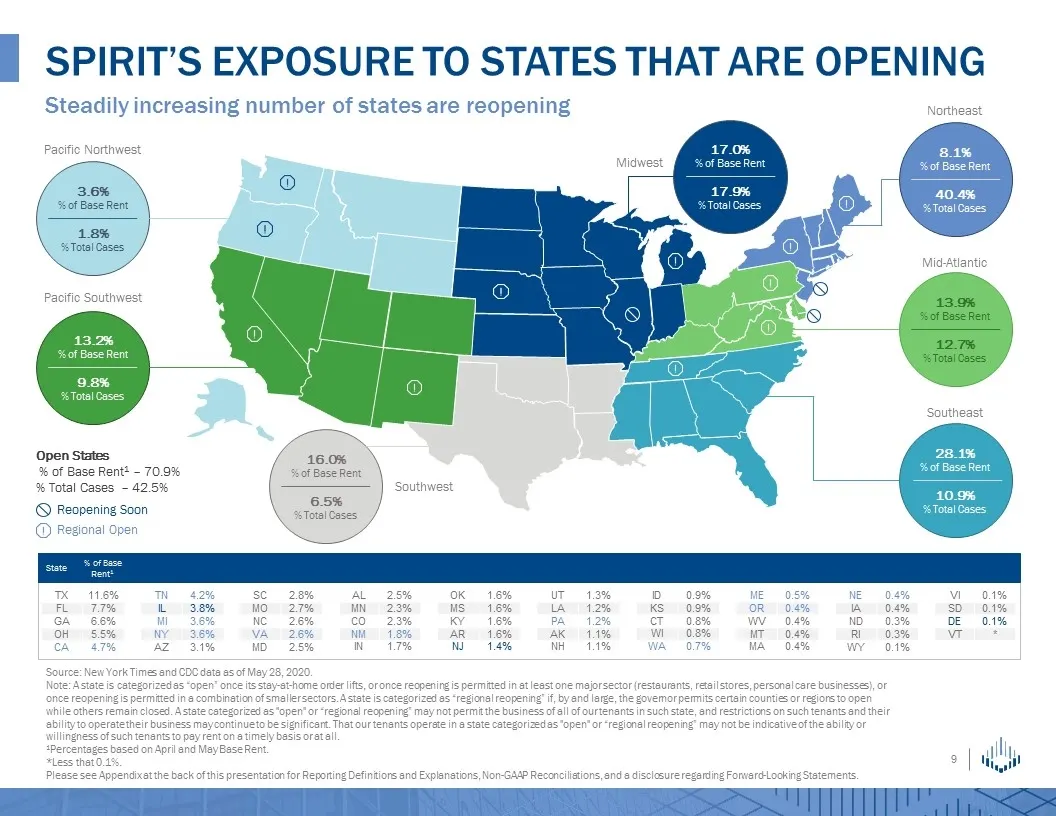
Slide 9: Spirit's exposure to states that are opening
Spirit’s exposure to states that are opening Source: New York Times and CDC data as of May 28, 2020. Note: A state is categorized as “open” once its stay-at-home order lifts, or once reopening is permitted in at least one major sector (restaurants, retail stores, personal care businesses), or once r
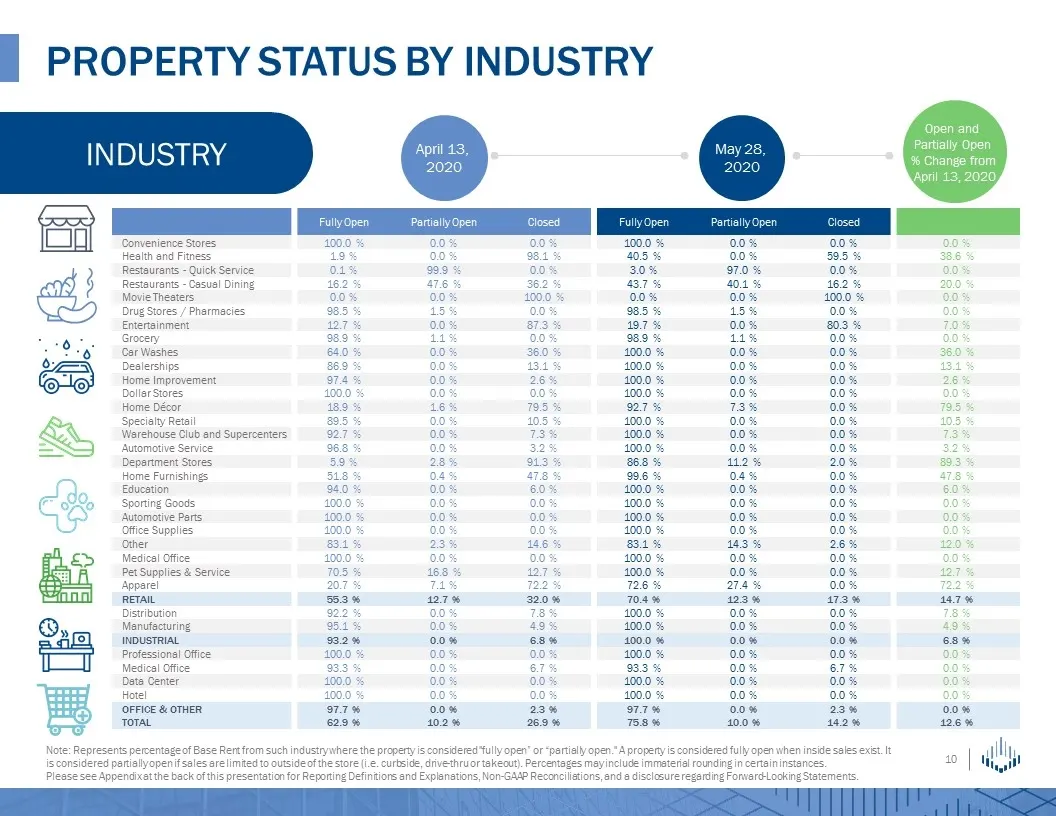
Slide 10: Property status by industry
Property status by industry Fully Open Partially Open Closed Fully Open Partially Open Closed Convenience Stores 100.0 % 0.0 % 0.0 % 100.0 % 0.0 % 0.0 % 0.0 % Health and Fitness 1.9 % 0.0 % 98.1 % 40.5 % 0.0 % 59.5 % 38.6 % Restaurants - Quick Service 0.1 % 99.9 % 0.0 % 3.0 % 97.0 % 0.0 % 0.0 % Rest
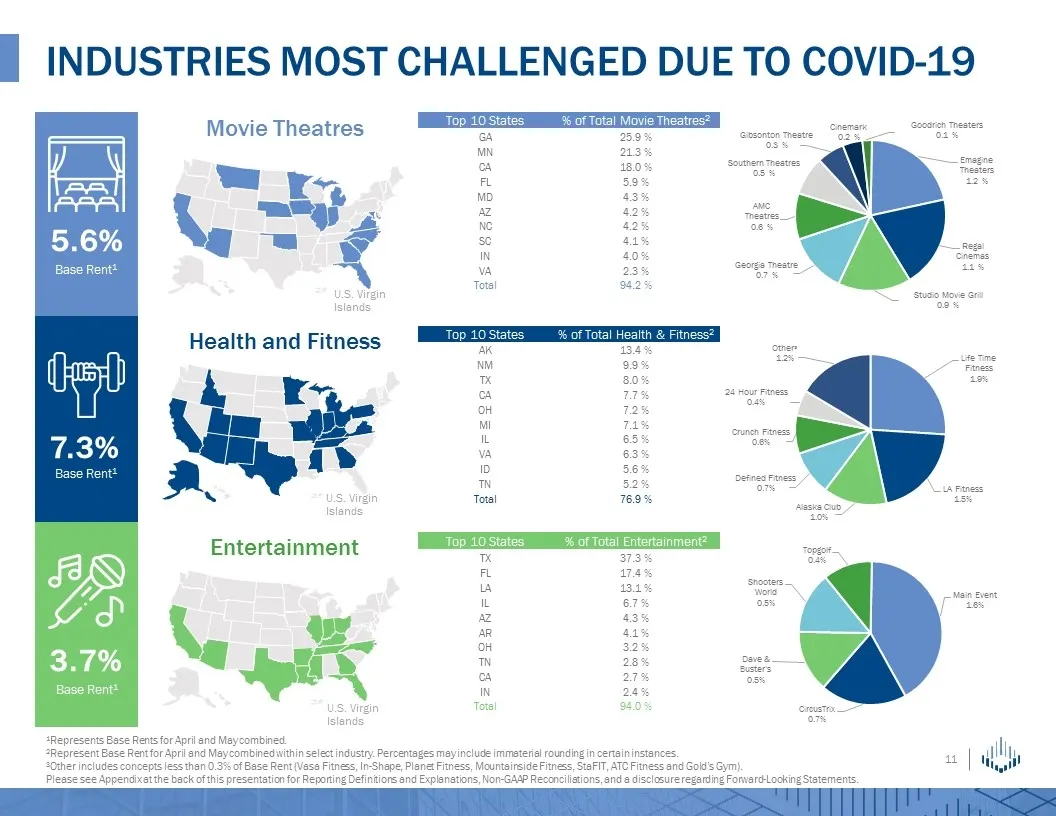
Slide 11: Industries most challenged due to COVID-19
Industries most challenged due to covid-19 U.S. Virgin Islands Top 10 States % of Total Movie Theatres2 GA 25.9 % MN 21.3 % CA 18.0 % FL 5.9 % MD 4.3 % AZ 4.2 % NC 4.2 % SC 4.1 % IN 4.0 % VA 2.3 % Total 94.2 % U.S. Virgin Islands U.S. Virgin Islands Top 10 States % of Total Health & Fitness2 AK 13.4
Slide 12: Q1 2020 Recap
Q1 2020 Recap
Slide 13: Q1 2020 highlights
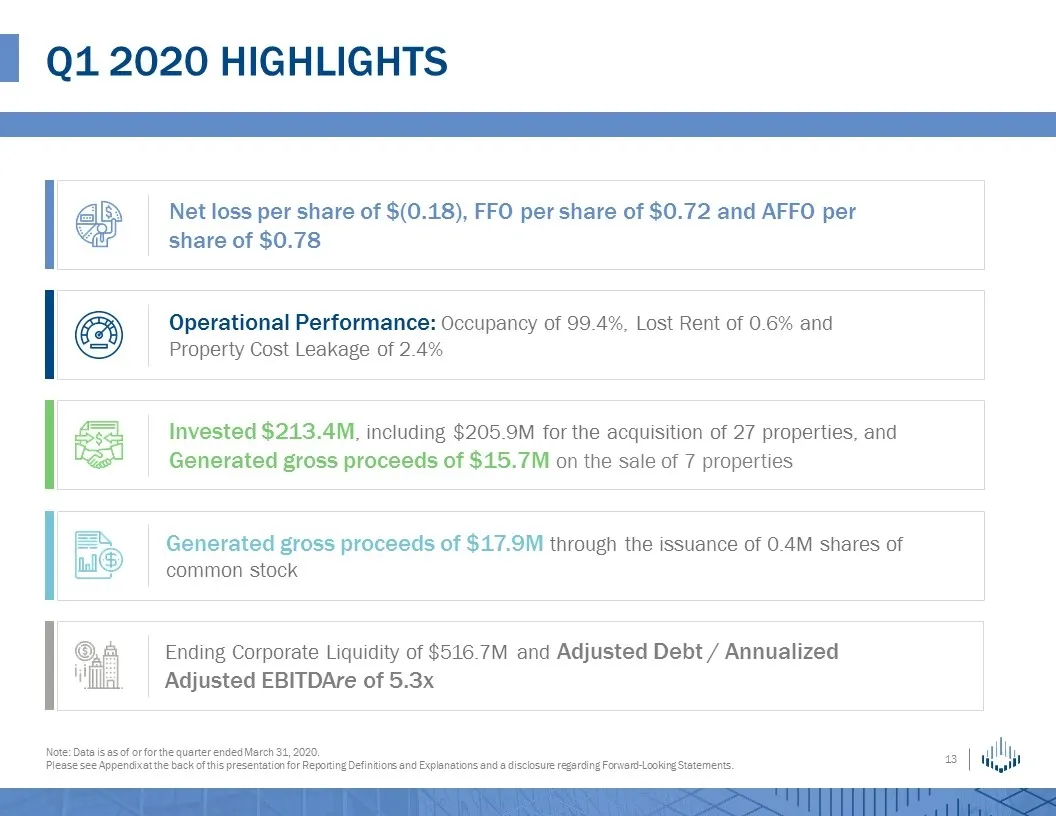
Q1 2020 highlights Note: Data is as of or for the quarter ended March 31, 2020. Please see Appendix at the back of this presentation for Reporting Definitions and Explanations and a disclosure regarding Forward-Looking Statements. Net loss per share of $(0.18), FFO per share of $0.72 and AFFO per sh
Slide 14: Q1 2020 Overview
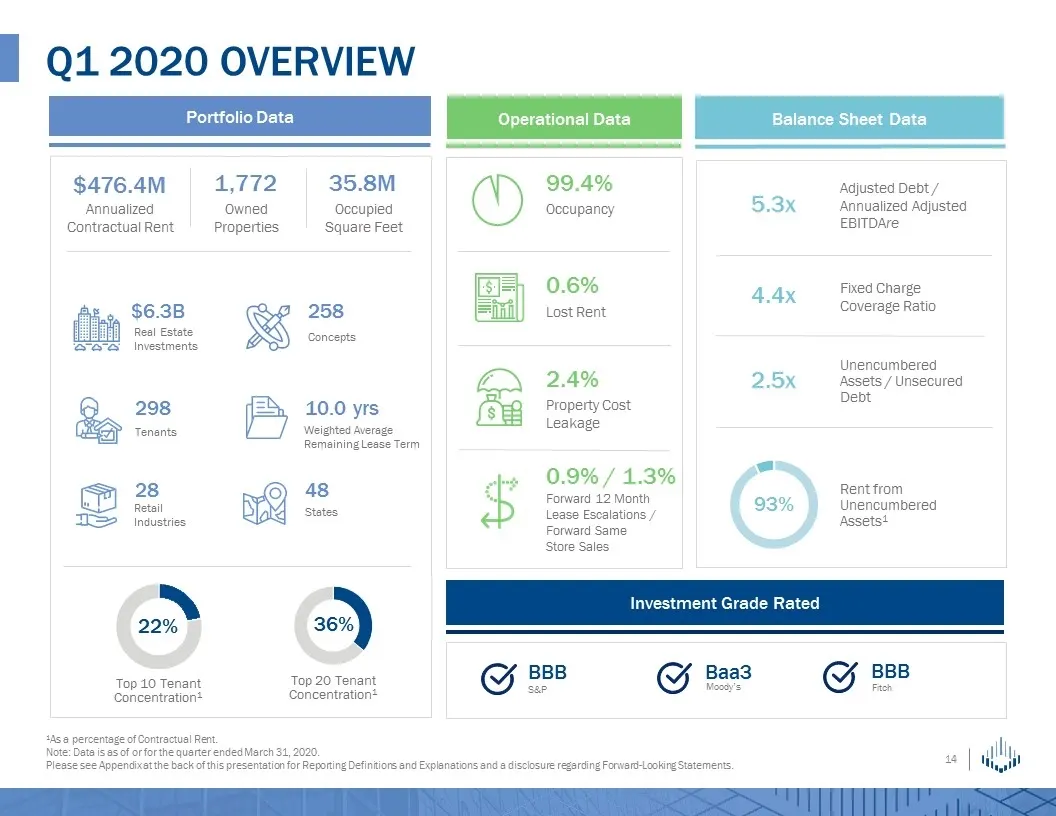
Q1 2020 Overview 1As a percentage of Contractual Rent. Note: Data is as of or for the quarter ended March 31, 2020. Please see Appendix at the back of this presentation for Reporting Definitions and Explanations and a disclosure regarding Forward-Looking Statements. Portfolio Data Operational Data B
Slide 15: Net Investment Activity
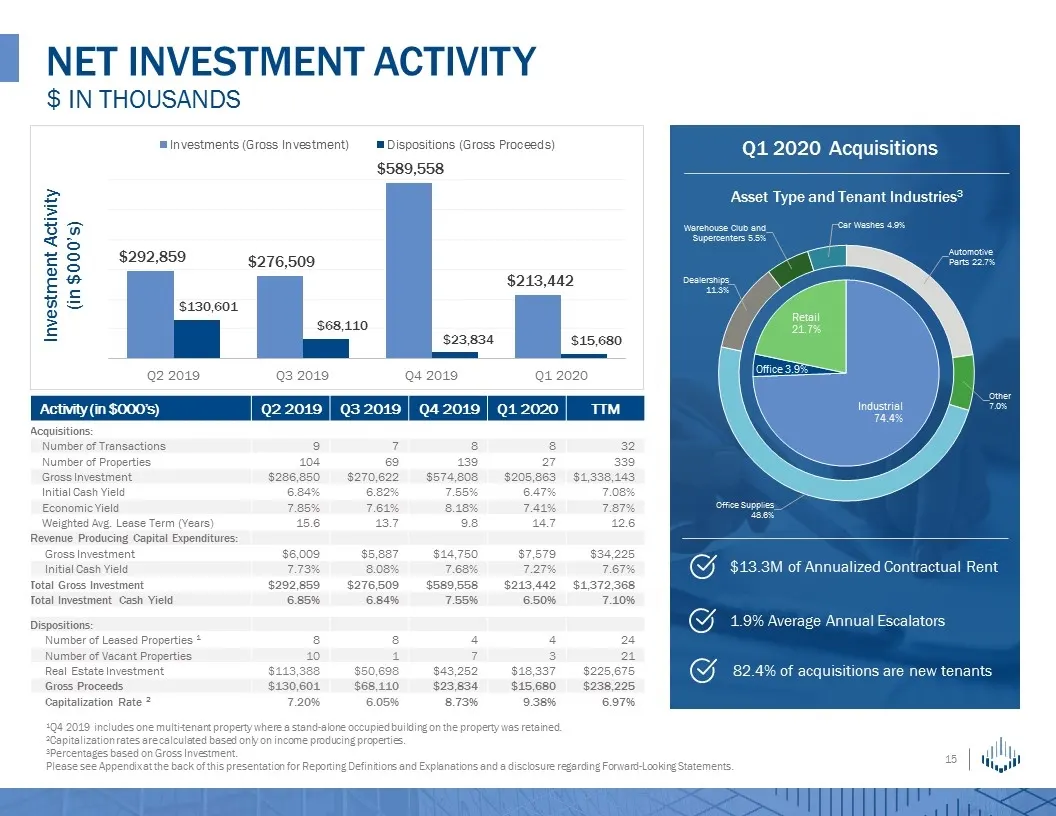
NET INVESTMENT ACTIVITY $ in thousands 1Q4 2019 includes one multi-tenant property where a stand-alone occupied building on the property was retained. 2Capitalization rates are calculated based only on income producing properties. 3Percentages based on Gross Investment. Please see Appendix at the ba
Slide 16: Top Tenancy and Portfolio Mix
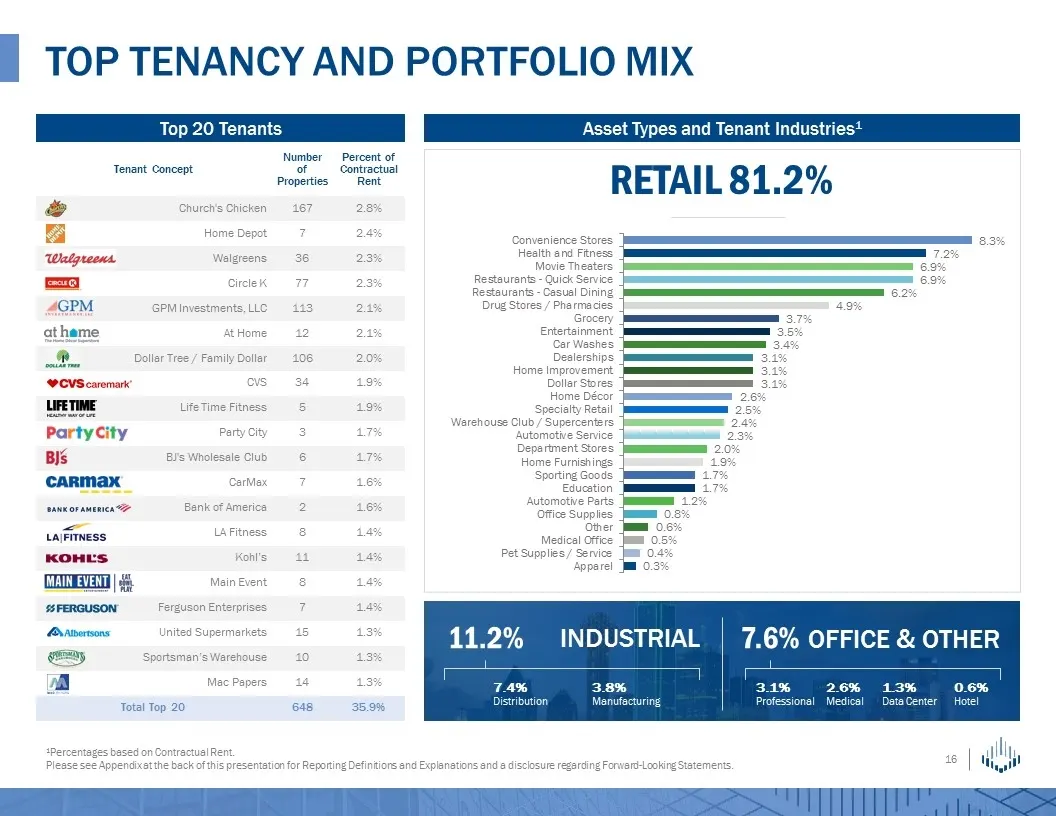
Tenant Concept Number of Properties Percent of Contractual Rent Church's Chicken 167 2.8% Home Depot 7 2.4% Walgreens 36 2.3% Circle K 77 2.3% GPM Investments, LLC 113 2.1% At Home 12 2.1% Dollar Tree / Family Dollar 106 2.0% CVS 34 1.9% Life Time Fitness 5 1.9% Party City 3 1.7% BJ's Wholesale Club
Slide 17: Portfolio Health
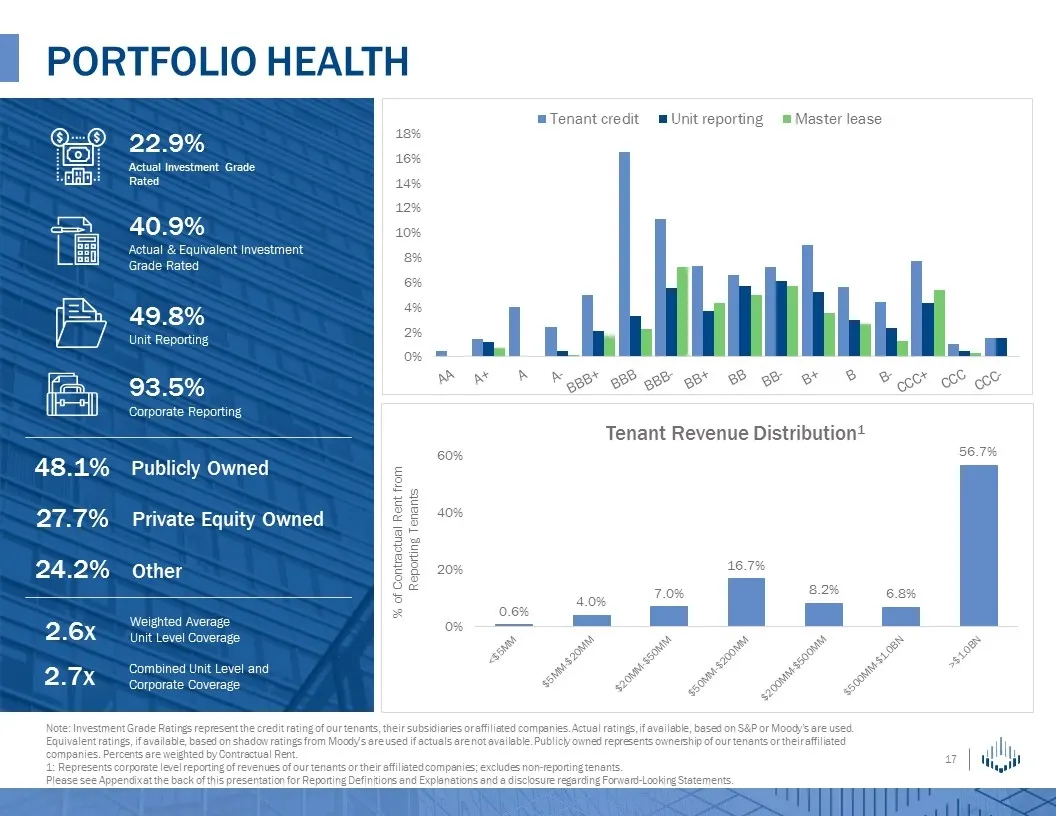
Portfolio Health Note: Investment Grade Ratings represent the credit rating of our tenants, their subsidiaries or affiliated companies. Actual ratings, if available, based on S&P or Moody’s are used. Equivalent ratings, if available, based on shadow ratings from Moody’s are used if actuals are not a
Slide 18: Granular and Liquid Portfolio
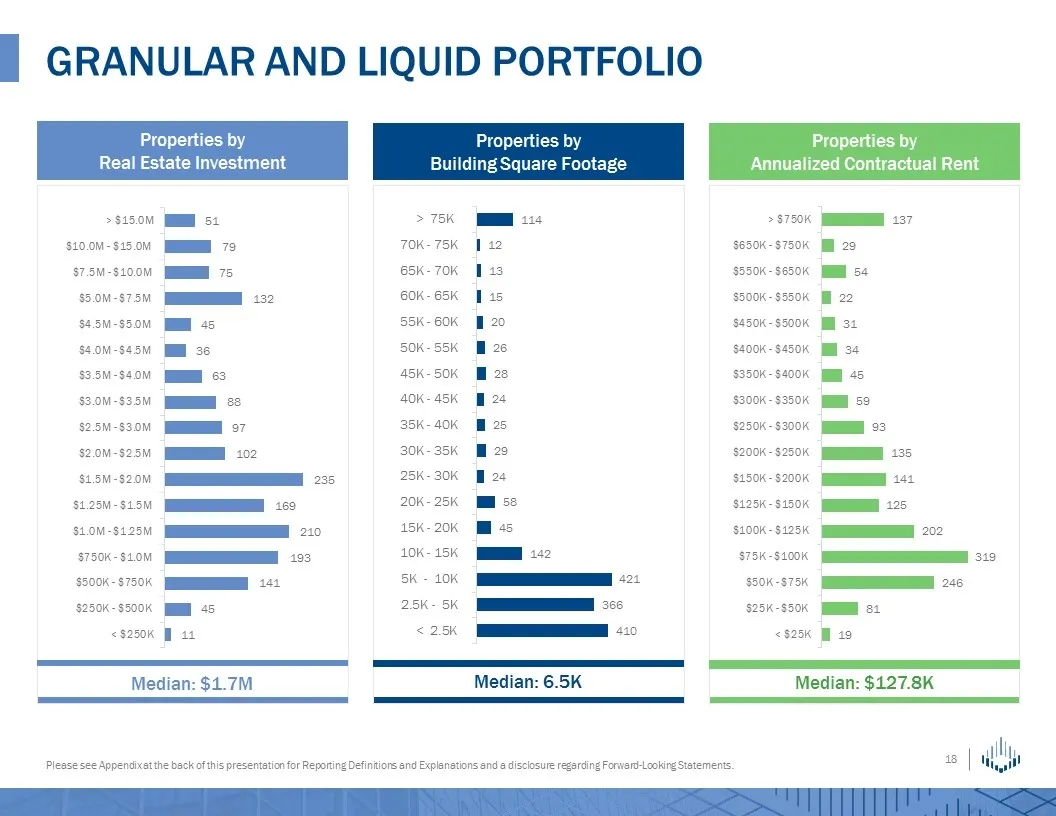
Granular and Liquid Portfolio Please see Appendix at the back of this presentation for Reporting Definitions and Explanations and a disclosure regarding Forward-Looking Statements. Properties by Real Estate Investment Properties by Building Square Footage Properties by Annualized Contractual Rent Me
Slide 19: Fortress Balance Sheet
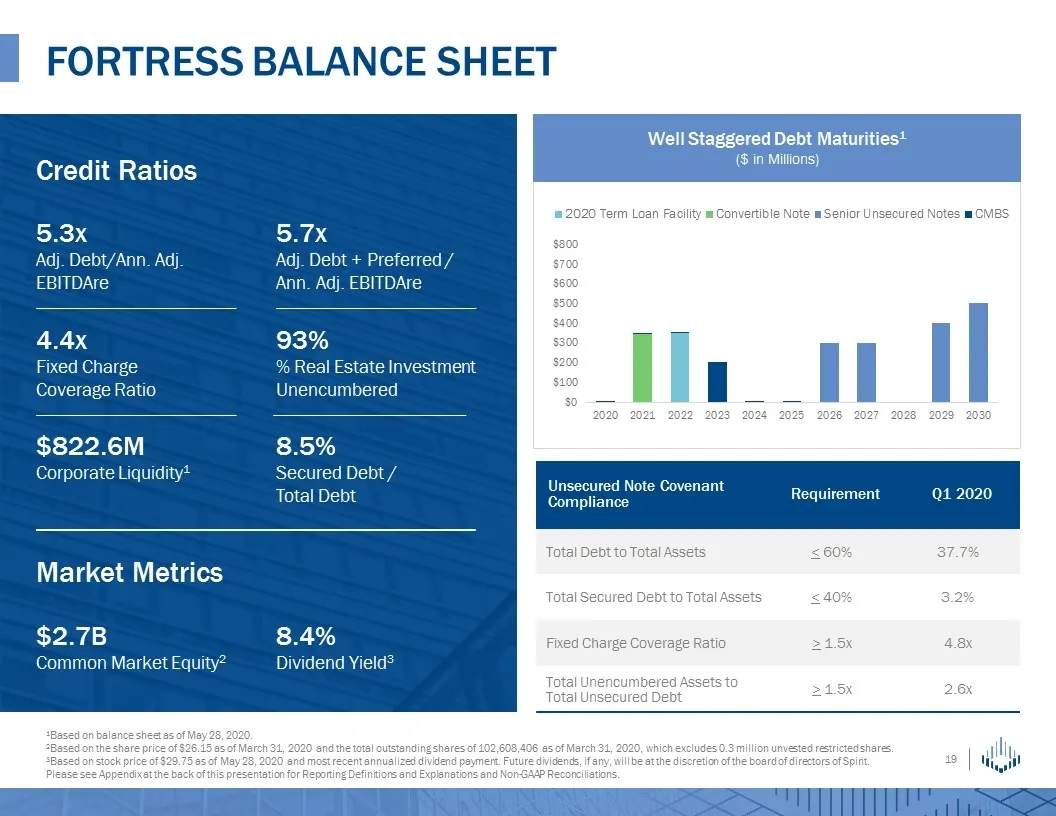
Fortress Balance Sheet 1Based on balance sheet as of May 28, 2020. 2Based on the share price of $26.15 as of March 31, 2020 and the total outstanding shares of 102,608,406 as of March 31, 2020, which excludes 0.3 million unvested restricted shares. 3Based on stock price of $29.75 as of May 28, 2020

Slide 20: Spirit's Platform
Spirit’s Platform
Slide 21: Investment Thesis
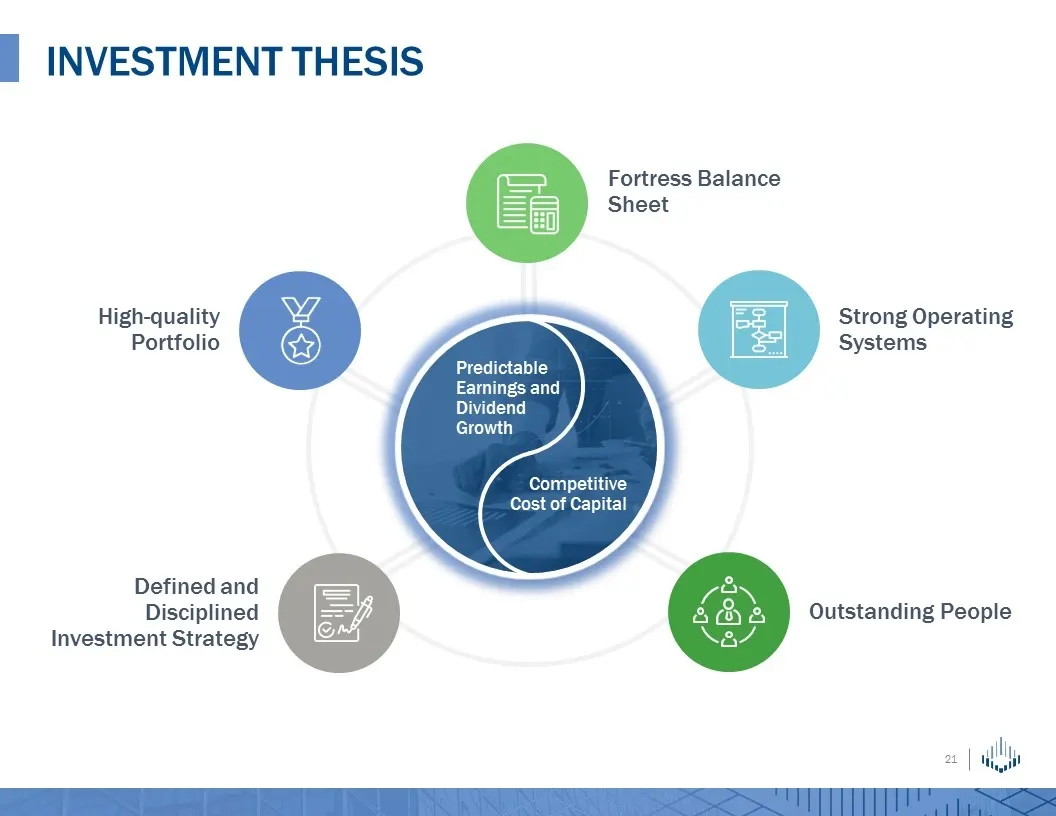
Investment Thesis High-quality Portfolio Defined and Disciplined Investment Strategy Outstanding People Strong Operating Systems Fortress Balance Sheet Competitive Cost of Capital Predictable Earnings and Dividend Growth
Slide 22: Spirit's platform
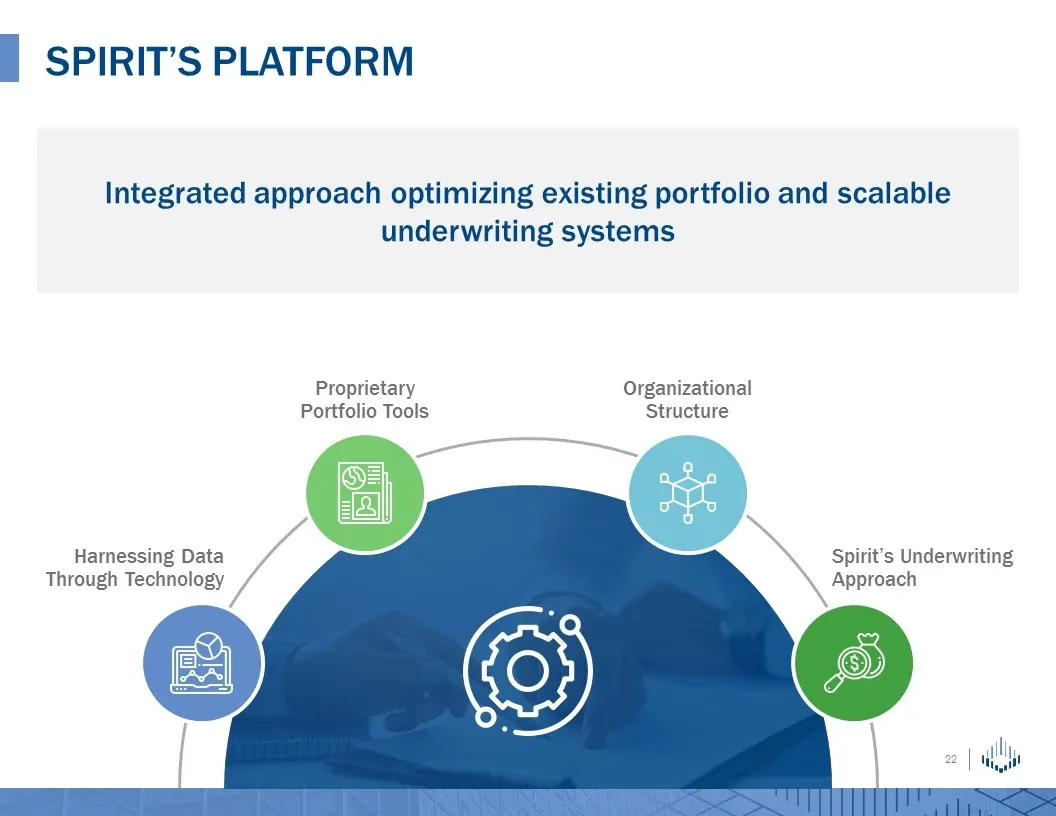
Spirit’s platform Integrated approach optimizing existing portfolio and scalable underwriting systems Harnessing Data Through Technology Proprietary Portfolio Tools Organizational Structure Spirit’s Underwriting Approach
Slide 23: Harnessing data through technology
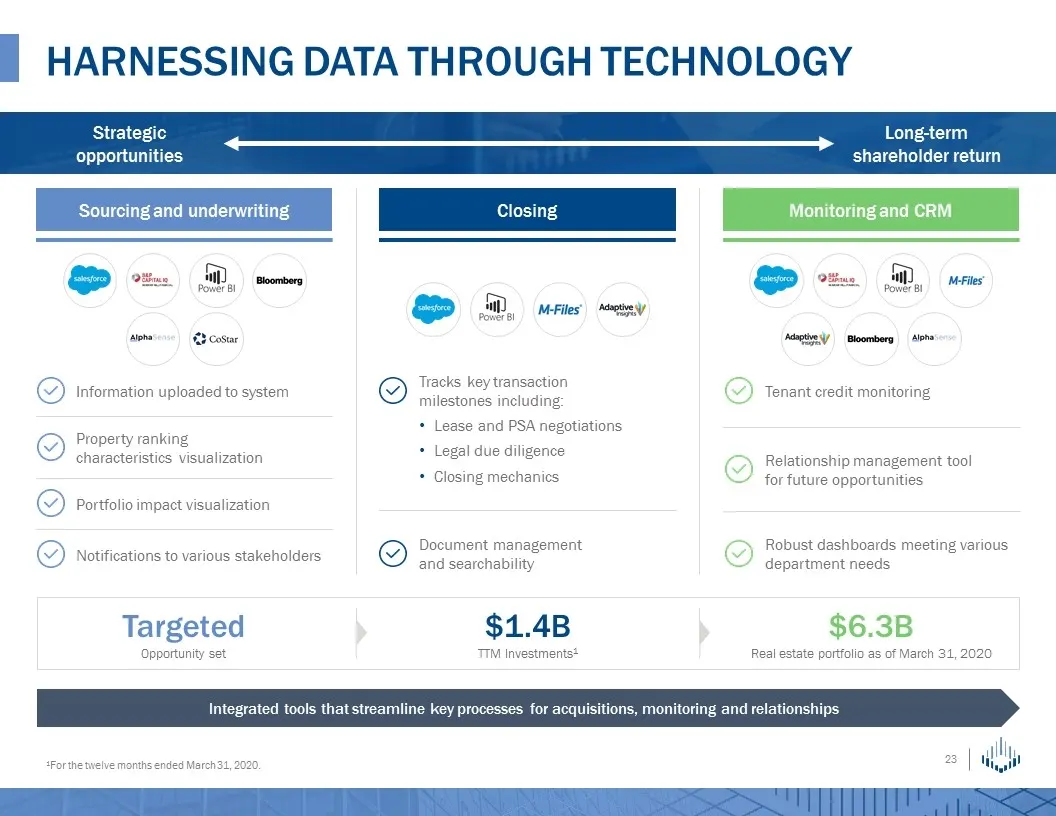
Harnessing data through technology Integrated tools that streamline key processes for acquisitions, monitoring and relationships Strategic opportunities Long-term shareholder return Monitoring and CRM Sourcing and underwriting $1.4B TTM Investments1 $6.3B Real estate portfolio as of March 31, 2020 T
Slide 24: Proprietary portfolio tools
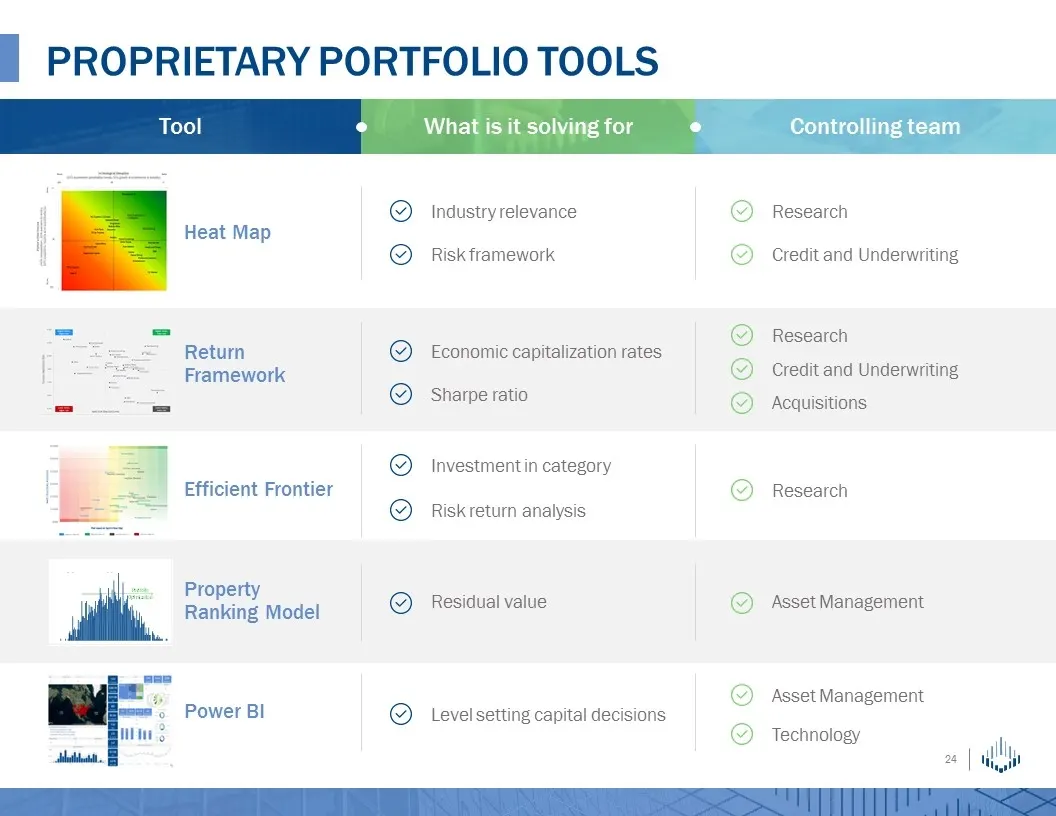
Proprietary portfolio tools Power BI Heat Map Efficient Frontier Return Framework Property Ranking Model Industry relevance Risk framework Economic capitalization rates Sharpe ratio Investment in category Risk return analysis Residual value Level setting capital decisions Research Credit and Underwr
Slide 25: Organizational structure
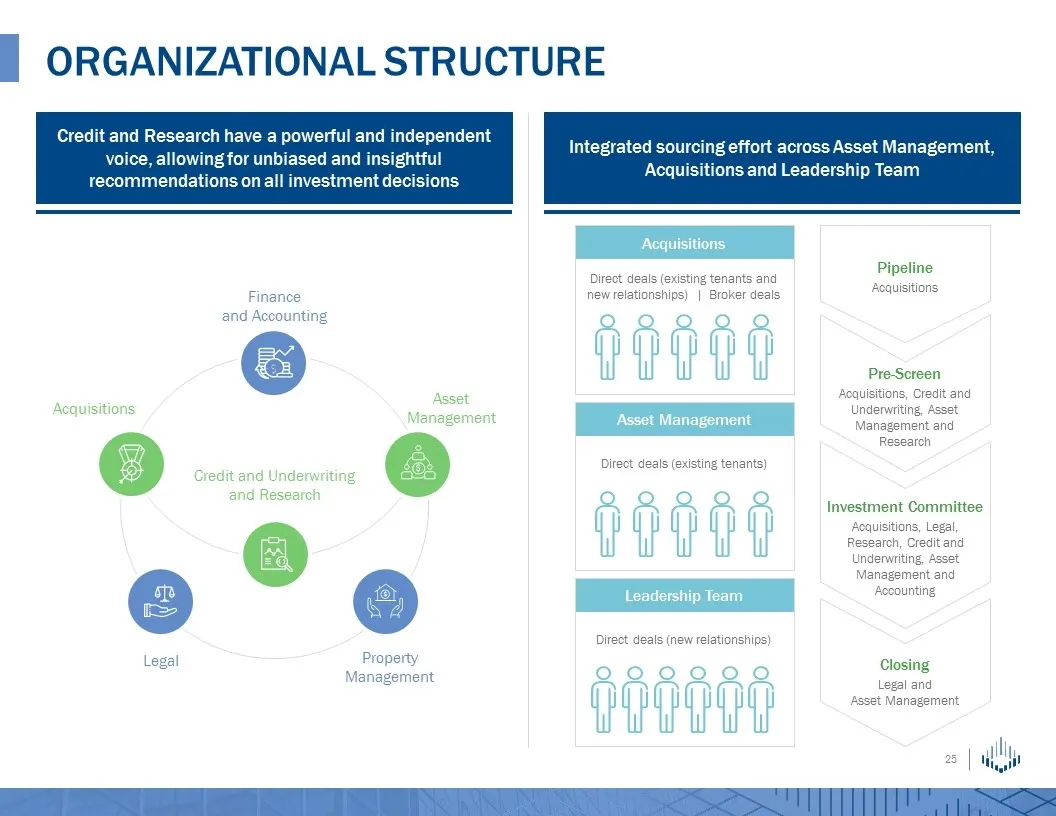
Credit and Research have a powerful and independent voice, allowing for unbiased and insightful recommendations on all investment decisions ORGANIZATIONAL STRUCTURE Legal Property Management Acquisitions Asset Management Credit and Underwriting and Research Finance and Accounting Pipeline Acquisitio
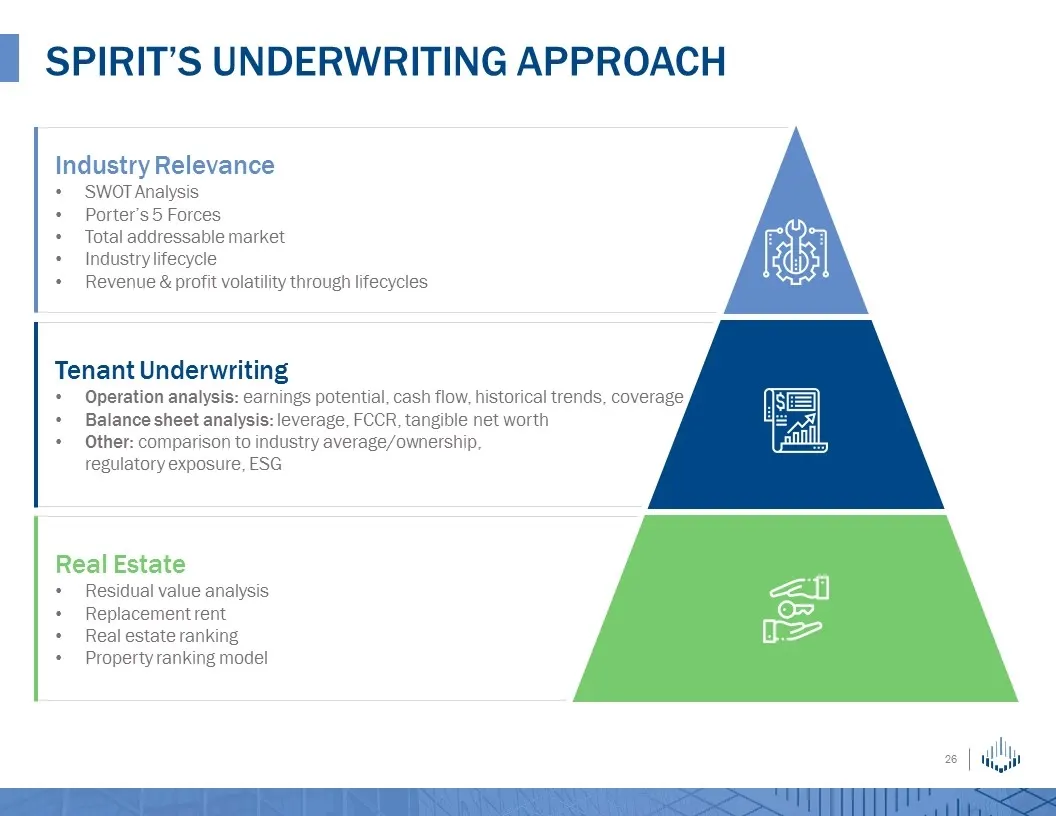
Slide 26: Spirit's underwriting approach
Spirit’s underwriting approach Industry Relevance SWOT Analysis Porter’s 5 Forces Total addressable market Industry lifecycle Revenue & profit volatility through lifecycles Tenant Underwriting Operation analysis: earnings potential, cash flow, historical trends, coverage Balance sheet analysis: leve
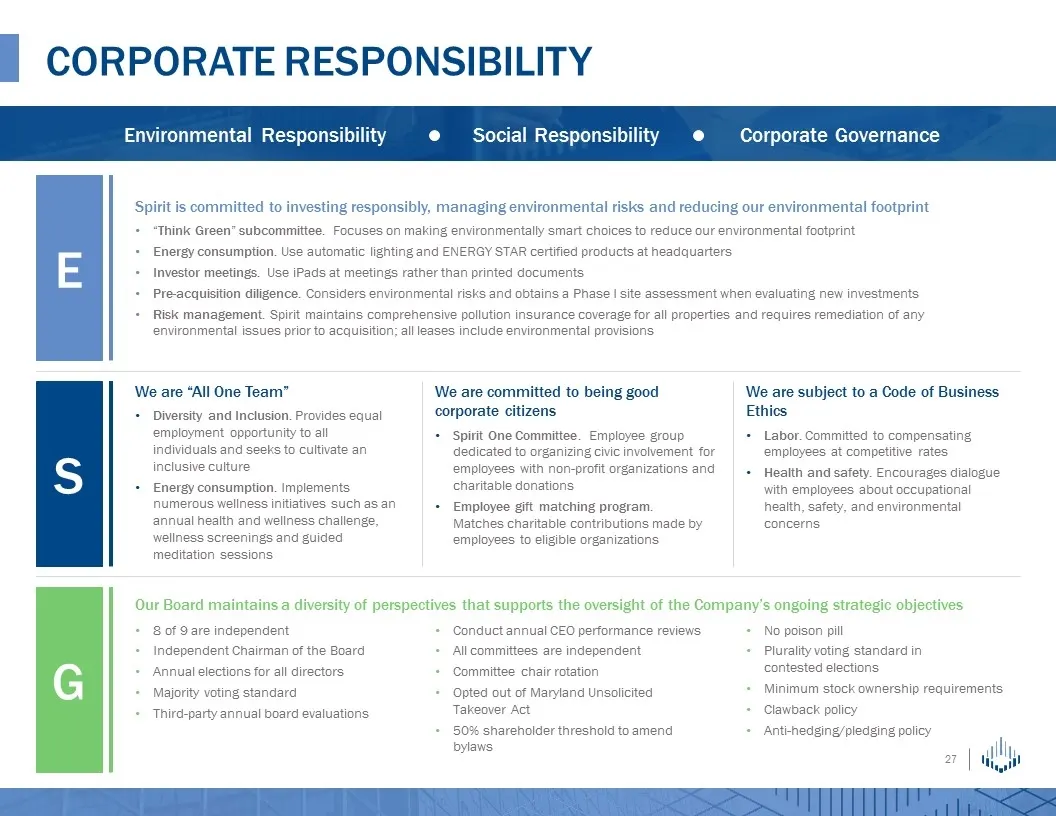
Slide 27: Corporate Responsibility
CORPORATE RESPONSIBILITY Environmental Responsibility Social Responsibility Corporate Governance E Spirit is committed to investing responsibly, managing environmental risks and reducing our environmental footprint “Think Green” subcommittee. Focuses on making environmentally smart choices to reduce

Slide 28: Financial Statements and Non-GAAP Reconciliations
Financial Statements and Non-GAAP Reconciliations
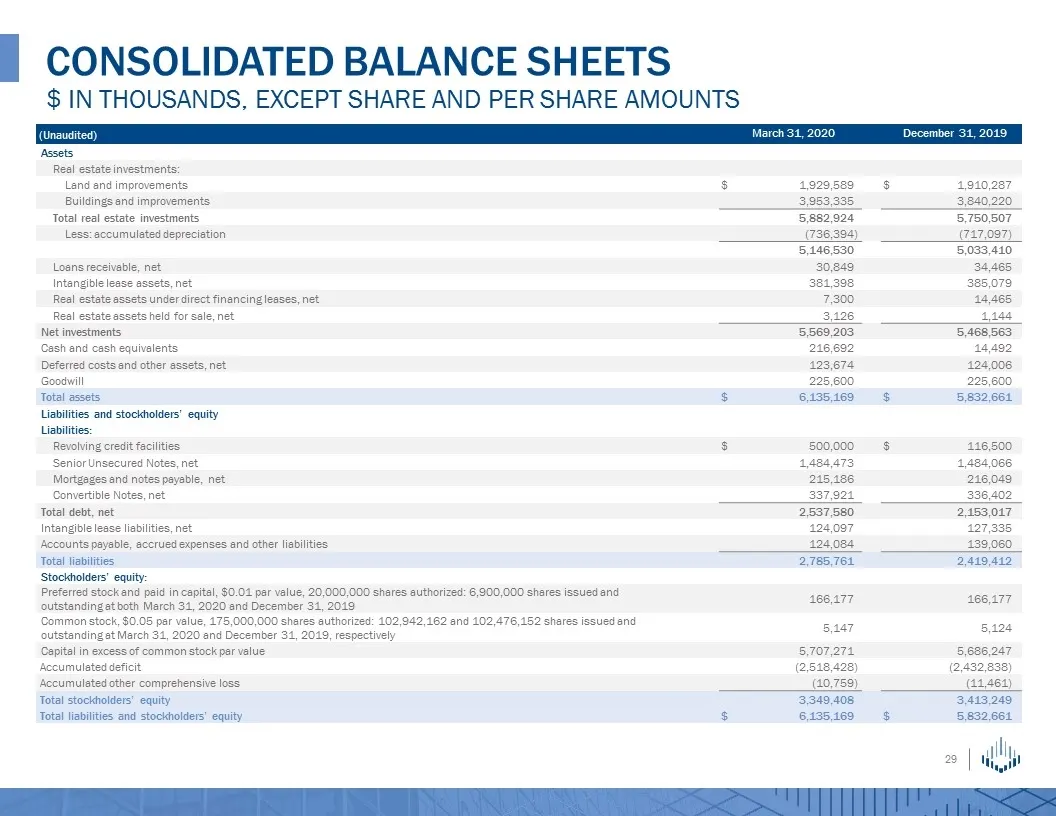
Slide 29: Consolidated Balance Sheets
(Unaudited) March 31, 2020 March 31, 2019 December 31, 2019 December 31, 2018 Assets Real estate investments: Land and improvements $ 1,929,589 $ 1,910,287 Buildings and improvements 3,953,335 3,840,220 Total real estate investments 5,882,924 5,750,507 Less: accumulated depreciation (736,394 ) (717,
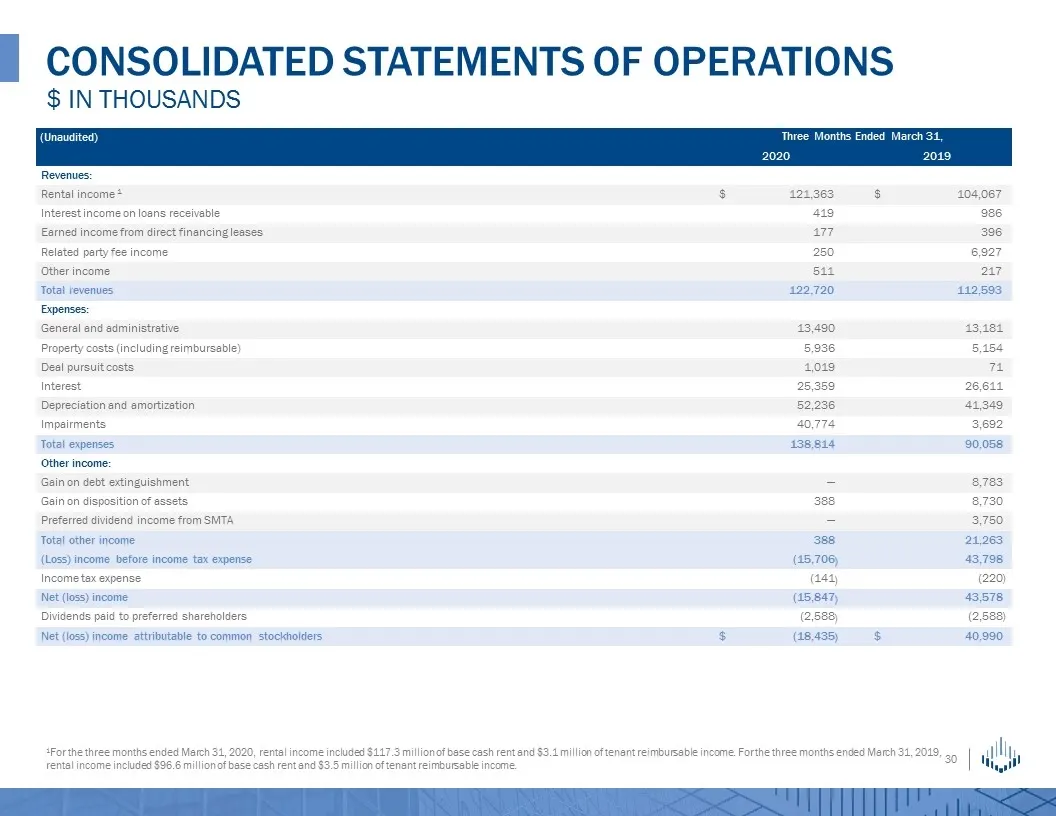
Slide 30: Consolidated Statements of Operations
(Unaudited) Three Months Ended March 31, Three Months Ended March 31, 2020 2019 2019 2018 Revenues: Rental income 1 $ 104,067 121,363 $ 98,236 104,067 Interest income on loans receivable 986 419 294 986 Earned income from direct financing leases 396 177 465 396 Related party fee income 6,927 250 2,2
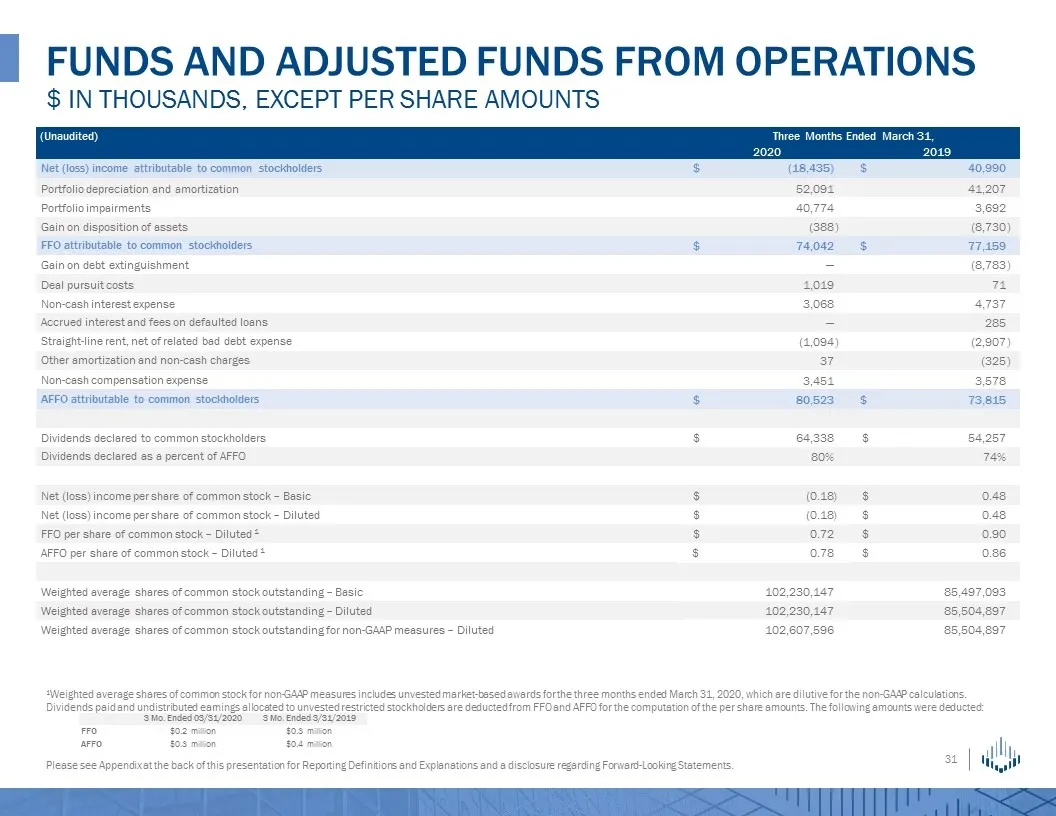
Slide 31: FFO and AFFO reconciliation
1Weighted average shares of common stock for non-GAAP measures includes unvested market-based awards for the three months ended March 31, 2020, which are dilutive for the non-GAAP calculations. Dividends paid and undistributed earnings allocated to unvested restricted stockholders are deducted from
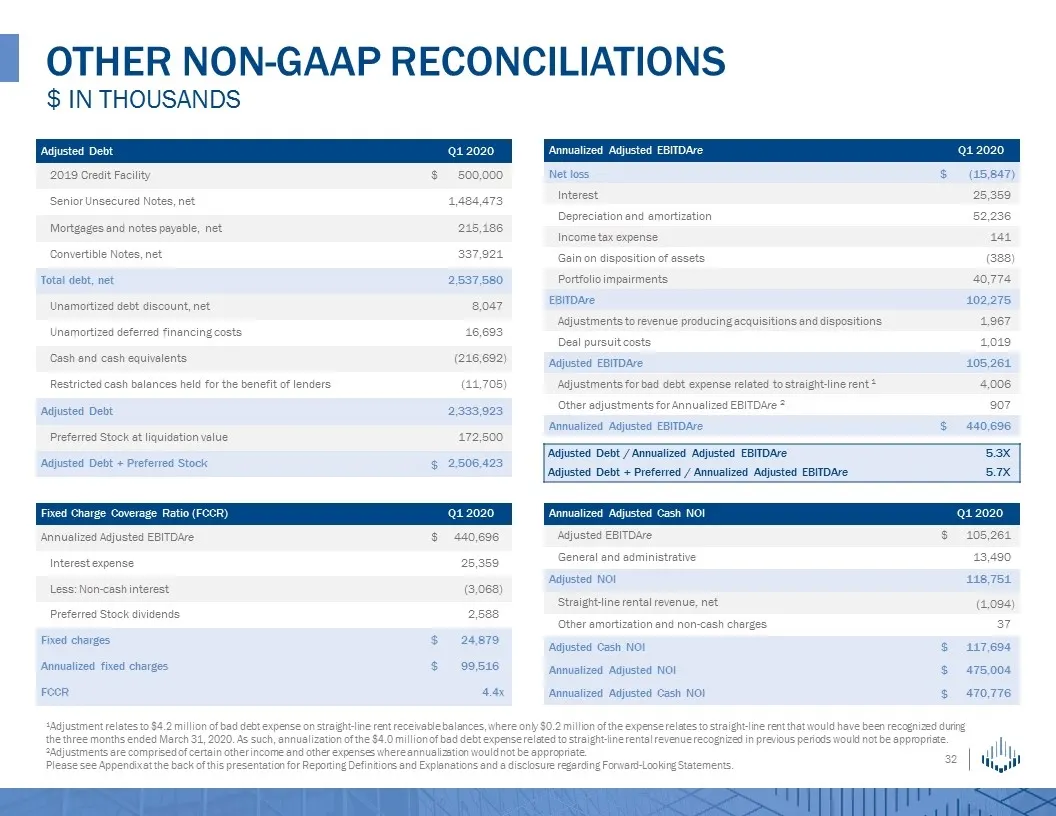
Slide 32: Annualized Adjusted EBITDAre
Annualized Adjusted EBITDAre Q1 2020 Q1 2019 Net loss $ (15,847 ) Interest 25,359 Depreciation and amortization 52,236 Income tax expense 141 Gain on disposition of assets (388 ) Portfolio impairments 40,774 EBITDAre 102,275 Adjustments to revenue producing acquisitions and dispositions 1,967 Deal p
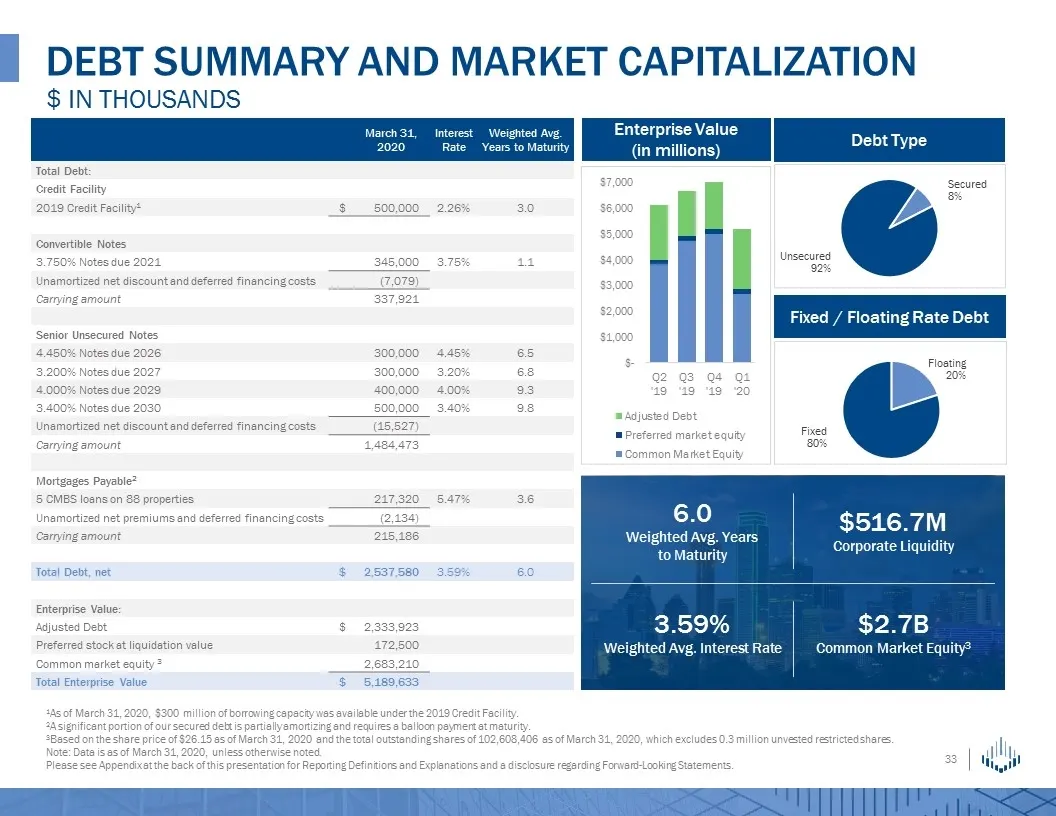
Slide 33: Debt Summary and Market Capitalization
Debt Summary and Market Capitalization $ in thousands 1As of March 31, 2020, $300 million of borrowing capacity was available under the 2019 Credit Facility. 2A significant portion of our secured debt is partially amortizing and requires a balloon payment at maturity. 3Based on the share price of $2
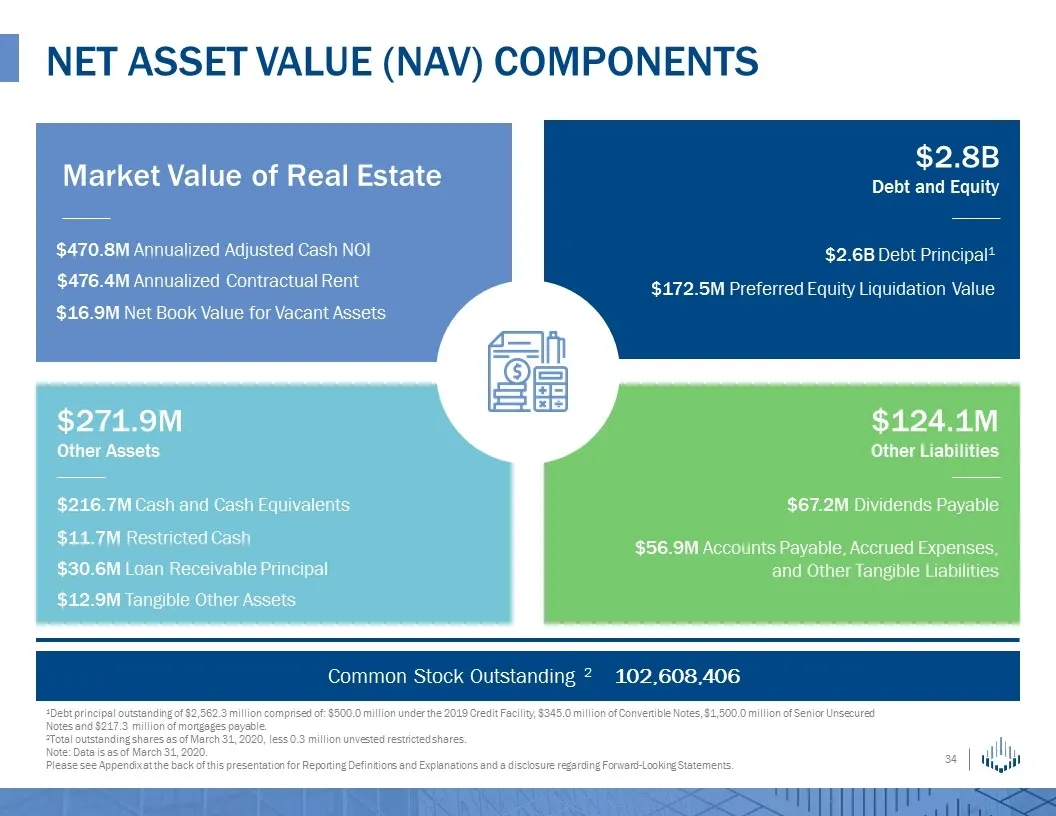
Slide 34: Net Asset Value (NAV) Components
Net Asset Value (NAV) Components 1Debt principal outstanding of $2,562.3 million comprised of: $500.0 million under the 2019 Credit Facility, $345.0 million of Convertible Notes, $1,500.0 million of Senior Unsecured Notes and $217.3 million of mortgages payable. 2Total outstanding shares as of March
Slide 35: Appendix
Appendix
Slide 36: Non-GAAP Definitions and Explanations
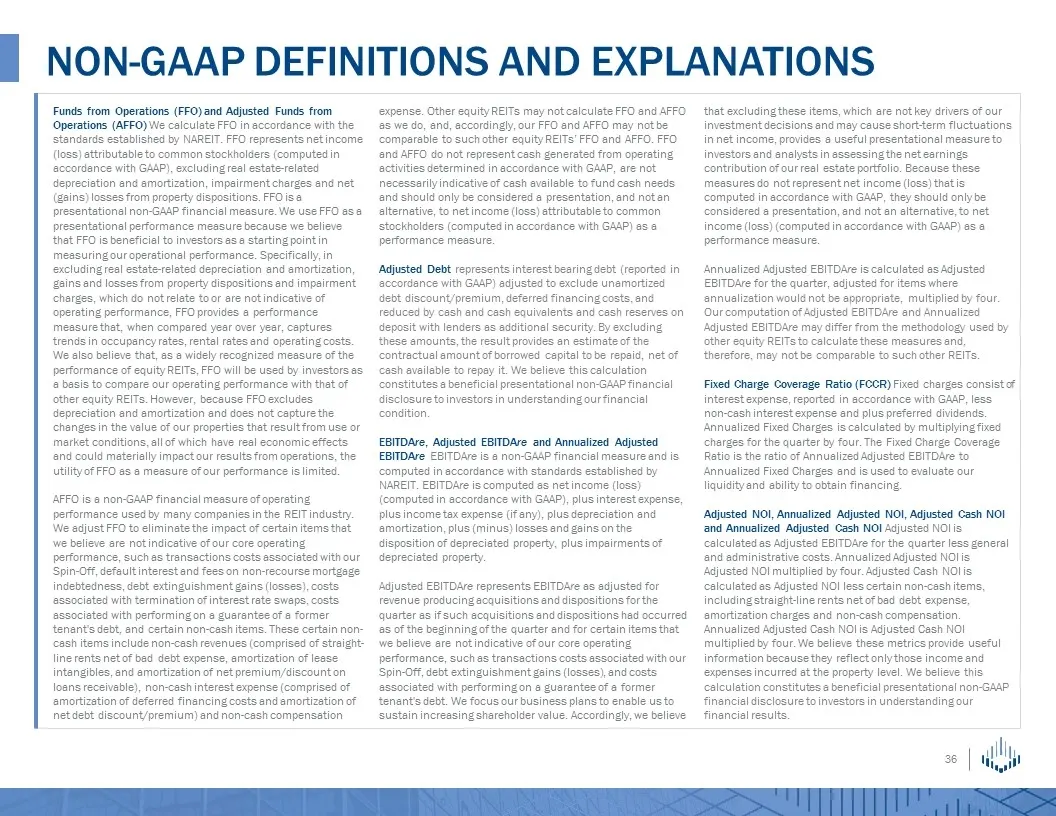
NON-GAAP DEFINITIONS AND EXPLANATIONS Funds from Operations (FFO) and Adjusted Funds from Operations (AFFO) We calculate FFO in accordance with the standards established by NAREIT. FFO represents net income (loss) attributable to common stockholders (computed in accordance with GAAP), excluding real
Slide 37: Other Definitions and Explanations
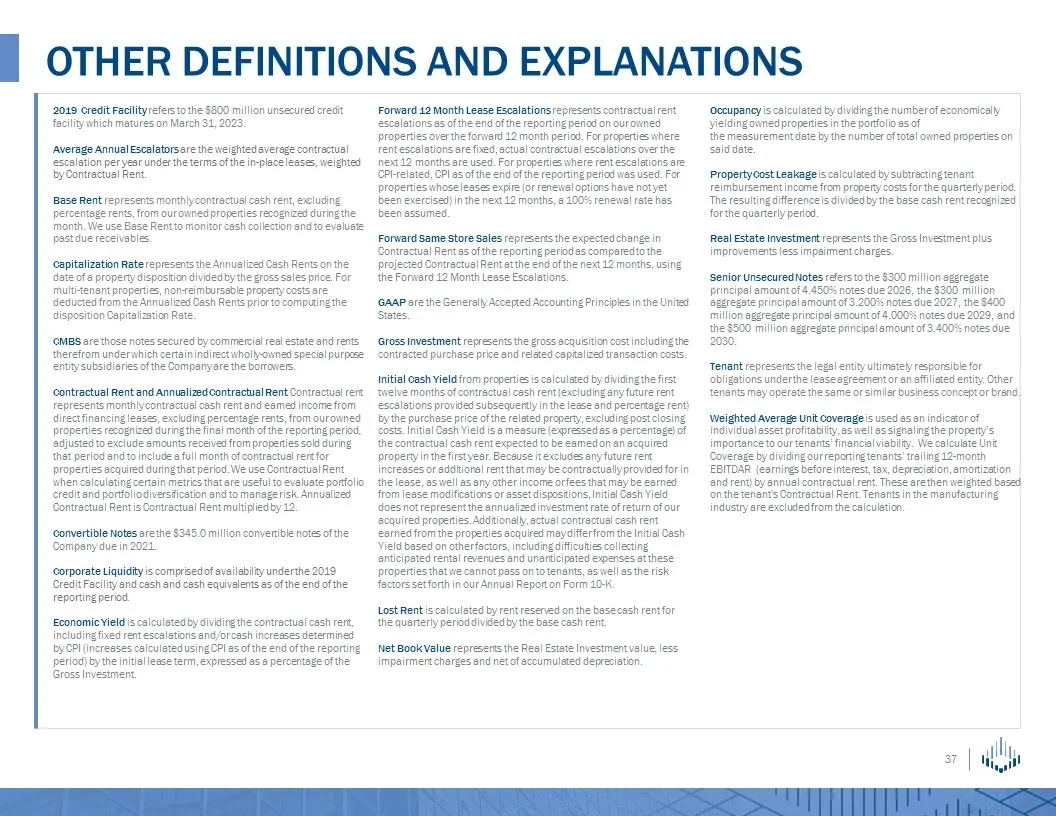
OTHER DEFINITIONS AND EXPLANATIONS 2019 Credit Facility refers to the $800 million unsecured credit facility which matures on March 31, 2023. Average Annual Escalators are the weighted average contractual escalation per year under the terms of the in-place leases, weighted by Contractual Rent. Base
Slide 38: Forward-Looking Statements and Risk Factors
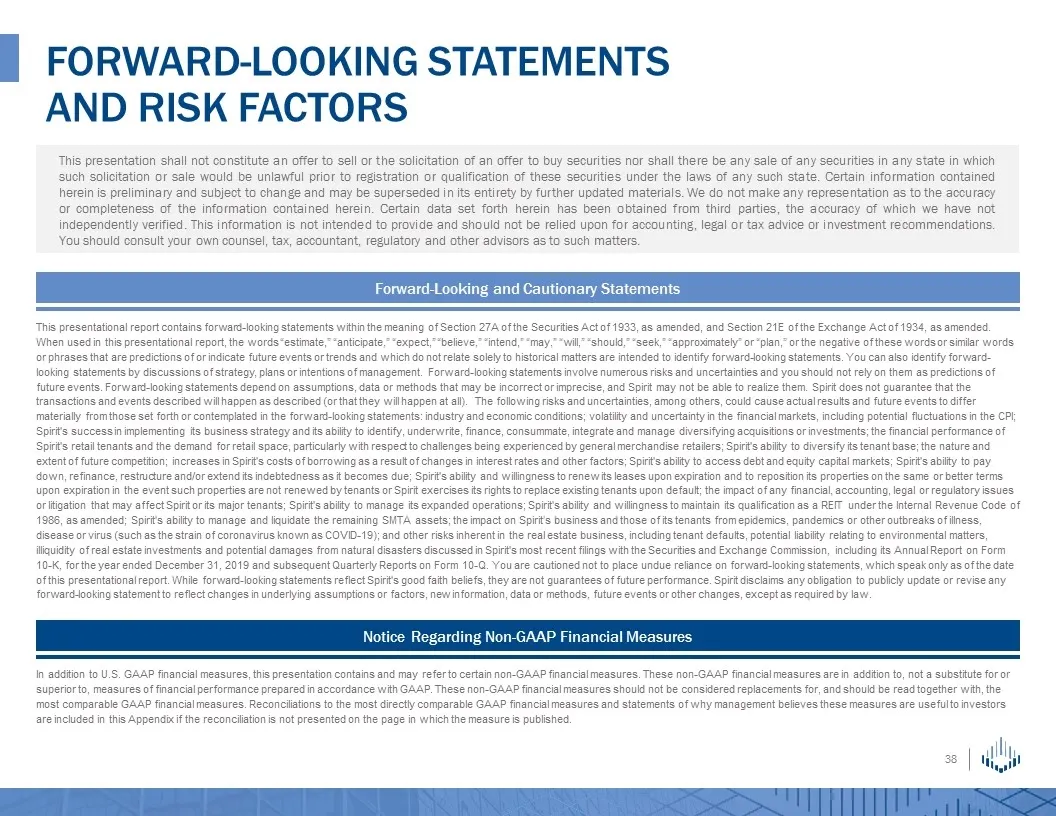
FORWARD-LOOKING STATEMENTS AND RISK FACTORS This presentation shall not constitute an offer to sell or the solicitation of an offer to buy securities nor shall there be any sale of any securities in any state in which such solicitation or sale would be unlawful prior to registration or qualification
Source: SEC EDGAR · 8-K filed Jun 1, 2020
More decks from Spirit Realty Capital Inc
 Q3 2023 Earnings Presentation28 slides · Nov 2, 2023
 Merger or Acquisition (October 2023)20 slides · Oct 30, 2023
 Q2 2023 Earnings Presentation26 slides · Aug 7, 2023
 Q2 2023 Earnings Presentation26 slides · August 2023
 Q1 2023 Earnings Presentation27 slides · May 3, 2023
 Q4 2022 Earnings Presentation31 slides · Feb 28, 2023