INX — Q2 2007 Earnings Presentation
17 slides from INX's earnings presentation, Aug 6, 2007
Slide 1: Second Quarter Ended June 30, 2007 Financial Results
INX Inc. Nasdaq: INXI www.INXI.com August 6, 2007 Second Quarter Ended June 30, 2007 Financial Results
Slide 2: Agenda For Conference Call
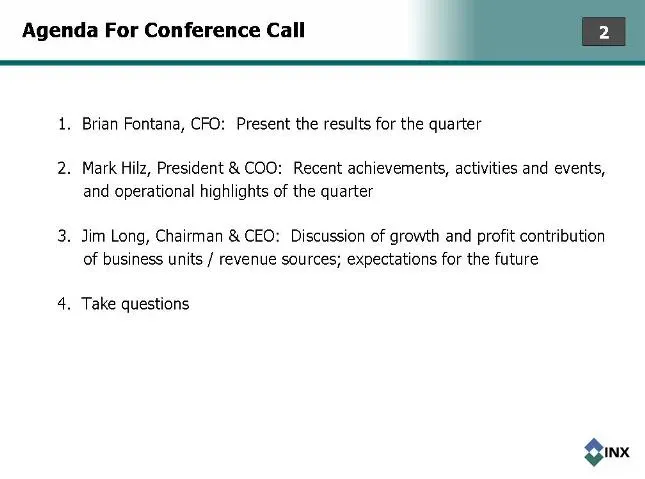
Agenda For Conference Call 1. Brian Fontana, CFO: Present the results for the quarter 2. Mark Hilz, President & COO: Recent achievements, activities and events, and operational highlights of the quarter 3. Jim Long, Chairman & CEO: Discussion of growth and profit contribution of business units / rev
Slide 3: GAAP Reconciliation and Forward-Looking Statements
GAAP Reconciliation and Forward-Looking Statements This presentation contains “forward-looking statements” within the meaning of the Private Securities Litigation Reform Act of 1995, including future operating results expectations. Statements associated with words such as “anticipate,” “believe,” “e
Slide 4: Second Quarter Ended 6/30/2007 Results
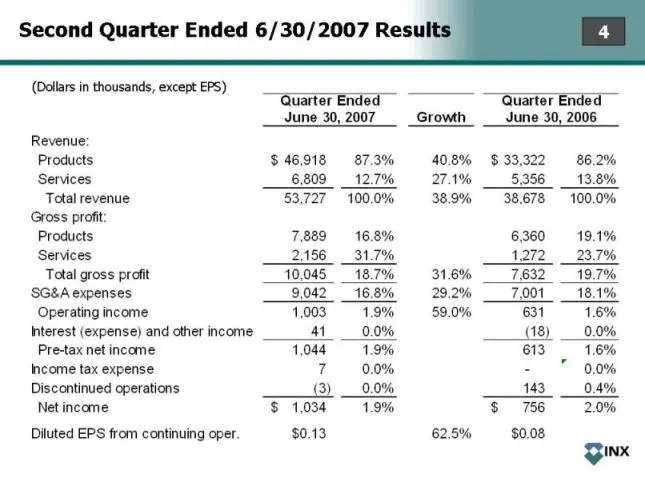
Second Quarter Ended 6/30/2007 Results (Dollars in thousands, except EPS) Quarter Ended Quarter Ended June 30, 2007 Growth June 30, 2006 Revenue: Products $ 46,918 87.3% 40.8% $ 33,322 86.2% Services 6,809 12.7% 27.1% 5,356 13.8% Total revenue 53,727 100.0% 38.9% 38,678 100.0% Gross profit: Products
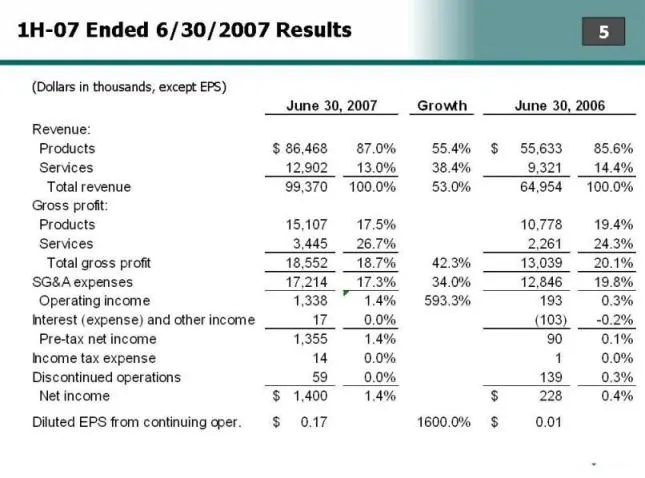
Slide 5: 1H-07 Ended 6/30/2007 Results
1H-07 Ended 6/30/2007 Results (Dollars in thousands, except EPS) 6 Months Ended 6 Months Ended June 30, 2007 Growth June 30, 2006 Revenue: Products $ 86,468 87.0% 55.4% $ 55,633 85.6% Services 12,902 13.0% 38.4% 9,321 14.4% Total revenue 99,370 100.0% 53.0% 64,954 100.0% Gross profit: Products 15,10
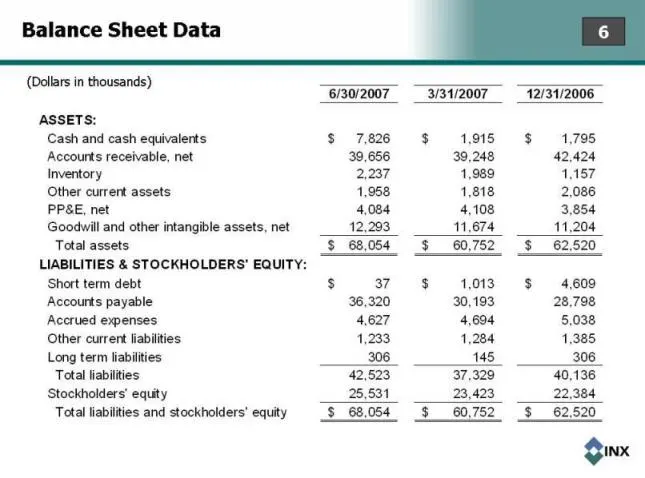
Slide 6: Balance Sheet Data
Balance Sheet Data (Dollars in thousands) 6/30/2007 3/31/2007 12/31/2006 ASSETS: Cash and cash equivalents $ 7,826 $ 1,915 $ 1,795 Accounts receivable, net 39,656 39,248 42,424 Inventory 2,237 1,989 1,157 Other current assets 1,958 1,818 2,086 PP&E, net 4,084 4,108 3,854 Goodwill and other intangibl
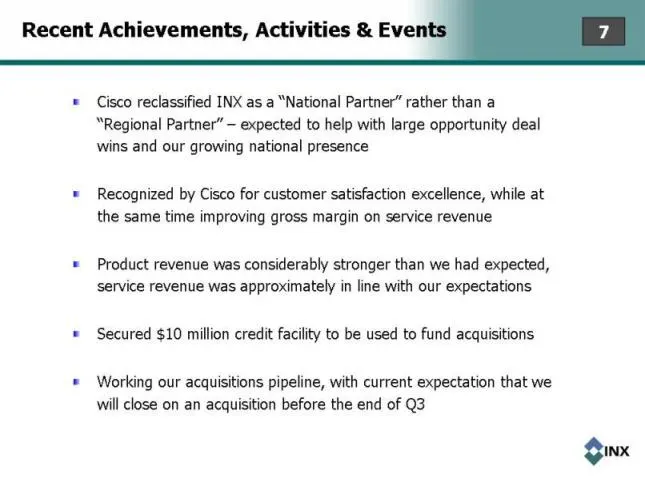
Slide 7: Recent Achievements, Activities & Events
Recent Achievements, Activities & Events Cisco reclassified INX as a “National Partner” rather than a “Regional Partner” – expected to help with large opportunity deal wins and our growing national presence Recognized by Cisco for customer satisfaction excellence, while at the same time improving gr
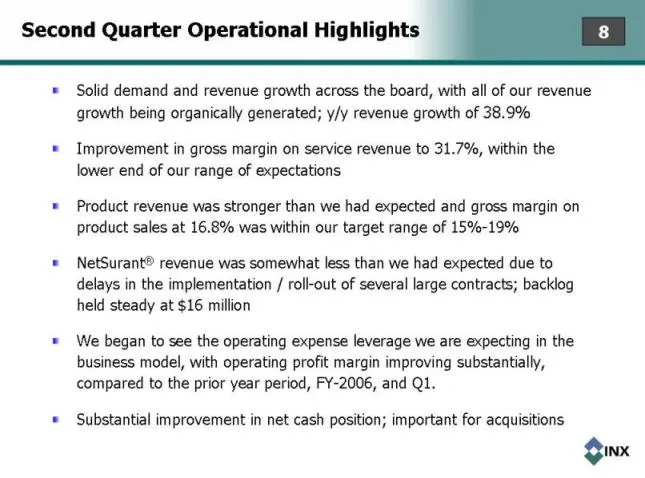
Slide 8: Second Quarter Operational Highlights
Second Quarter Operational Highlights Solid demand and revenue growth across the board, with all of our revenue growth being organically generated; y/y revenue growth of 38.9% Improvement in gross margin on service revenue to 31.7%, within the lower end of our range of expectations Product revenue w
Slide 9: INX and Industry update
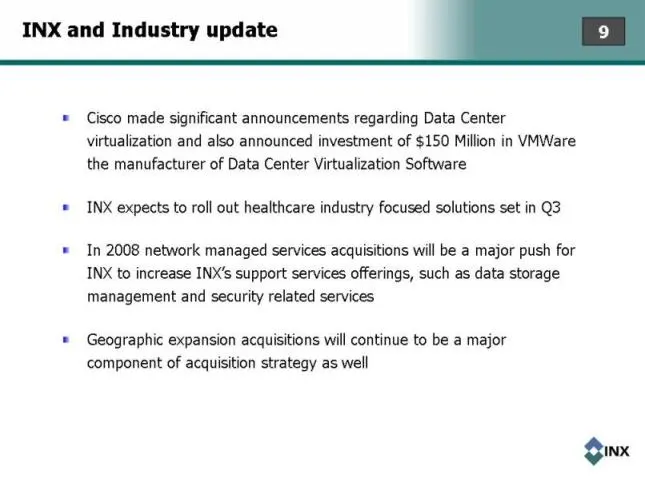
INX and Industry update Cisco made significant announcements regarding Data Center virtualization and also announced investment of $150 Million in VMWare the manufacturer of Data Center Virtualization Software INX expects to roll out healthcare industry focused solutions set in Q3 In 2008 network ma
Slide 10: Sources Of Recent Revenue Growth
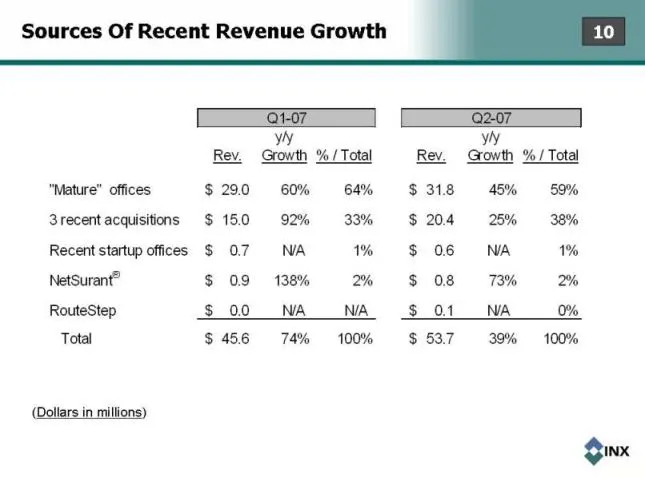
Sources Of Recent Revenue Growth (Dollars in millions) Q1-07 Q2-07 y/y y/y Rev. Growth % / Total Rev. Growth % / Total "Mature" offices $ 29.0 60% 64% $ 31.8 45% 59% 3 recent acquisitions $ 15.0 92% 33% $ 20.4 25% 38% Recent startup offices $ 0.7 N/A 1% $ 0.6 N/A 1% NetSurant® $ 0.9 138% 2% $ 0.8 73
Slide 11: Business Component Profitability
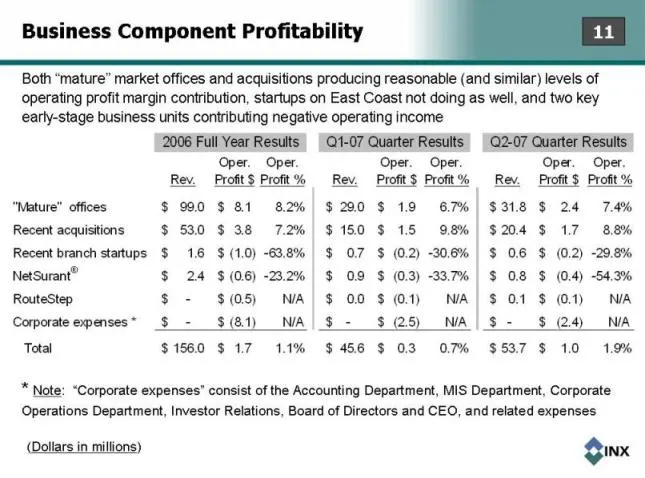
Business Component Profitability * Note: “Corporate expenses” consist of the Accounting Department, MIS Department, Corporate Operations Department, Investor Relations, Board of Directors and CEO, and related expenses (Dollars in millions) Both “mature” market offices and acquisitions producing reas
Slide 12: Outlook
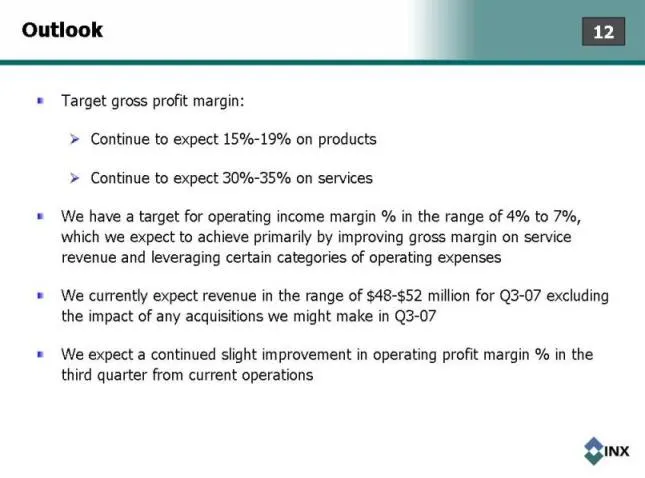
Outlook Target gross profit margin: Continue to expect 15%-19% on products Continue to expect 30%-35% on services We have a target for operating income margin % in the range of 4% to 7%, which we expect to achieve primarily by improving gross margin on service revenue and leveraging certain categori
Slide 13: Goal Of Improving Operating Profit Margin %
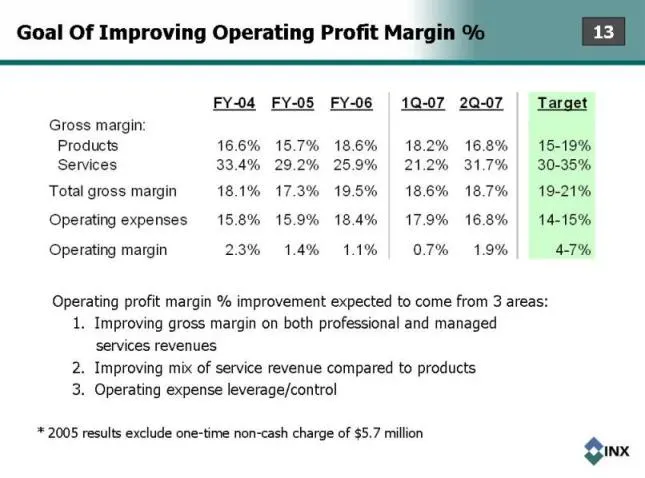
Goal Of Improving Operating Profit Margin % * 2005 results exclude one-time non-cash charge of $5.7 million Operating profit margin % improvement expected to come from 3 areas: 1. Improving gross margin on both professional and managed services revenues 2. Improving mix of service revenue compared t
Slide 14: The Path to Target Operating Profit Margin %
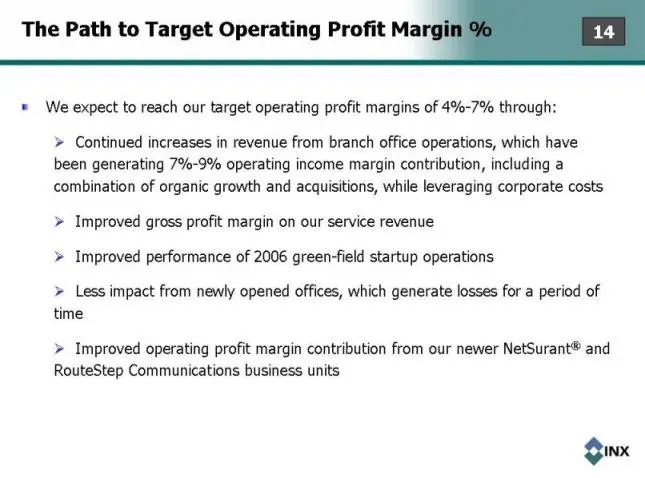
The Path to Target Operating Profit Margin % We expect to reach our target operating profit margins of 4%-7% through: Continued increases in revenue from branch office operations, which have been generating 7%-9% operating income margin contribution, including a combination of organic growth and acq
Slide 15: What We Must Do To Reach Target Operating Profit Margin %
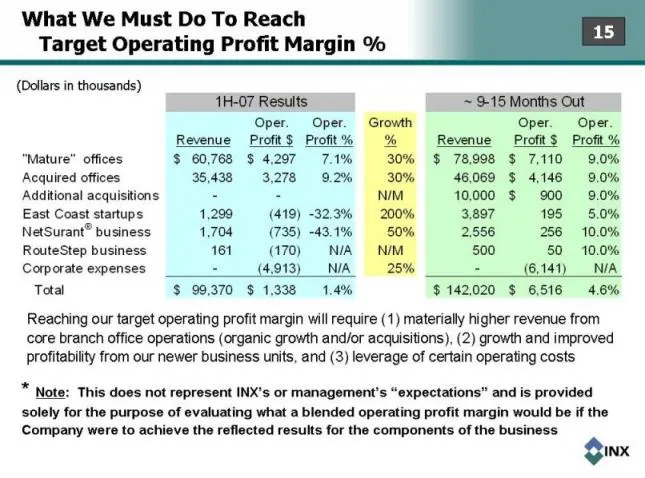
What We Must Do To Reach Target Operating Profit Margin % * Note: This does not represent INX’s or management’s “expectations” and is provided solely for the purpose of evaluating what a blended operating profit margin would be if the Company were to achieve the reflected results for the components
Slide 16: Operating Expenses / Sales %
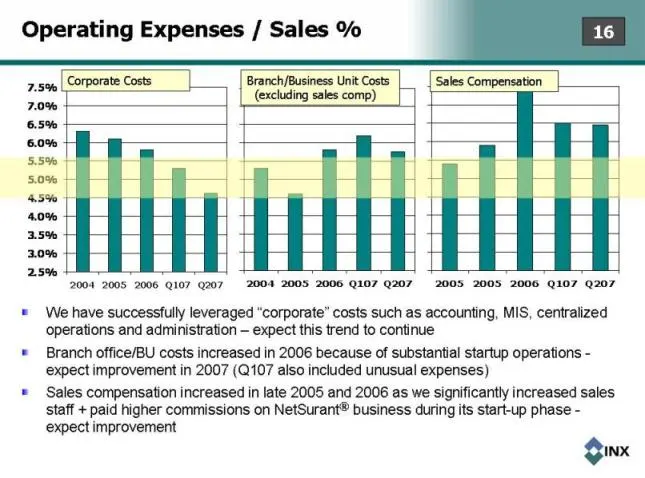
Operating Expenses / Sales % Sales Compensation Corporate Costs Branch/Business Unit Costs (excluding sales comp) We have successfully leveraged “corporate” costs such as accounting, MIS, centralized operations and administration – expect this trend to continue Branch office/BU costs increased in 20
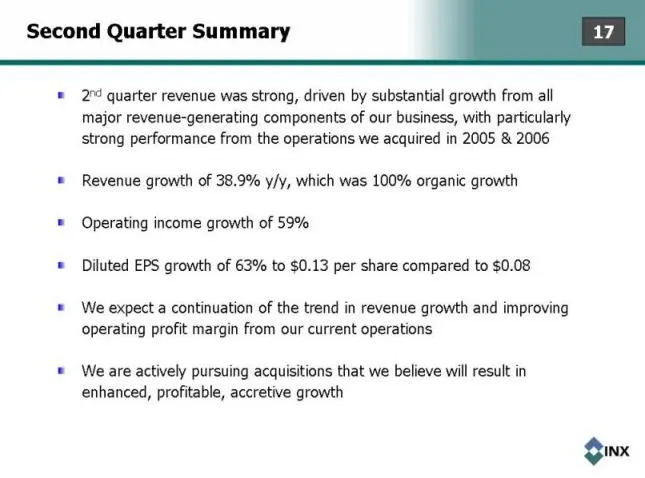
Slide 17: Second Quarter Summary
Second Quarter Summary 2nd quarter revenue was strong, driven by substantial growth from all major revenue-generating components of our business, with particularly strong performance from the operations we acquired in 2005 & 2006 Revenue growth of 38.9% y/y, which was 100% organic growth Operating i
Source: SEC EDGAR · 8-K filed Aug 6, 2007
More decks from INX Inc
 Merger or Acquisition (November 2011)10 slides · Nov 1, 2011
 Rodman & Renshaw Global Investment Conference 201120 slides · Sep 13, 2011
 Shareholder Meeting (July 2011)15 slides · Jul 19, 2011
 Q1 2011 Earnings Presentation15 slides · Jul 13, 2011
 FY2010 Earnings Presentation28 slides · Jun 6, 2011
 Corporate Update (November 2010)24 slides · Nov 10, 2010