Western Asset Mortgage Capital
Western Asset Mortgage Capital — Q1 2020 Earnings Presentation
23 slides from Western Asset Mortgage Capital's earnings presentation, May 7, 2020
Slide 1: First Quarter 2020 Investor Presentation
First Quarter 2020 Investor Presentation May 6, 2020
Slide 2: Safe Harbor Statement
Safe Harbor Statement We make forward-looking statements in this presentation that are subject to risks and uncertainties, many of which are difficult to predict and are generally beyond the Company's control. In particular, it is difficult to fully assess the impact of COVID-19 at this time due to,
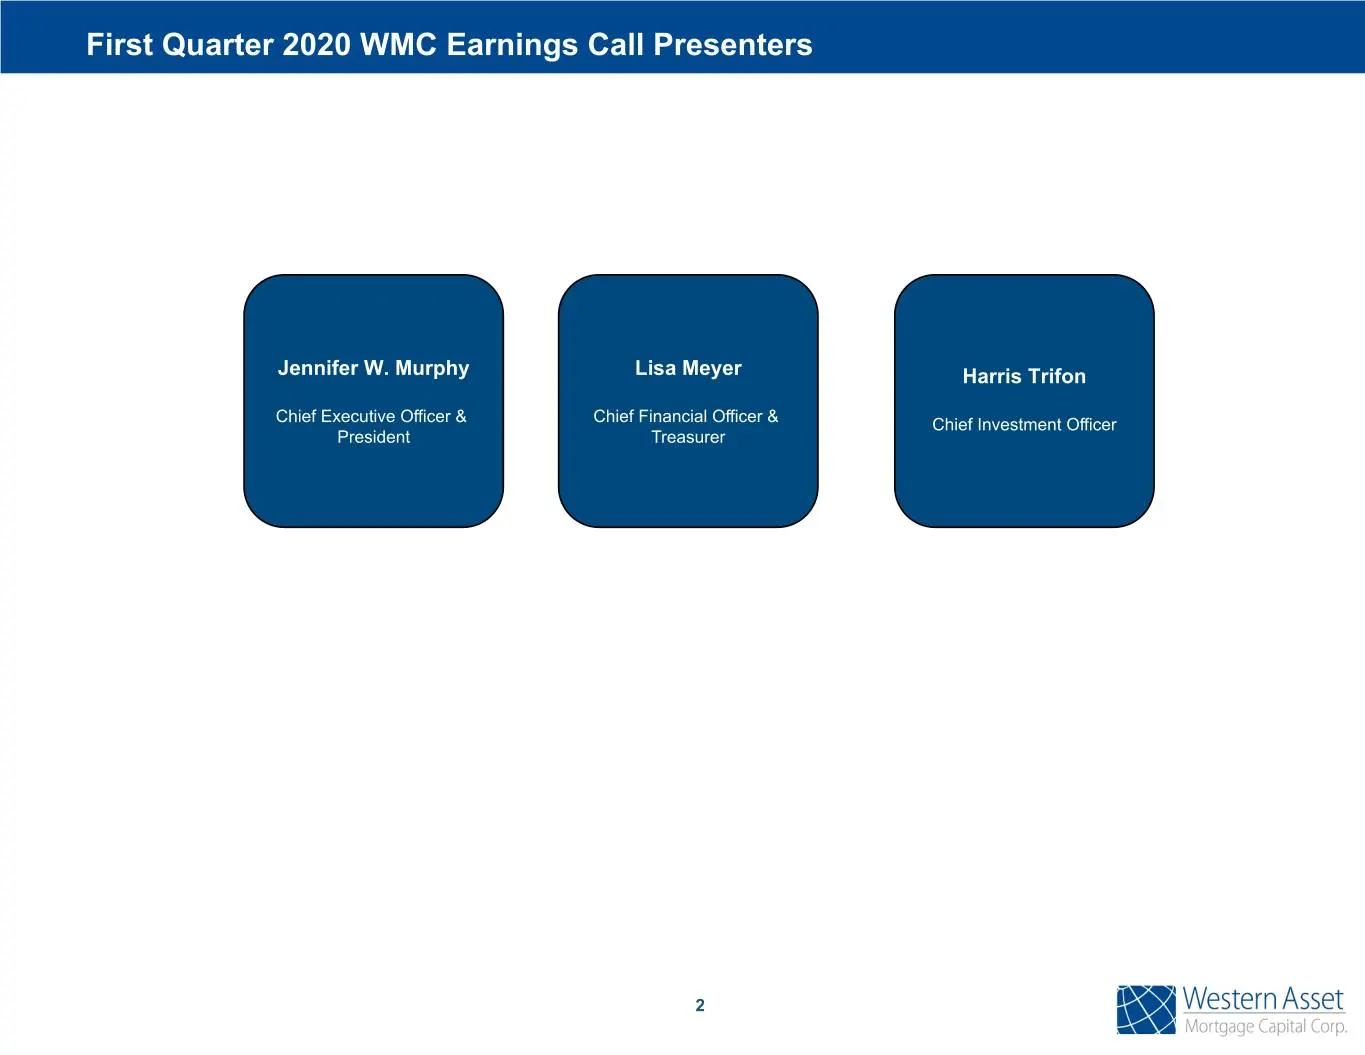
Slide 3: First Quarter 2020 WMC Earnings Call Presenters
First Quarter 2020 WMC Earnings Call Presenters Jennifer W. Murphy Lisa Meyer Harris Trifon Chief Executive Officer & Chief Financial Officer & Chief Investment Officer President Treasurer 2
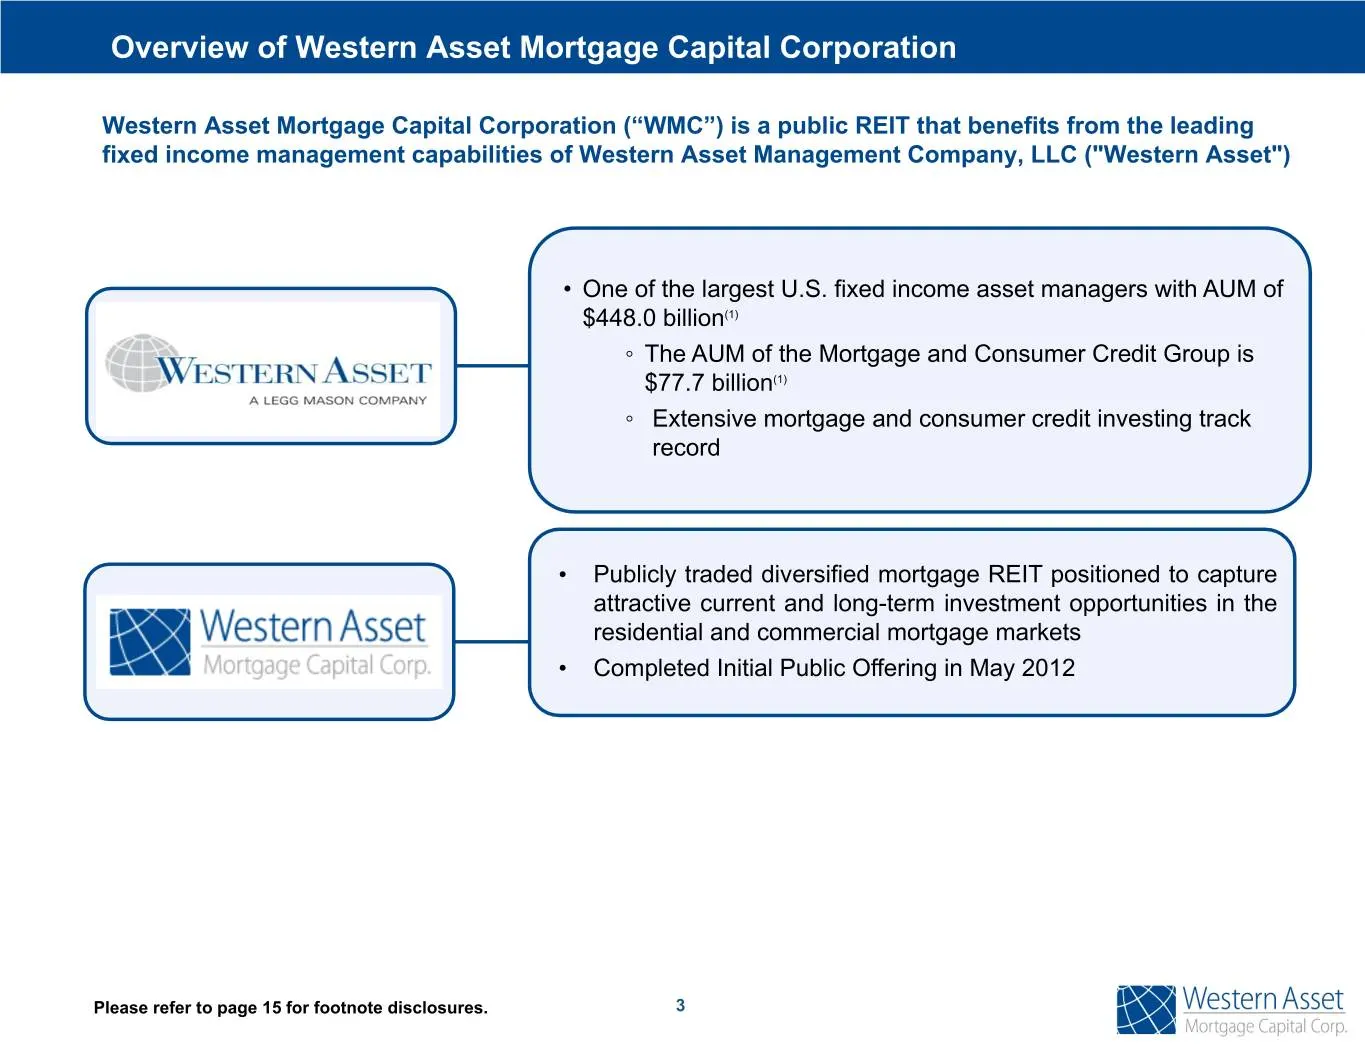
Slide 4: Overview of Western Asset Mortgage Capital Corporation
Overview of Western Asset Mortgage Capital Corporation Western Asset Mortgage Capital Corporation (“WMC”) is a public REIT that benefits from the leading fixed income management capabilities of Western Asset Management Company, LLC ("Western Asset") • One of the largest U.S. fixed income asset manag
Slide 5: First Quarter Financial Update
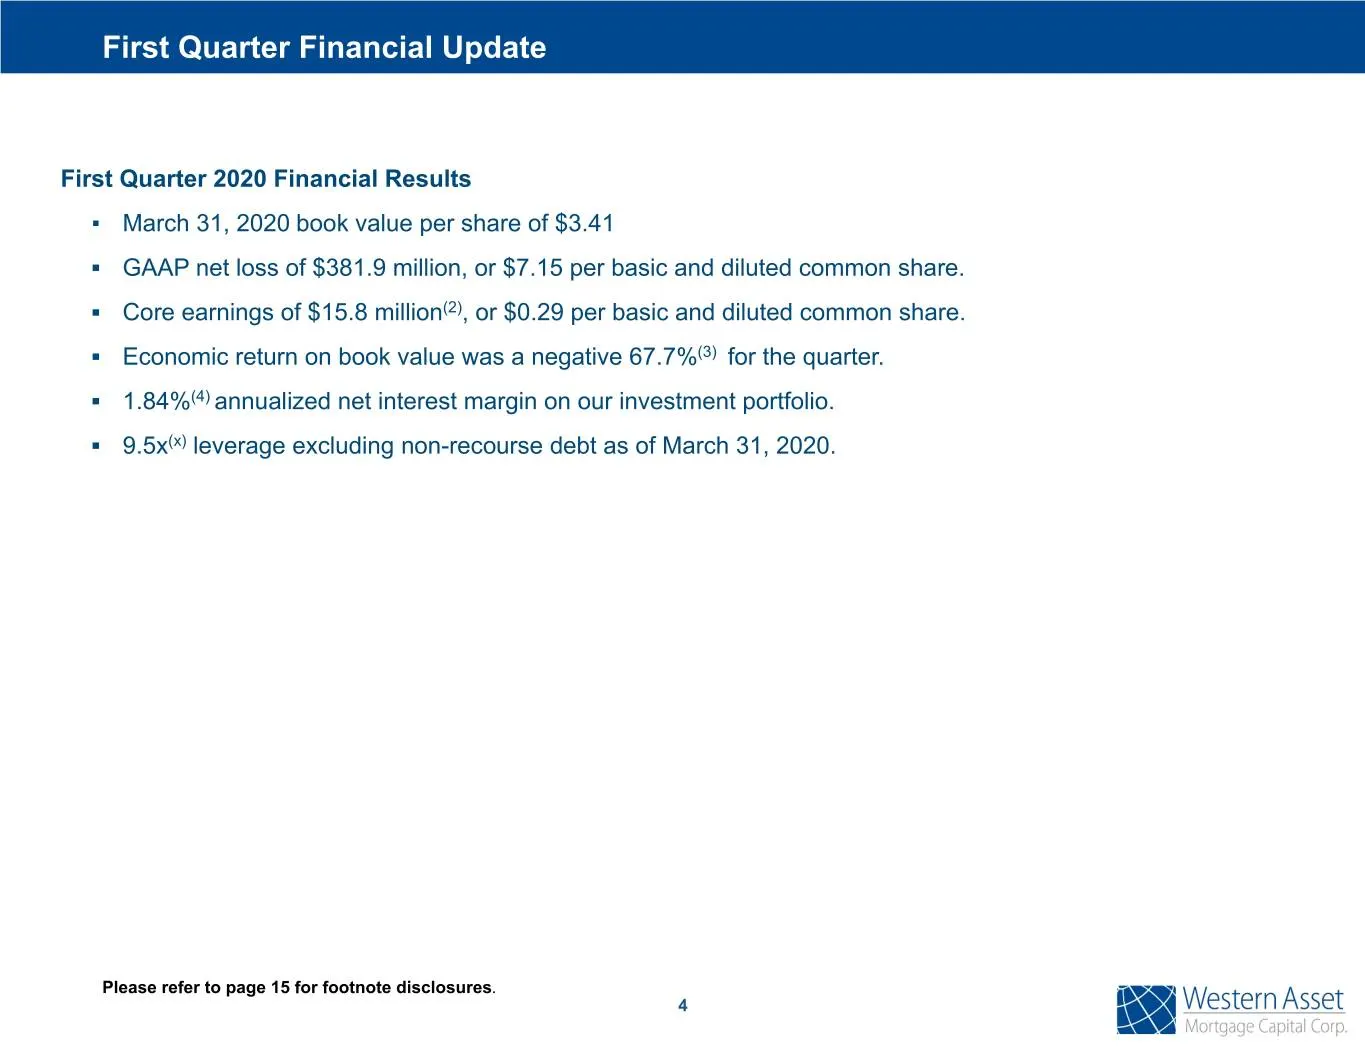
First Quarter Financial Update First Quarter 2020 Financial Results ▪ March 31, 2020 book value per share of $3.41 ▪ GAAP net loss of $381.9 million, or $7.15 per basic and diluted common share. ▪ Core earnings of $15.8 million(2), or $0.29 per basic and diluted common share. ▪ Economic return on bo
Slide 6: Impact of the COVID-19 Pandemic - Market Dynamics
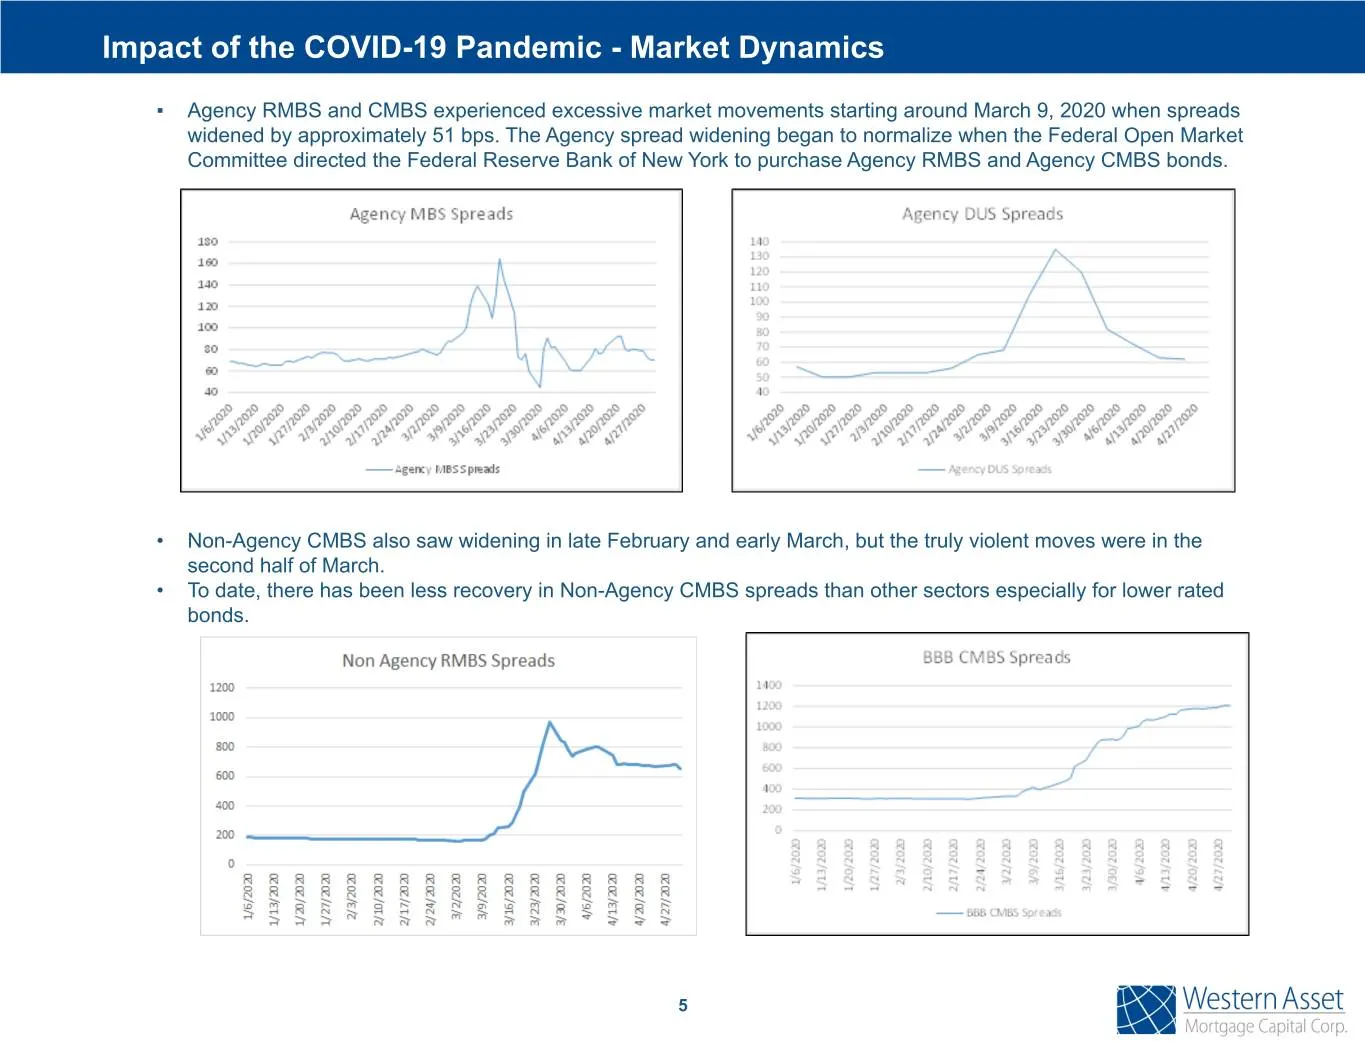
Impact of the COVID-19 Pandemic - Market Dynamics ▪ Agency RMBS and CMBS experienced excessive market movements starting around March 9, 2020 when spreads widened by approximately 51 bps. The Agency spread widening began to normalize when the Federal Open Market Committee directed the Federal Reserv
Slide 7: Impact of the COVID-19 Pandemic - Portfolio Dynamics
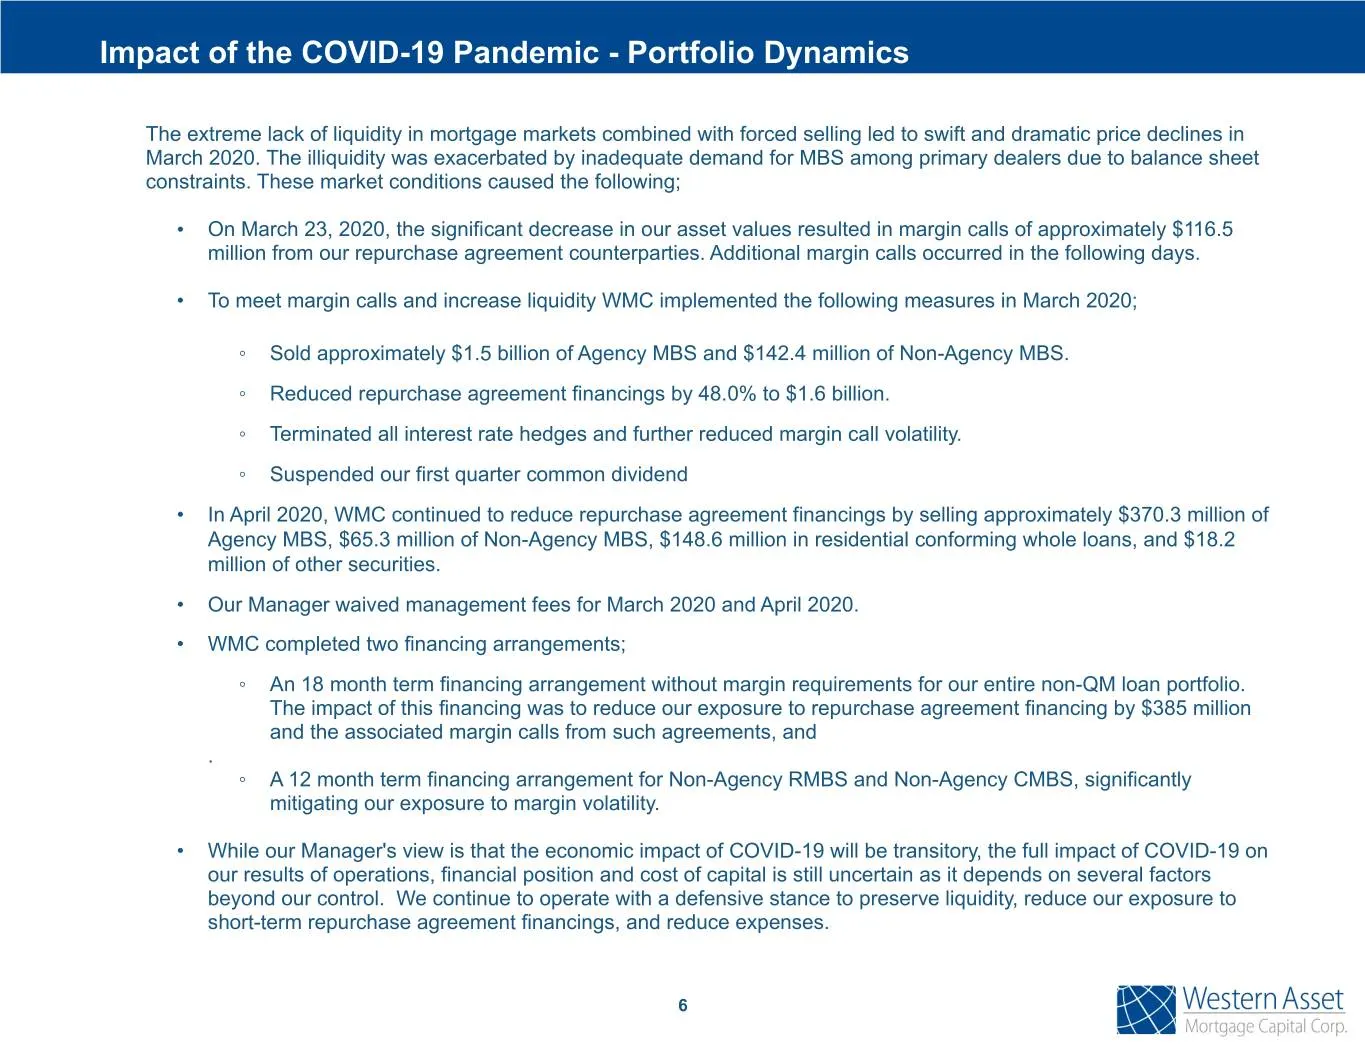
Impact of the COVID-19 Pandemic - Portfolio Dynamics The extreme lack of liquidity in mortgage markets combined with forced selling led to swift and dramatic price declines in March 2020. The illiquidity was exacerbated by inadequate demand for MBS among primary dealers due to balance sheet constrai
Slide 8: Portfolio Composition
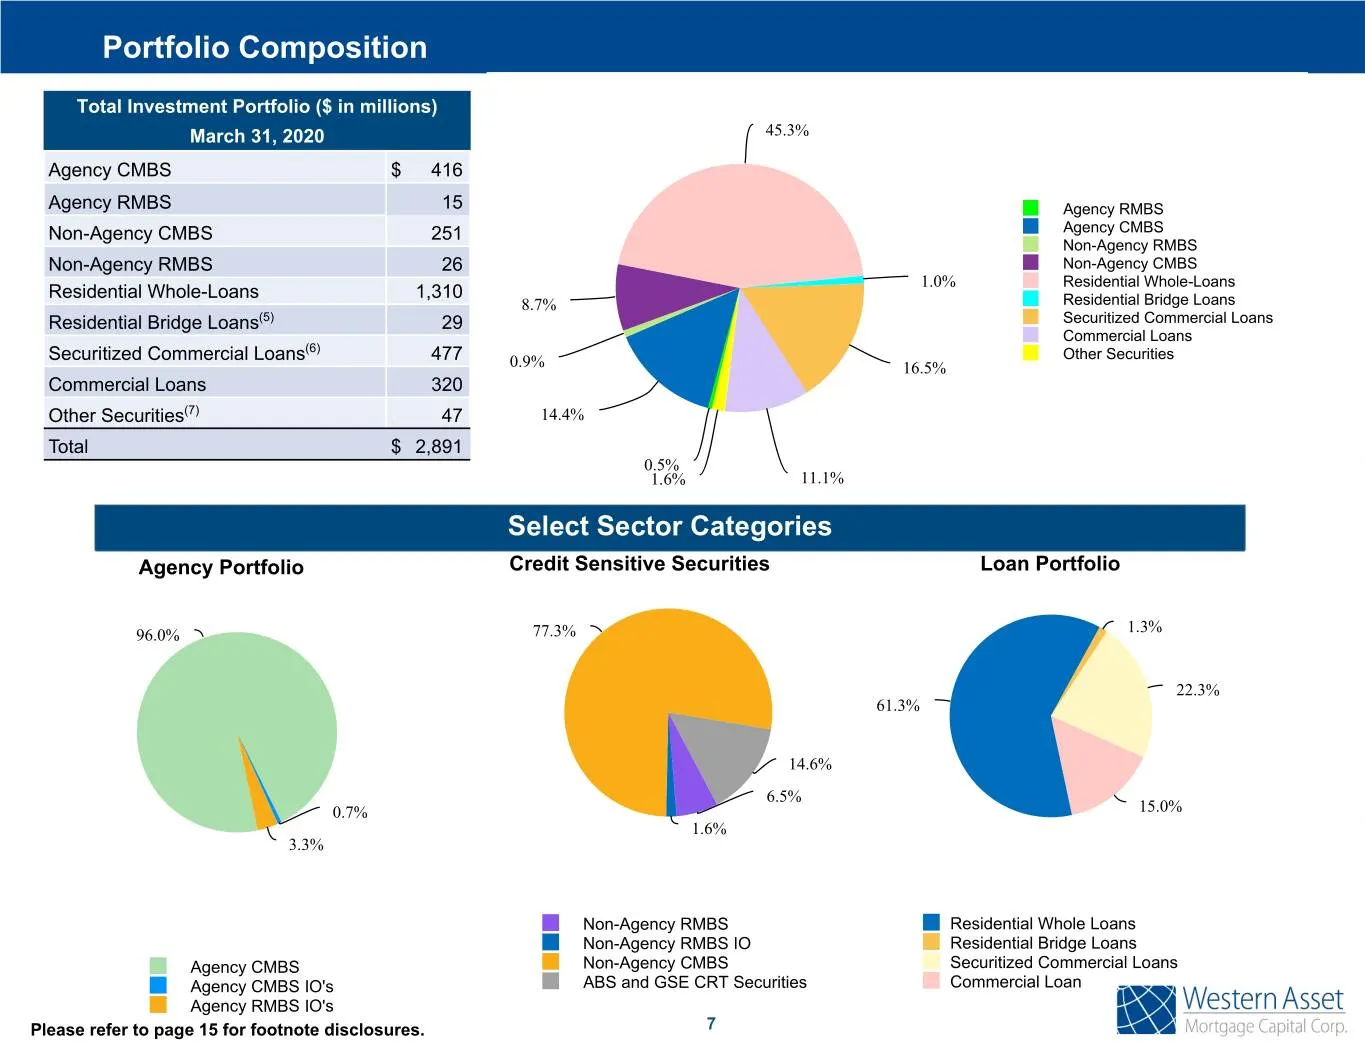
Portfolio Composition Total Investment Portfolio ($ in millions) March 31, 2020 45.3% Agency CMBS $ 416 Agency RMBS 15 Agency RMBS Non-Agency CMBS 251 Agency CMBS Non-Agency RMBS Non-Agency RMBS 26 Non-Agency CMBS 1.0% Residential Whole-Loans Residential Whole-Loans 1,310 8.7% Residential Bridge Loa
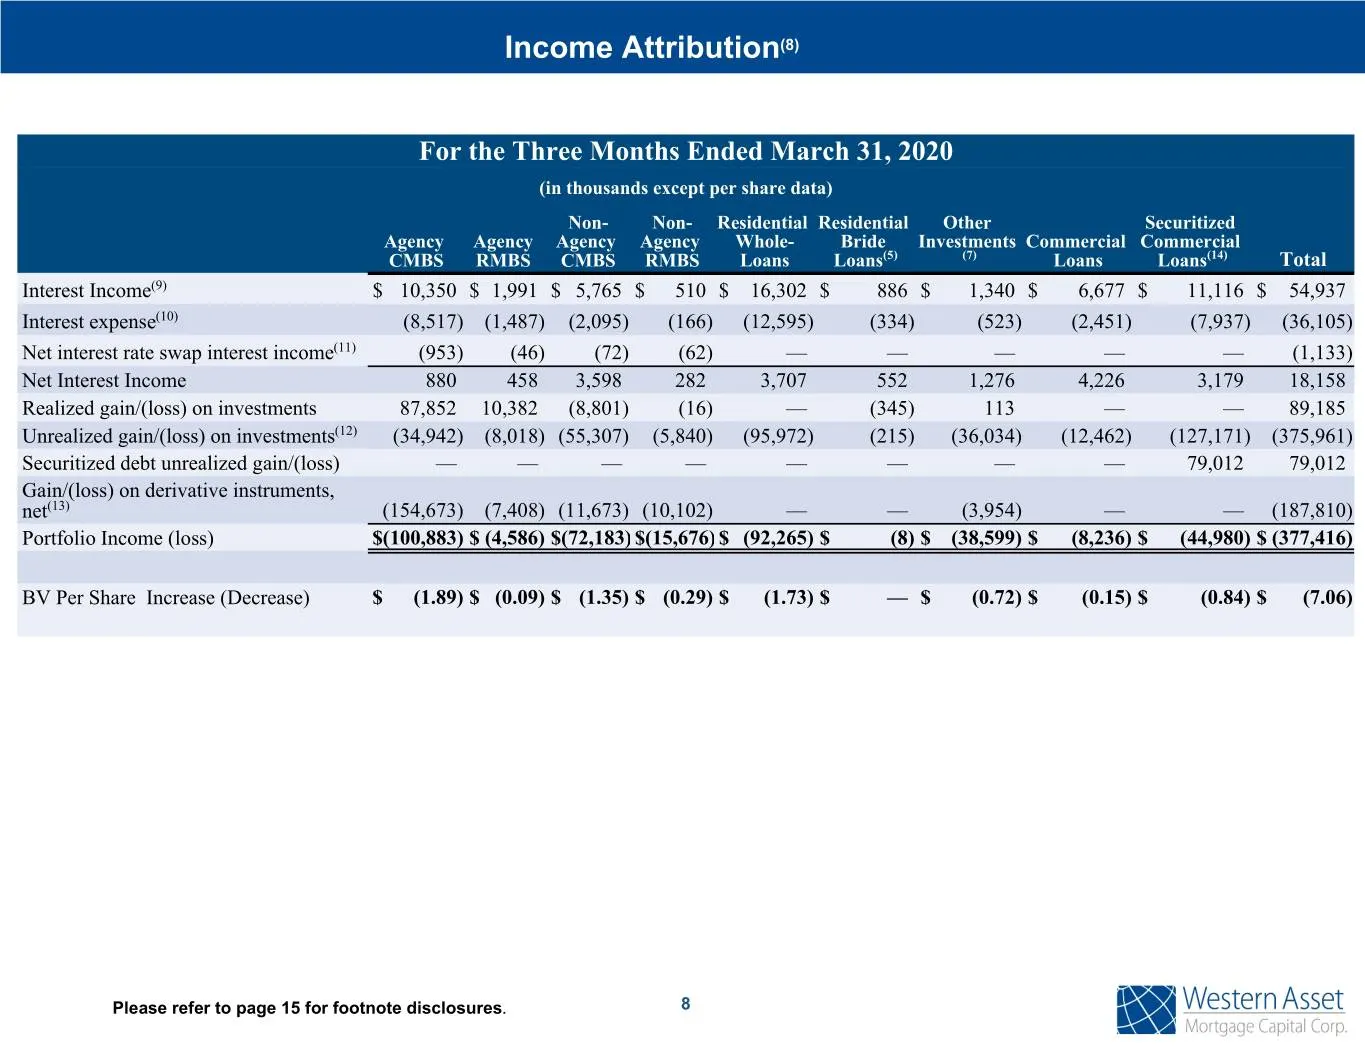
Slide 9: Income Attribution
Income Attribution(8) For the Three Months Ended March 31, 2020 (in thousands except per share data) Non- Non- Residential Residential Other Securitized Agency Agency Agency Agency Whole- Bride Investments Commercial Commercial CMBS RMBS CMBS RMBS Loans Loans(5) (7) Loans Loans(14) Total Interest In
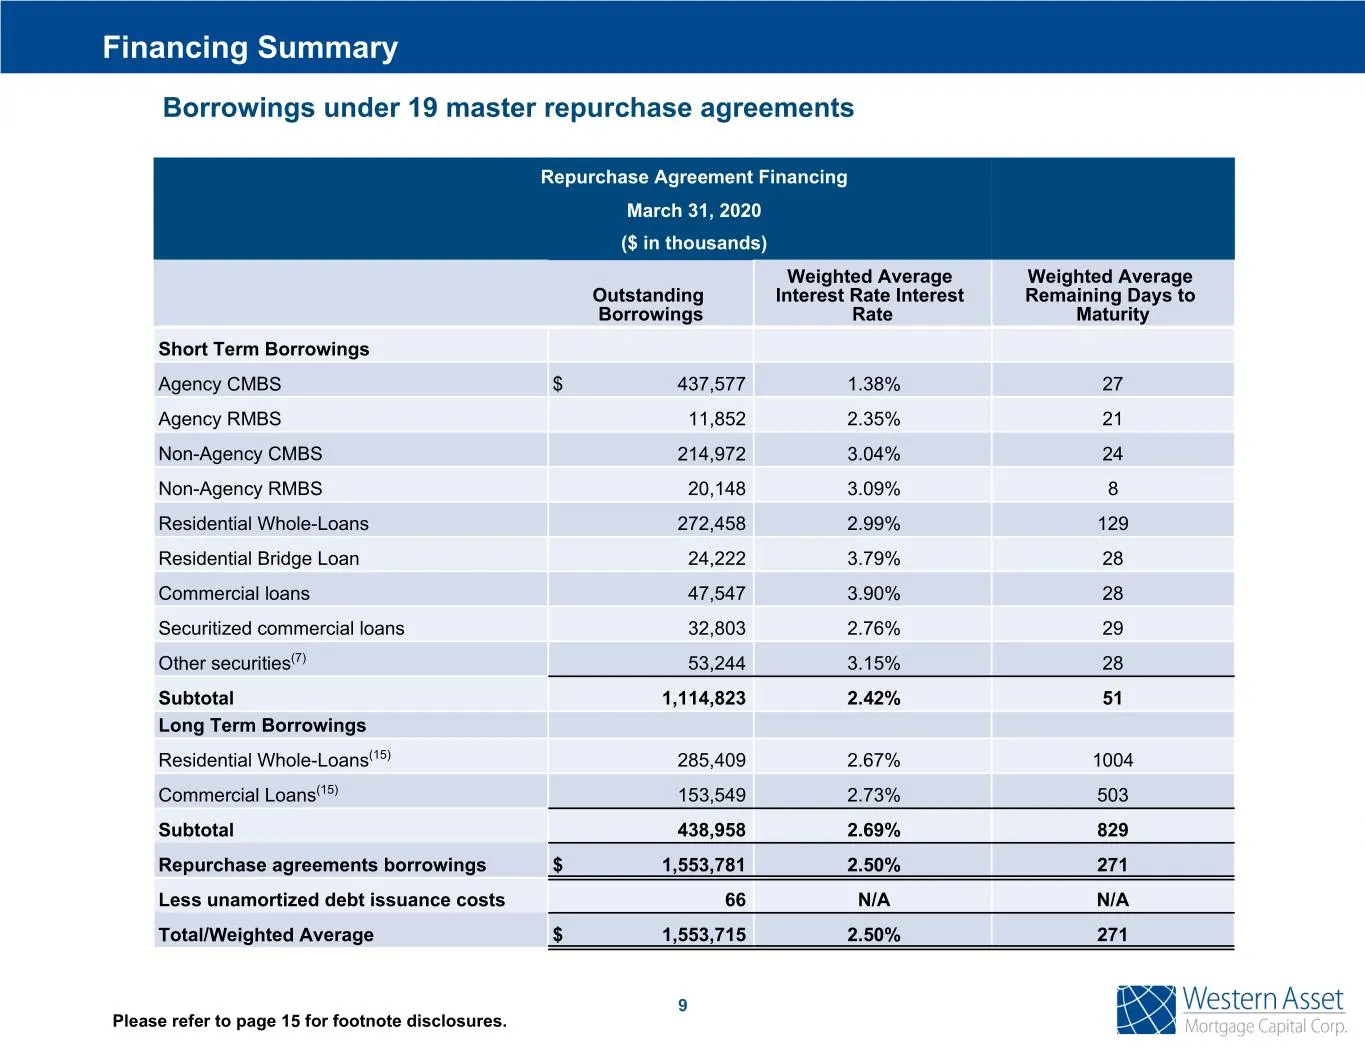
Slide 10: Financing Summary - Repurchase Agreements
Financing Summary Borrowings under 19 master repurchase agreements Repurchase Agreement Financing March 31, 2020 ($ in thousands) Weighted Average Weighted Average Outstanding Interest Rate Interest Remaining Days to Borrowings Rate Maturity Short Term Borrowings Agency CMBS $ 437,577 1.38% 27 Agenc
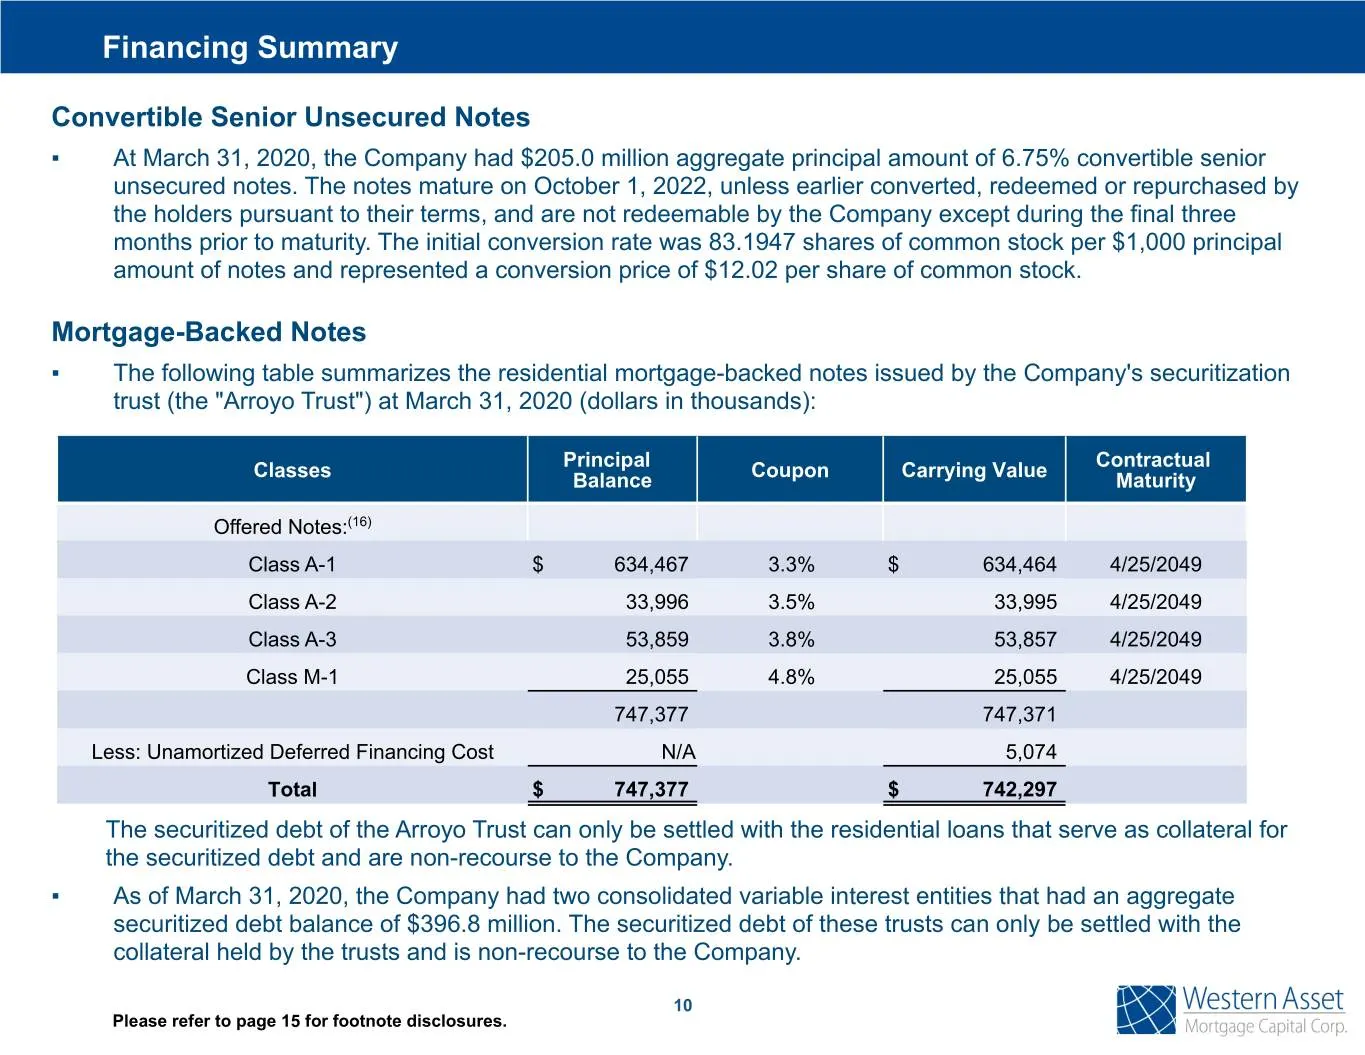
Slide 11: Financing Summary - Convertible Notes and Mortgage-Backed Notes
Financing Summary Convertible Senior Unsecured Notes ▪ At March 31, 2020, the Company had $205.0 million aggregate principal amount of 6.75% convertible senior unsecured notes. The notes mature on October 1, 2022, unless earlier converted, redeemed or repurchased by the holders pursuant to their ter
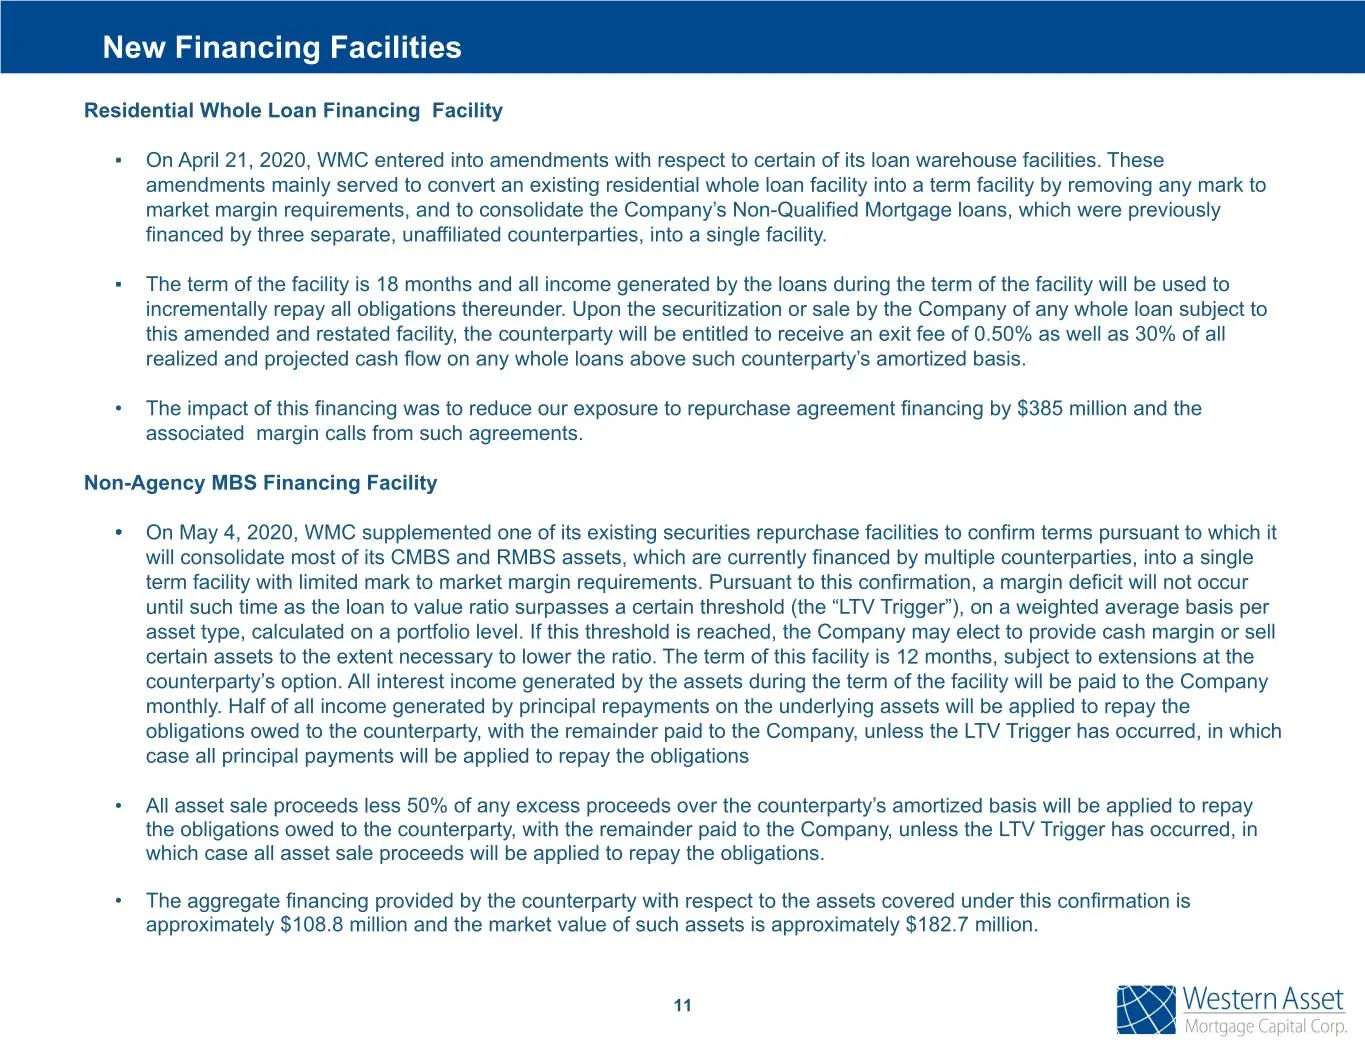
Slide 12: New Financing Facilities
New Financing Facilities Residential Whole Loan Financing Facility ▪ On April 21, 2020, WMC entered into amendments with respect to certain of its loan warehouse facilities. These amendments mainly served to convert an existing residential whole loan facility into a term facility by removing any mar
Slide 13: Hedging Summary
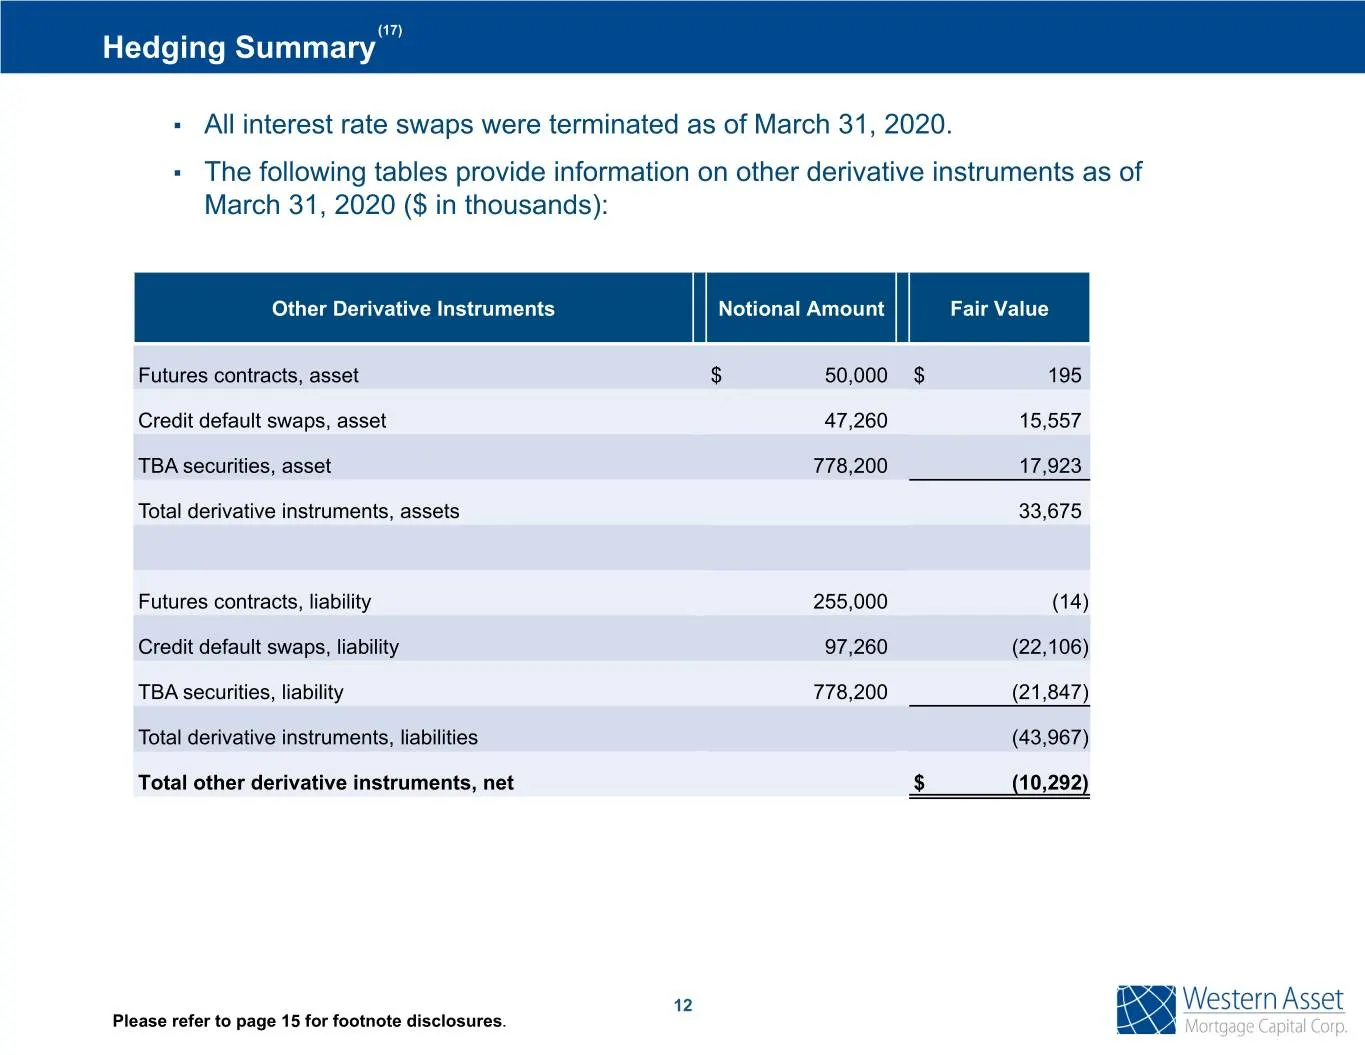
(17) Hedging Summary ▪ All interest rate swaps were terminated as of March 31, 2020. ▪ The following tables provide information on other derivative instruments as of March 31, 2020 ($ in thousands): Other Derivative Instruments Notional Amount Fair Value Futures contracts, asset $ 50,000 $ 195 Credi
Slide 14: 2020 Outlook
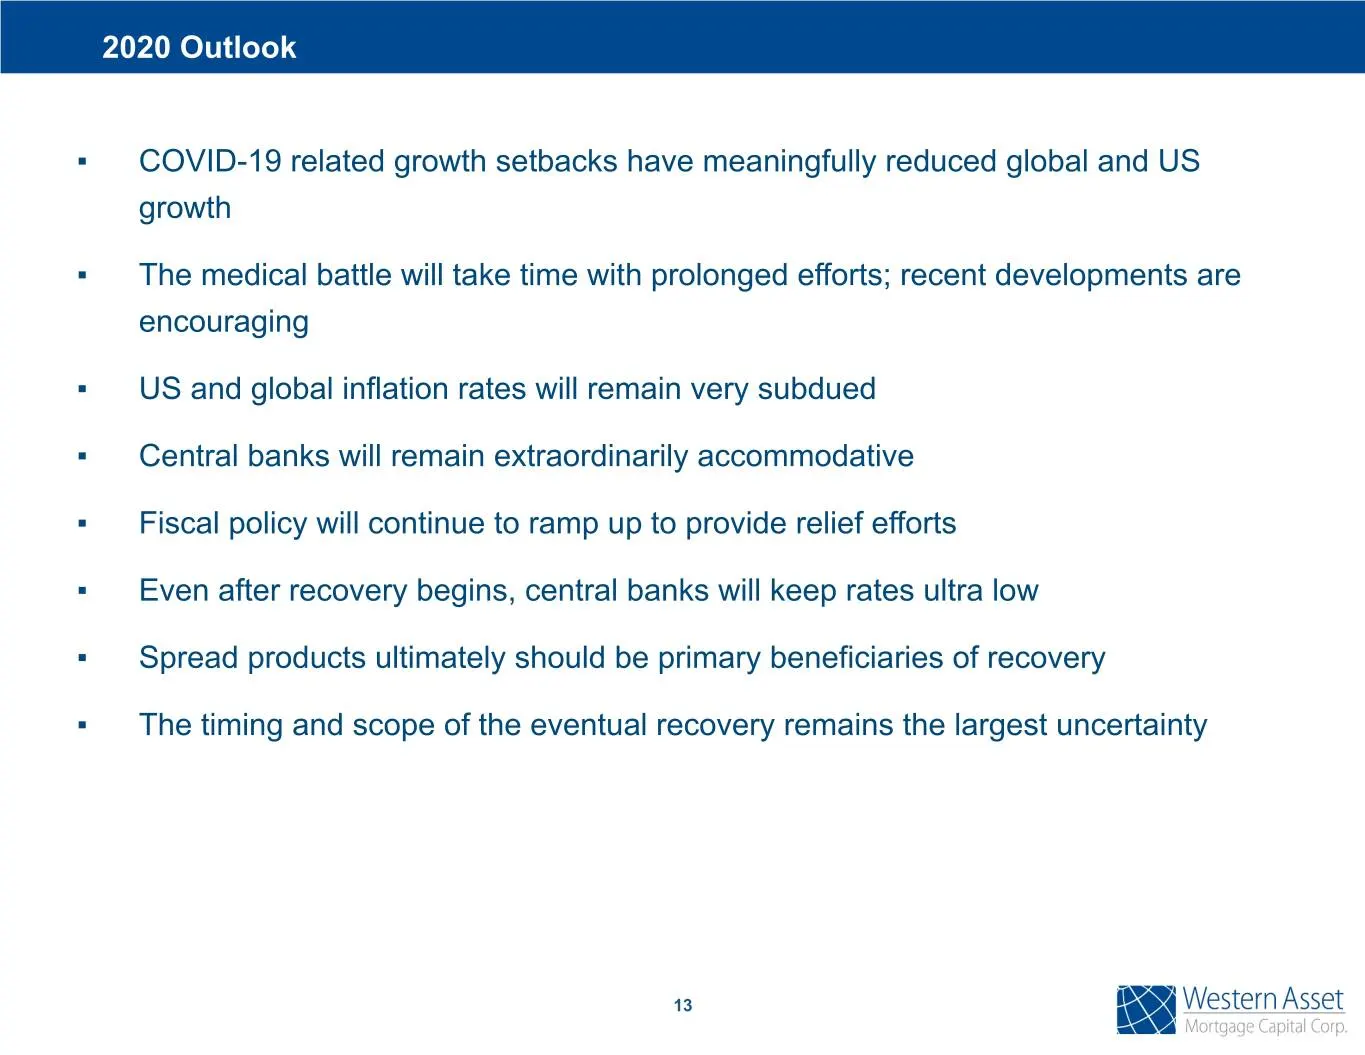
2020 Outlook ▪ COVID-19 related growth setbacks have meaningfully reduced global and US growth ▪ The medical battle will take time with prolonged efforts; recent developments are encouraging ▪ US and global inflation rates will remain very subdued ▪ Central banks will remain extraordinarily accommod
Slide 15: Portfolio View
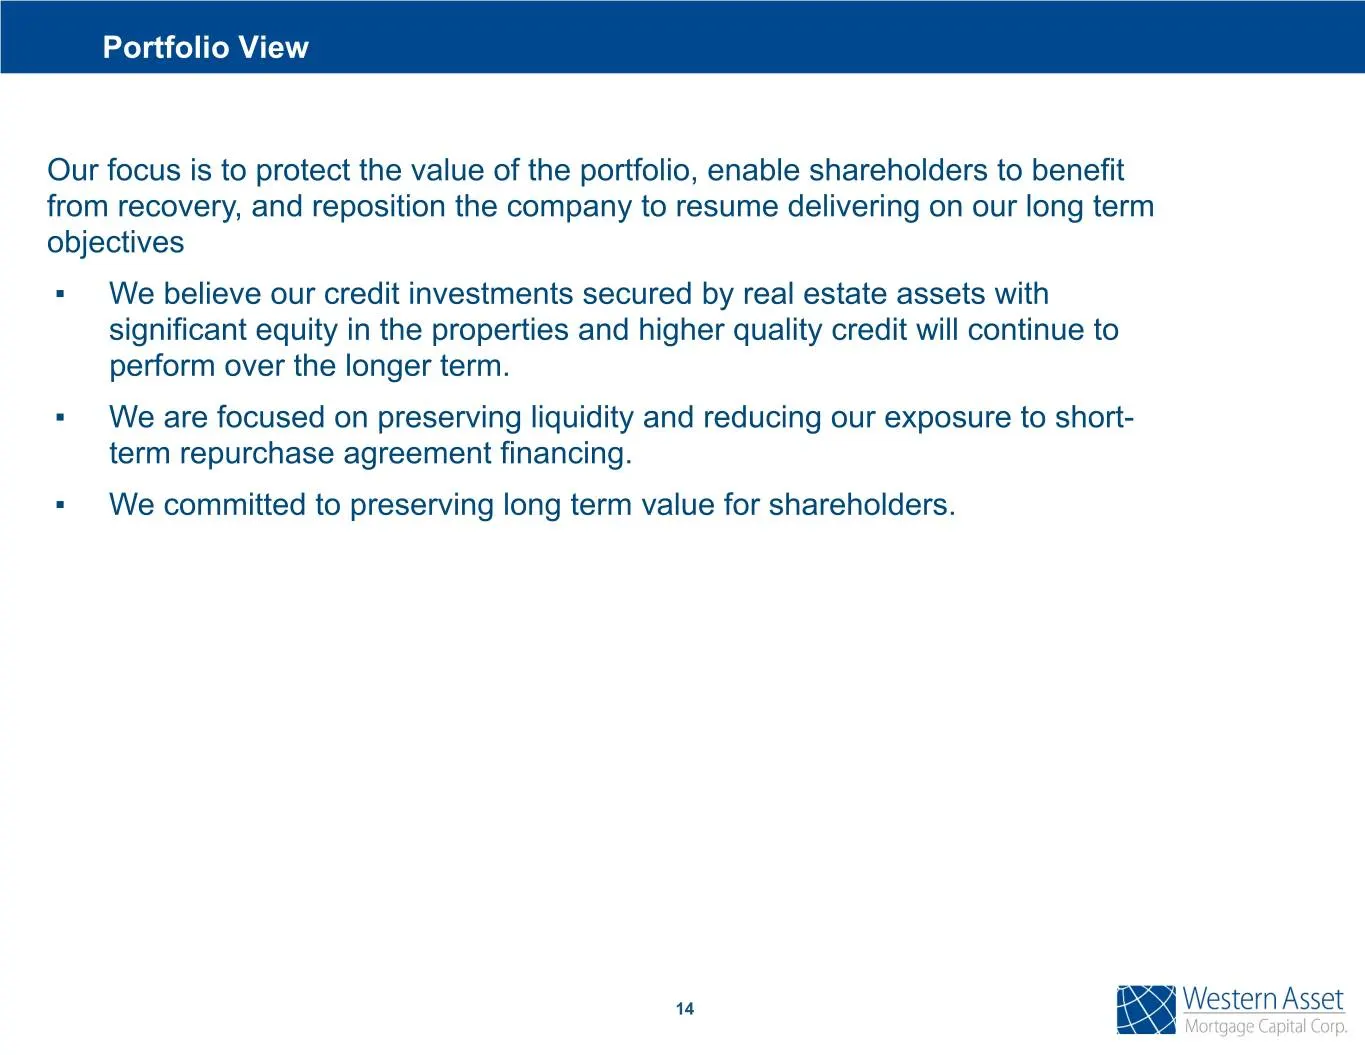
Portfolio View Our focus is to protect the value of the portfolio, enable shareholders to benefit from recovery, and reposition the company to resume delivering on our long term objectives ▪ We believe our credit investments secured by real estate assets with significant equity in the properties and
Slide 16: Footnotes
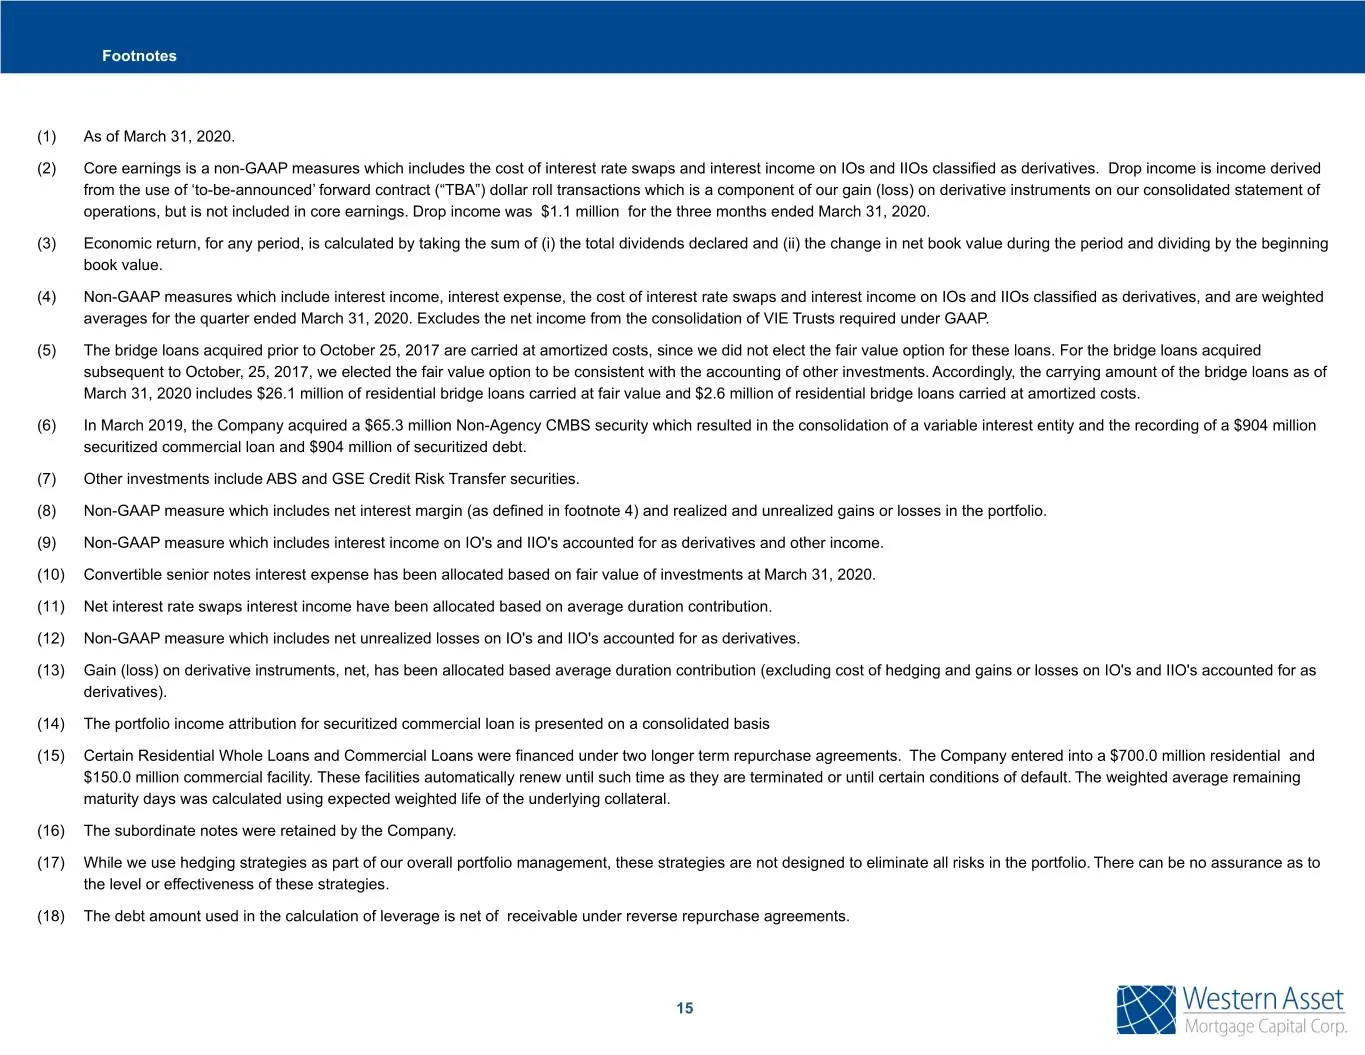
Footnotes (1) As of March 31, 2020. (2) Core earnings is a non-GAAP measures which includes the cost of interest rate swaps and interest income on IOs and IIOs classified as derivatives. Drop income is income derived from the use of ‘to-be-announced’ forward contract (“TBA”) dollar roll transactions
Slide 17: Supplemental Information
Supplemental Information 16
Slide 18: Book Value Roll Forward
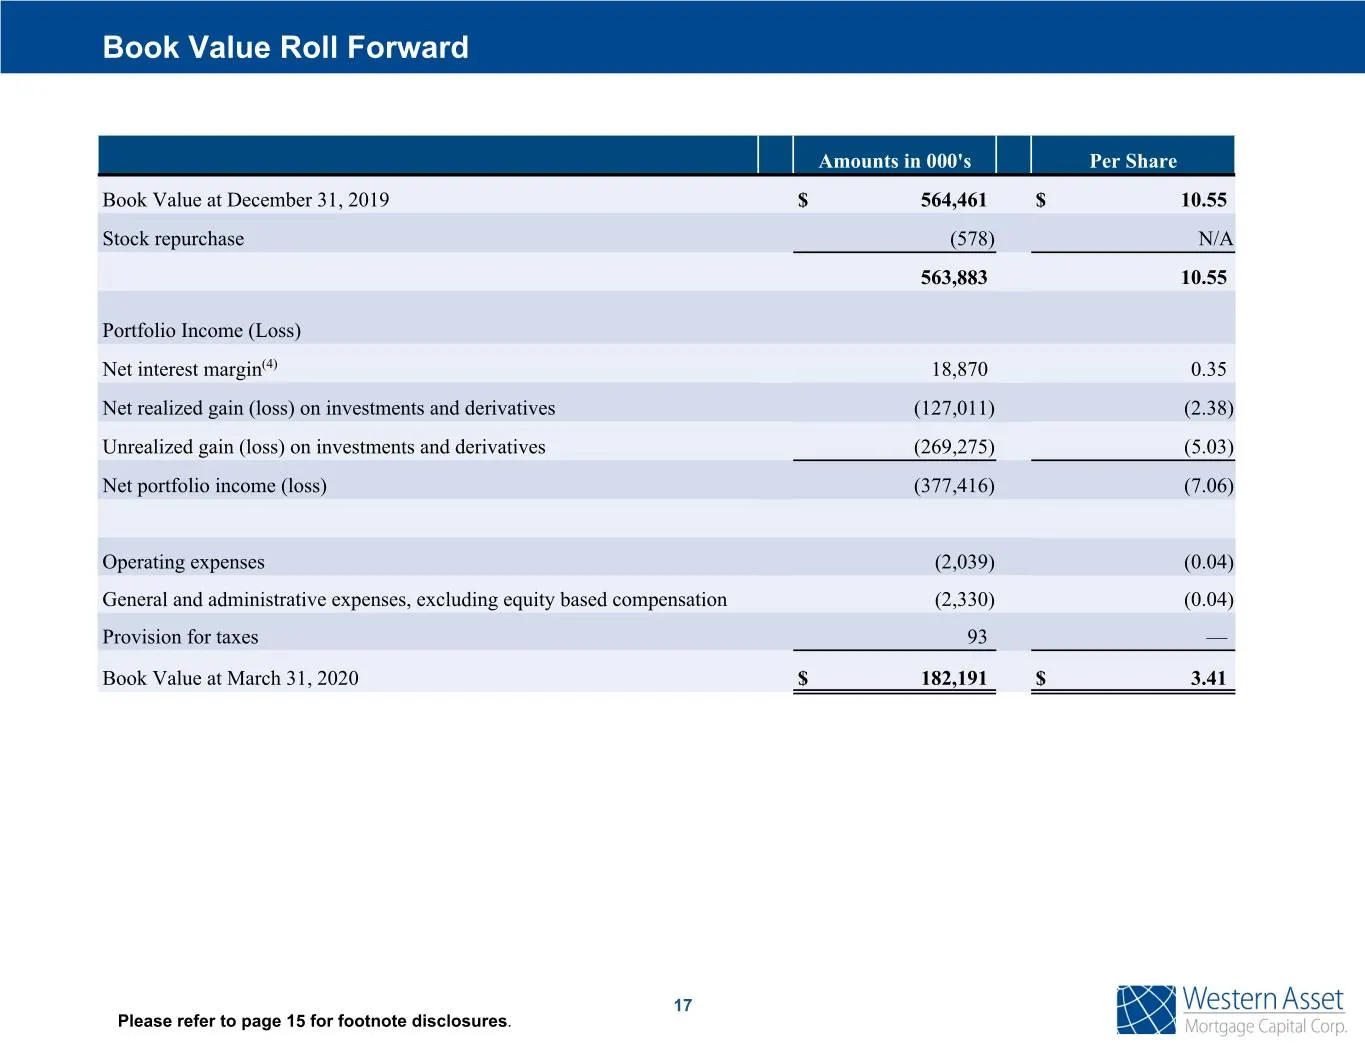
Book Value Roll Forward Amounts in 000's Per Share Book Value at December 31, 2019 $ 564,461 $ 10.55 Stock repurchase (578) N/A 563,883 10.55 Portfolio Income (Loss) Net interest margin(4) 18,870 0.35 Net realized gain (loss) on investments and derivatives (127,011) (2.38) Unrealized gain (loss) on
Slide 19: Adjusted Portfolio Composition
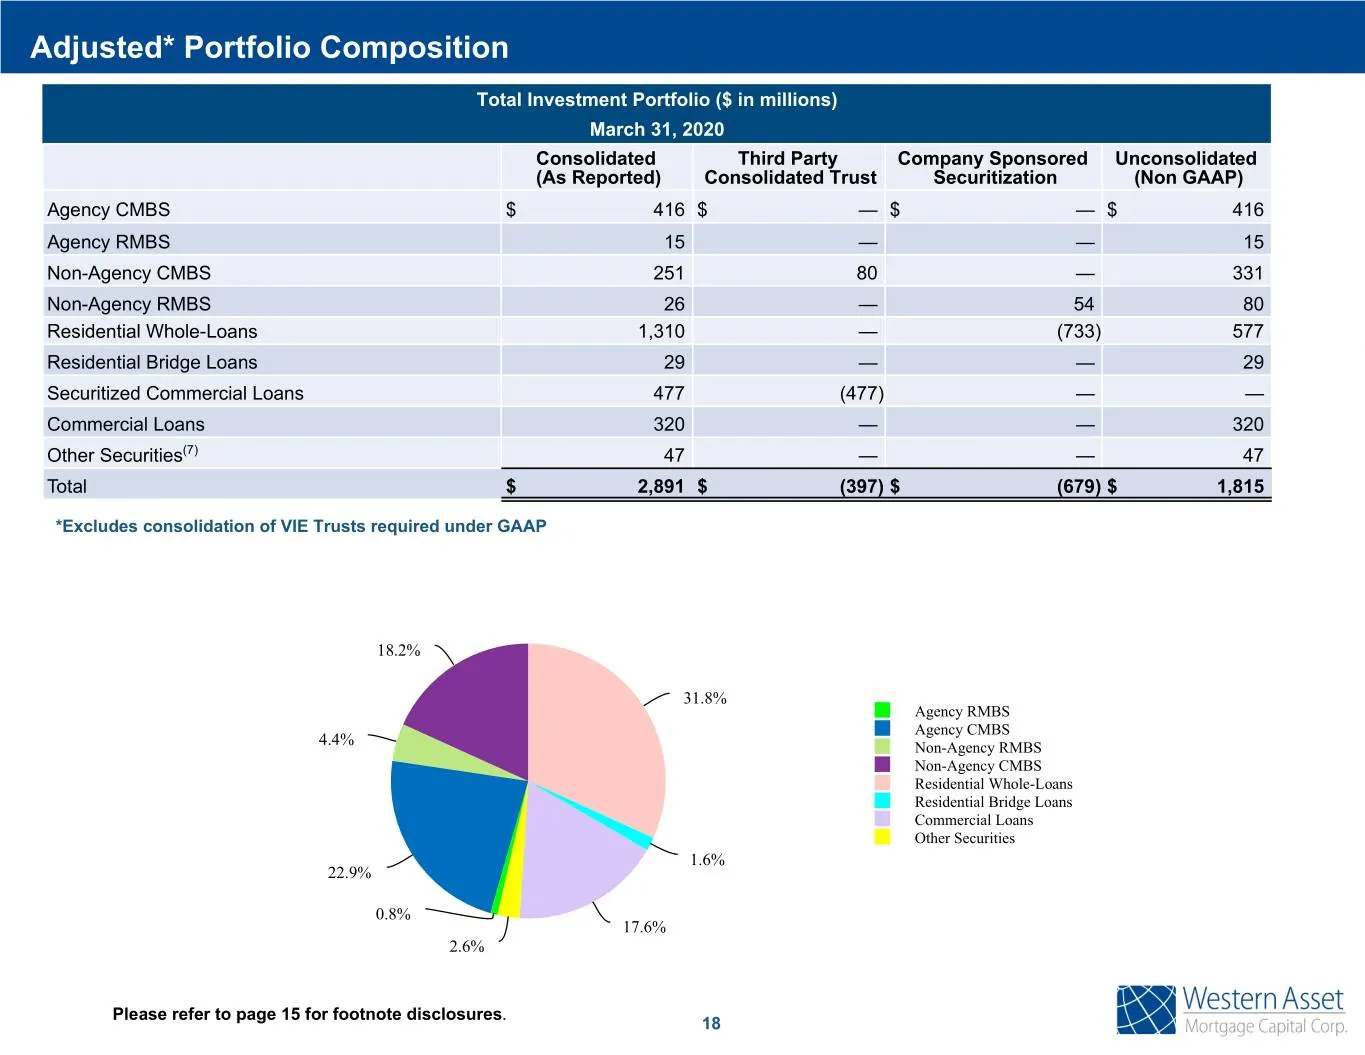
Adjusted* Portfolio Composition Total Investment Portfolio ($ in millions) March 31, 2020 Consolidated Third Party Company Sponsored Unconsolidated (As Reported) Consolidated Trust Securitization (Non GAAP) Agency CMBS $ 416 $ — $ — $ 416 Agency RMBS 15 — — 15 Non-Agency CMBS 251 80 — 331 Non-Agency
Slide 20: Adjusted Portfolio Income Attribution
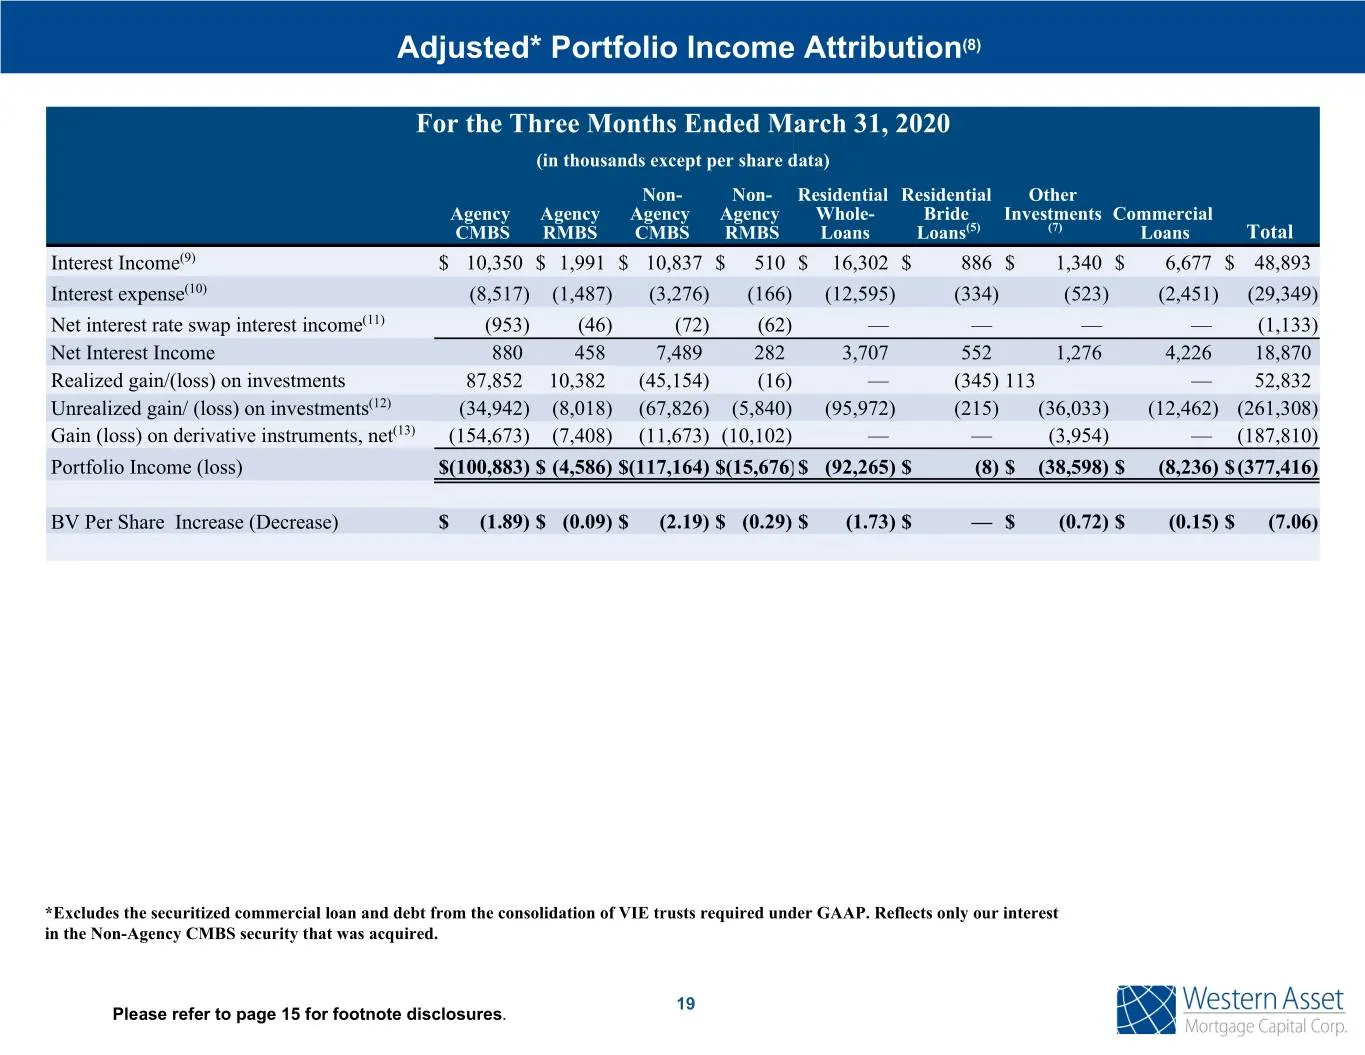
Adjusted* Portfolio Income Attribution(8) For the Three Months Ended March 31, 2020 (in thousands except per share data) Non- Non- Residential Residential Other Agency Agency Agency Agency Whole- Bride Investments Commercial CMBS RMBS CMBS RMBS Loans Loans(5) (7) Loans Total Interest Income(9) $ 10,
Slide 21: Adjusted Credit Sensitive Portfolio
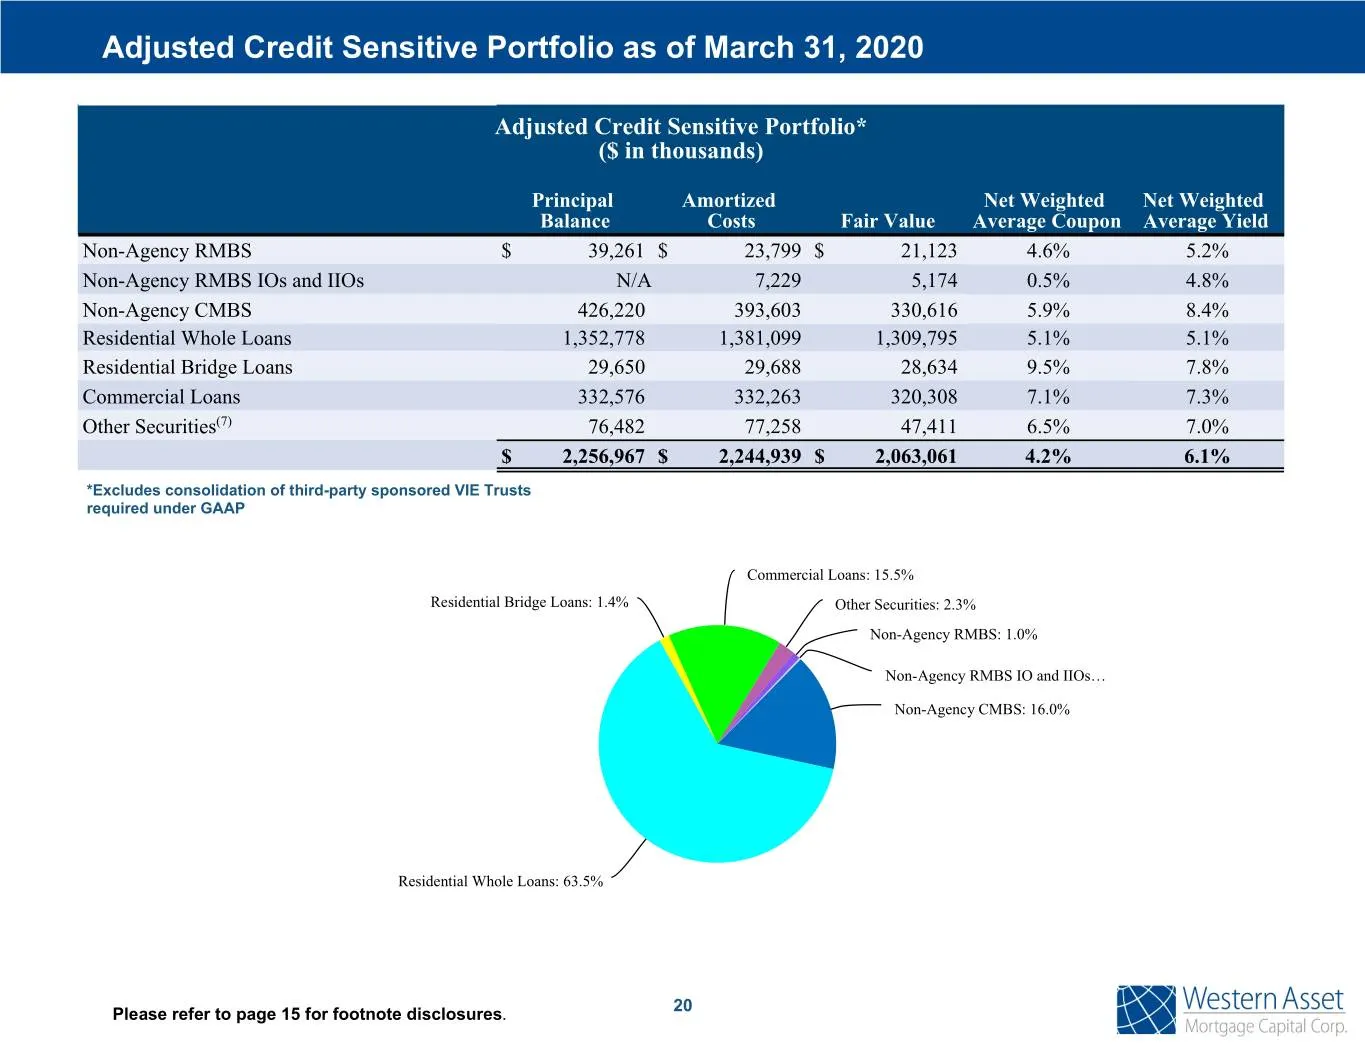
Adjusted Credit Sensitive Portfolio as of March 31, 2020 Adjusted Credit Sensitive Portfolio* ($ in thousands) Principal Amortized Net Weighted Net Weighted Balance Costs Fair Value Average Coupon Average Yield Non-Agency RMBS $ 39,261 $ 23,799 $ 21,123 4.6% 5.2% Non-Agency RMBS IOs and IIOs N/A 7,2
Slide 22: Commercial Loans
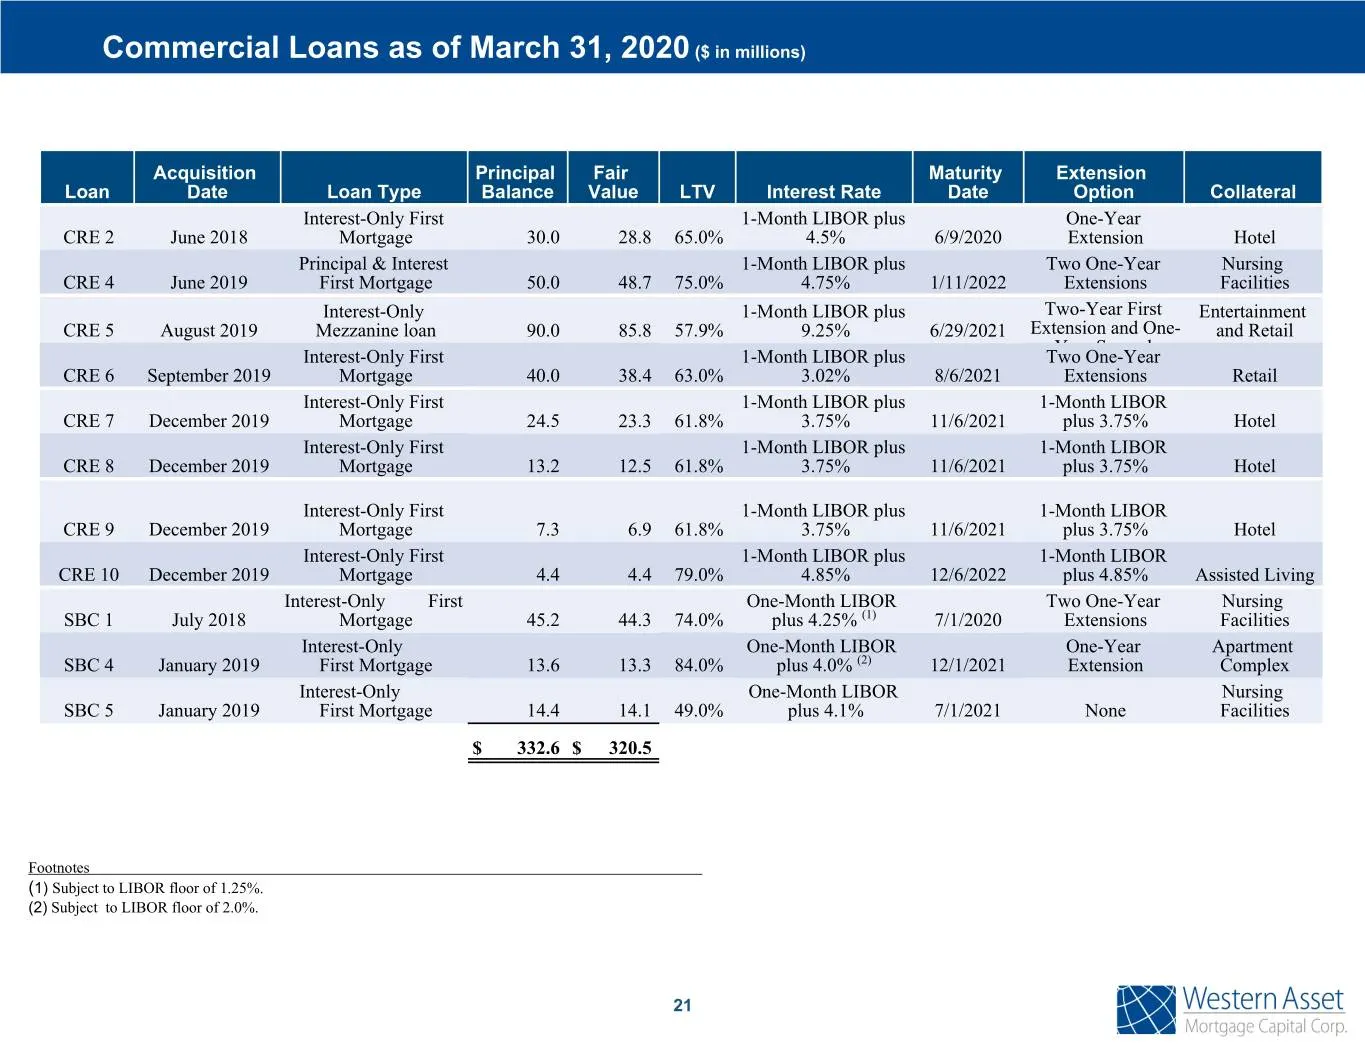
Commercial Loans as of March 31, 2020 ($ in millions) Acquisition Principal Fair Maturity Extension Loan Date Loan Type Balance Value LTV Interest Rate Date Option Collateral Interest-Only First 1-Month LIBOR plus One-Year CRE 2 June 2018 Mortgage 30.0 28.8 65.0% 4.5% 6/9/2020 Extension Hotel Princi
Slide 23: Contact Information
Contact Information Western Asset Mortgage Capital Corporation c/o Financial Profiles, Inc. 11601 Wilshire Blvd., Suite 1920 Los Angeles, CA 90025 www.westernassetmcc.com Investor Relations Contact: Larry Clark Tel: (310) 622-8223 [email protected]
Source: SEC EDGAR · 8-K filed May 7, 2020
More decks from Western Asset Mortgage Capital
 Merger or Acquisition (August 2023)9 slides · Aug 9, 2023
 Q2 2023 Earnings Presentation32 slides · Aug 8, 2023
 Merger or Acquisition (July 2023)9 slides · Jul 13, 2023
 Merger or Acquisition (June 2023)16 slides · Jun 28, 2023
 Q1 2023 Earnings Presentation33 slides · May 4, 2023
 Q4 2022 Earnings Presentation34 slides · Mar 2, 2023