Strategic Hotels and Resorts Inc
Strategic Hotels and Resorts — Investor Presentation (March 2013)
34 slides from Strategic Hotels and Resorts's investor presentation, Mar 4, 2013
Slide 1: Investor Presentation
Exhibit 99.1 Investor Presentation March 2013
Slide 2: BEE's Unique Value Proposition
I. BEE’s Unique Value Proposition II. Company Overview III. Industry Update IV. Operating Trends V. Financial Overview BEE’s Unique Value Proposition 1
Slide 3: BEE's Unique Value Proposition
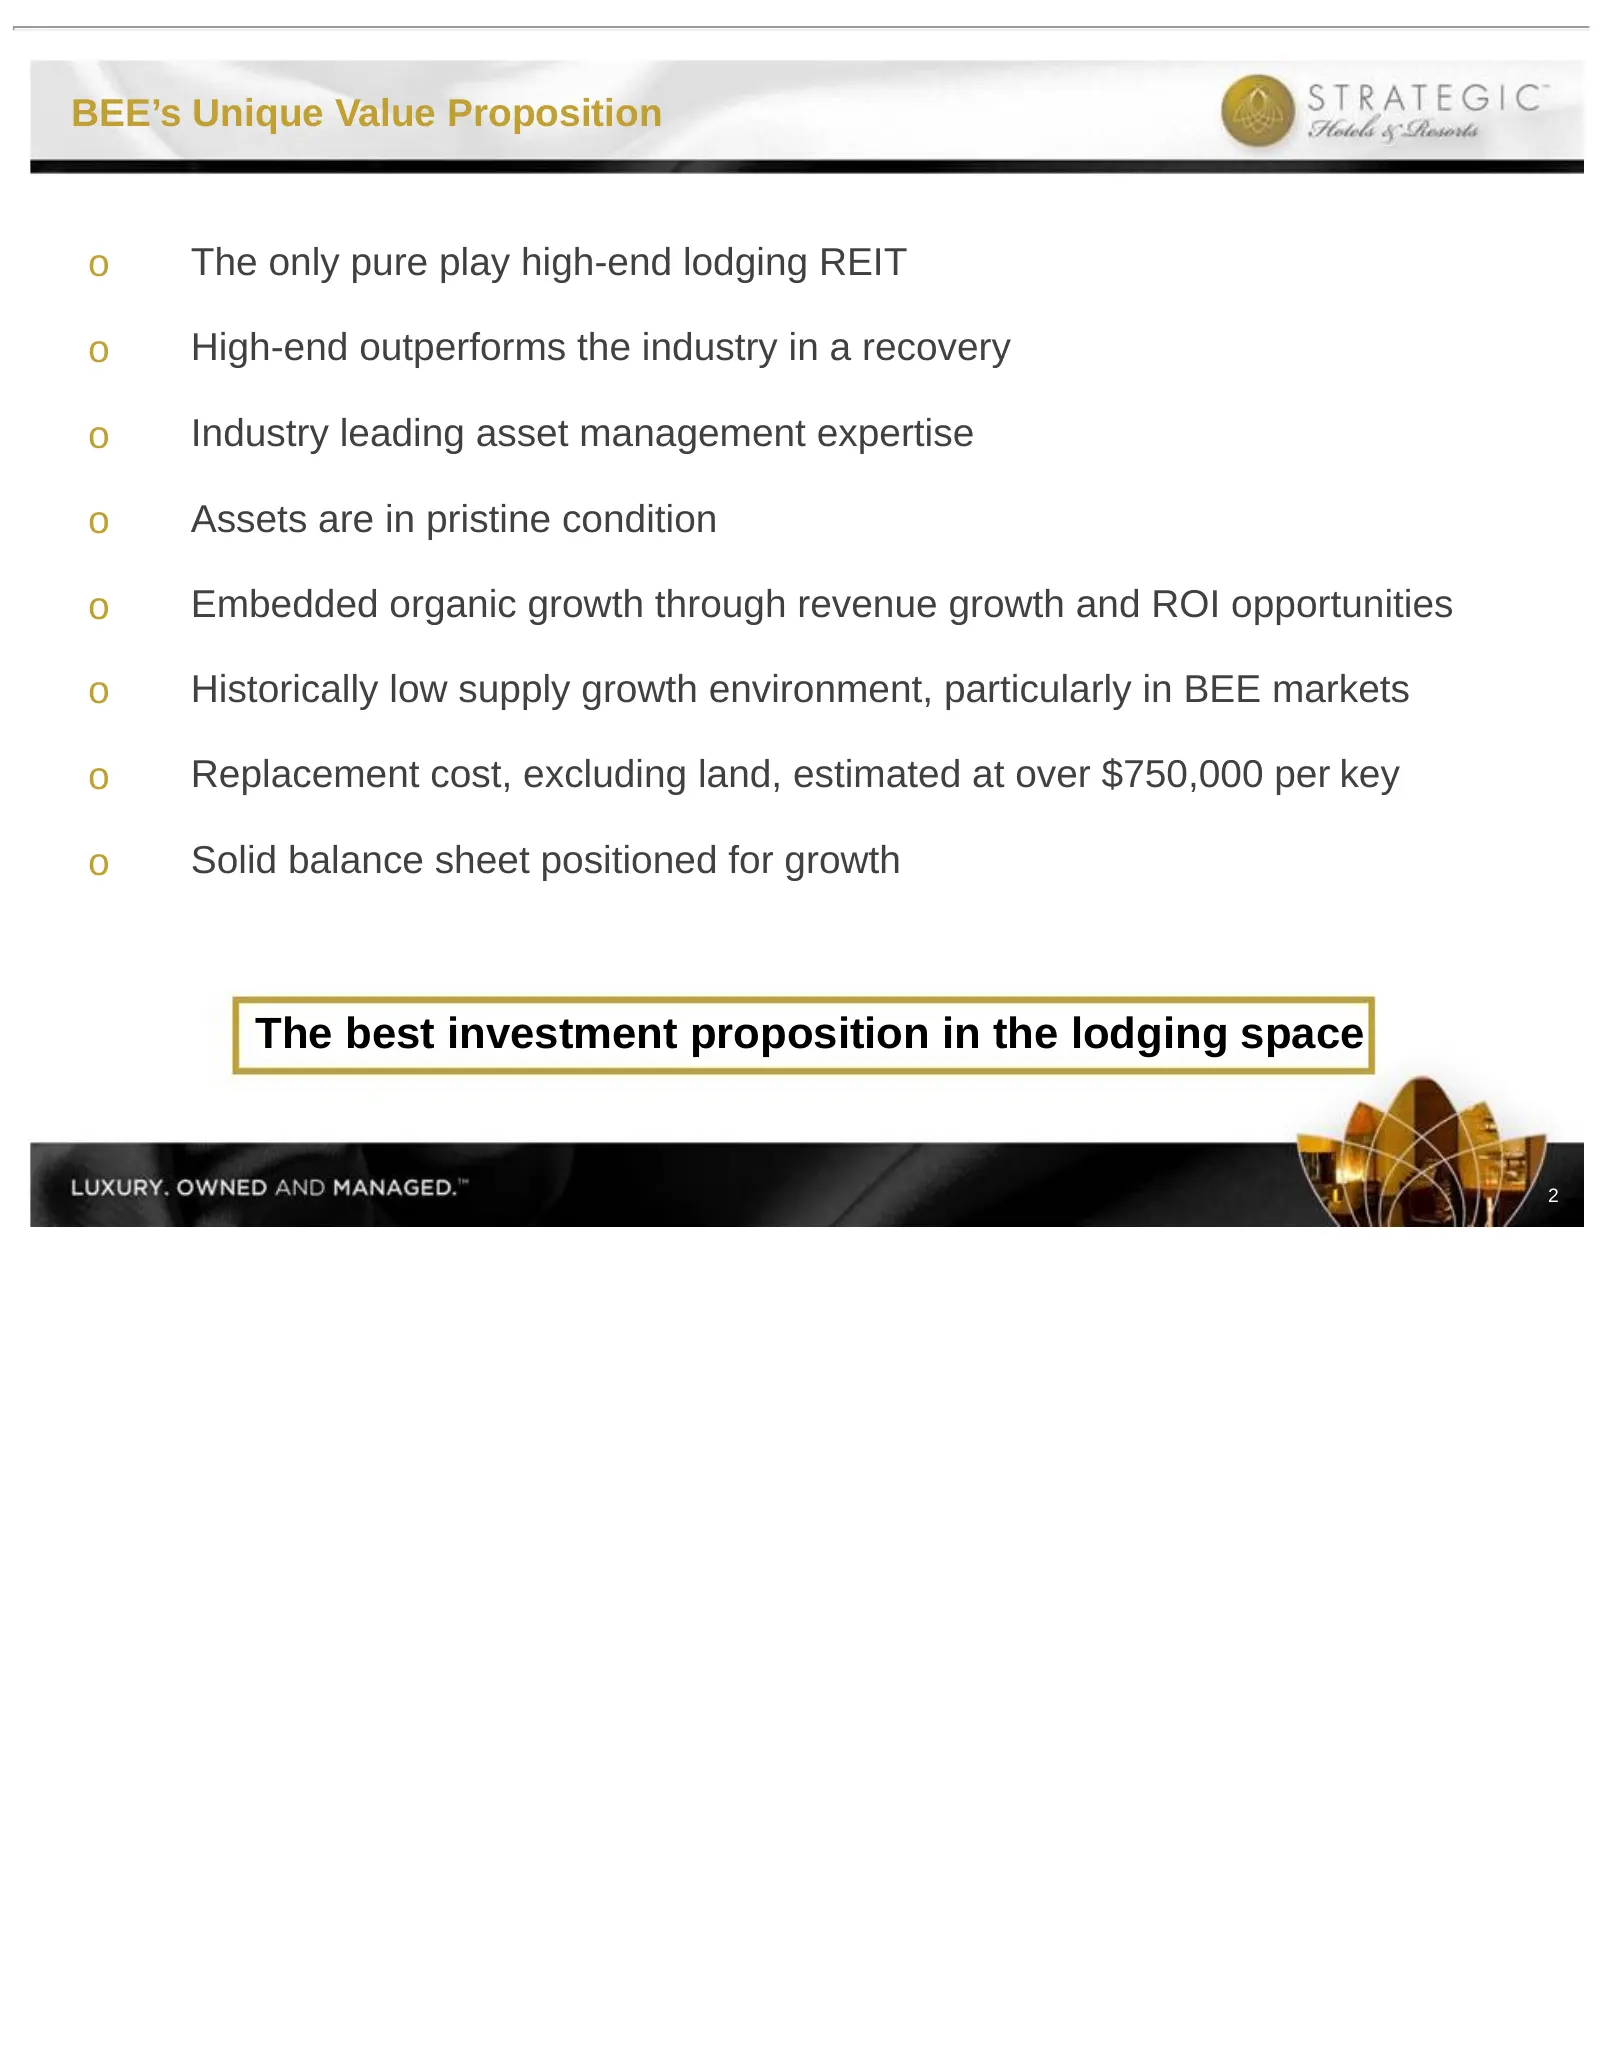
BEE’s Unique Value Proposition o The only pure play high-end lodging REIT o High-end outperforms the industry in a recovery o Industry leading asset management expertise o Assets are in pristine condition o Embedded organic growth through revenue growth and ROI opportunities o Historically low suppl
Slide 4: BEE's Unique Value Proposition
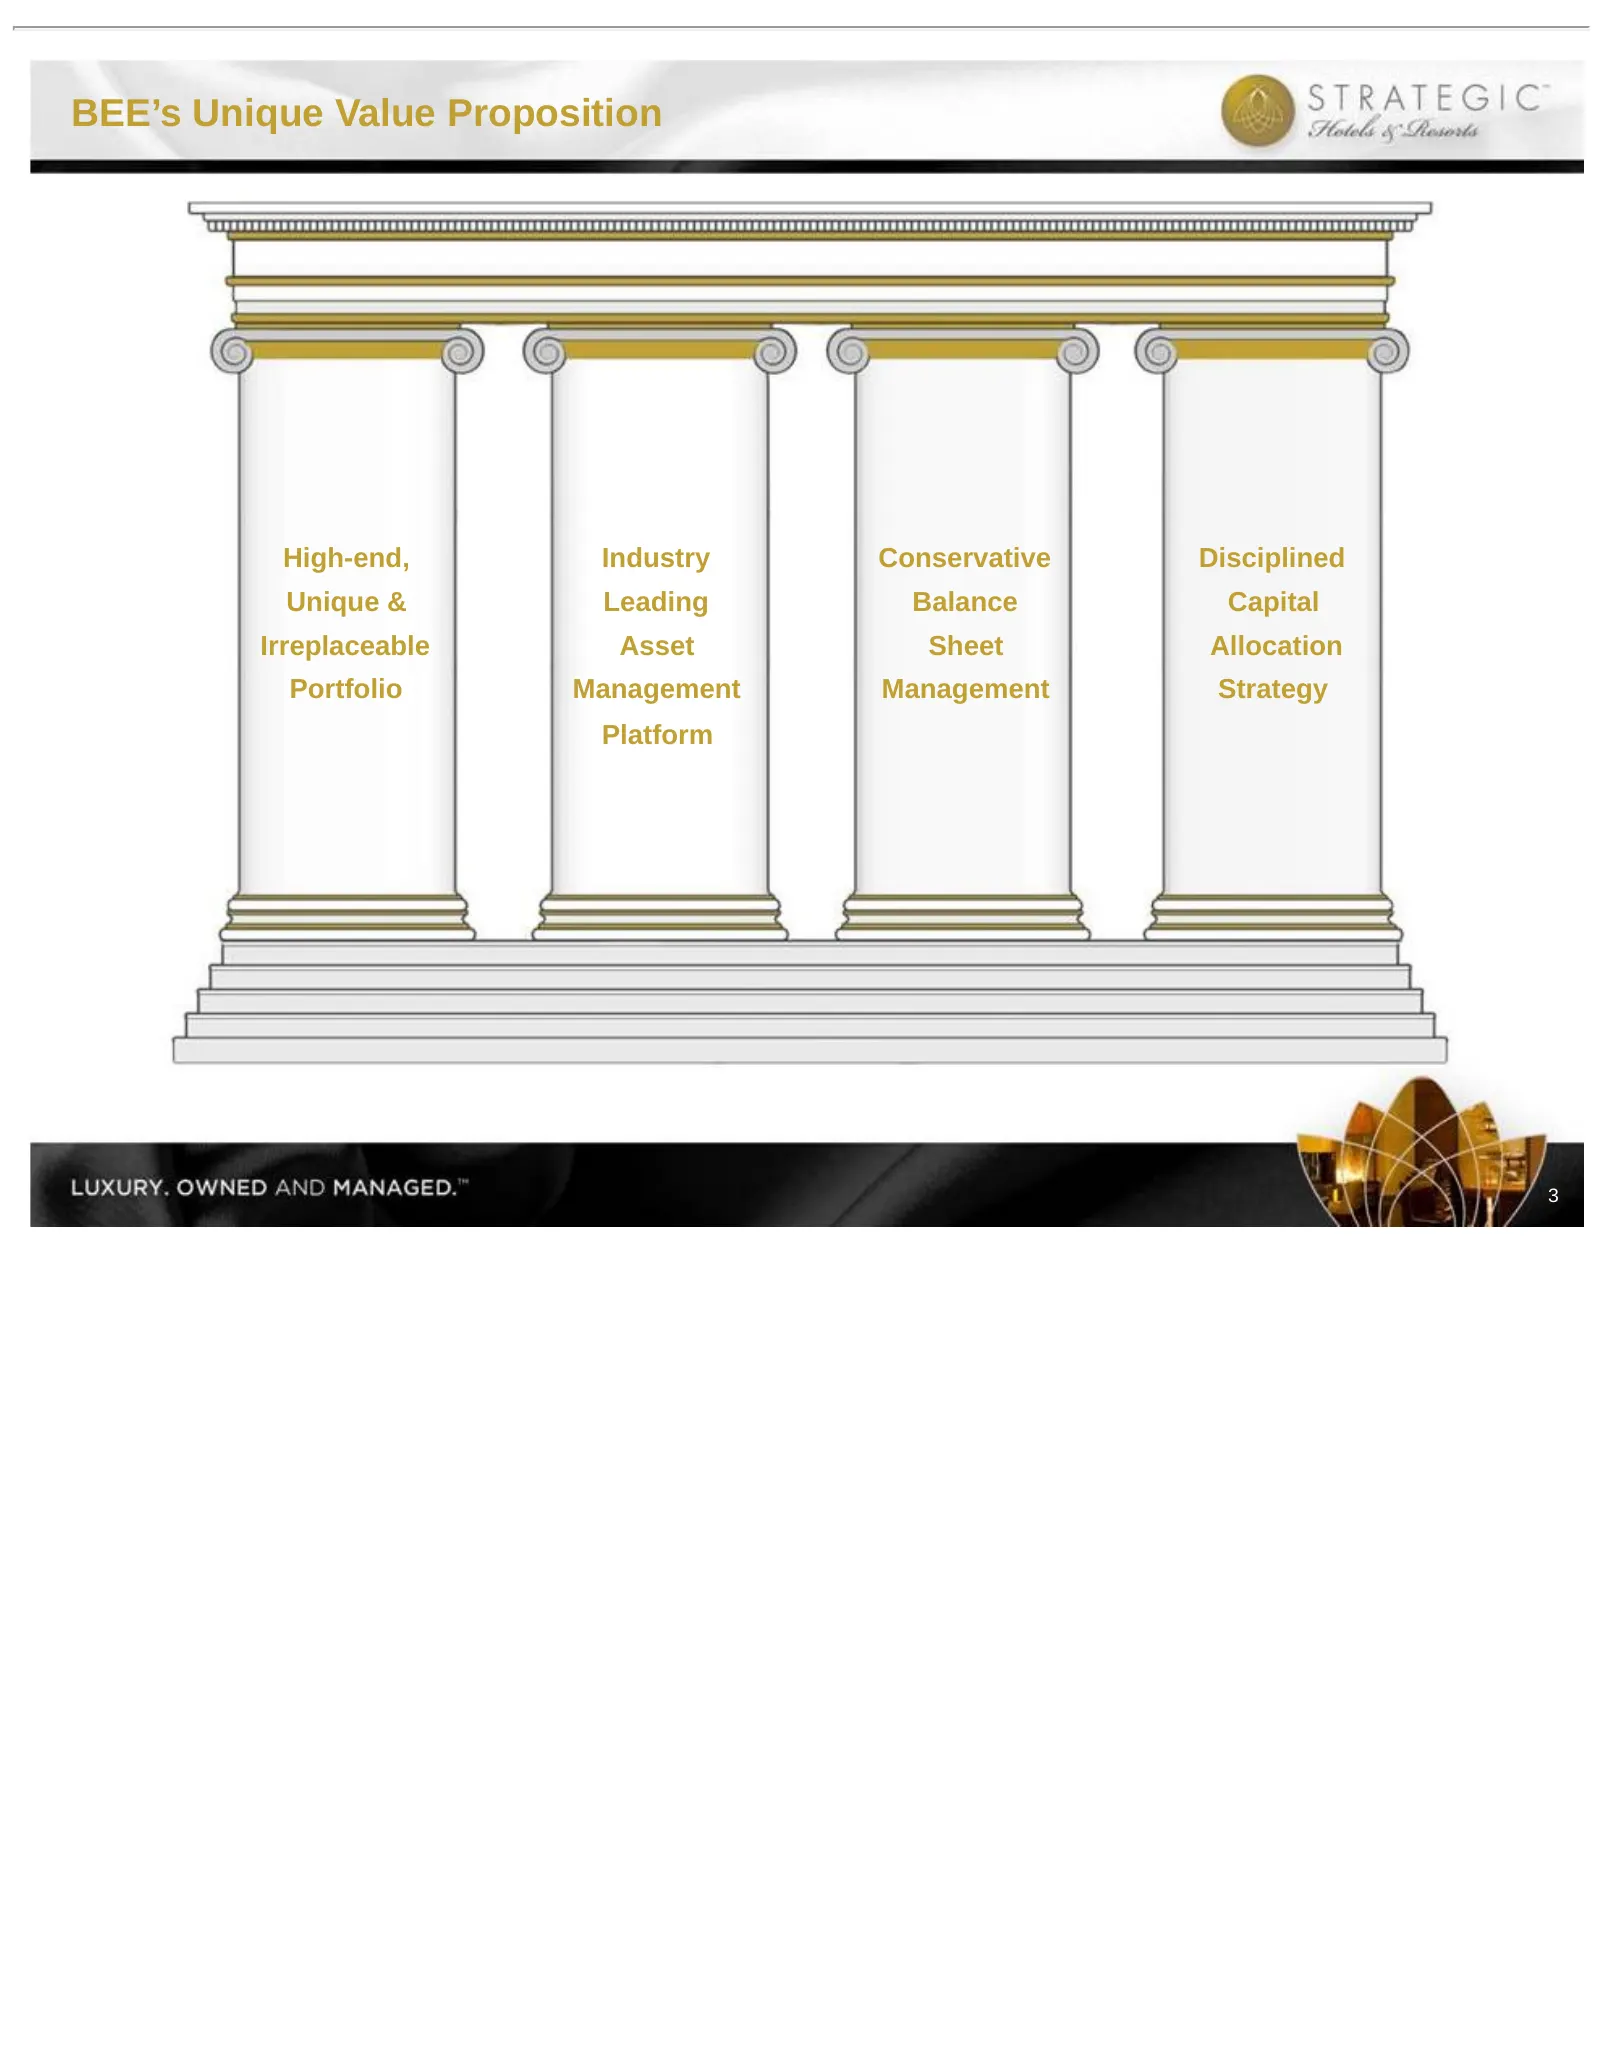
BEE’s Unique Value Proposition High-end, Industry Conservative Disciplined Unique & Leading Balance Capital Irreplaceable Asset Sheet Allocation Portfolio Management Management Strategy Platform 3
Slide 5: High-end, Unique & Irreplaceable Portfolio
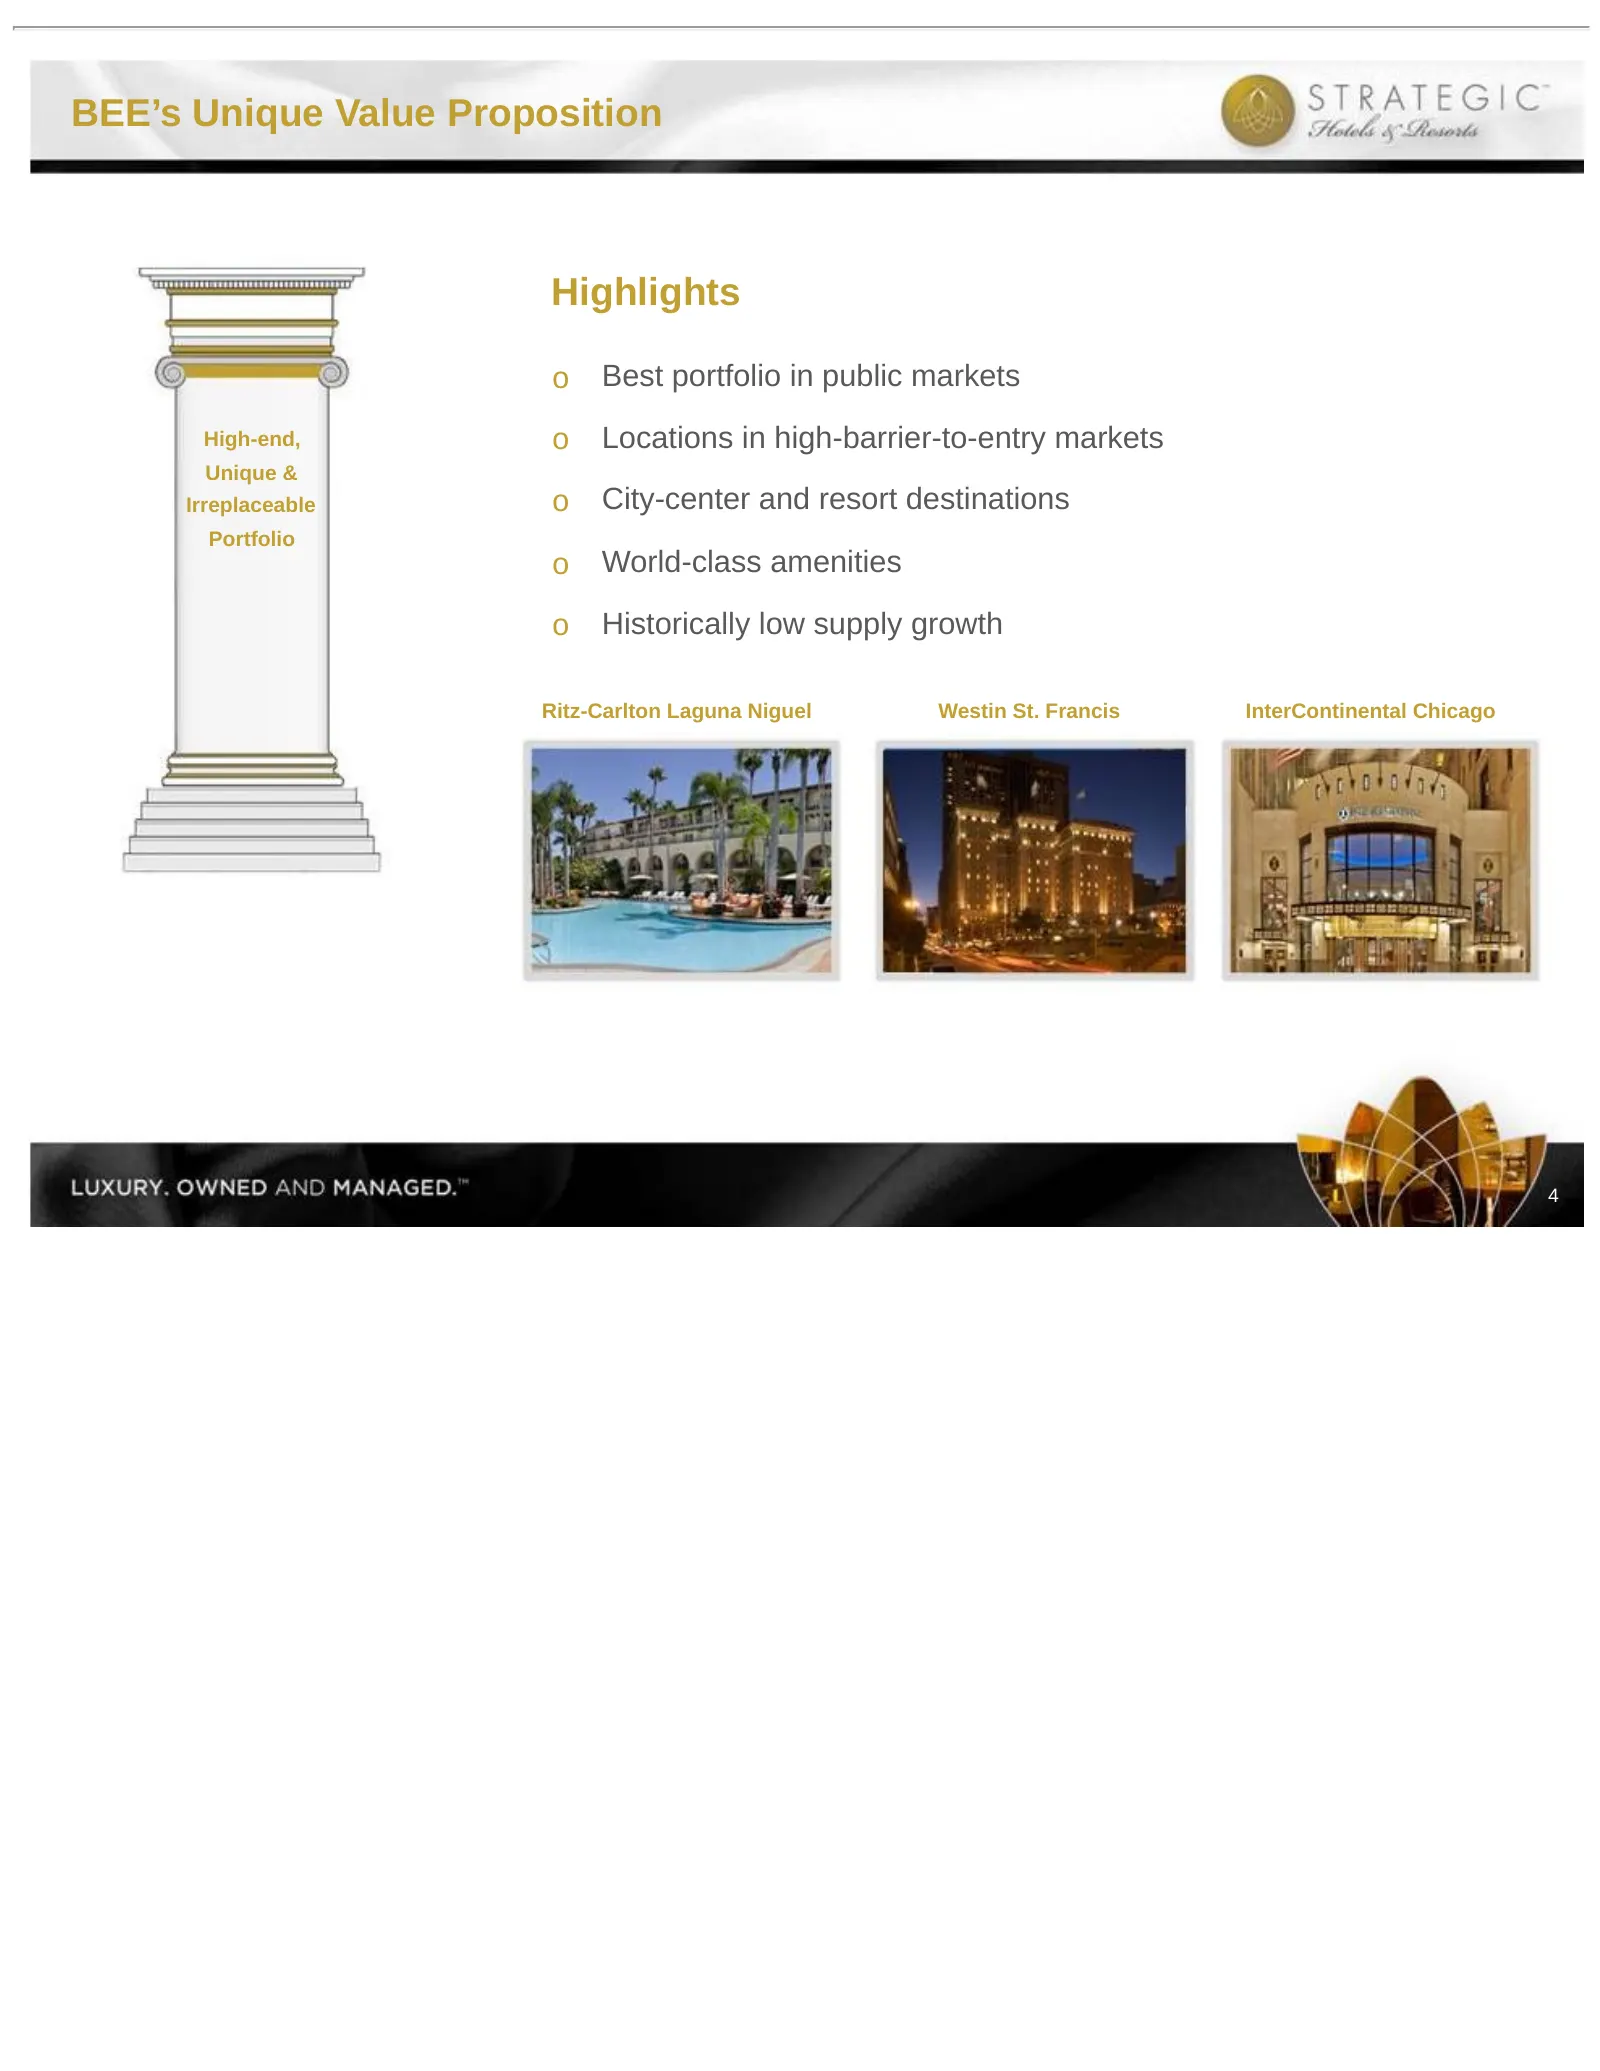
BEE’s Unique Value Proposition Highlights o Best portfolio in public markets High-end, o Locations in high-barrier-to-entry markets Unique & Irreplaceable o City-center and resort destinations Portfolio o World-class amenities o Historically low supply growth Ritz-Carlton Laguna Niguel Westin St. Fr
Slide 6: Industry Leading Asset Management Platform
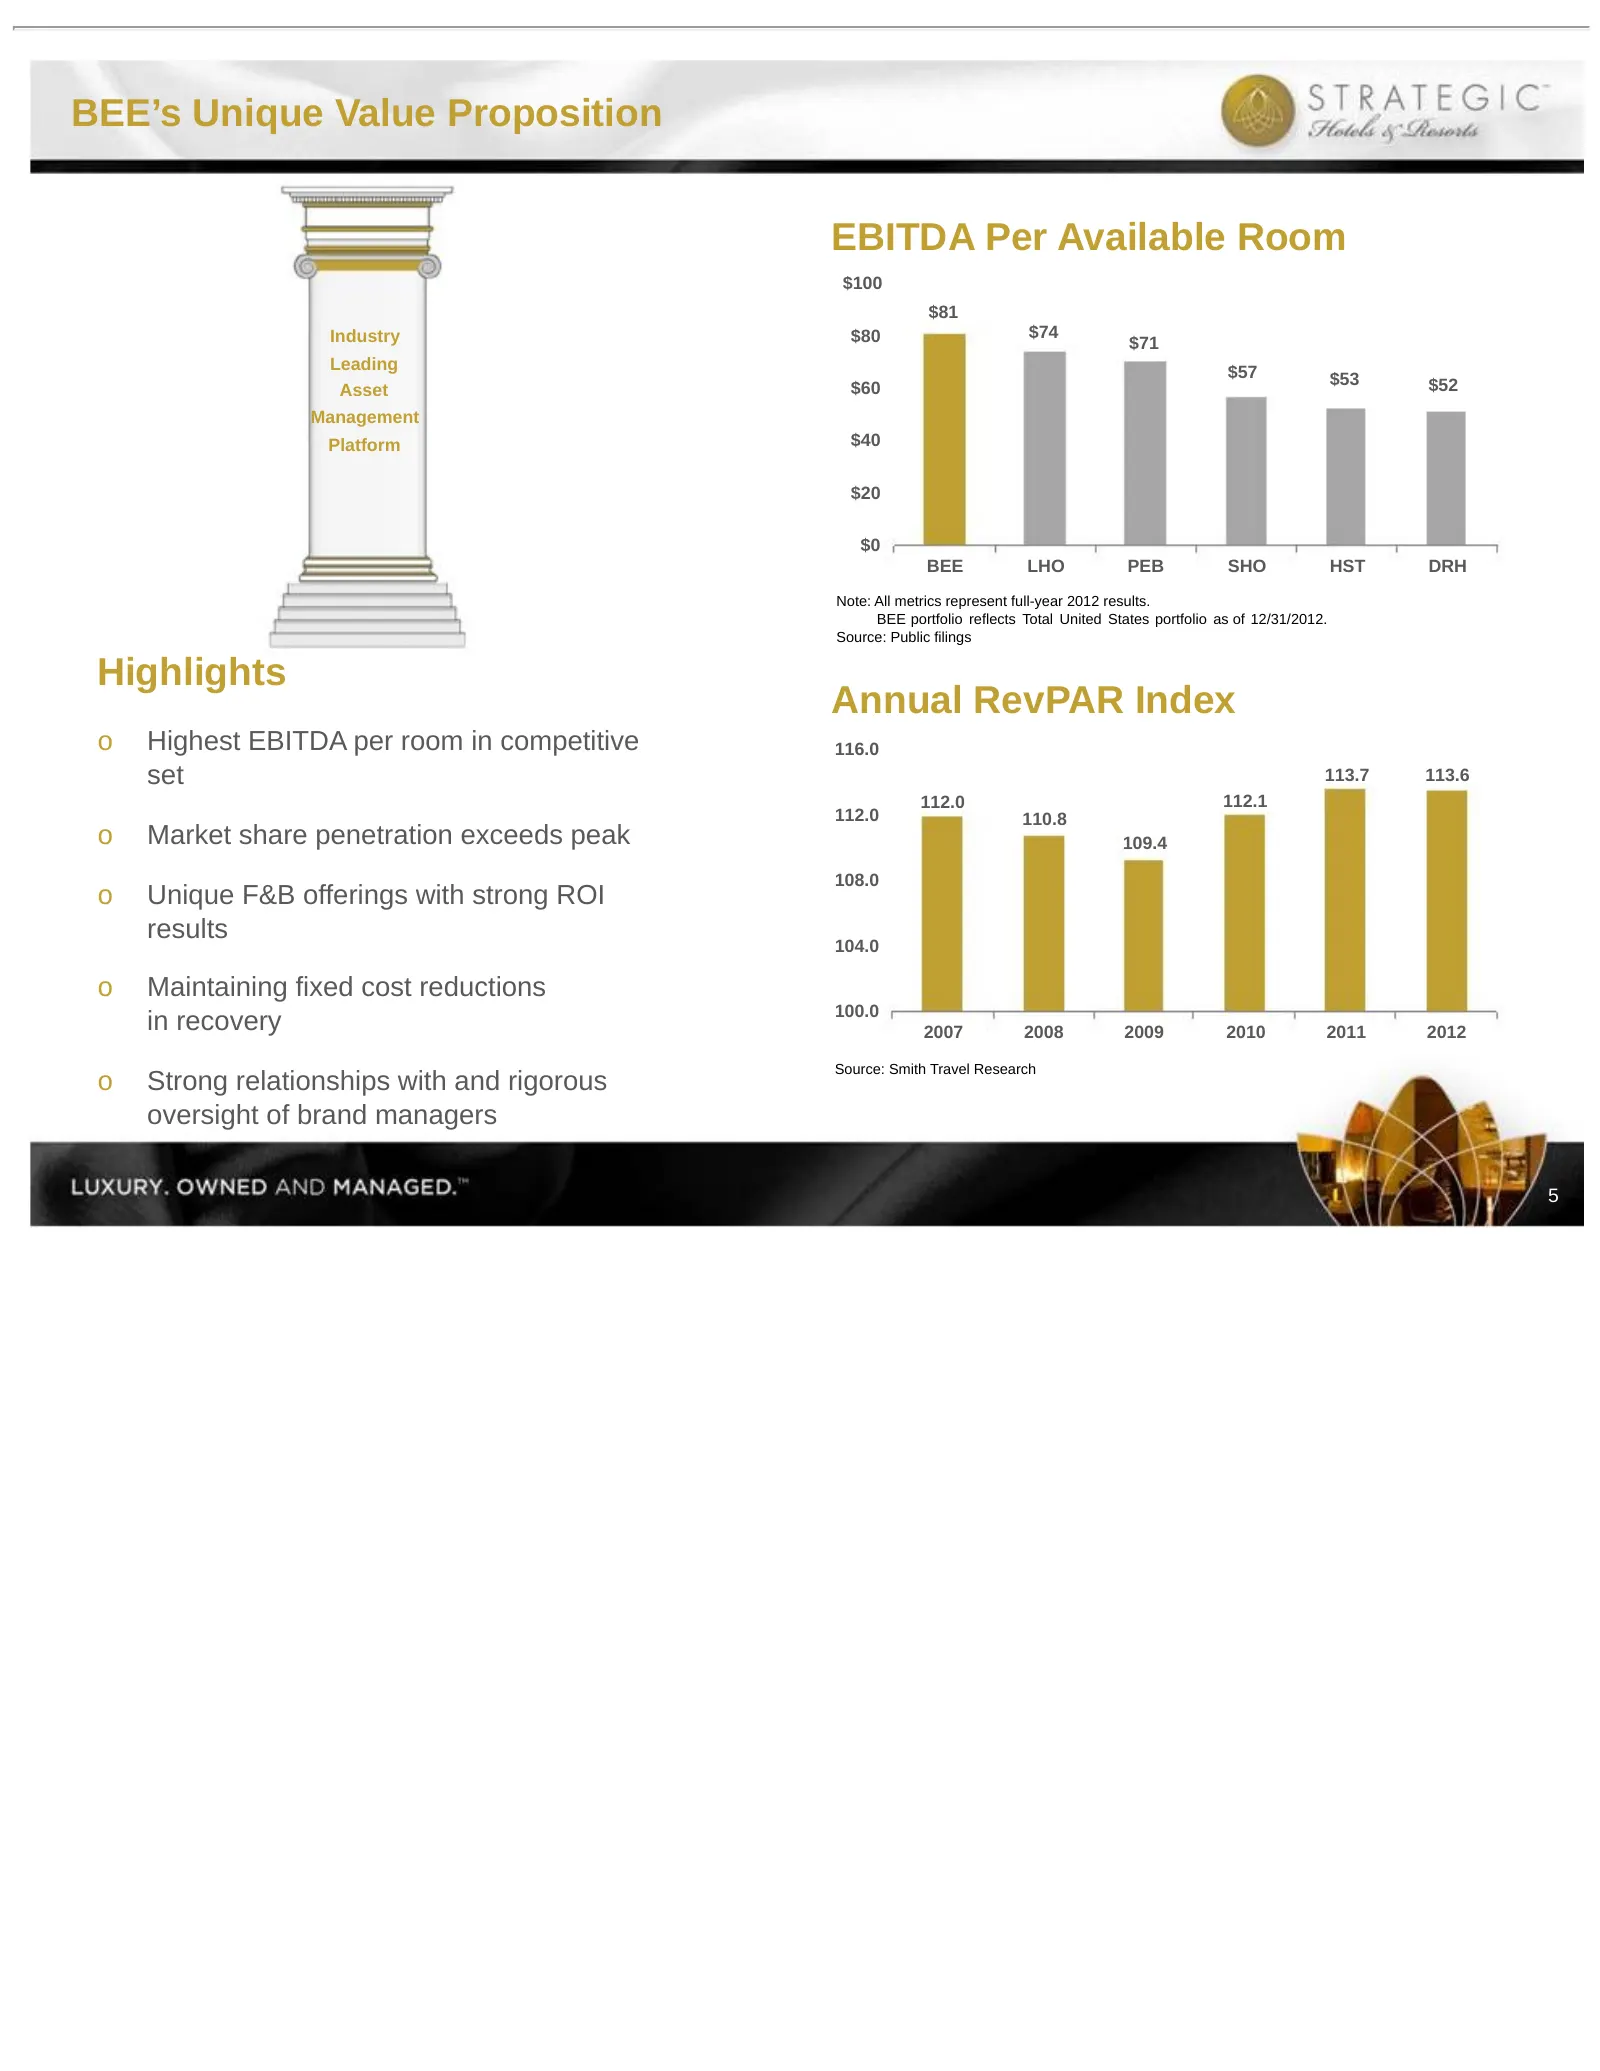
BEE’s Unique Value Proposition EBITDA Per Available Room $100 $81 Industry $80 $74 $71 Leading $57 $53 $52 Asset $60 Management Platform $40 $20 $0 BEE LHO PEB SHO HST DRH Note: All metrics represent full-year 2012 results. BEE portfolio reflects Total United States portfolio as of 12/31/2012. Sourc
Slide 7: Conservative Balance Sheet Management
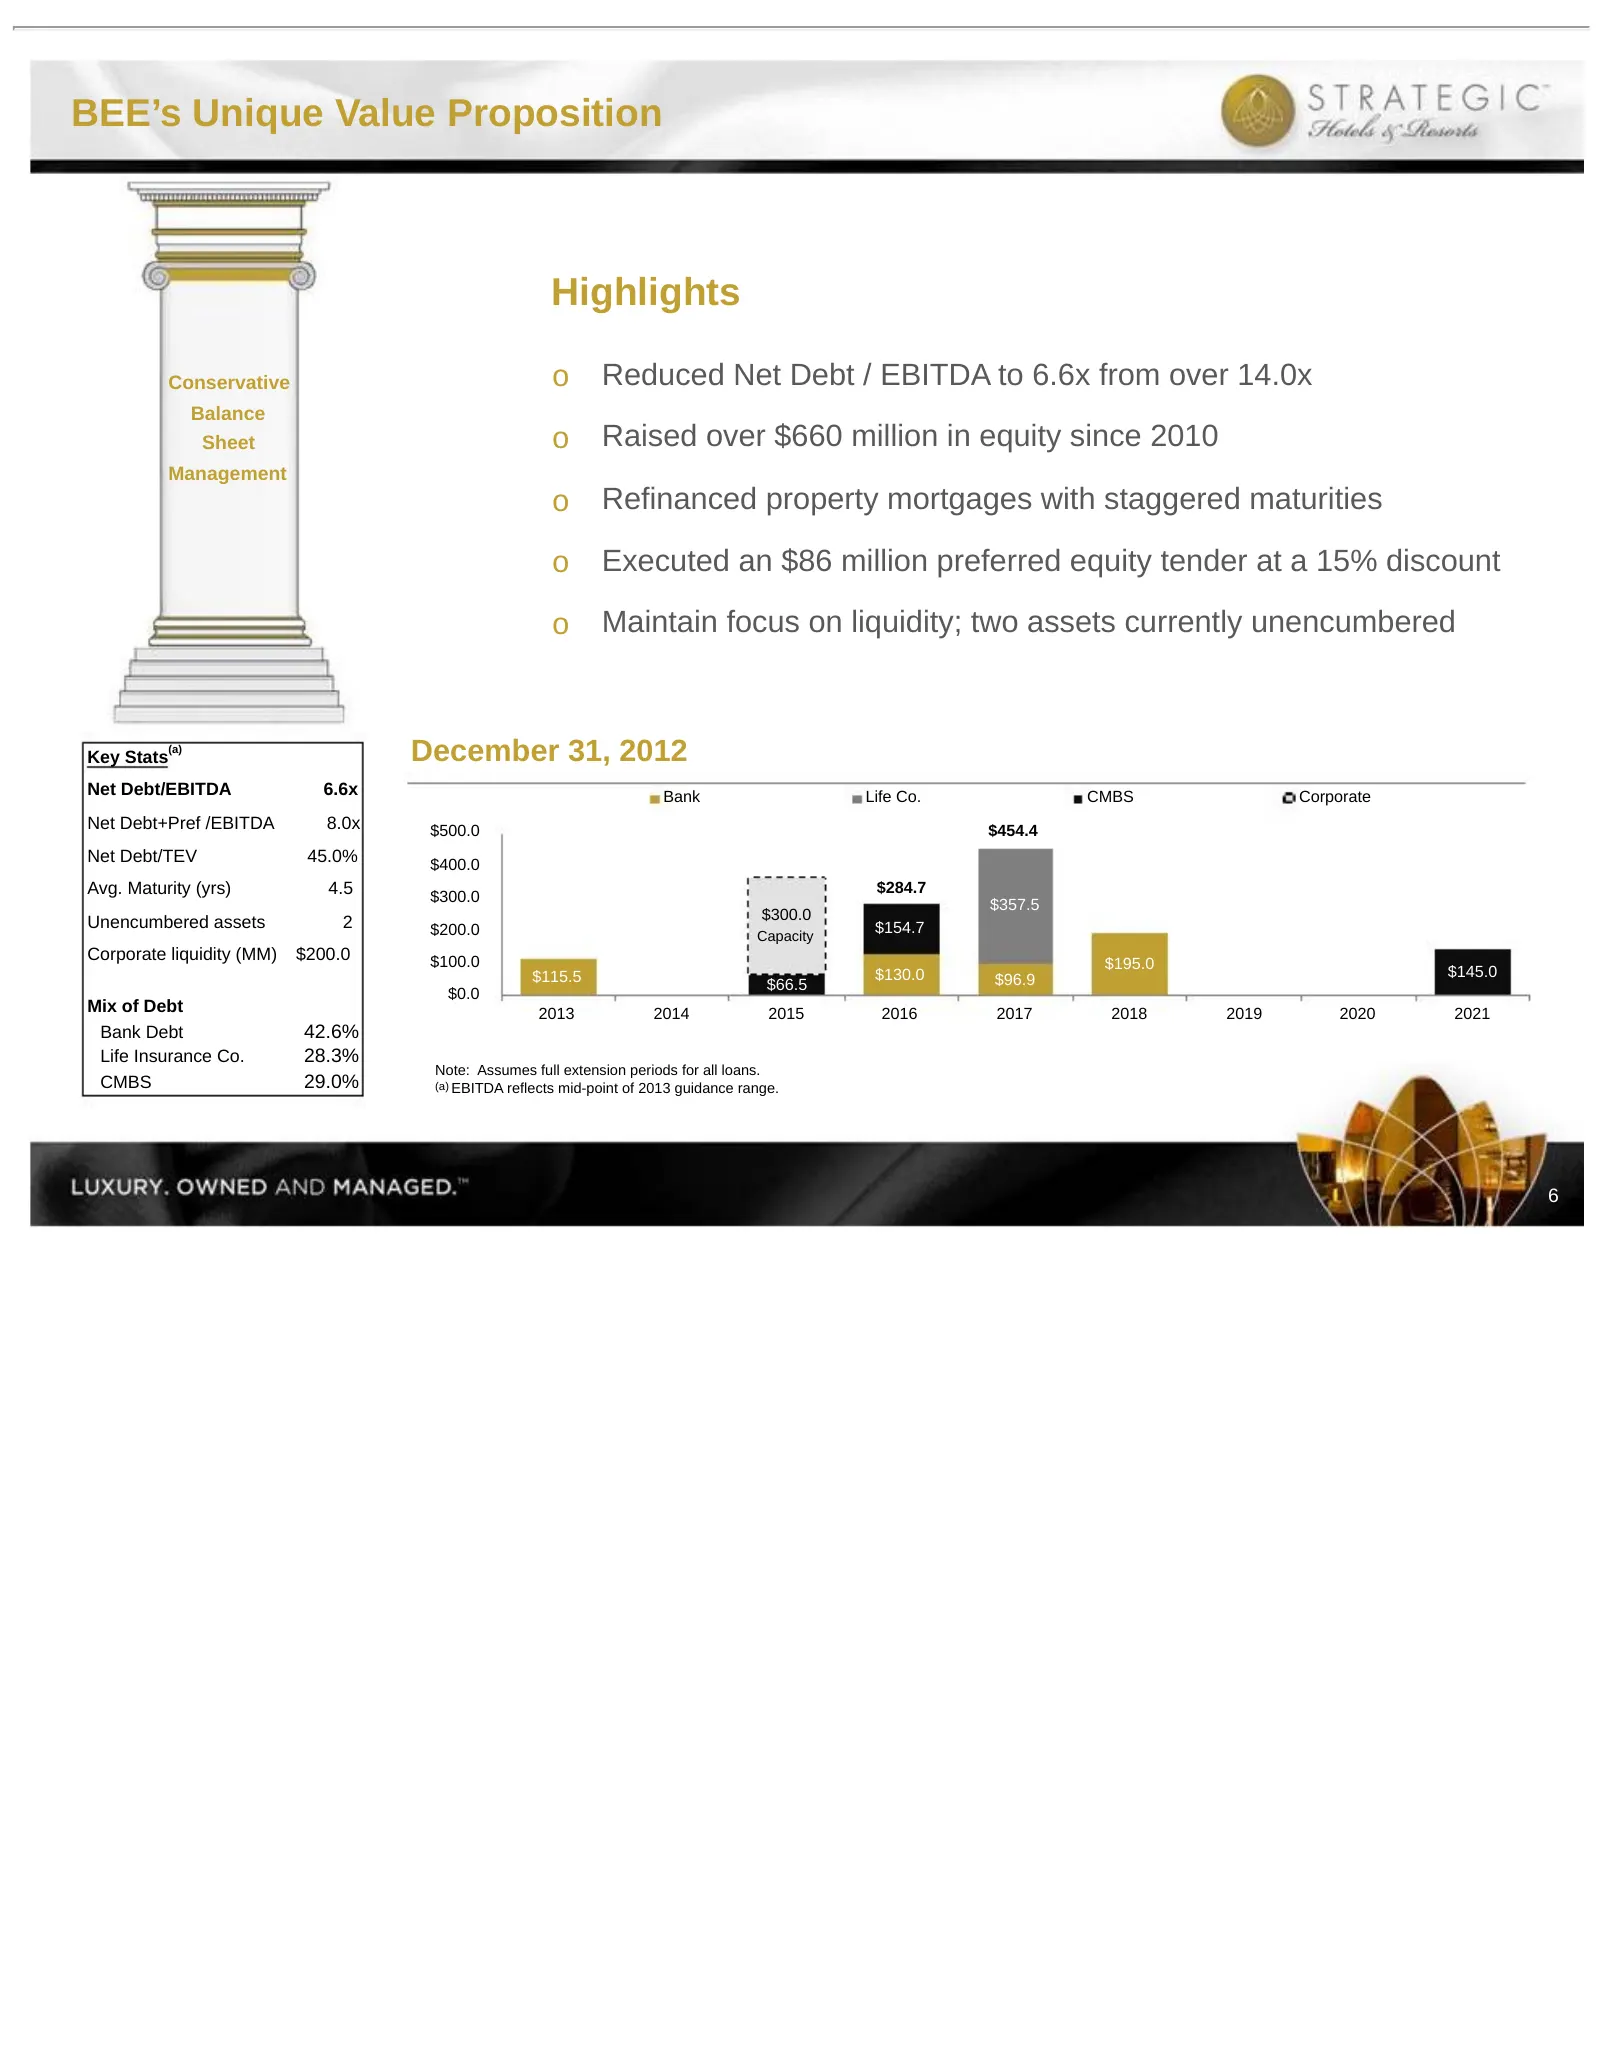
BEE’s Unique Value Proposition Highlights Conservative o Reduced Net Debt / EBITDA to 6.6x from over 14.0x Balance Sheet o Raised over $660 million in equity since 2010 Management o Refinanced property mortgages with staggered maturities o Executed an $86 million preferred equity tender at a 15% dis
Slide 8: Disciplined Capital Allocation Strategy
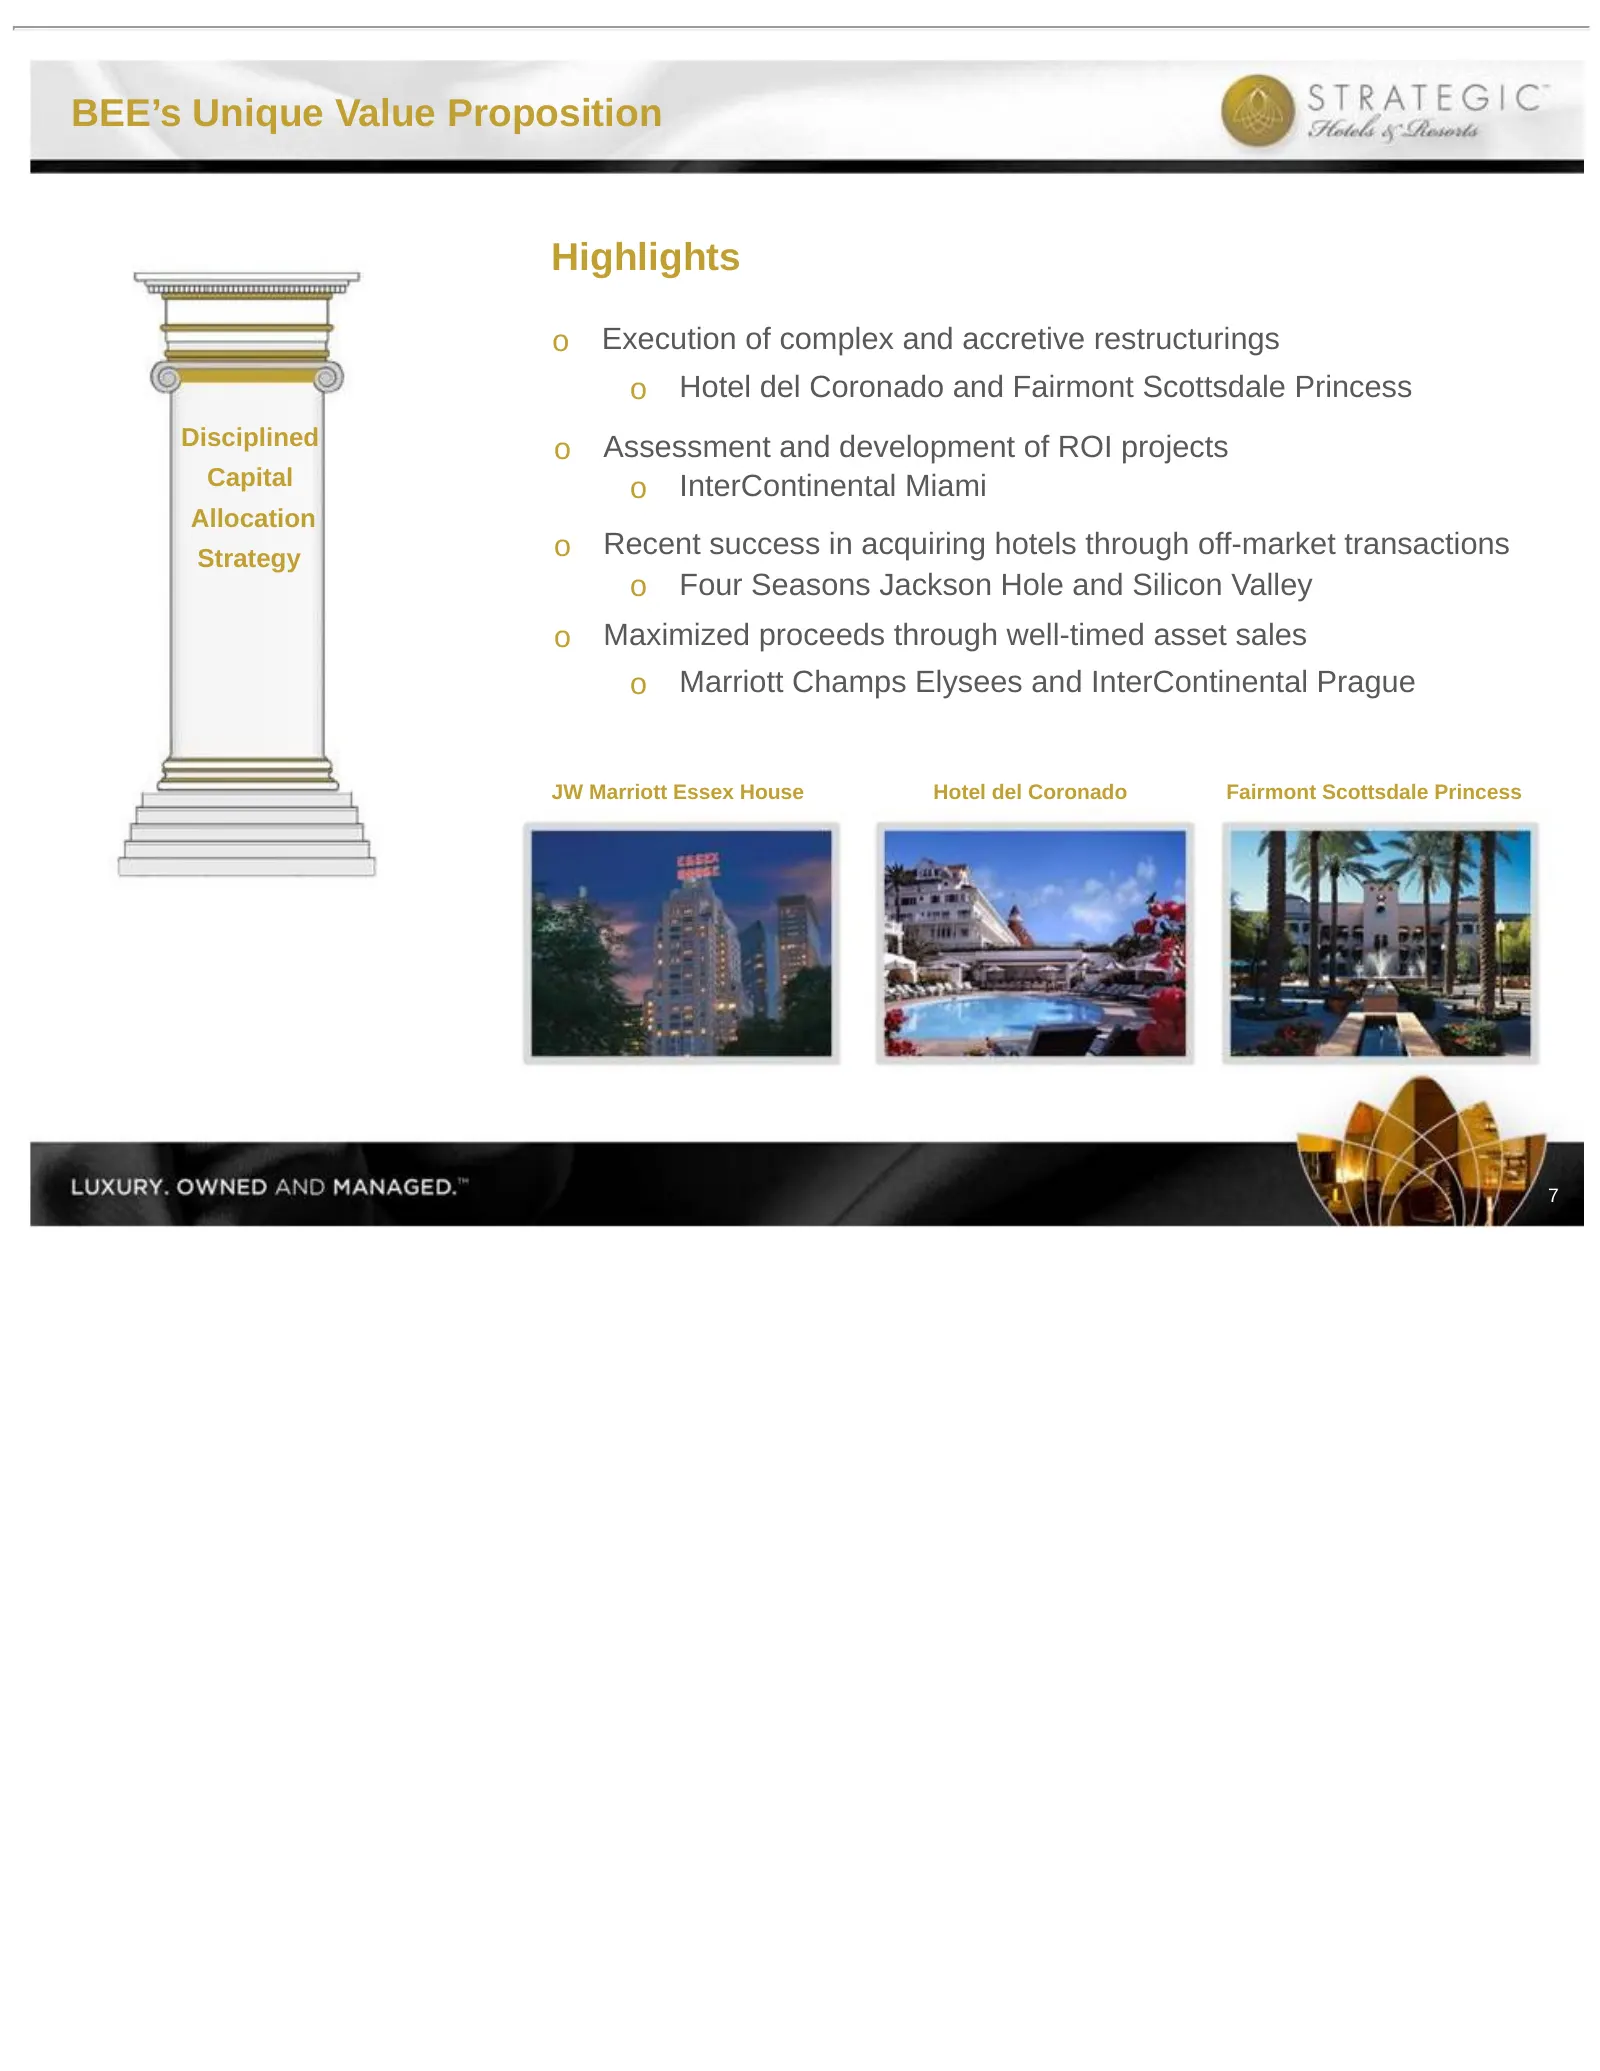
BEE’s Unique Value Proposition Highlights o Execution of complex and accretive restructurings o Hotel del Coronado and Fairmont Scottsdale Princess Disciplined Assessment and development of ROI projects o Capital o InterContinental Miami Allocation Strategy o Recent success in acquiring hotels throu
Slide 9: Company Overview
I. BEE’s Unique Value Proposition II. Company Overview III. Industry Update IV. Operating Trends V. Financial Overview Company Overview 8
Slide 10: Top-Tier Market Exposure
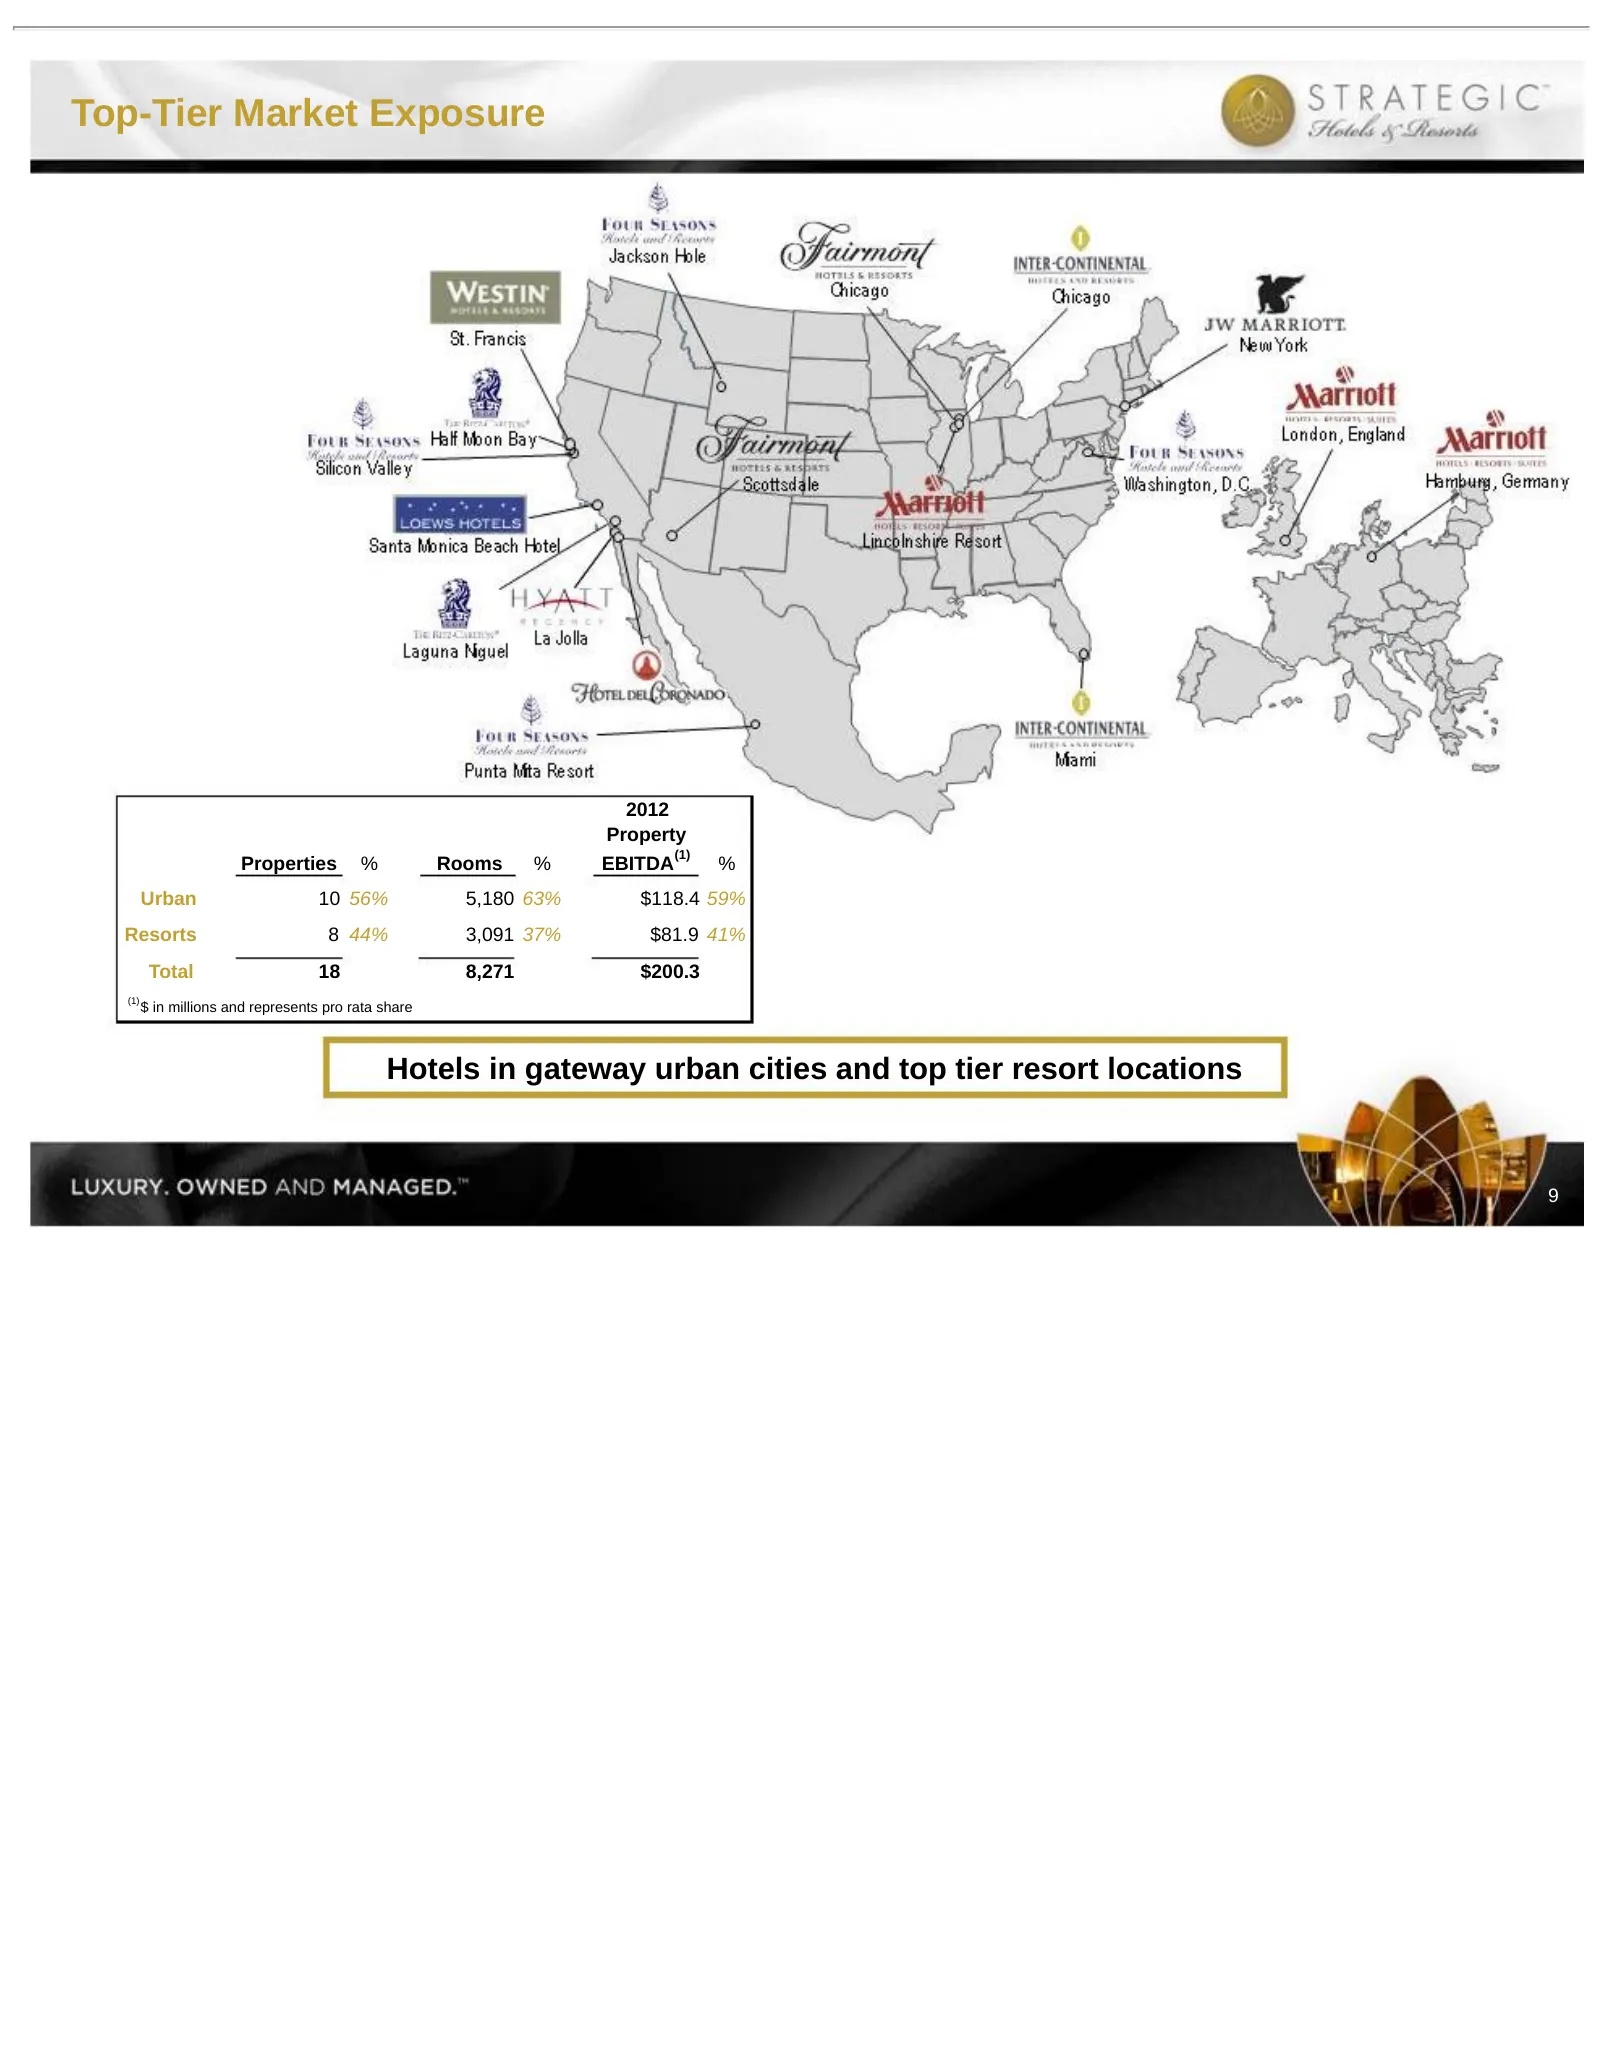
Top-Tier Market Exposure 2012 Property (1) Properties % Rooms % EBITDA % Urban 10 56% 5,180 63% $118.4 59% Resorts 8 44% 3,091 37% $81.9 41% Total 18 8,271 $200.3 (1) $ in millions and represents pro rata share Hotels in gateway urban cities and top tier resort locations 9
Slide 11: Portfolio Well-Positioned to Enhance Cash Flow Growth
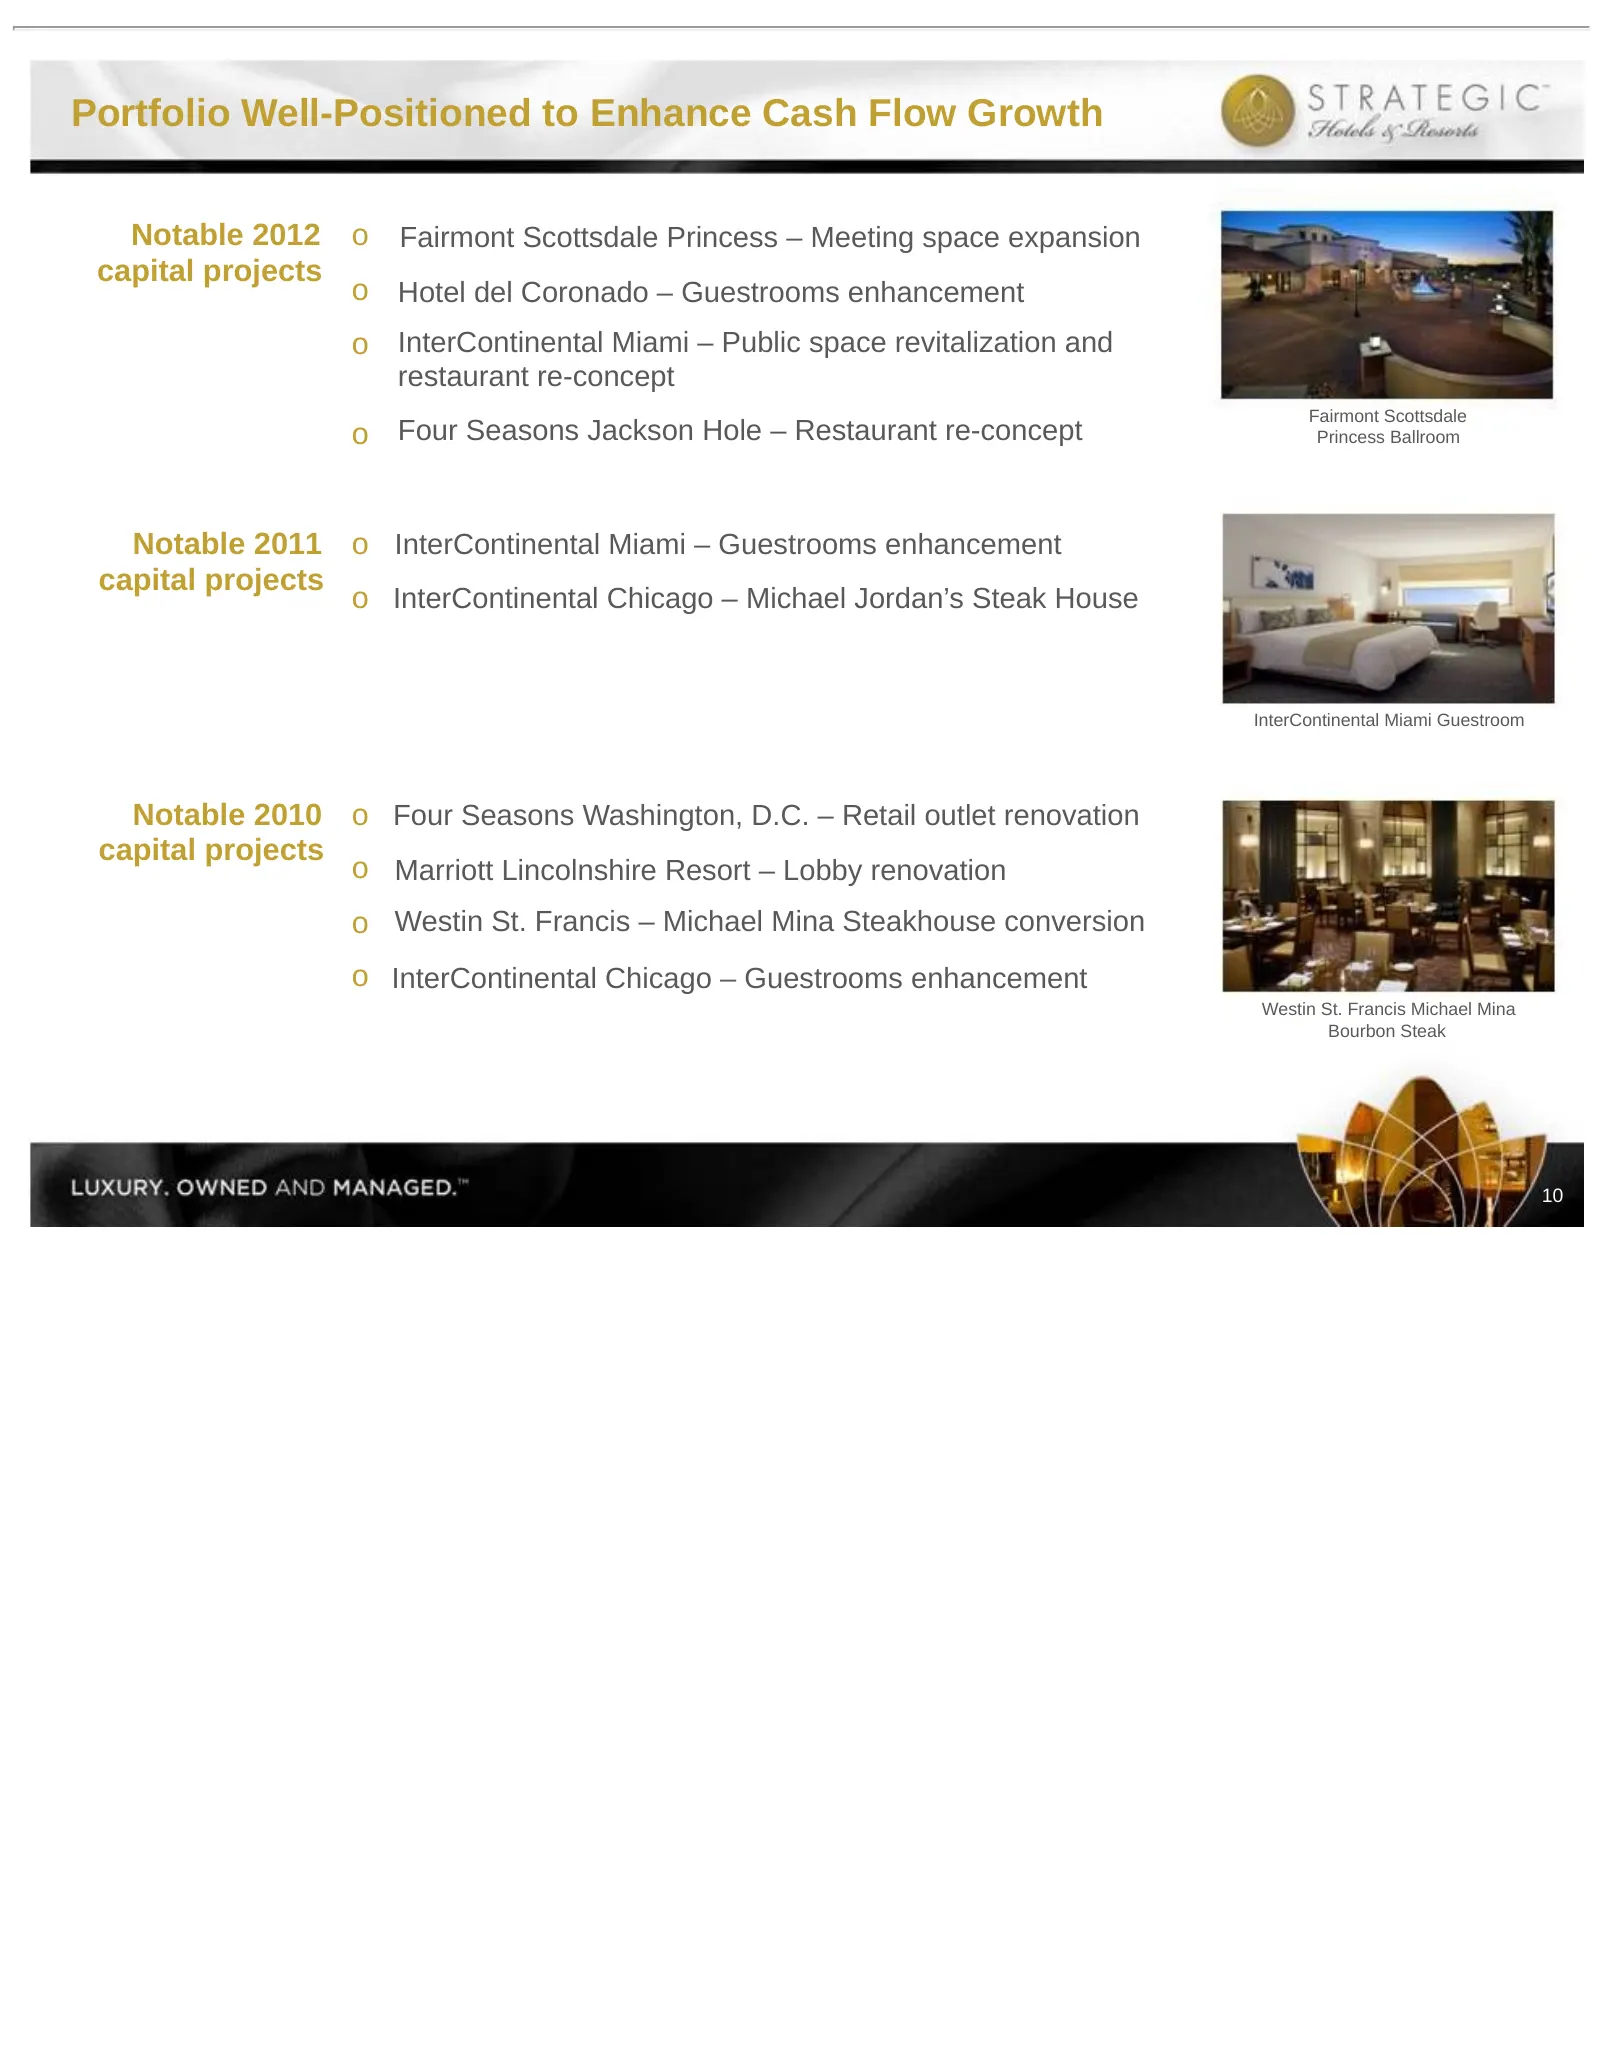
Portfolio Well-Positioned to Enhance Cash Flow Growth Notable 2012 o Fairmont Scottsdale Princess – Meeting space expansion capital projects o Hotel del Coronado – Guestrooms enhancement o InterContinental Miami – Public space revitalization and restaurant pt re-concept Fairmont Scottsdale o Four Se
Slide 12: In Progress / Planned Capital Projects
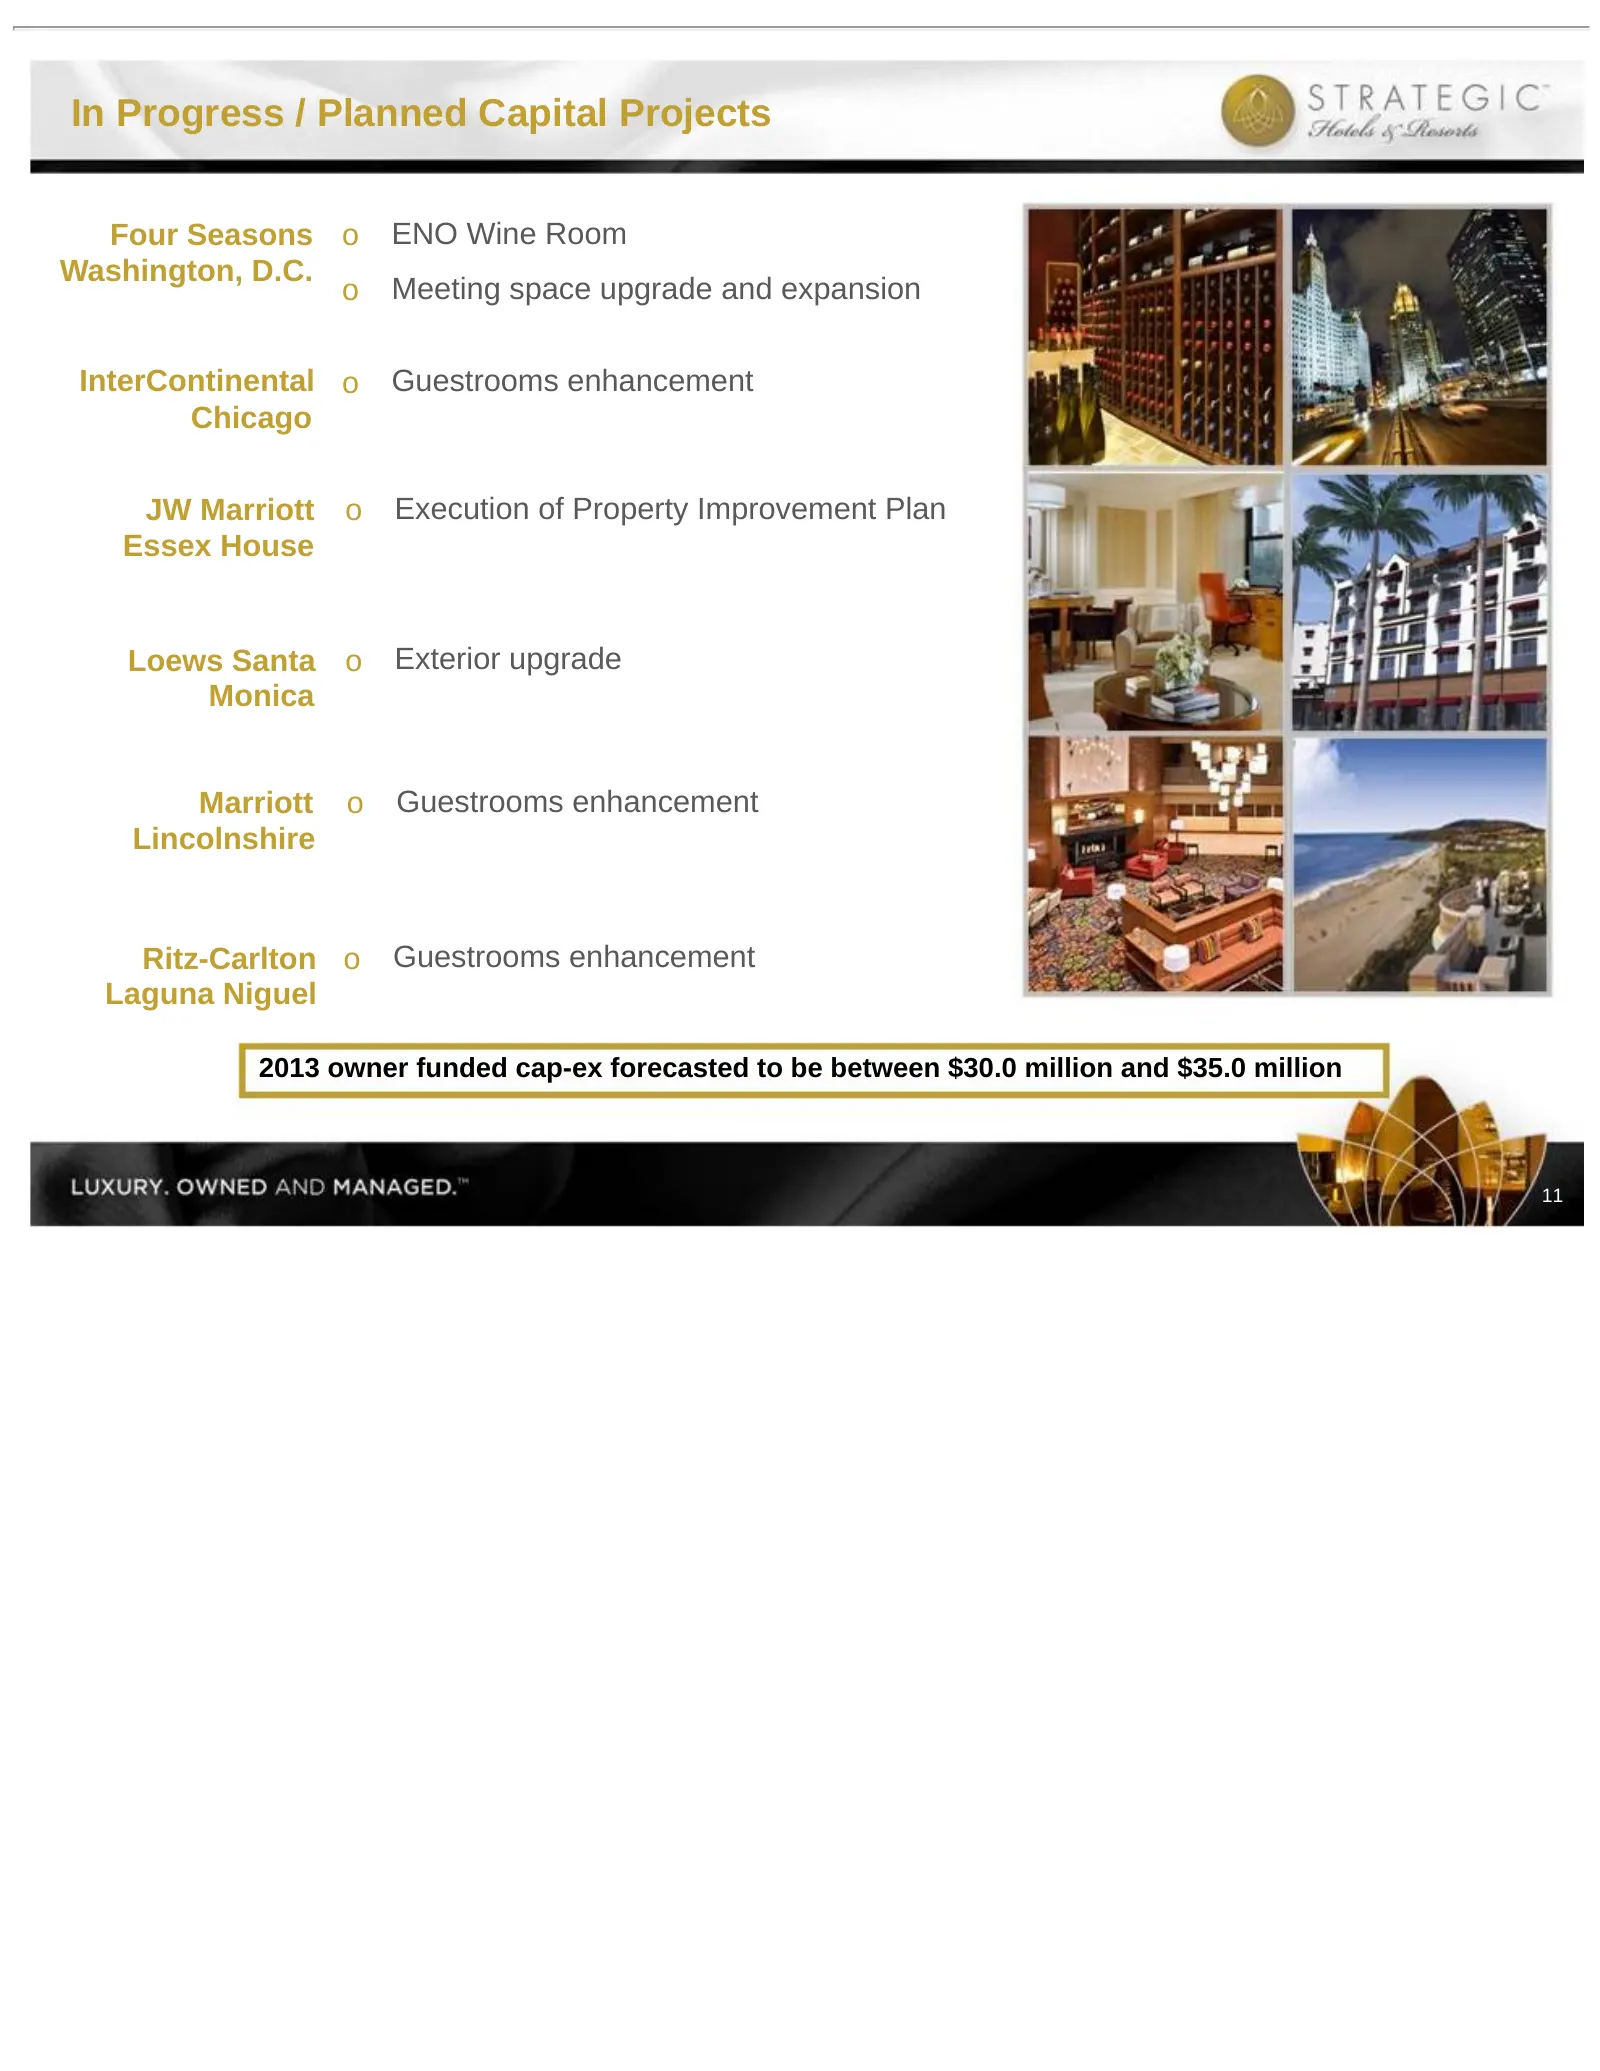
In Progress / Planned Capital Projects Four Seasons o ENO Wine Room Washington, D.C. o Meeting space upgrade and expansion InterContinental o Guestrooms enhancement Chicago JW Marriott o Execution of Property Improvement Plan Essex House Loews Santa o Exterior upgrade Monica Marriott o Guestrooms en
Slide 13: Fairmont Scottsdale Princess – Palomino Ballroom
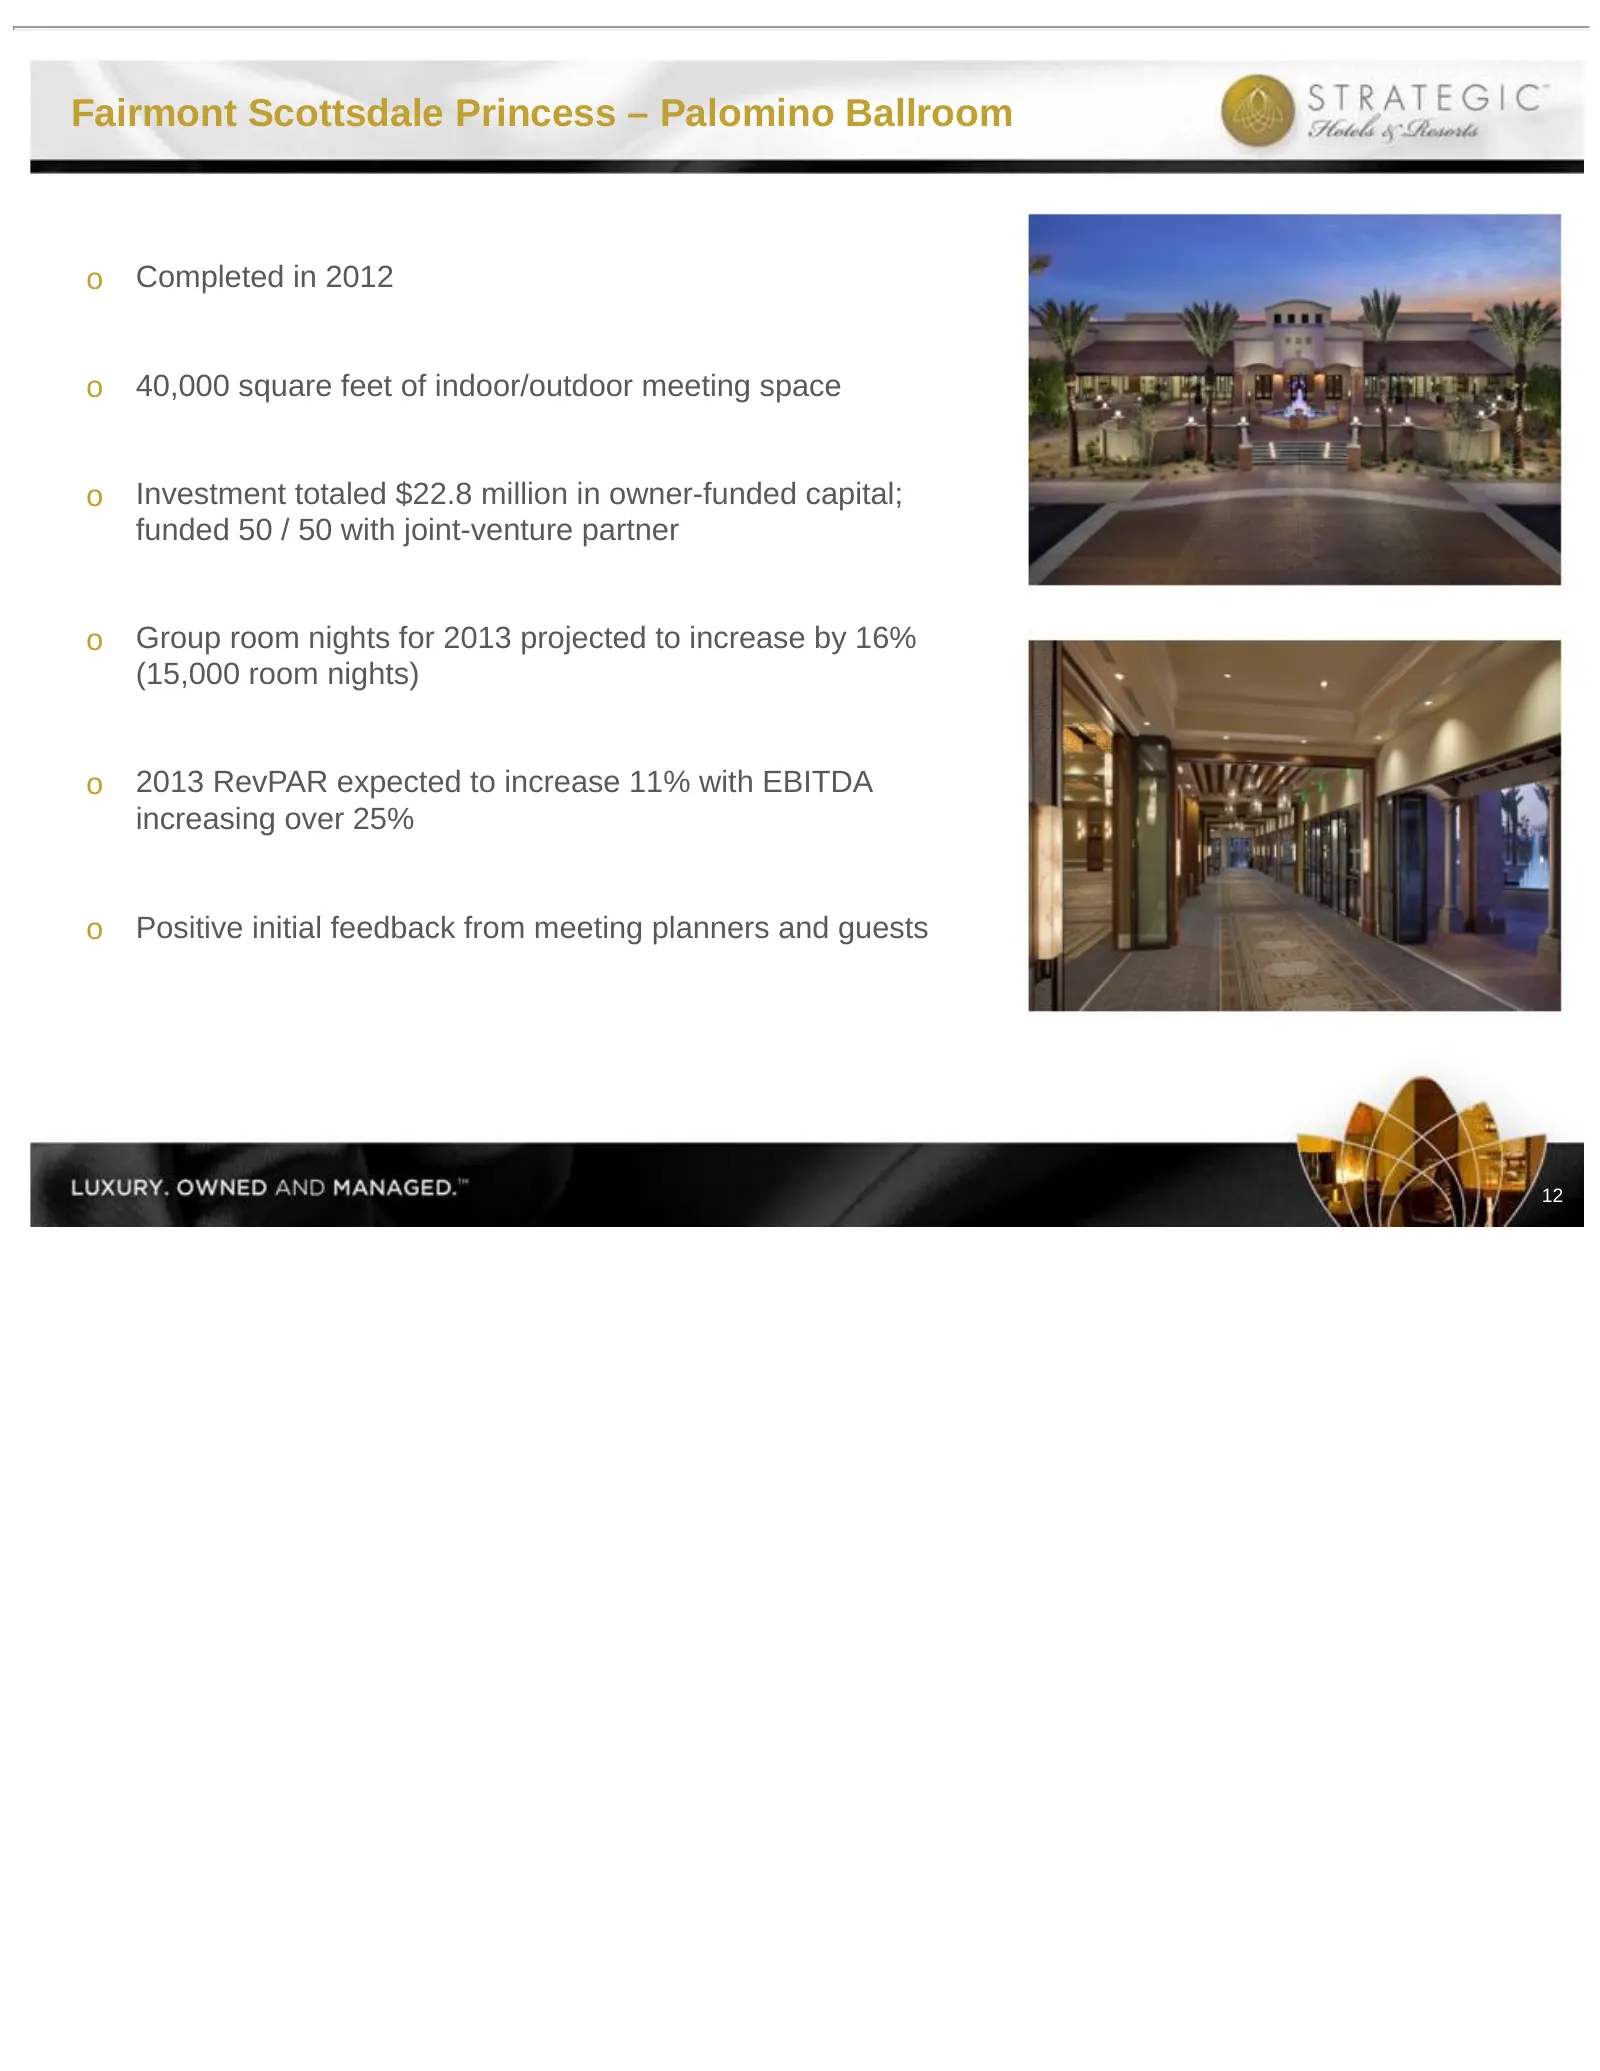
Fairmont Scottsdale Princess – Palomino Ballroom o Completed in 2012 o 40,000 square feet of indoor/outdoor meeting space o Investment totaled $22.8 million in owner-funded capital; funded 50 / 50 with joint-venture partner o Group room nights for 2013 projected to increase by 16% (15,000 room night
Slide 14: InterContinental Miami – Innovative Repositioning
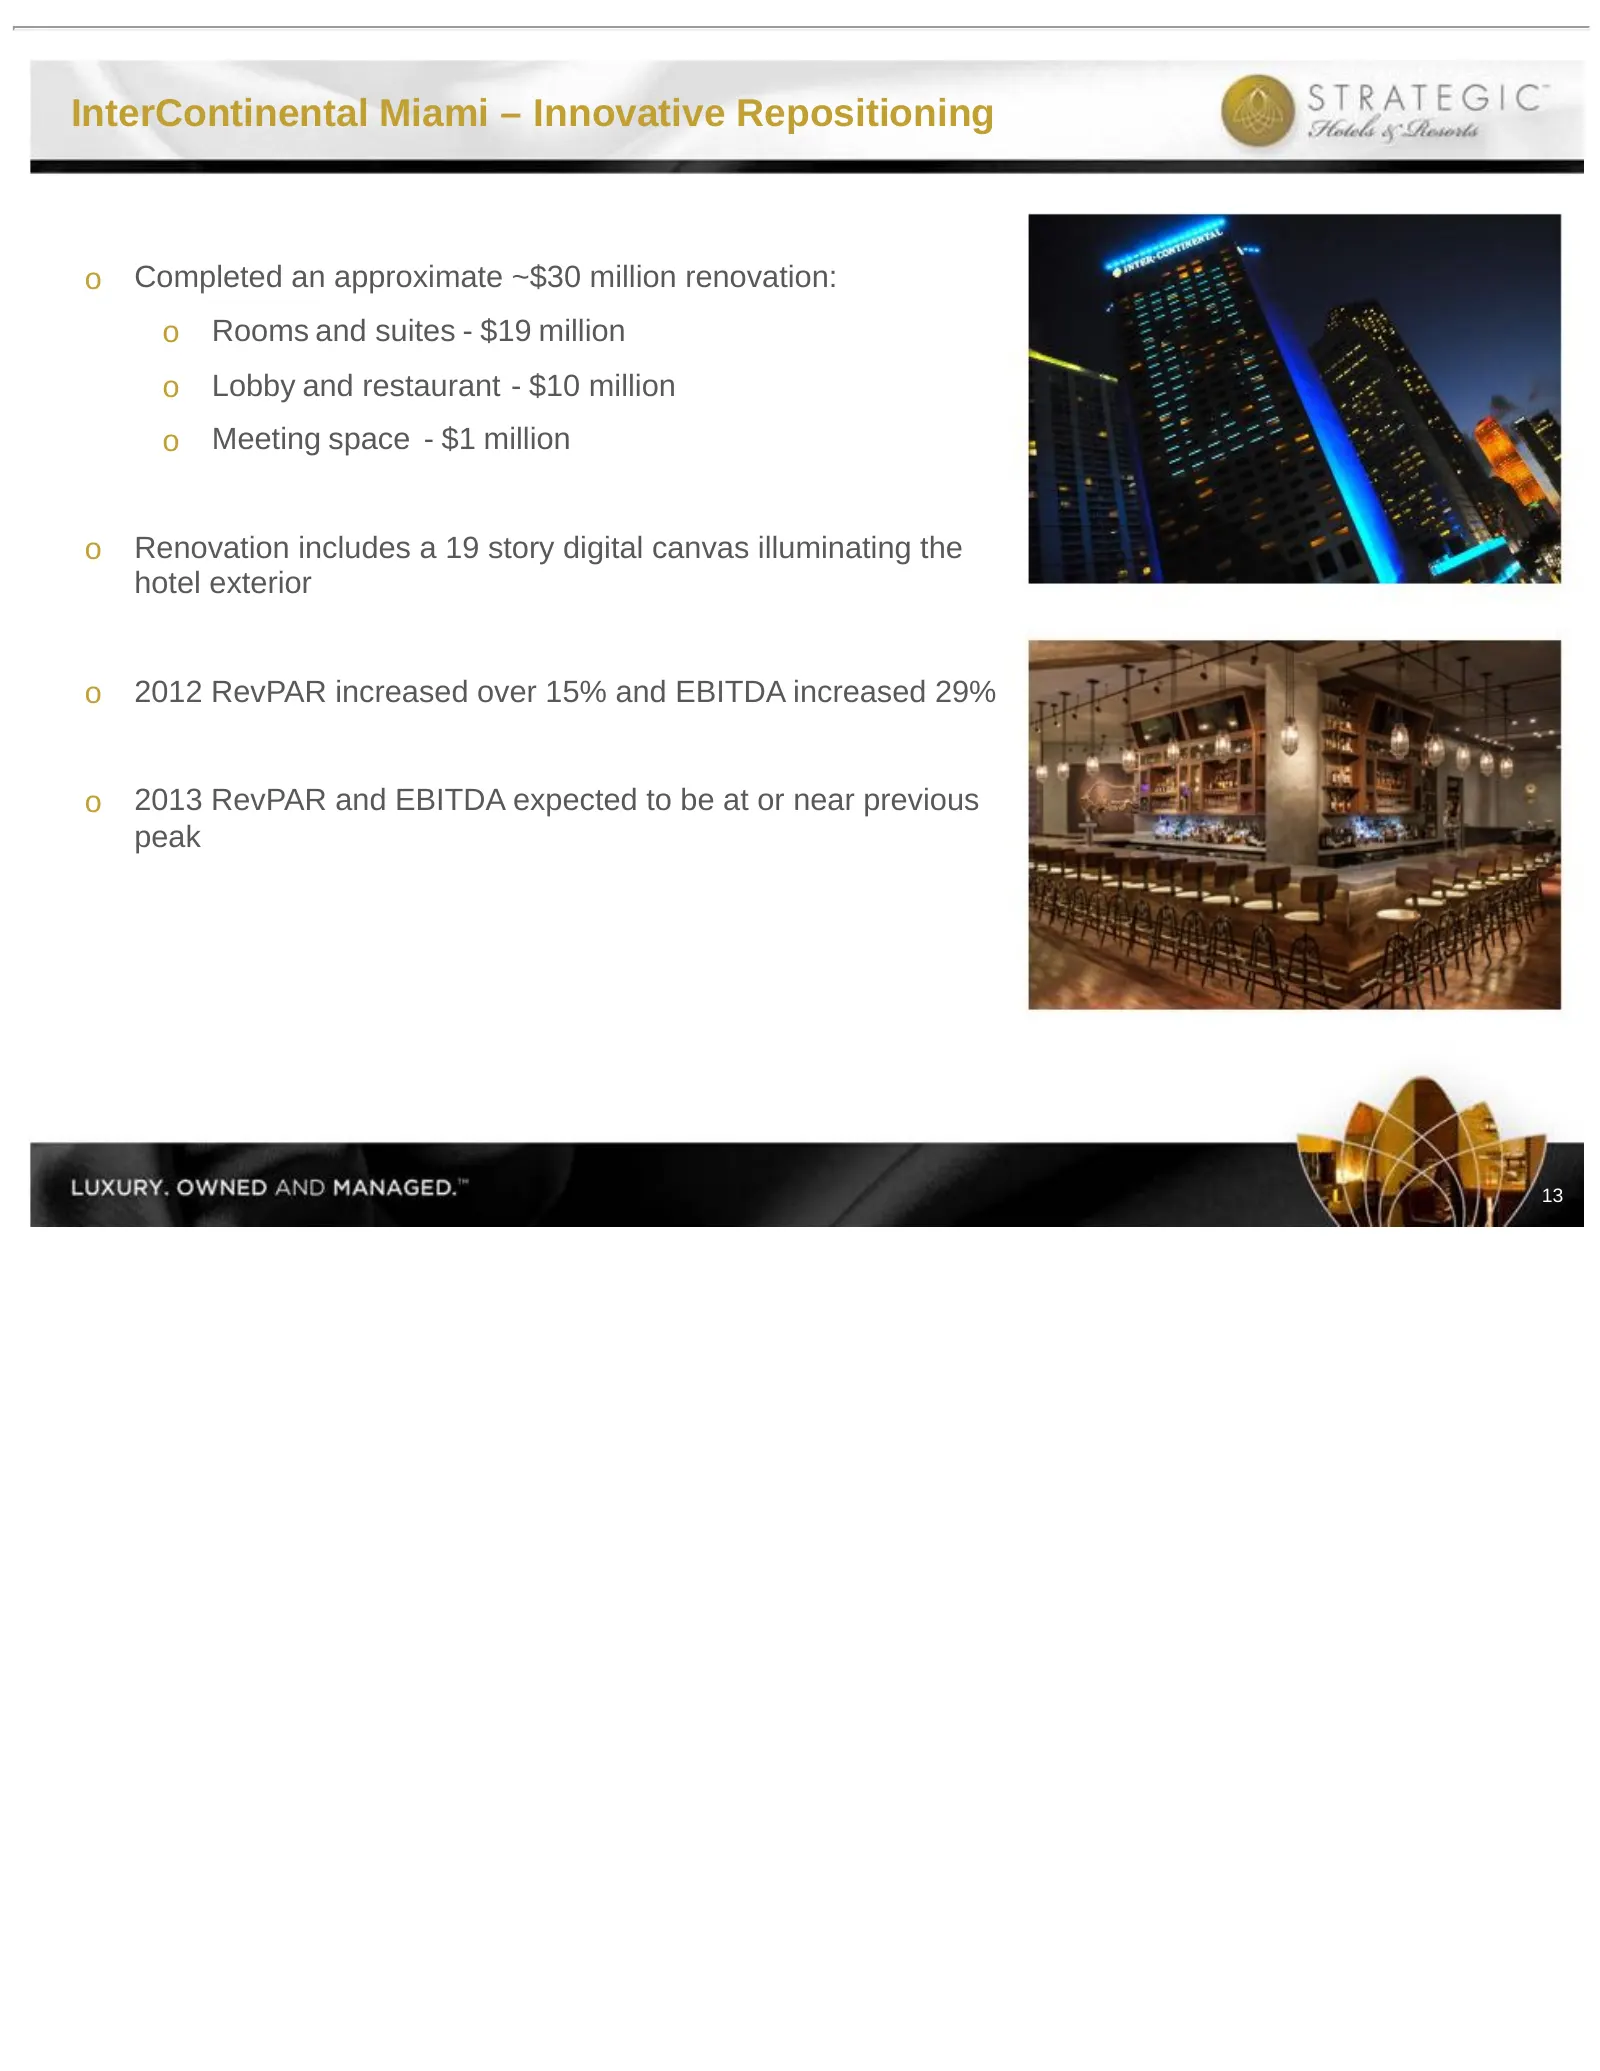
InterContinental Miami – Innovative Repositioning o Completed an approximate ~$30 million renovation: o Rooms and suites - $19 million o Lobby and restaurant - $10 million o Meeting space - $1 million o Renovation includes a 19 story digital canvas illuminating the hotel exterior o 2012 RevPAR incre
Slide 15: Industry Update
I. BEE’s Unique Value Proposition II. Company Overview III. Industry Update IV. Operating Trends V. Financial Overview Industry Update 14
Slide 16: Luxury Lodging Supply & Demand Dynamics
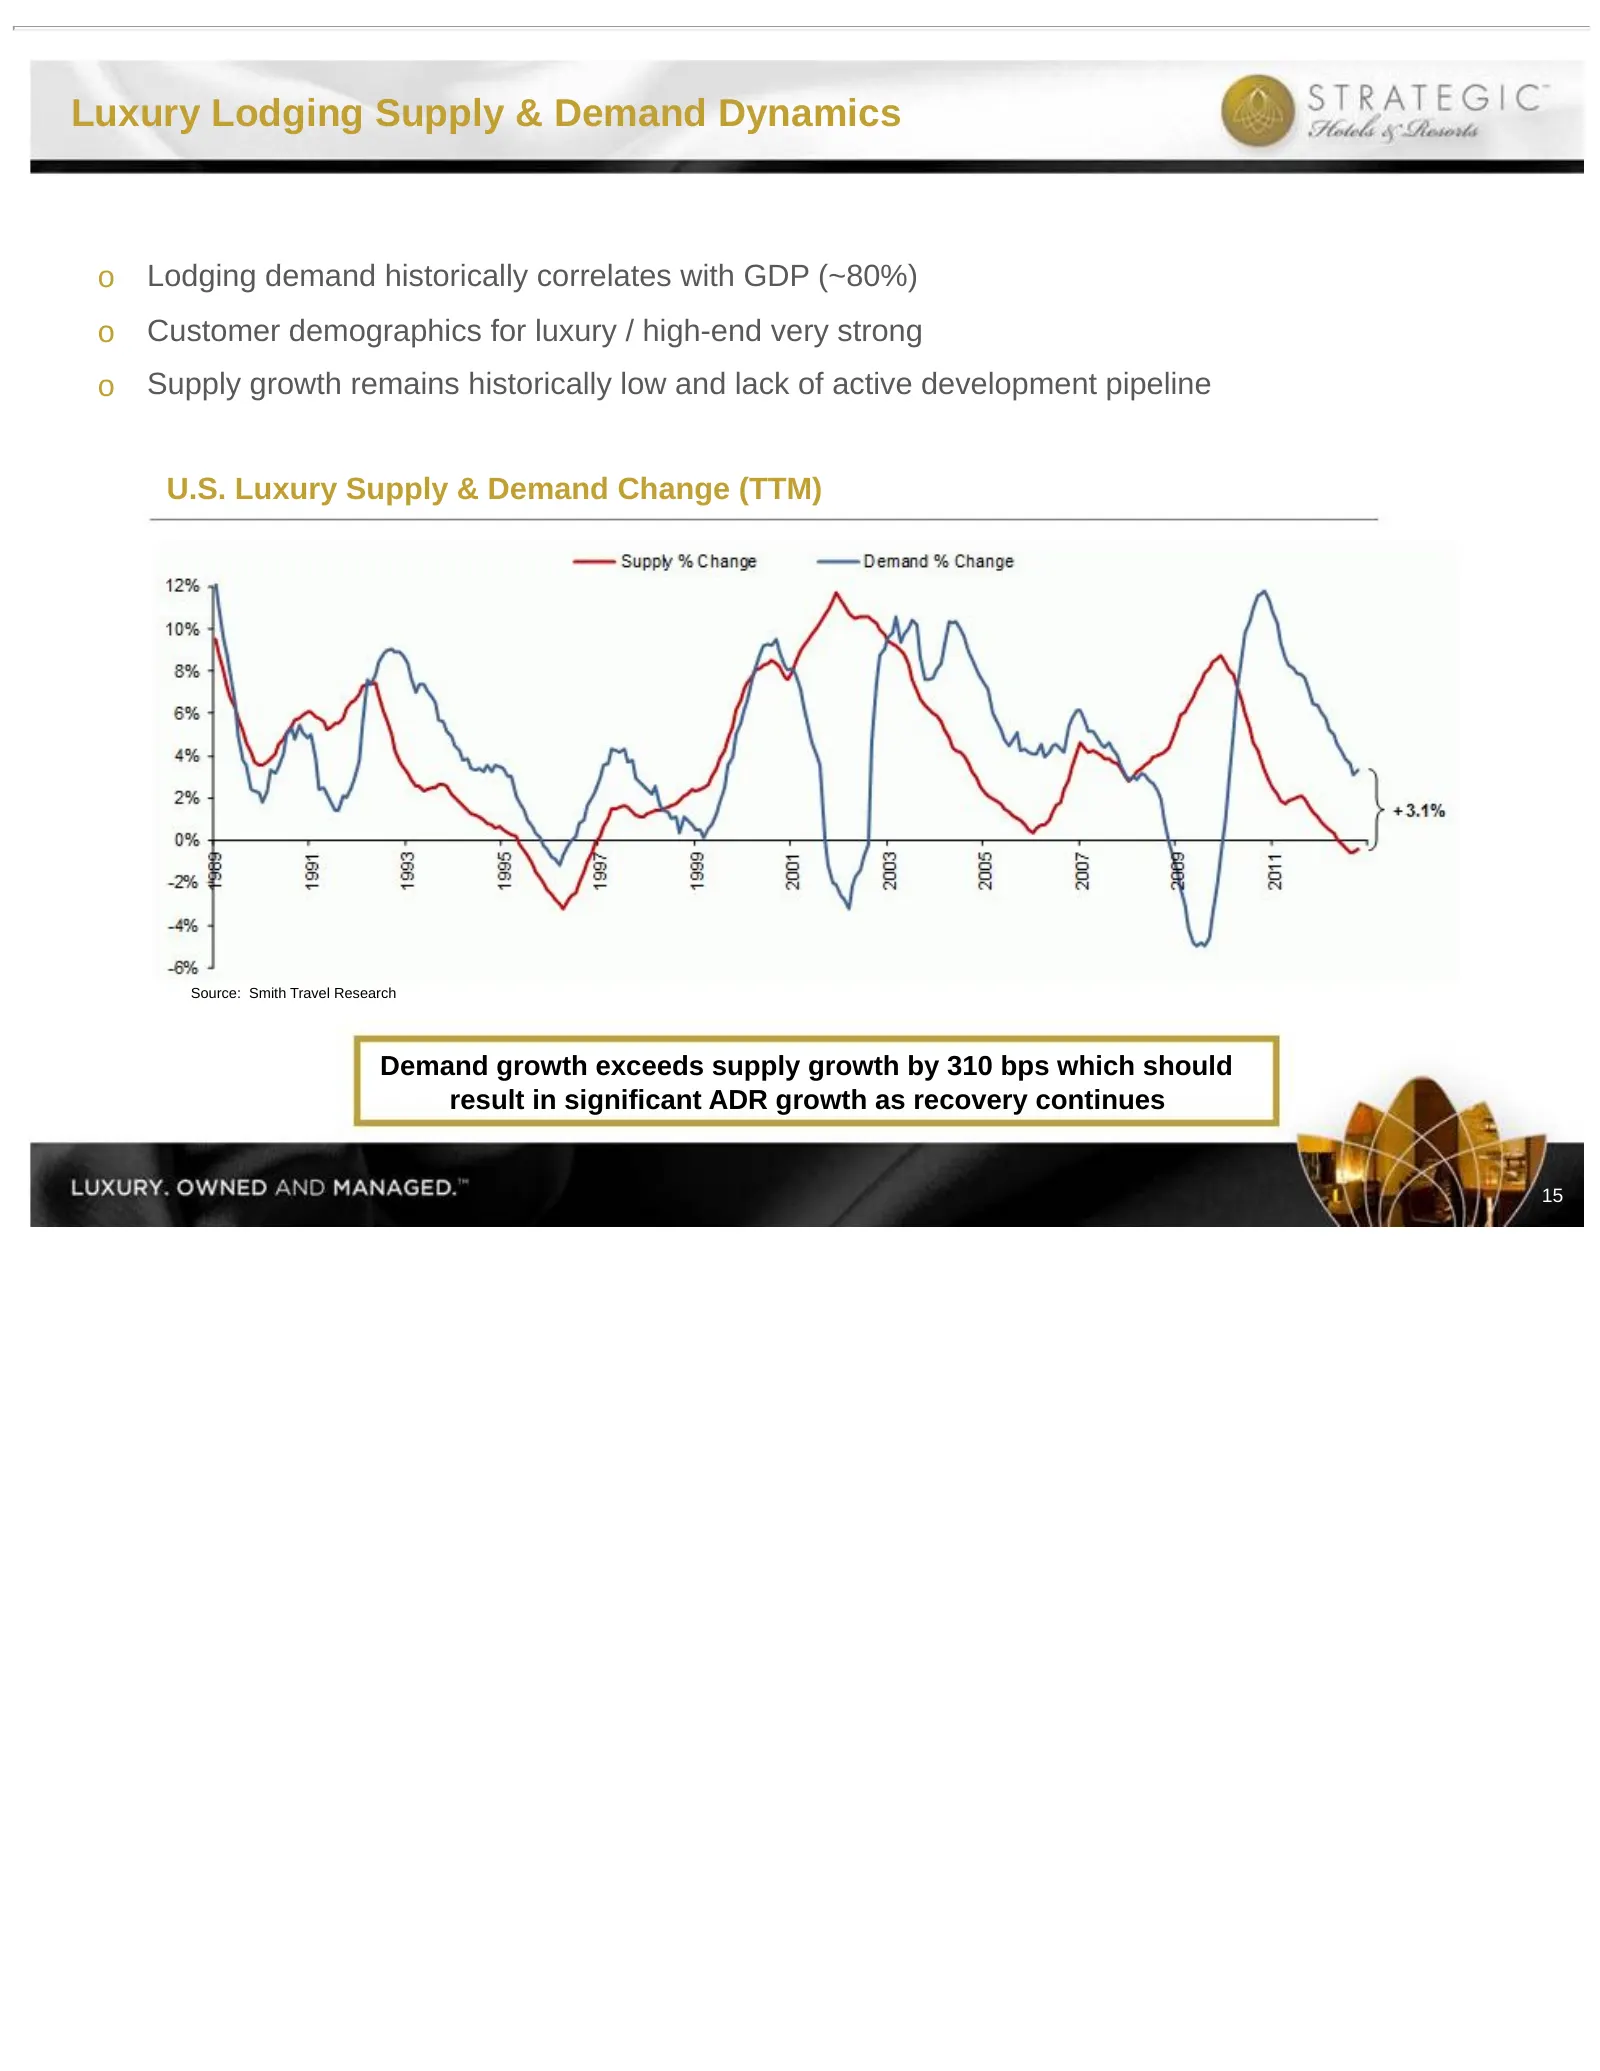
Luxury Lodging Supply & Demand Dynamics o Lodging demand historically correlates with GDP (~80%) o Customer demographics for luxury / high-end very strong o Supply growth remains historically low and lack of active development pipeline U.S. Luxury Supply & Demand Change (TTM) Source: Smith Travel Re
Slide 17: Luxury Hotels Outperform in a Recovery
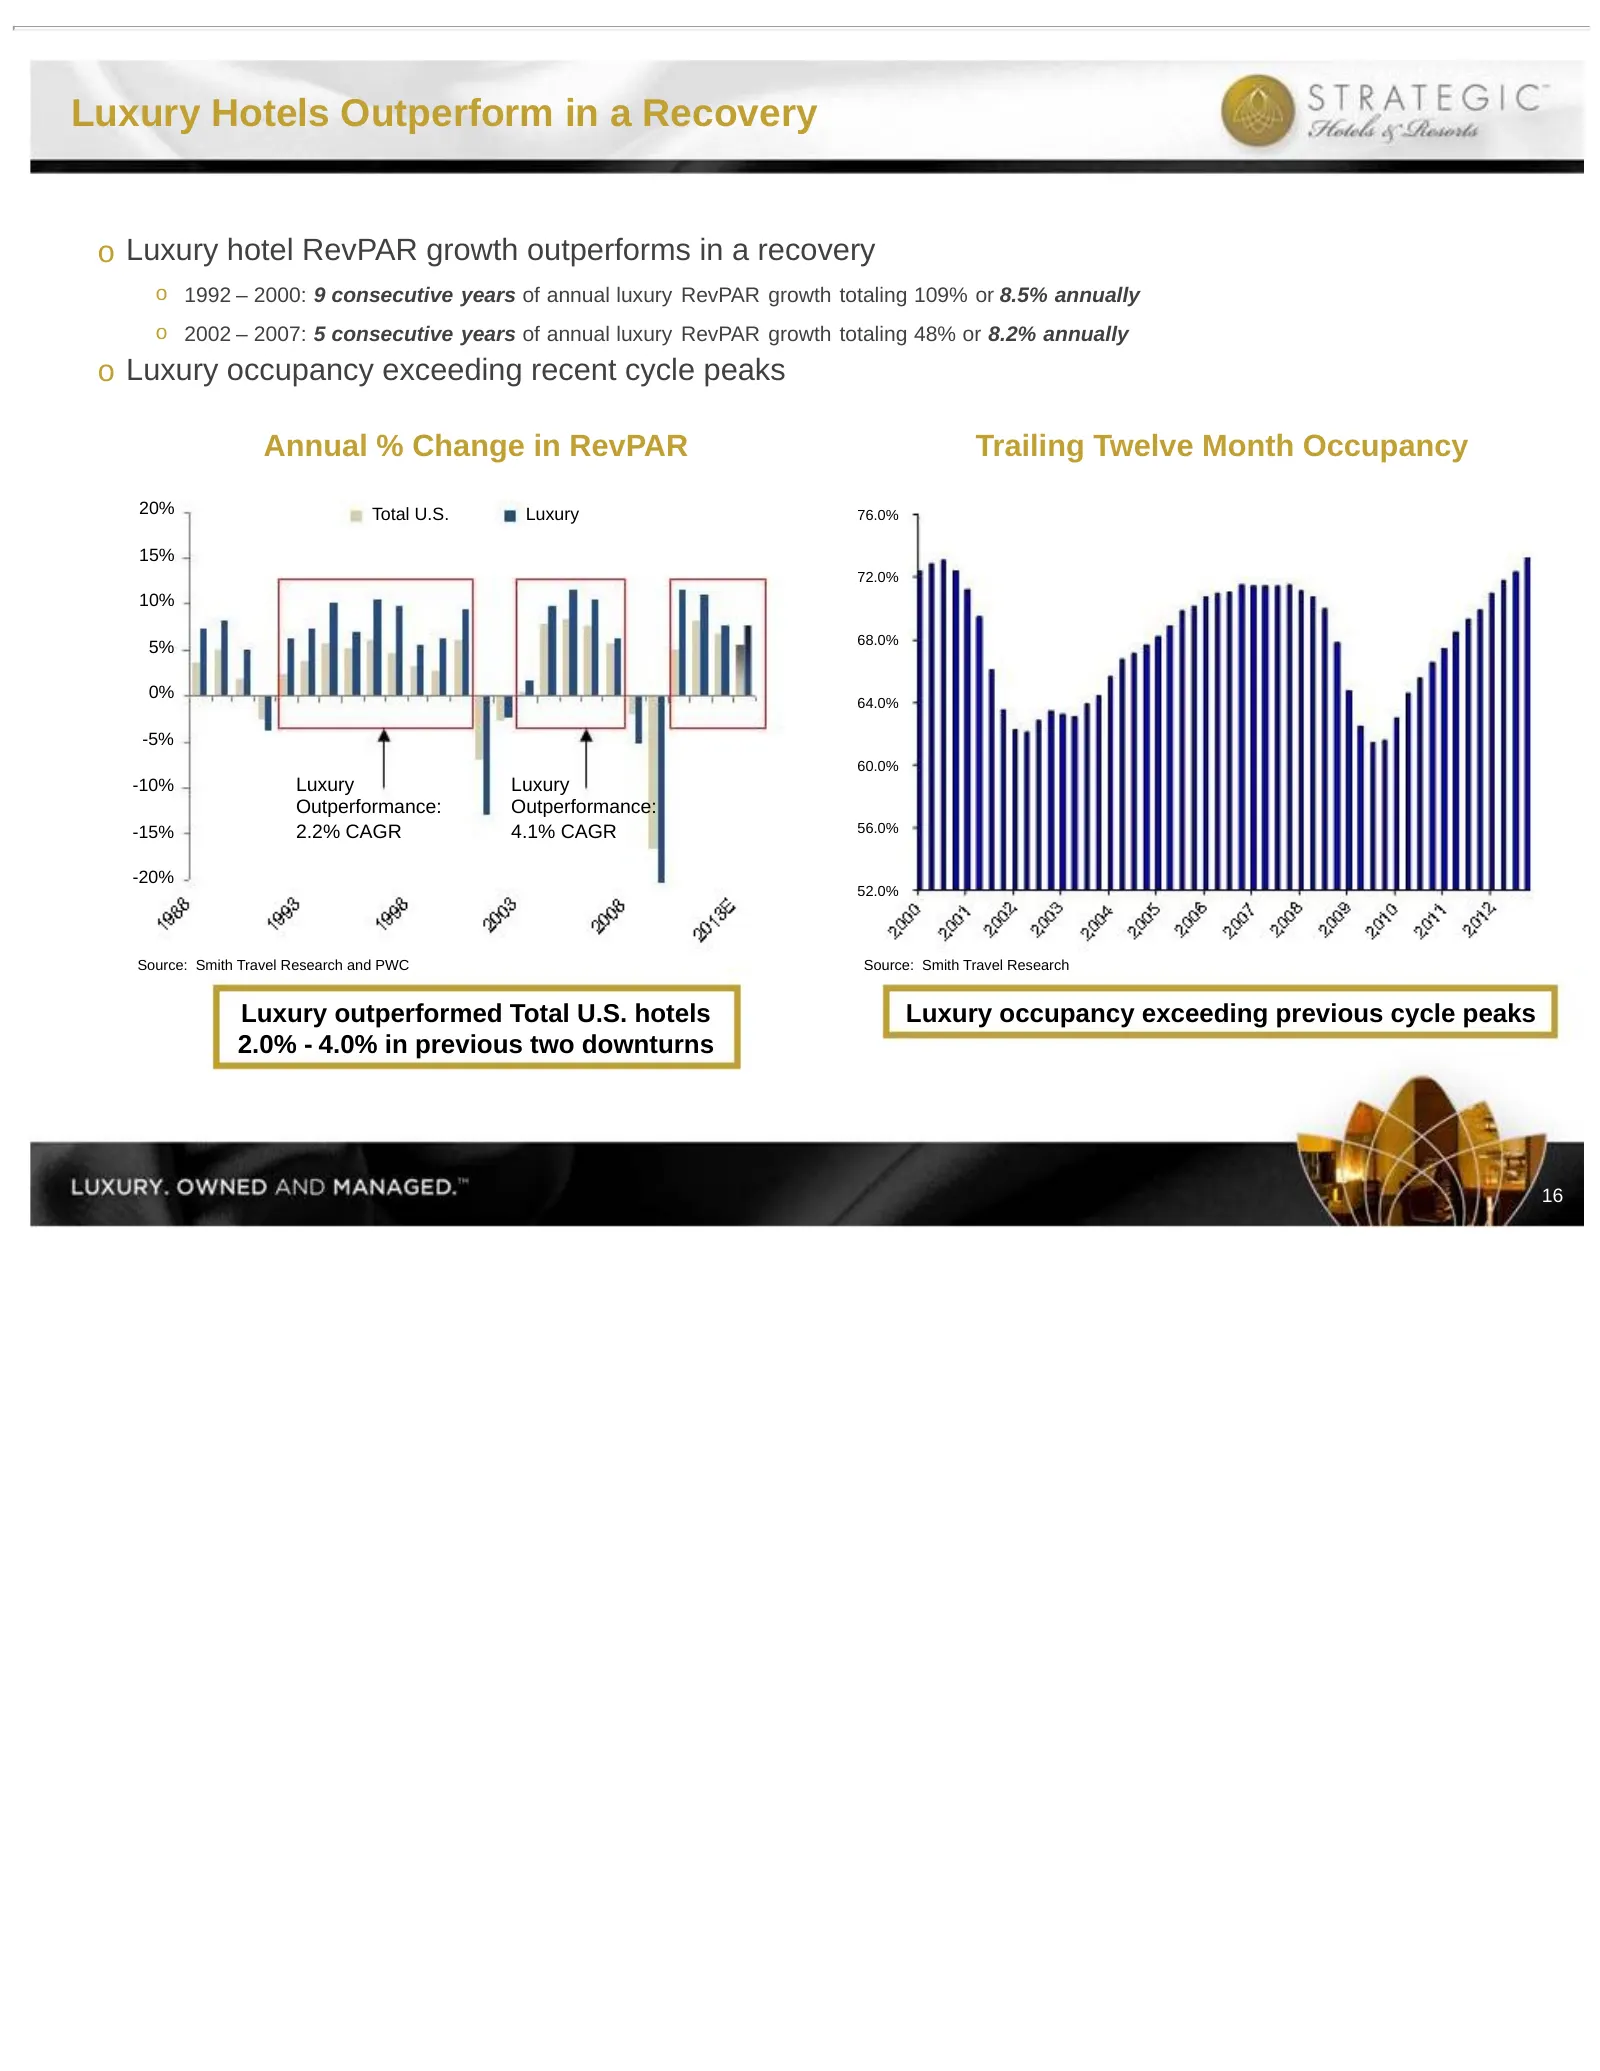
Luxury Hotels Outperform in a Recovery o Luxury hotel RevPAR growth outperforms in a recovery o 1992 – 2000: 9 consecutive years of annual luxury RevPAR growth totaling 109% or 8.5% annually o 2002 – 2007: 5 consecutive years of annual luxury RevPAR growth totaling 48% or 8.2% annually o Luxury occu
Slide 18: BEE Outperforms Competitors
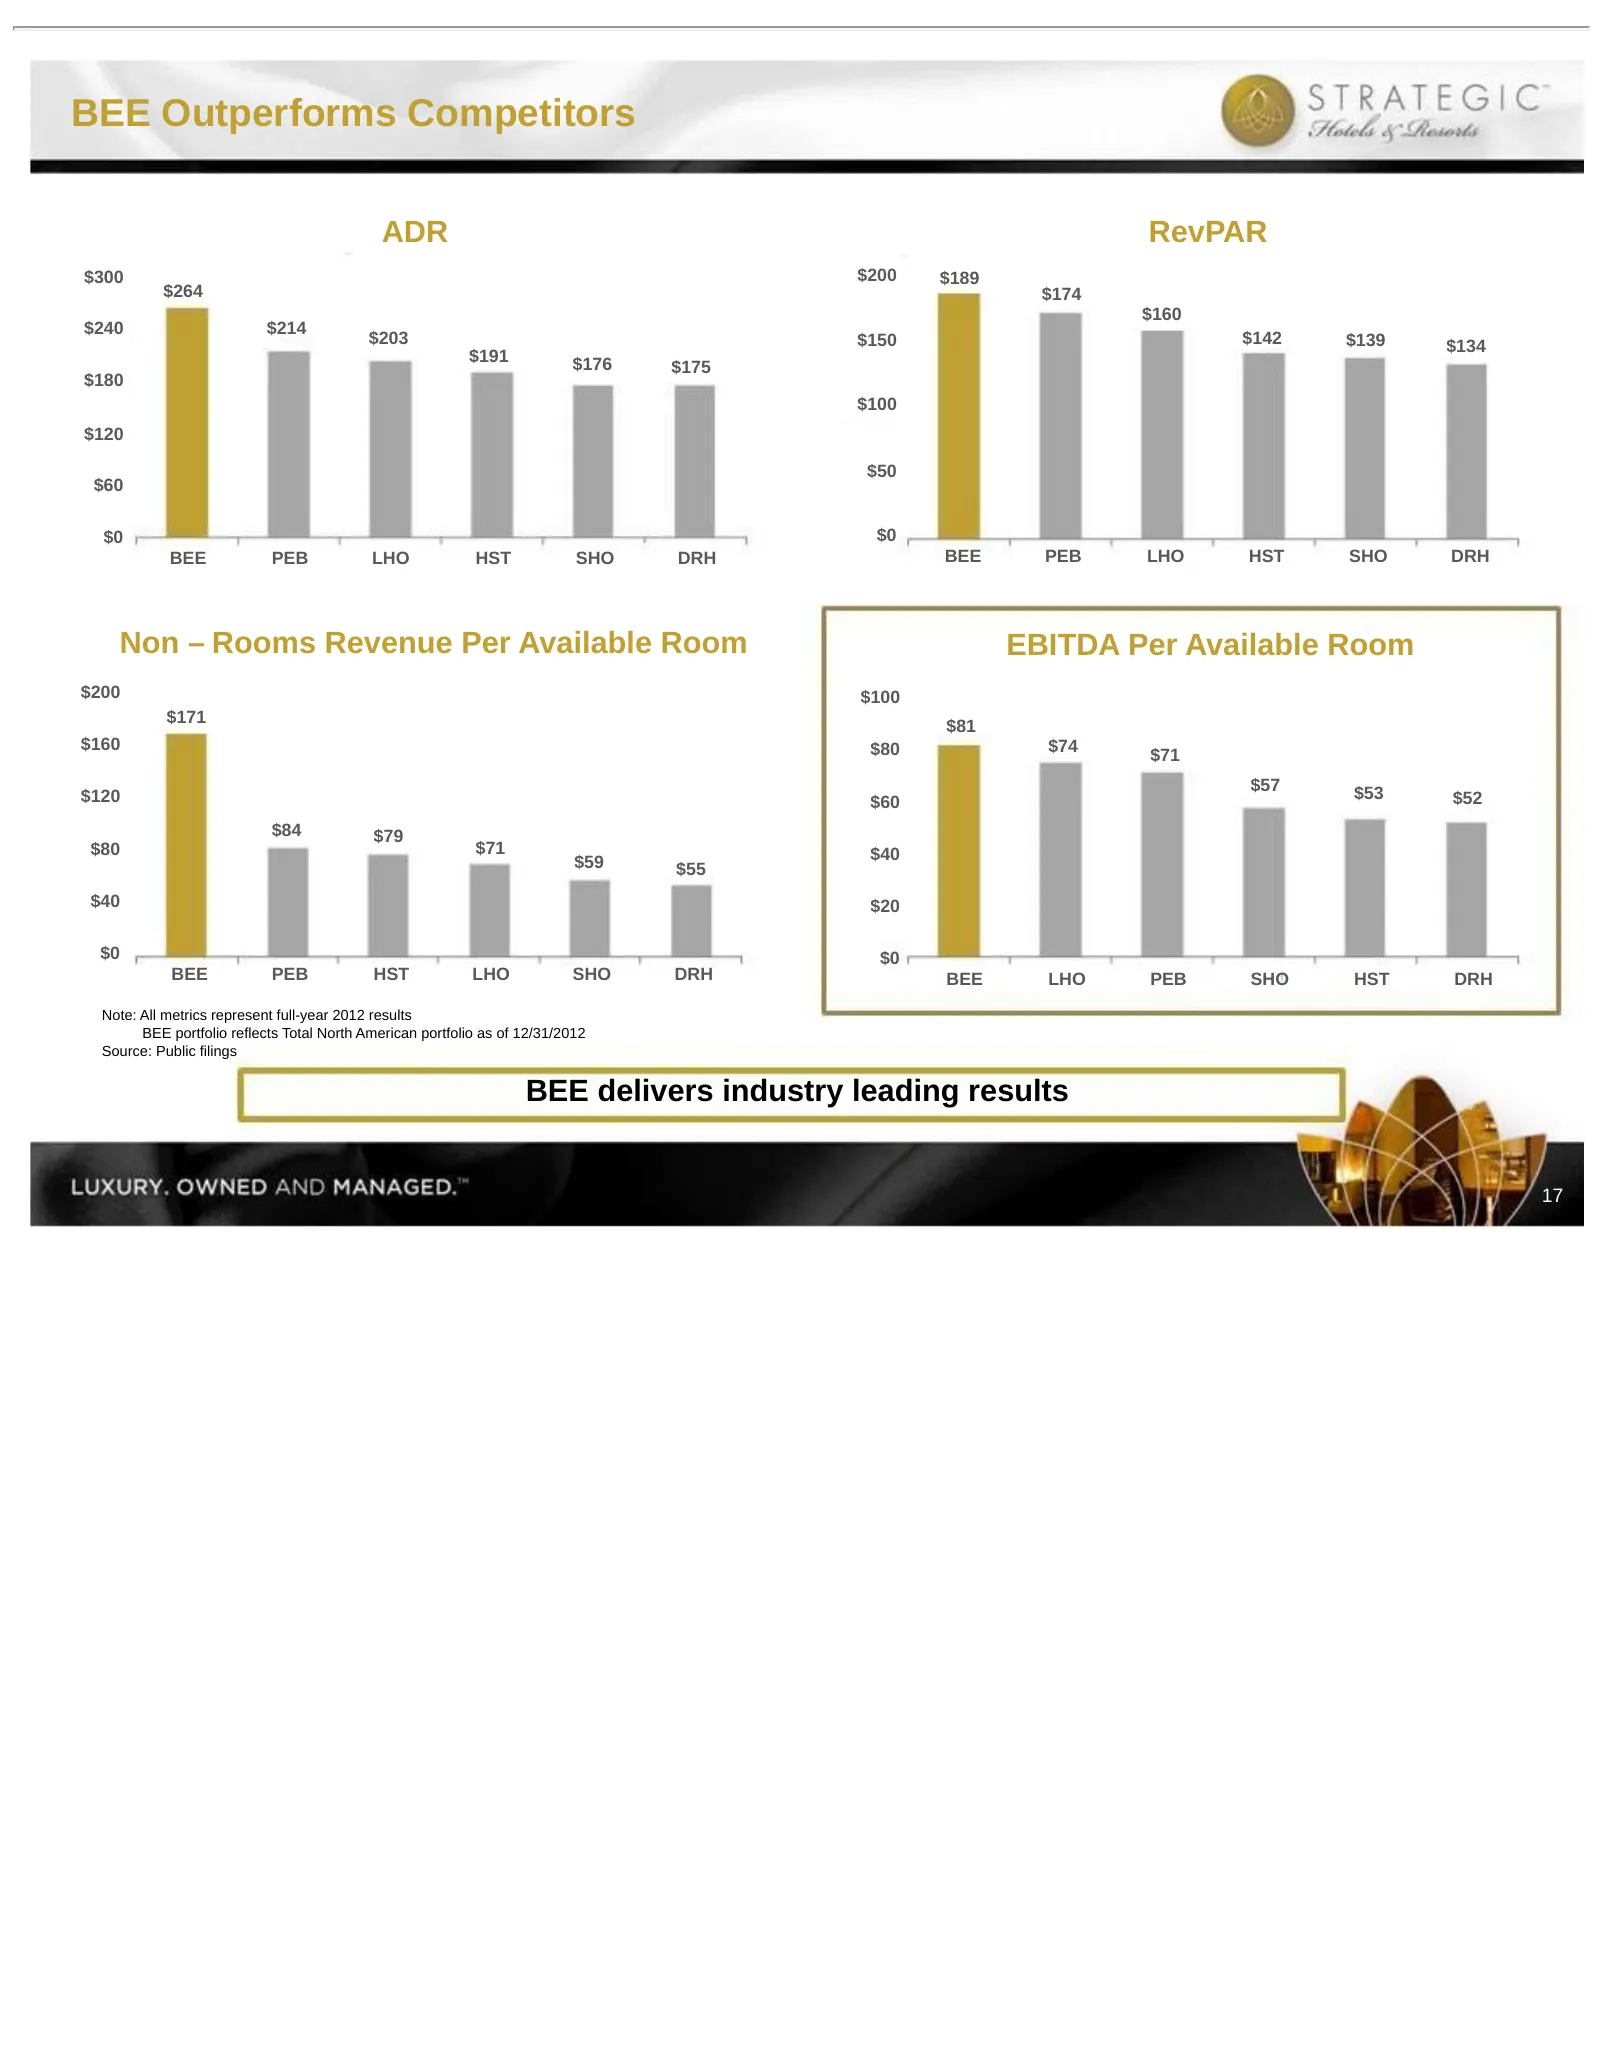
BEE Outperforms Competitors ADR RevPAR $300 $200 $189 $264 $174 $160 $240 $214 $203 $150 $142 $139 $134 $191 $176 $175 $180 $100 $120 $50 $60 $0 $0 BEE PEB LHO HST SHO DRH BEE PEB LHO HST SHO DRH Non – Rooms Revenue Per Available Room EBITDA Per Available Room $200 $100 $171 $81 $160 $80 $74 $71 $57
Slide 19: BEE Revenue Mix Compared to Peers
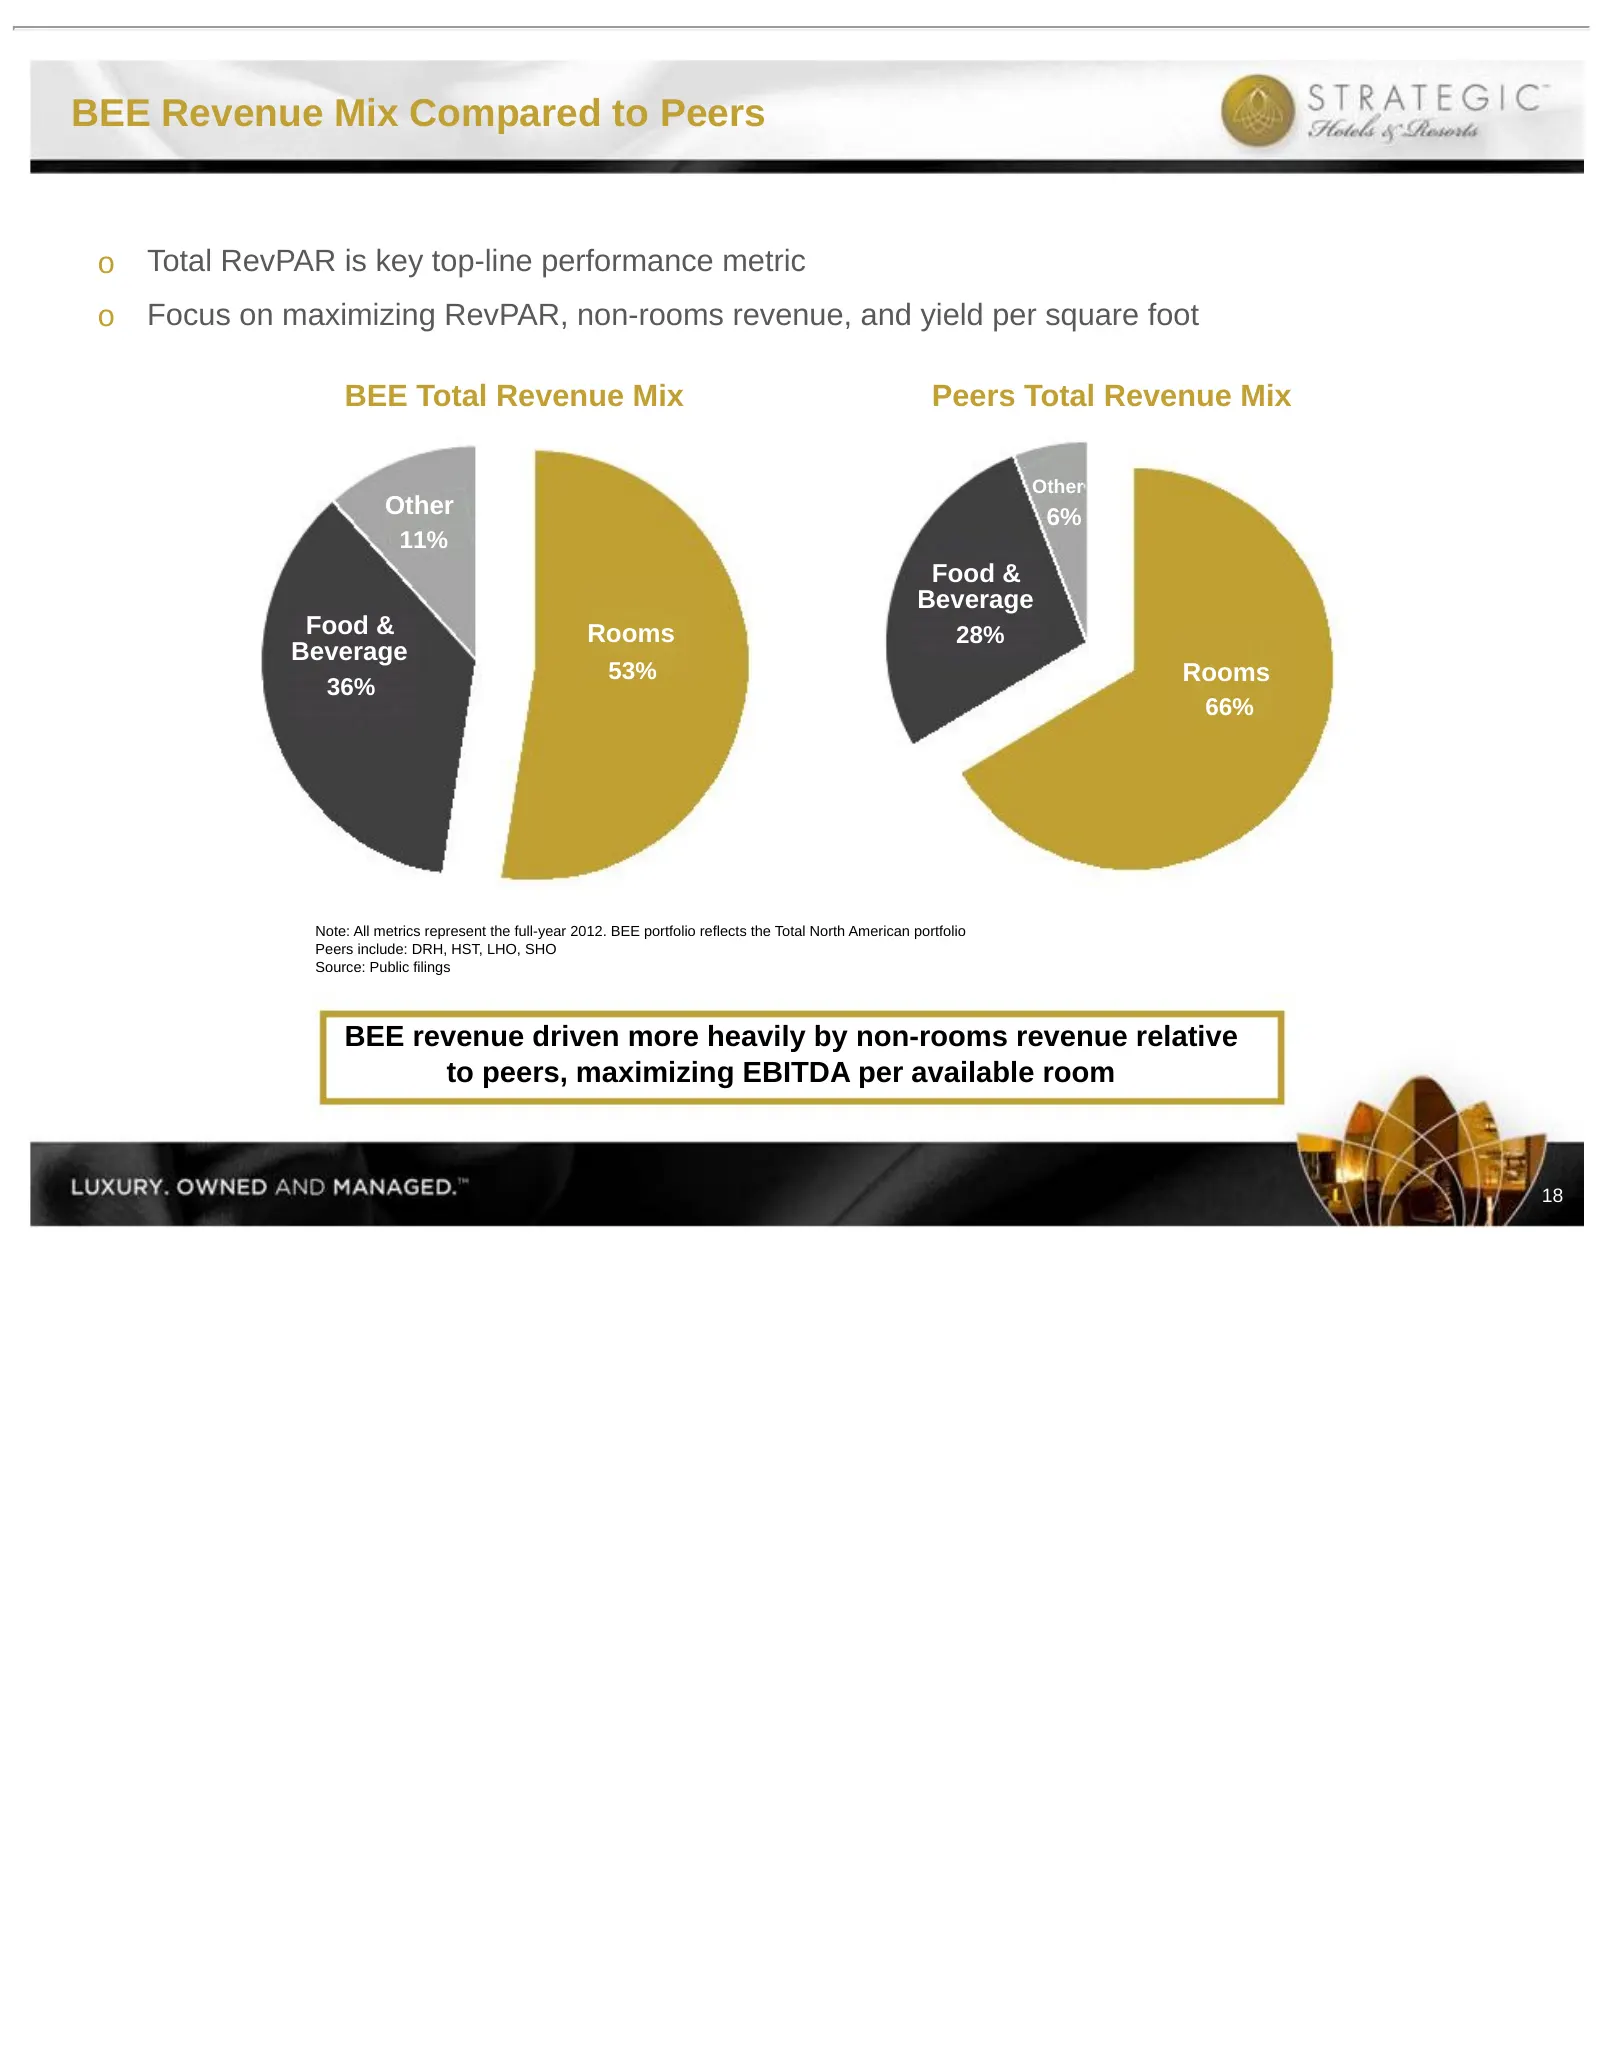
BEE Revenue Mix Compared to Peers o Total RevPAR is key top-line performance metric o Focus on maximizing RevPAR, non-rooms revenue, and yield per square foot BEE Total Revenue Mix Peers Total Revenue Mix Other Other 6% 11% Food & Beverage Food & Rooms 28% Beverage 53% Rooms 36% 66% Note: All metric
Slide 20: Industry Leading Operating Margins
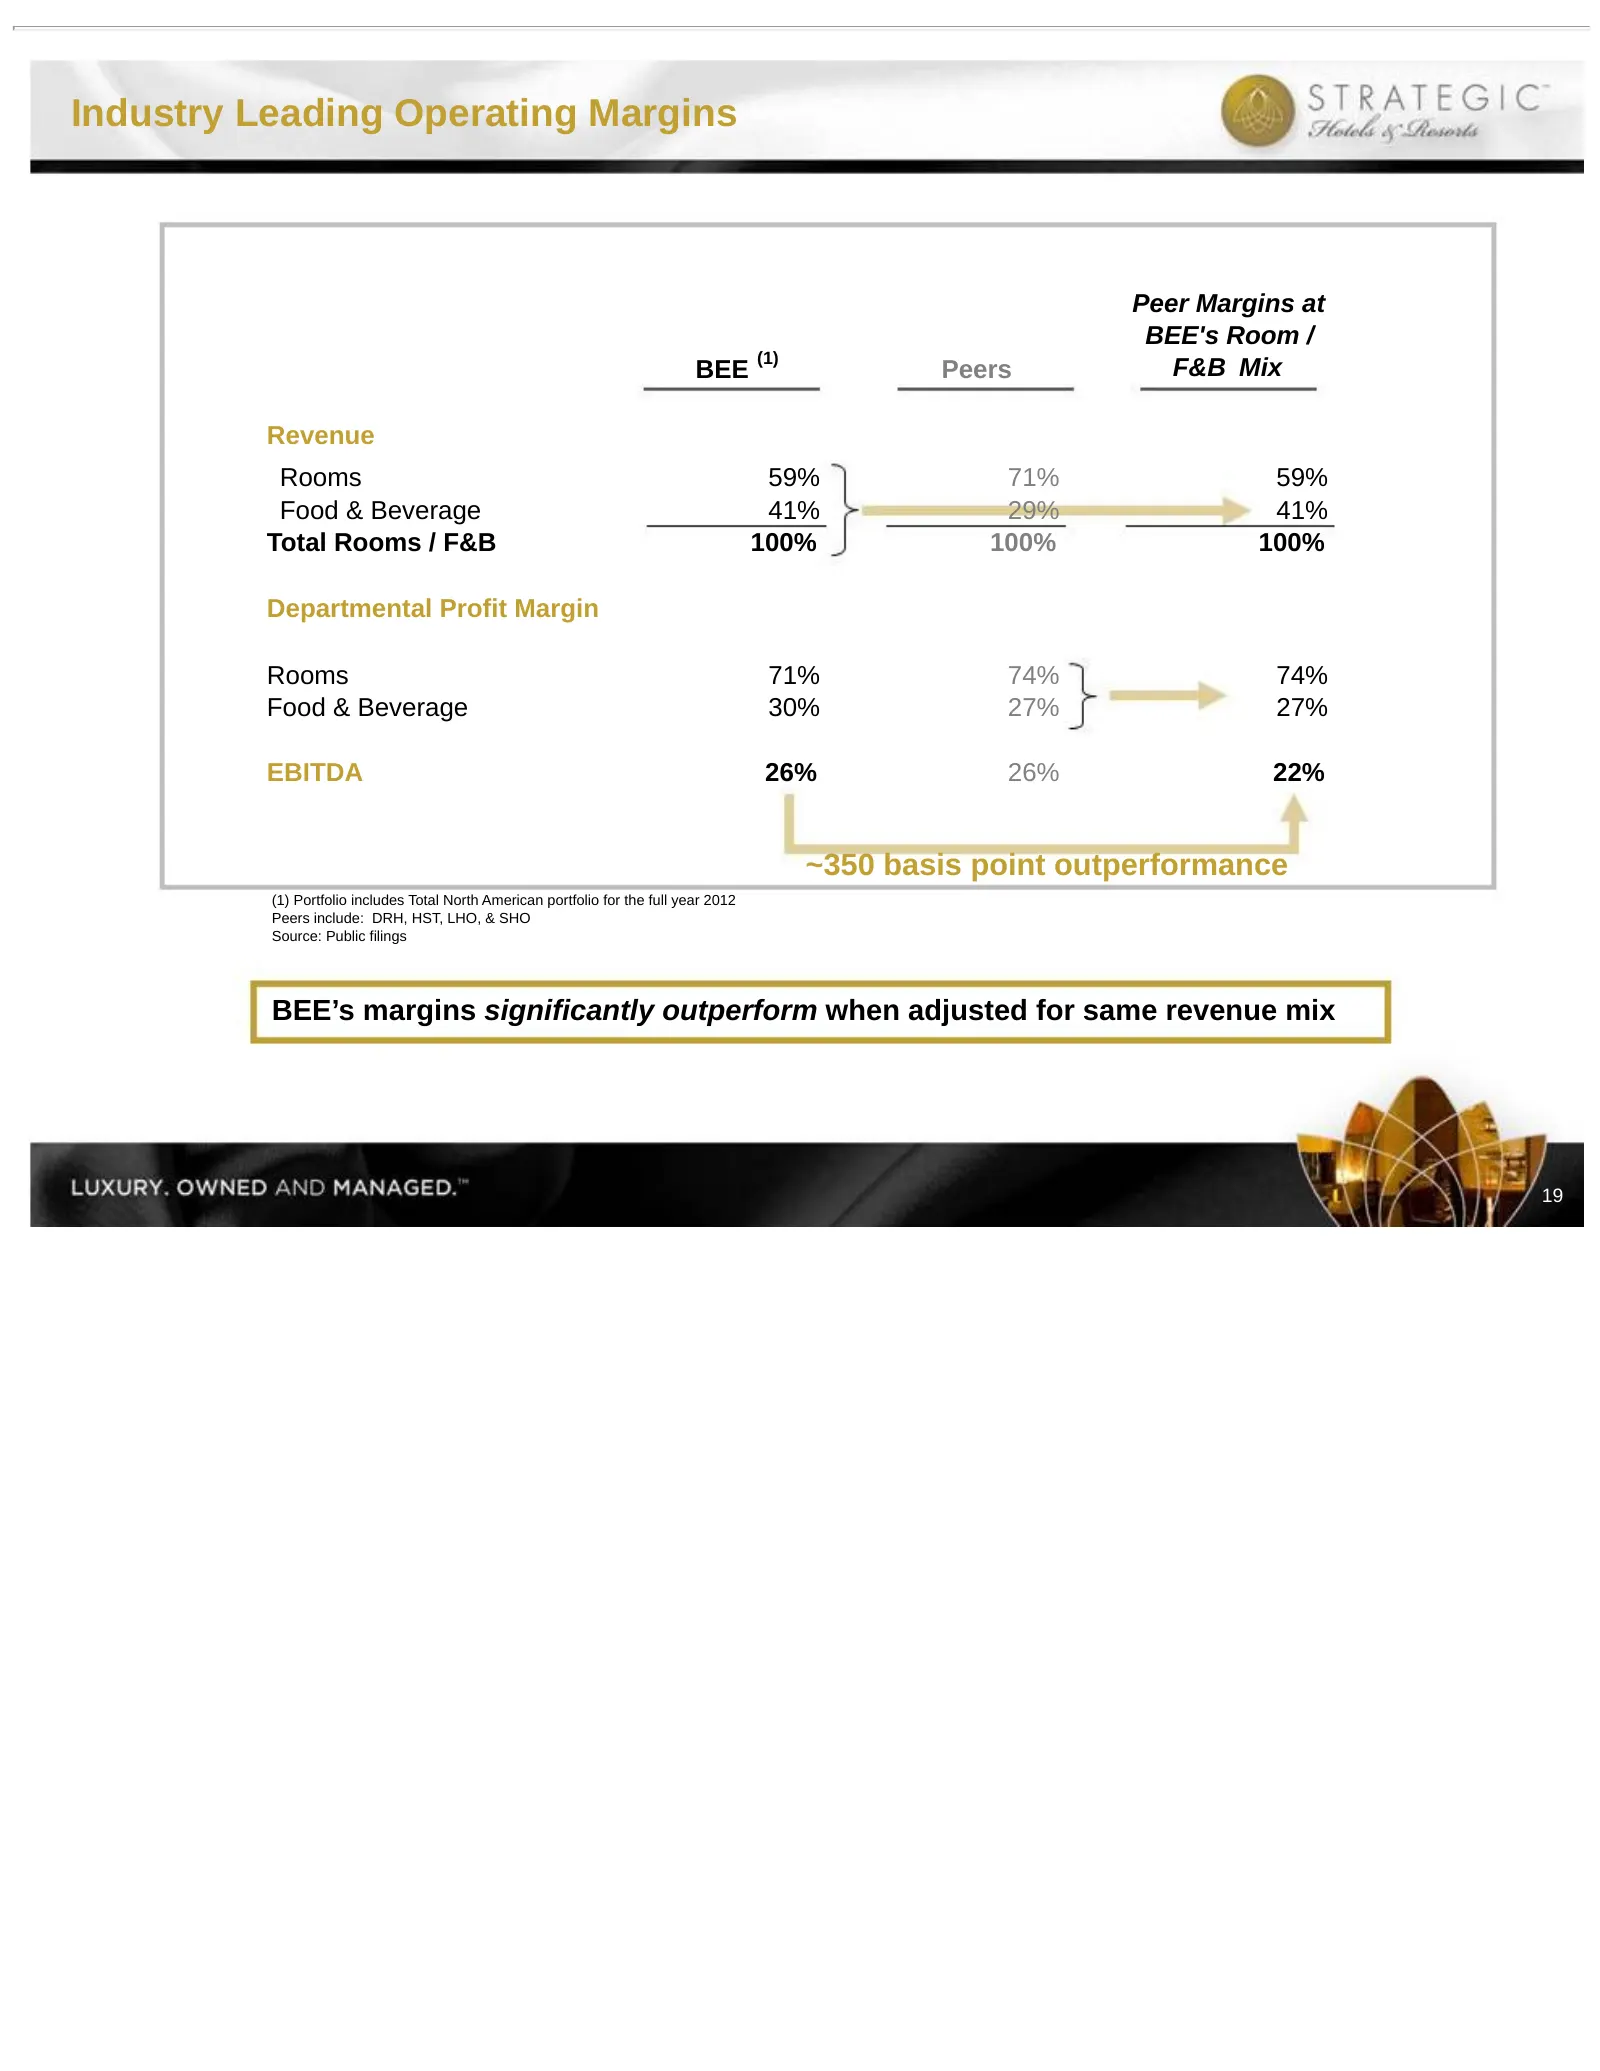
Industry Leading Operating Margins Peer Margins at BEE's Room / (1) BEE Peers F&B Mix Revenue Rooms 59% 71% 59% Food & Beverage 41% 29% 41% Total Rooms / F&B 100% 100% 100% Departmental Profit Margin Rooms 71% 74% 74% Food & Beverage 30% 27% 27% EBITDA 26% 26% 22% ~350 basis point outperformance (1)
Slide 21: Operating Trends
I. BEE’s Unique Value Proposition II. Company Overview III. Industry Update IV. Operating Trends V. Financial Overview Operating Trends 20
Slide 22: Group Booking Outlook
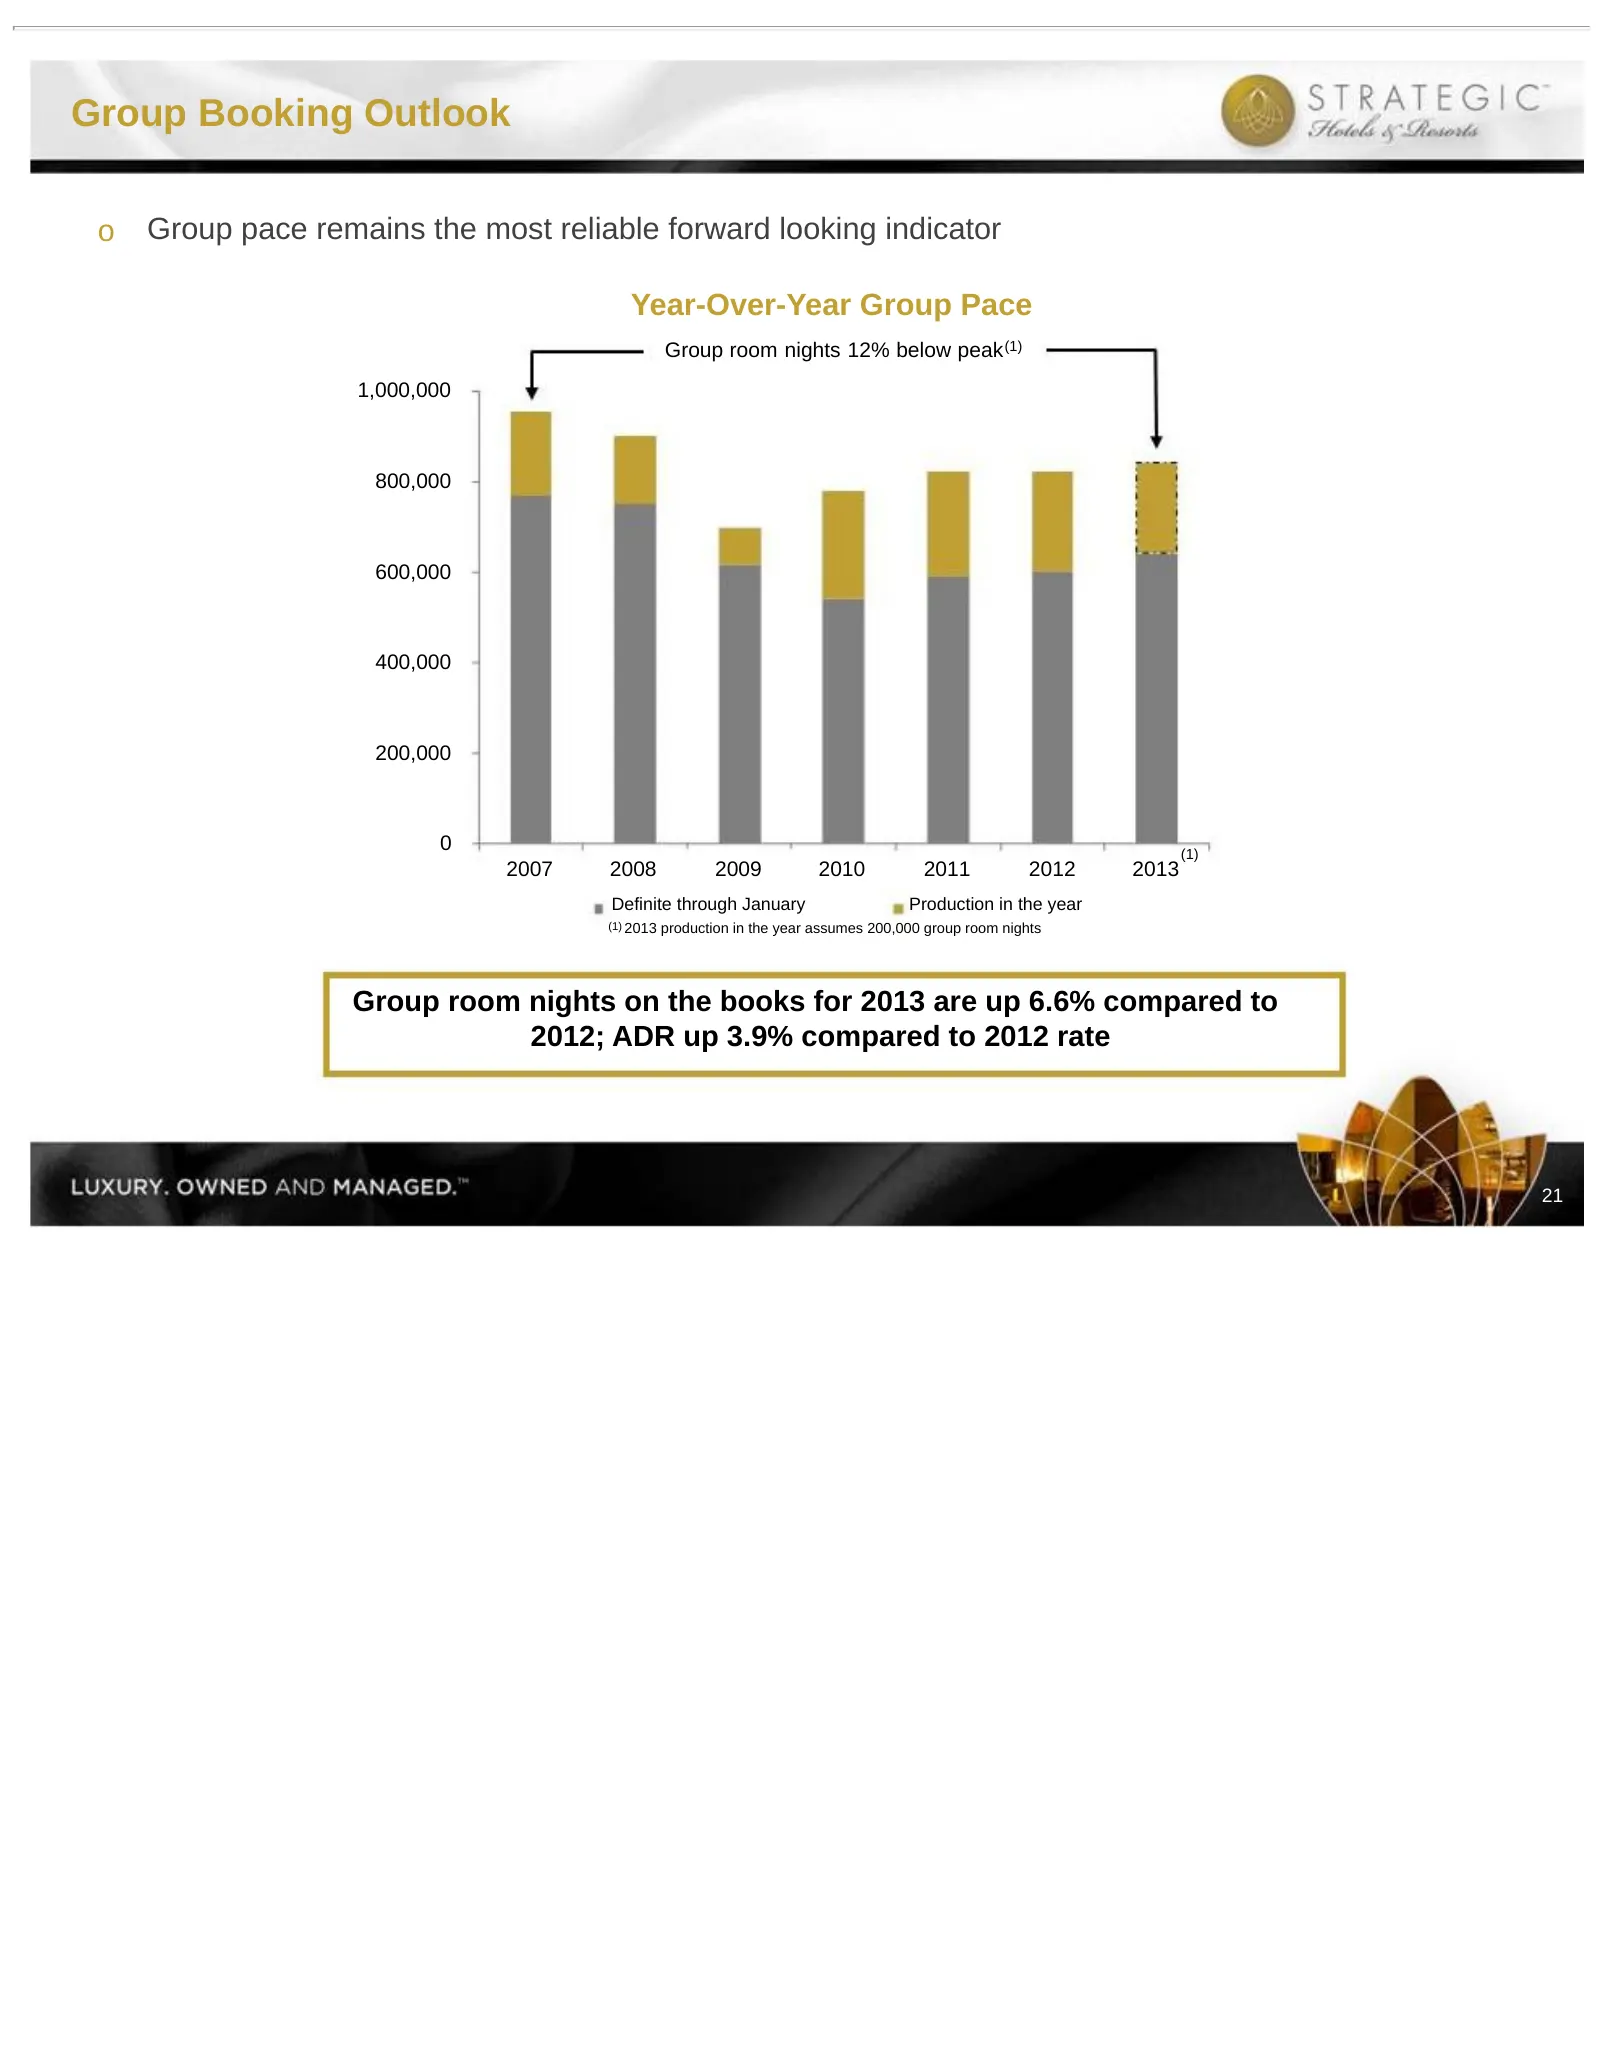
Group Booking Outlook o Group pace remains the most reliable forward looking indicator Year-Over-Year Group Pace Group room nights 12% below peak (1) 1,000,000 800,000 600,000 400,000 200,000 0 (1) 2007 2008 2009 2010 2011 2012 2013 Definite through January Production in the year (1) 2013 production
Slide 23: Embedded Portfolio Growth
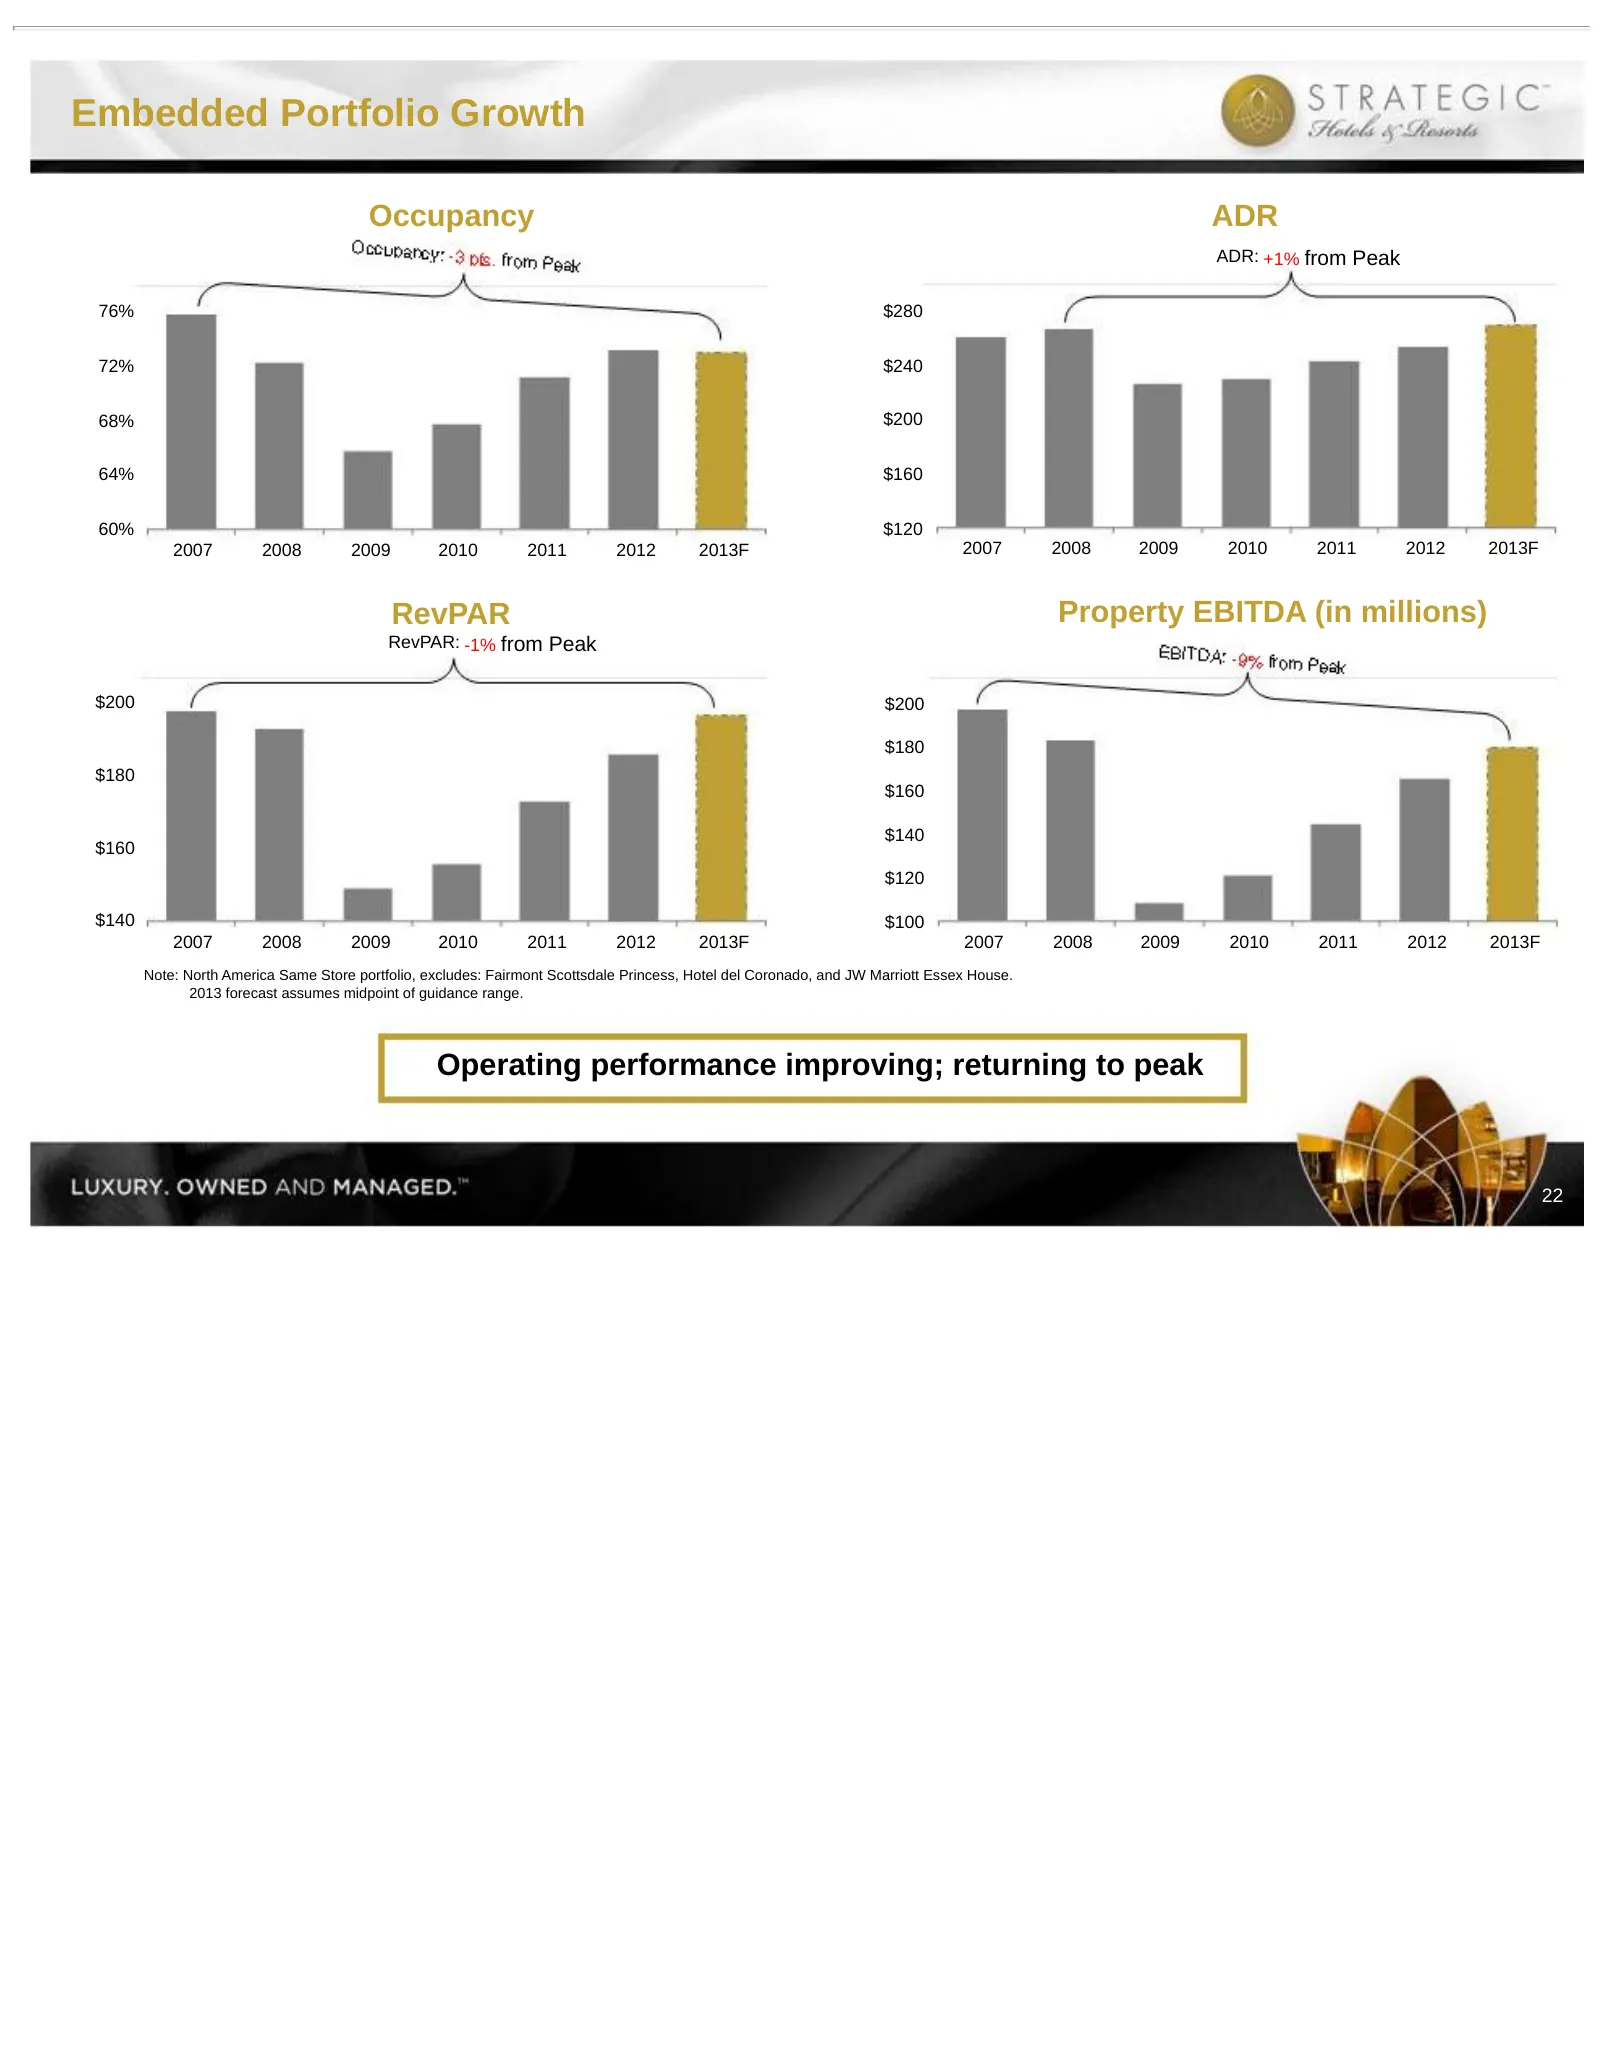
Embedded Portfolio Growth Occupancy ADR ADR: +1% from Peak 76% $280 72% $240 68% $200 64% $160 60% $120 2007 2008 2009 2010 2011 2012 2013F 2007 2008 2009 2010 2011 2012 2013F RevPAR Property EBITDA (in millions) RevPAR: -1% from Peak $200 $200 $180 $180 $160 $140 $160 $120 $140 $100 2007 2008 2009
Slide 24: Financial Overview
I. BEE’s Unique Value Proposition II. Company Overview III. Industry Update IV. Operating Trends V. Financial Overview Financial Overview 23
Slide 25: Accomplishments Since January 1, 2010
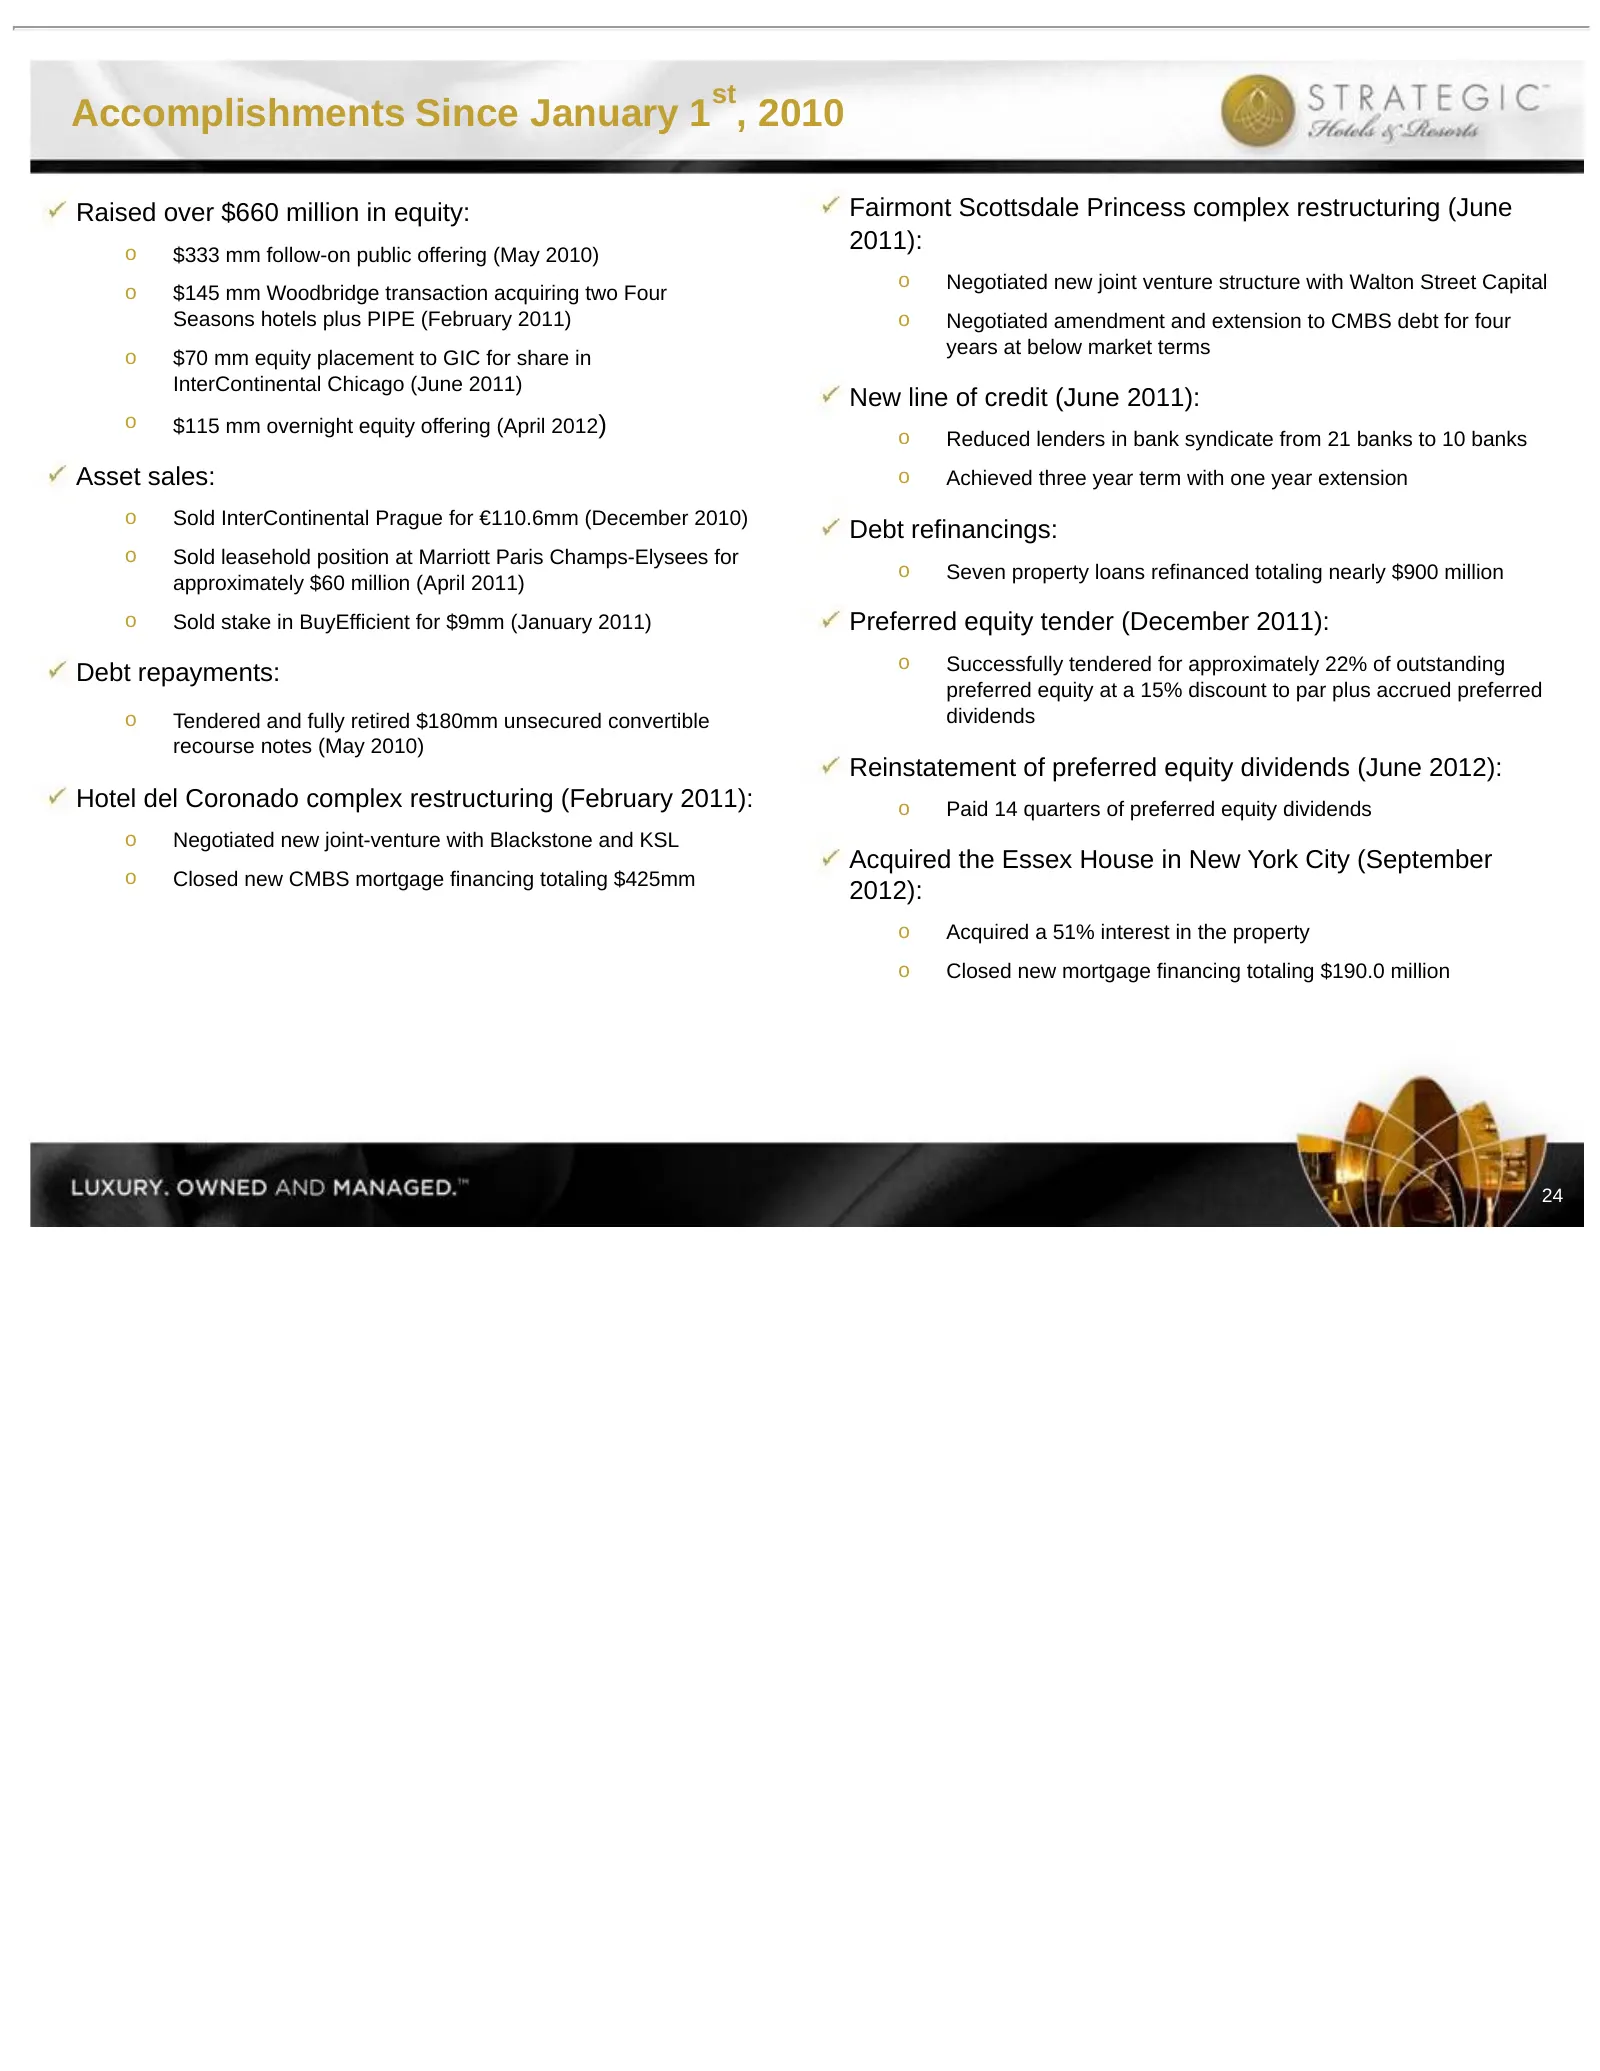
st Accomplishments Since January 1 , 2010 Raised over $660 million in equity: Fairmont Scottsdale Princess complex restructuring (June o $333 mm follow-on public offering (May 2010) 2011): o Negotiated new joint venture structure with Walton Street Capital o $145 mm Woodbridge transaction acquiring
Slide 26: Full Year 2012 Results (EBITDA in millions)
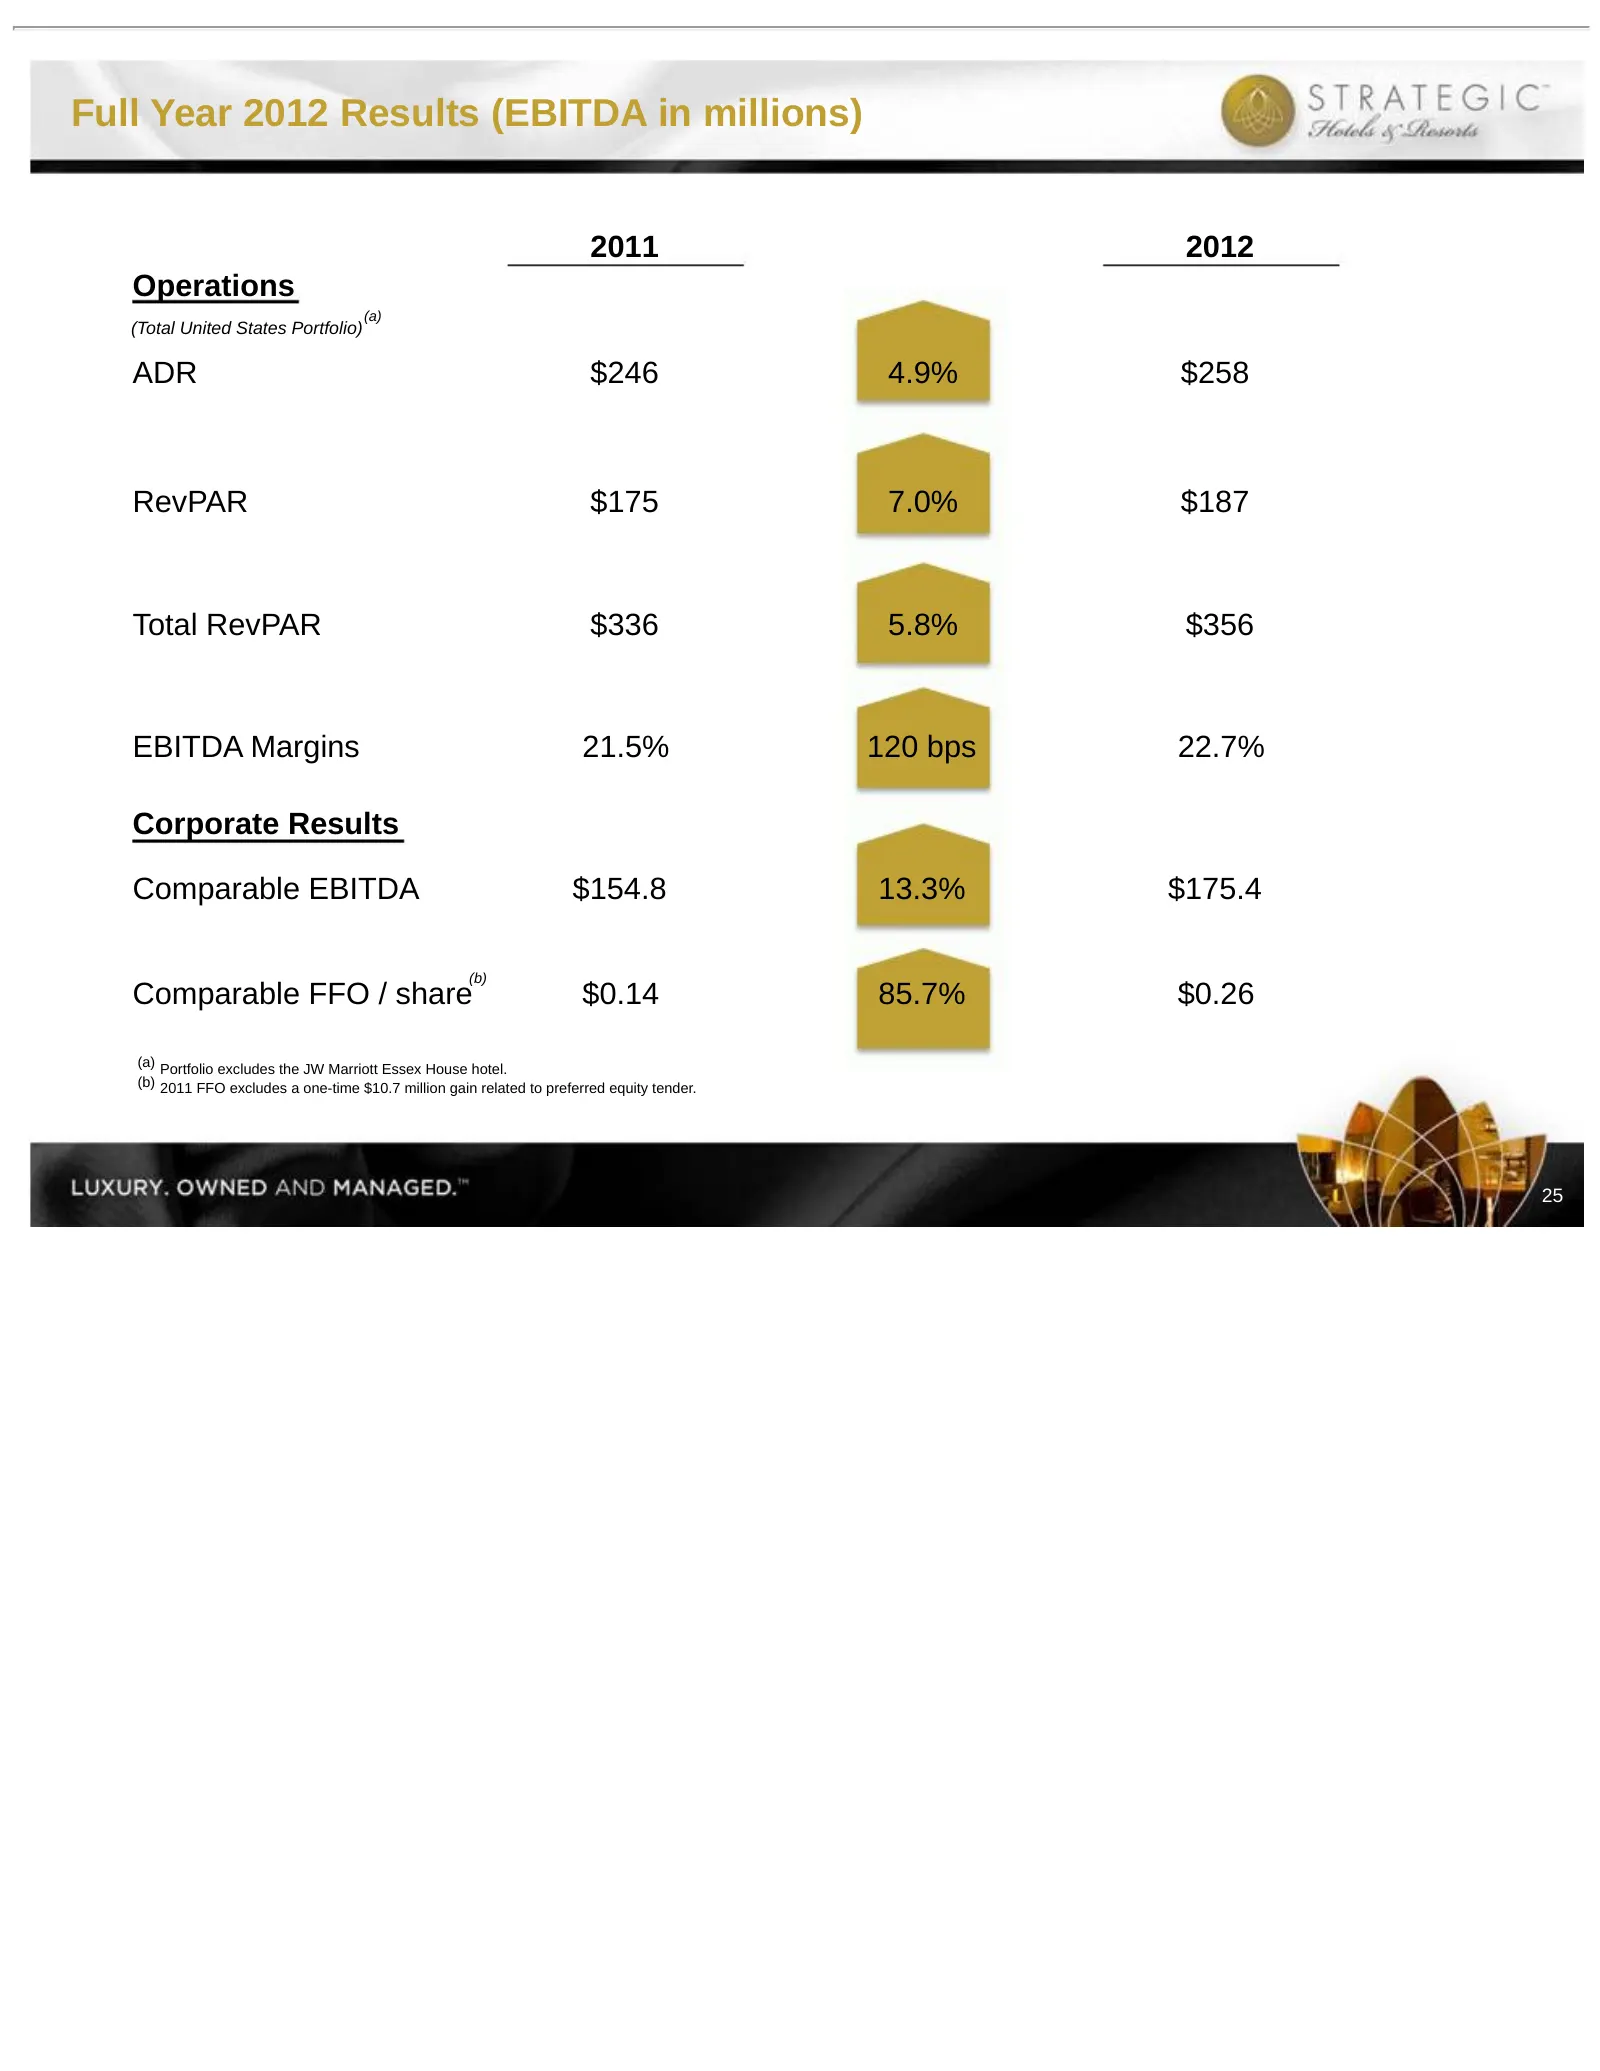
Full Year 2012 Results (EBITDA in millions) 2011 2012 Operations (a) (Total United States Portfolio) ADR $246 4.9% $258 RevPAR $175 7.0% $187 Total RevPAR $336 5.8% $356 EBITDA Margins 21.5% 120 bps 22.7% Corporate Results Comparable EBITDA $154.8 13.3% $175.4 (b) Comparable FFO / share $0.14 85.7%
Slide 27: 2013 Guidance (EBITDA in millions)
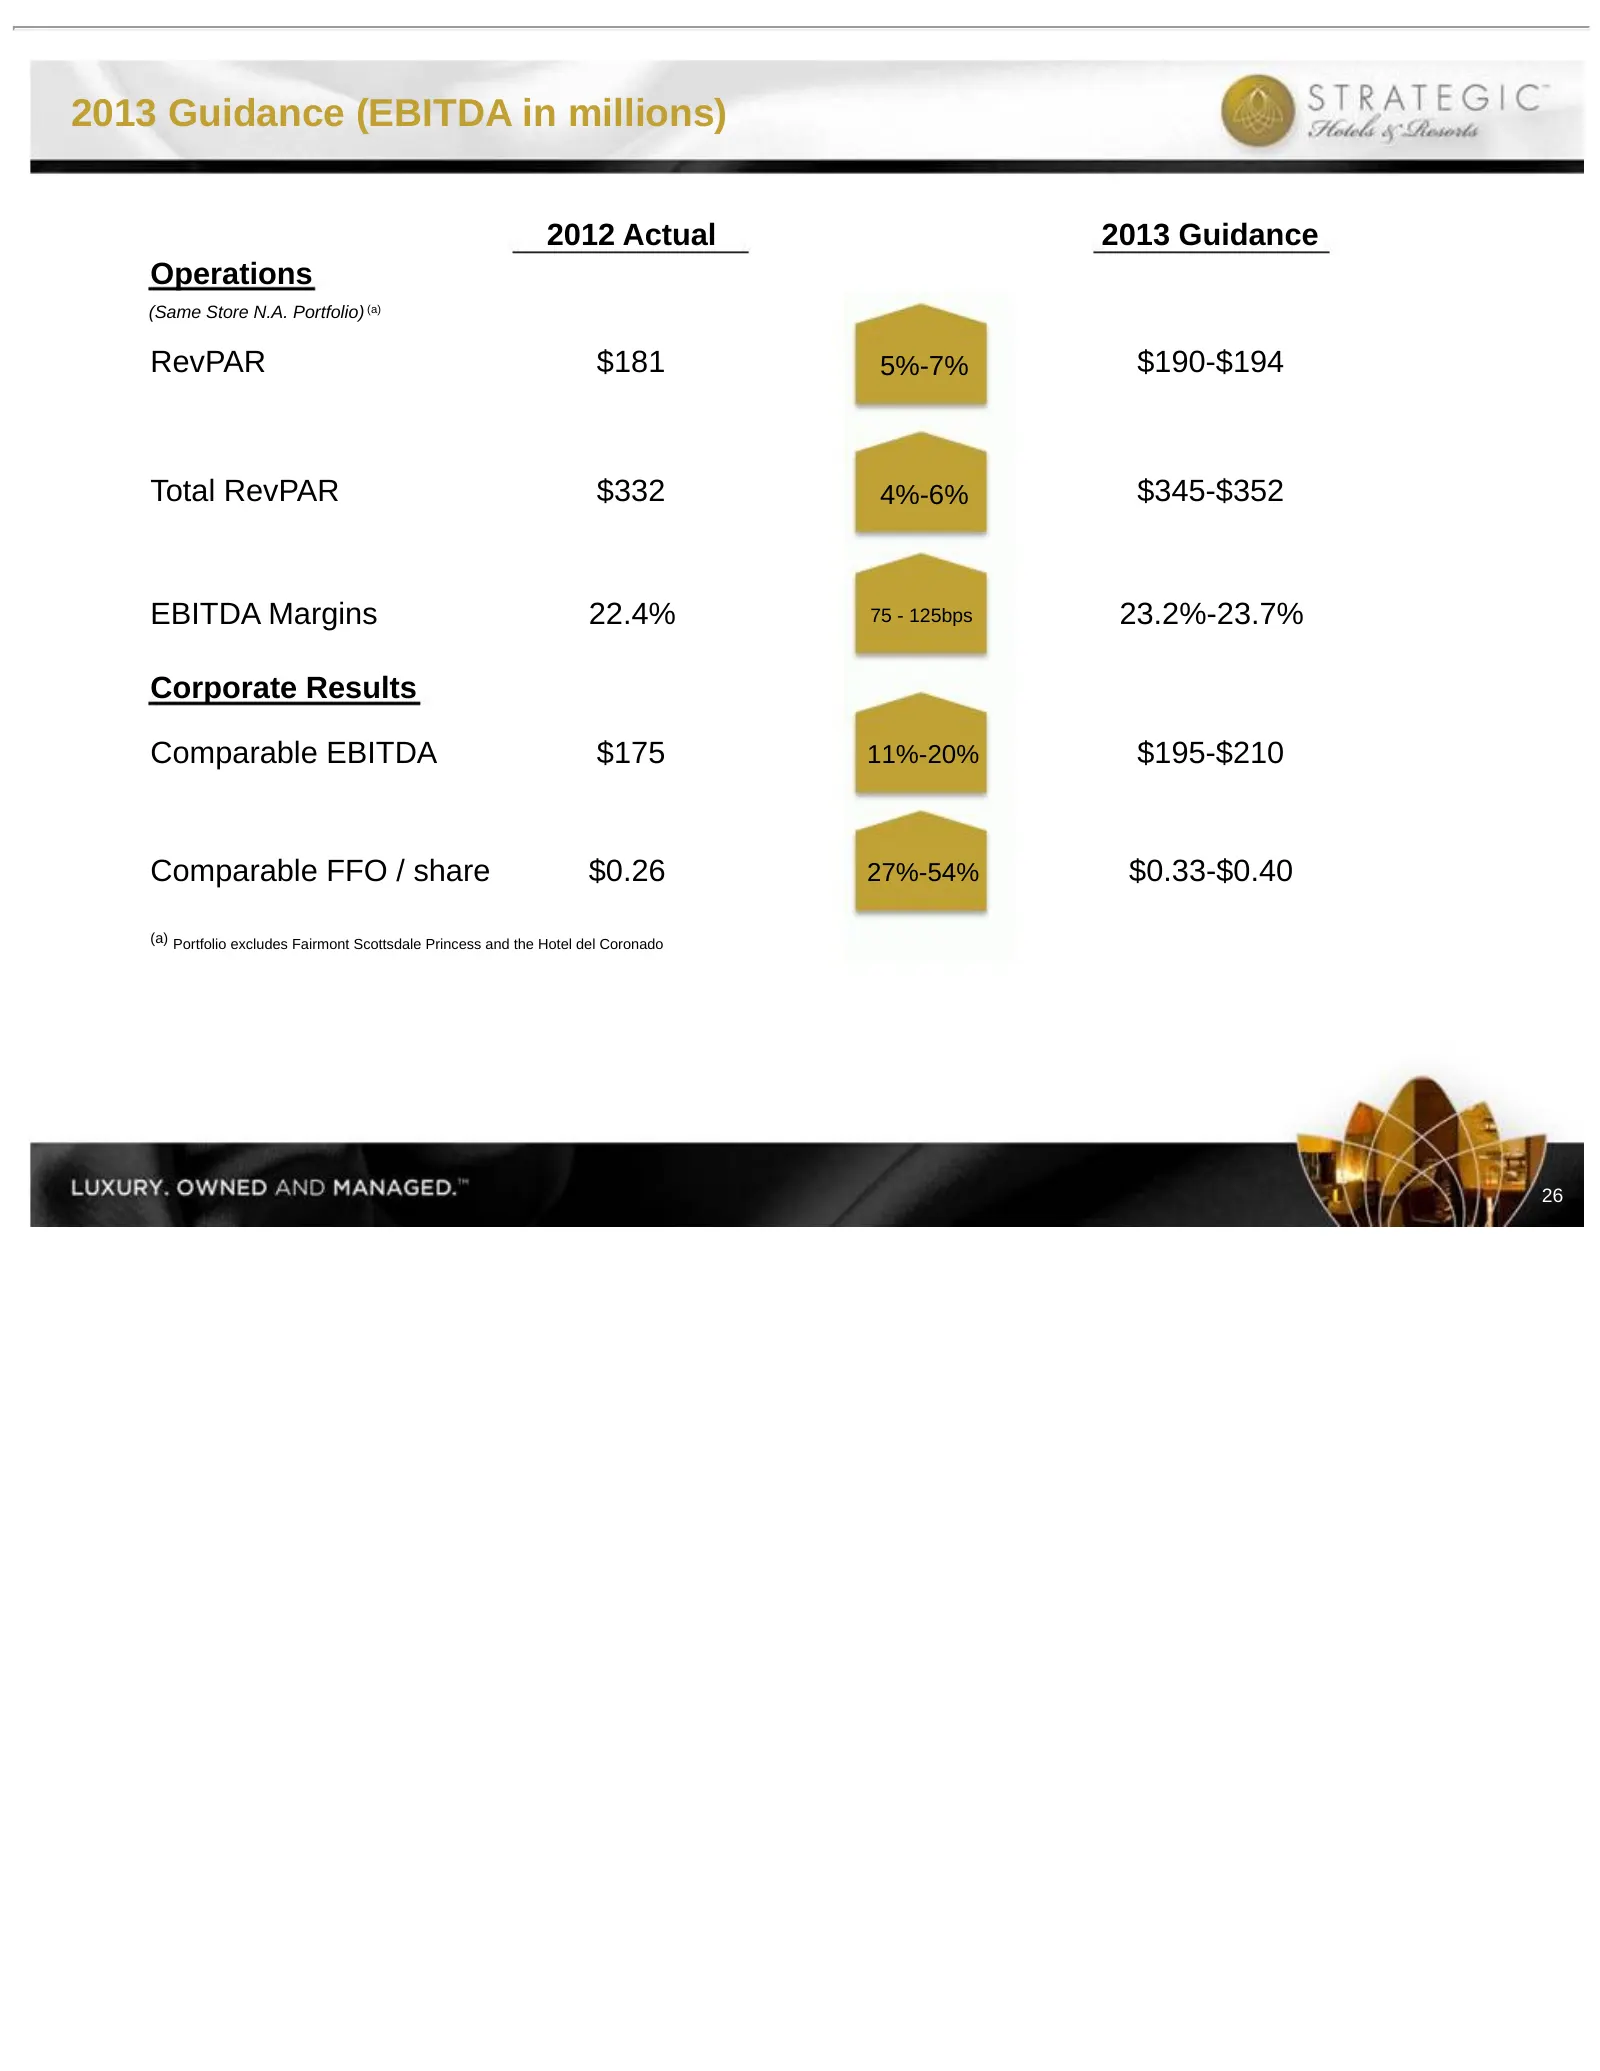
2013 Guidance (EBITDA in millions) 2012 Actual 2013 Guidance Operations (Same Store N.A. Portfolio) (a) RevPAR $181 5%-7% $190-$194 Total RevPAR $332 4%-6% $345-$352 EBITDA Margins 22.4% 75 - 125bps 23.2%-23.7% Corporate Results Comparable EBITDA $175 11%-20% $195-$210 Comparable FFO / share $0.26 2
Slide 28: BEE's Unique Value Proposition
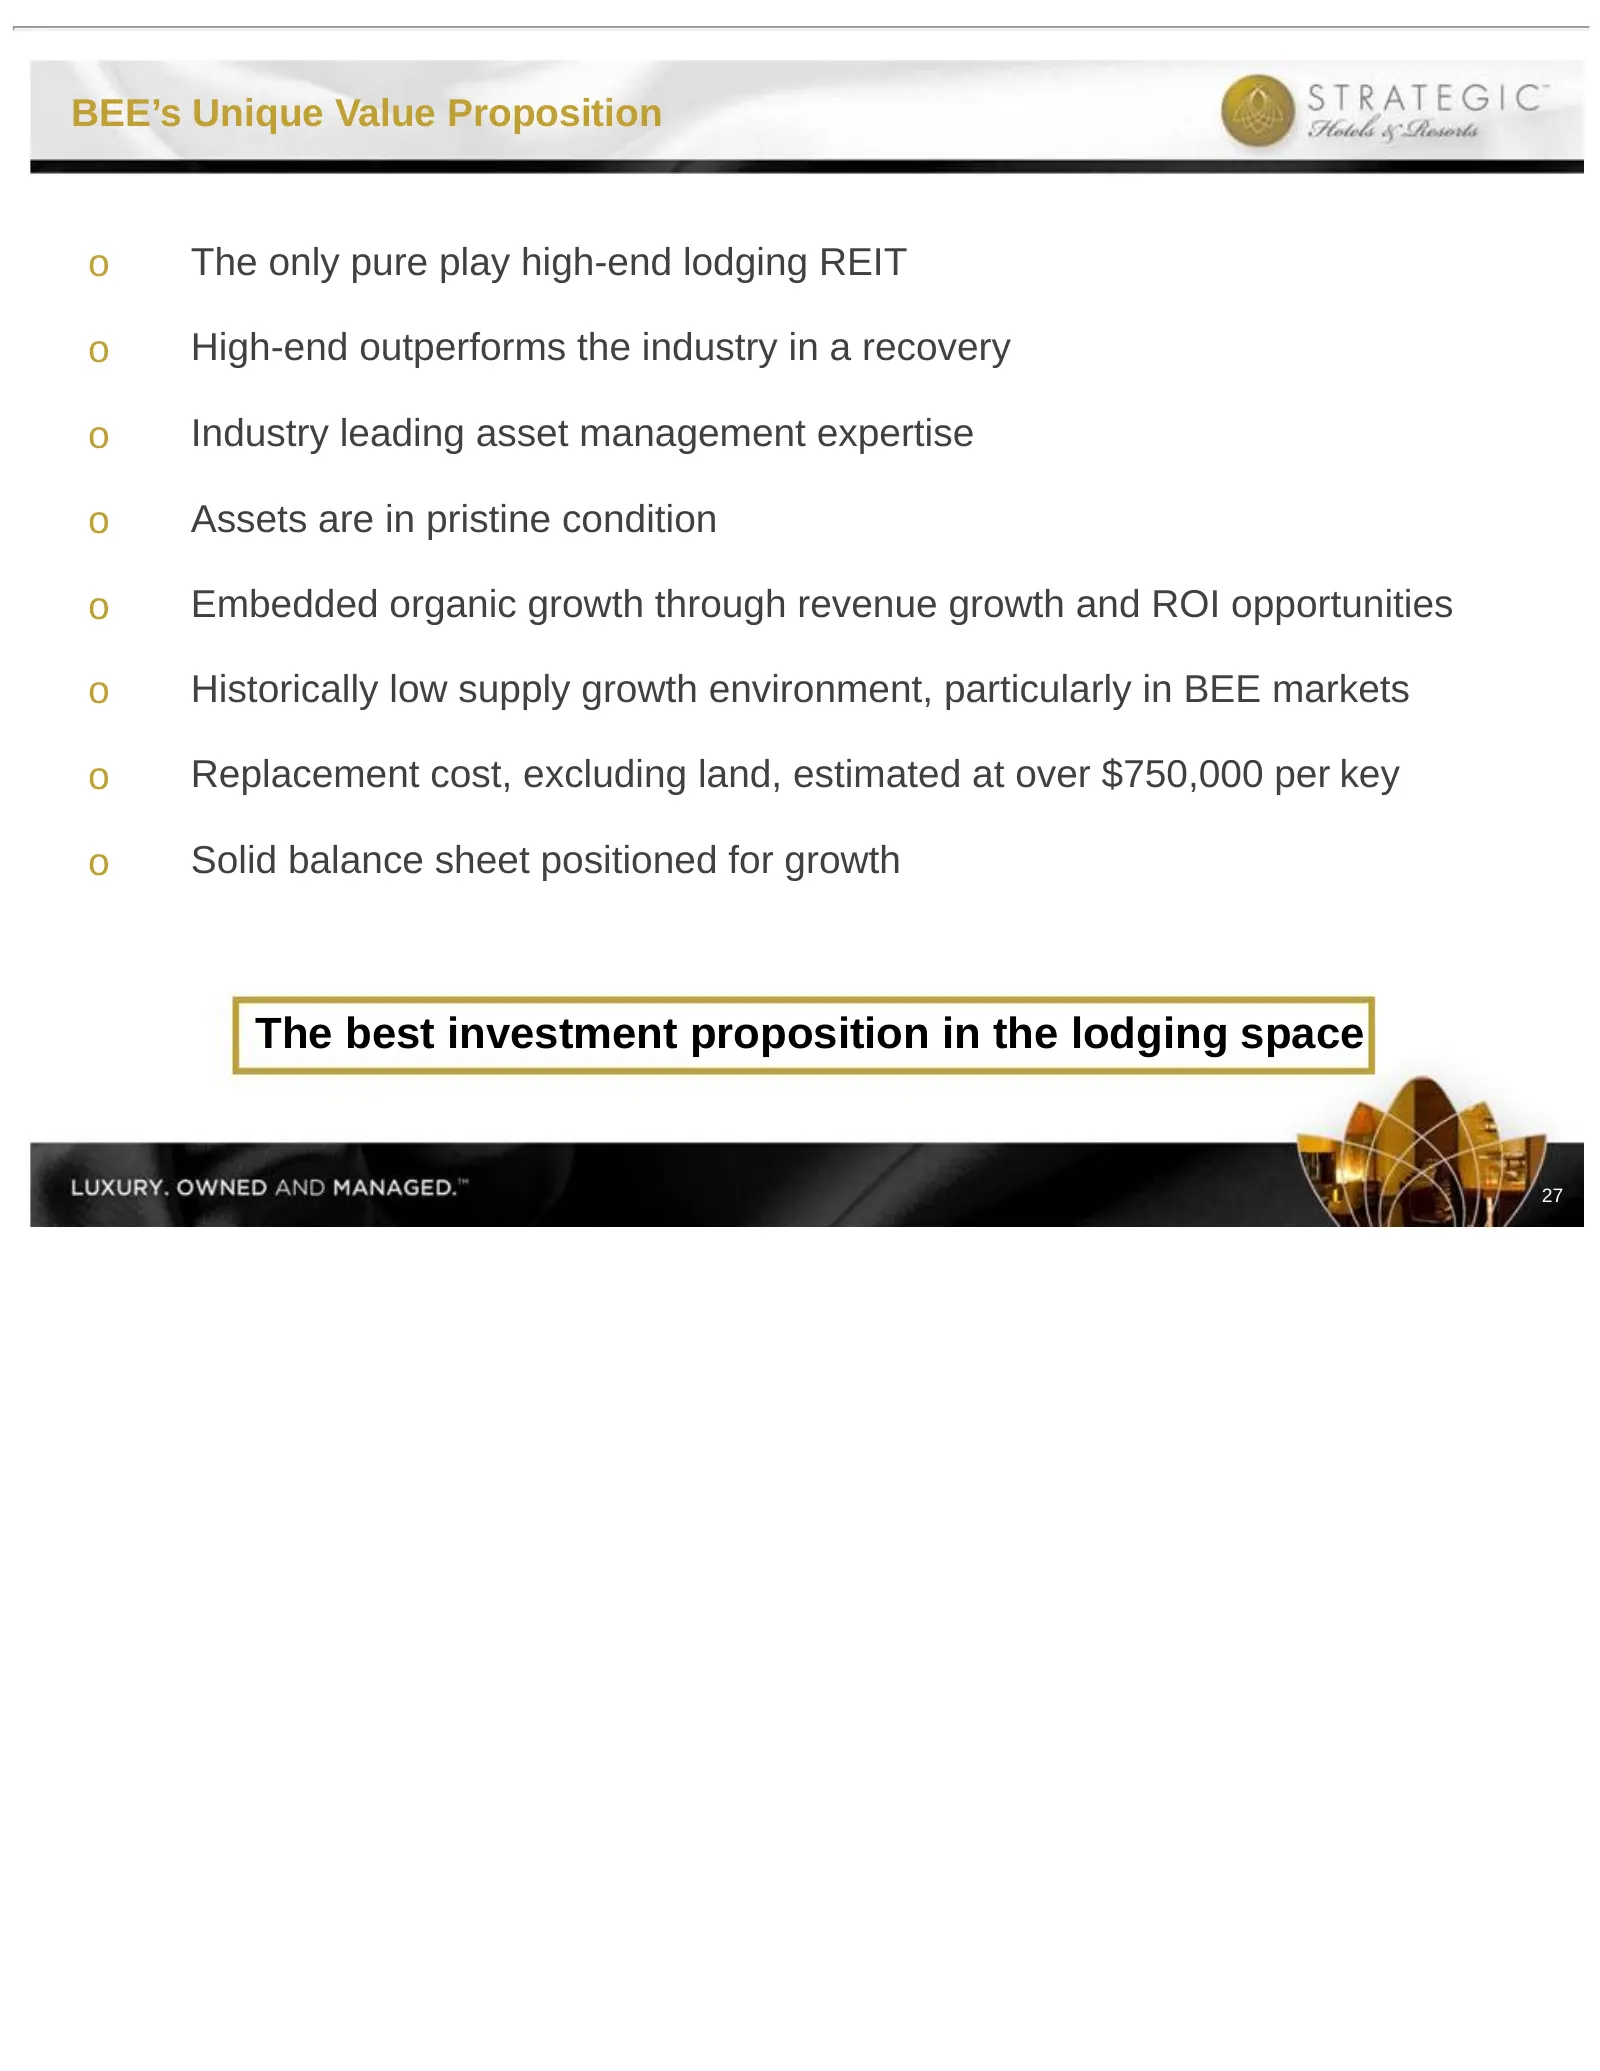
BEE’s Unique Value Proposition o The only pure play high-end lodging REIT o High-end outperforms the industry in a recovery o Industry leading asset management expertise o Assets are in pristine condition o Embedded organic growth through revenue growth and ROI opportunities o Historically low suppl
Slide 29: Disclaimer
Disclaimer Except for historical information, the matters discussed in this presentation are forward-looking statements subject to certain risks and uncertainties. Forward-looking statements relate to expectations, beliefs, projections, future plans and strategies, anticipated events or trends, and
Slide 30: Non-GAAP to GAAP Reconciliations
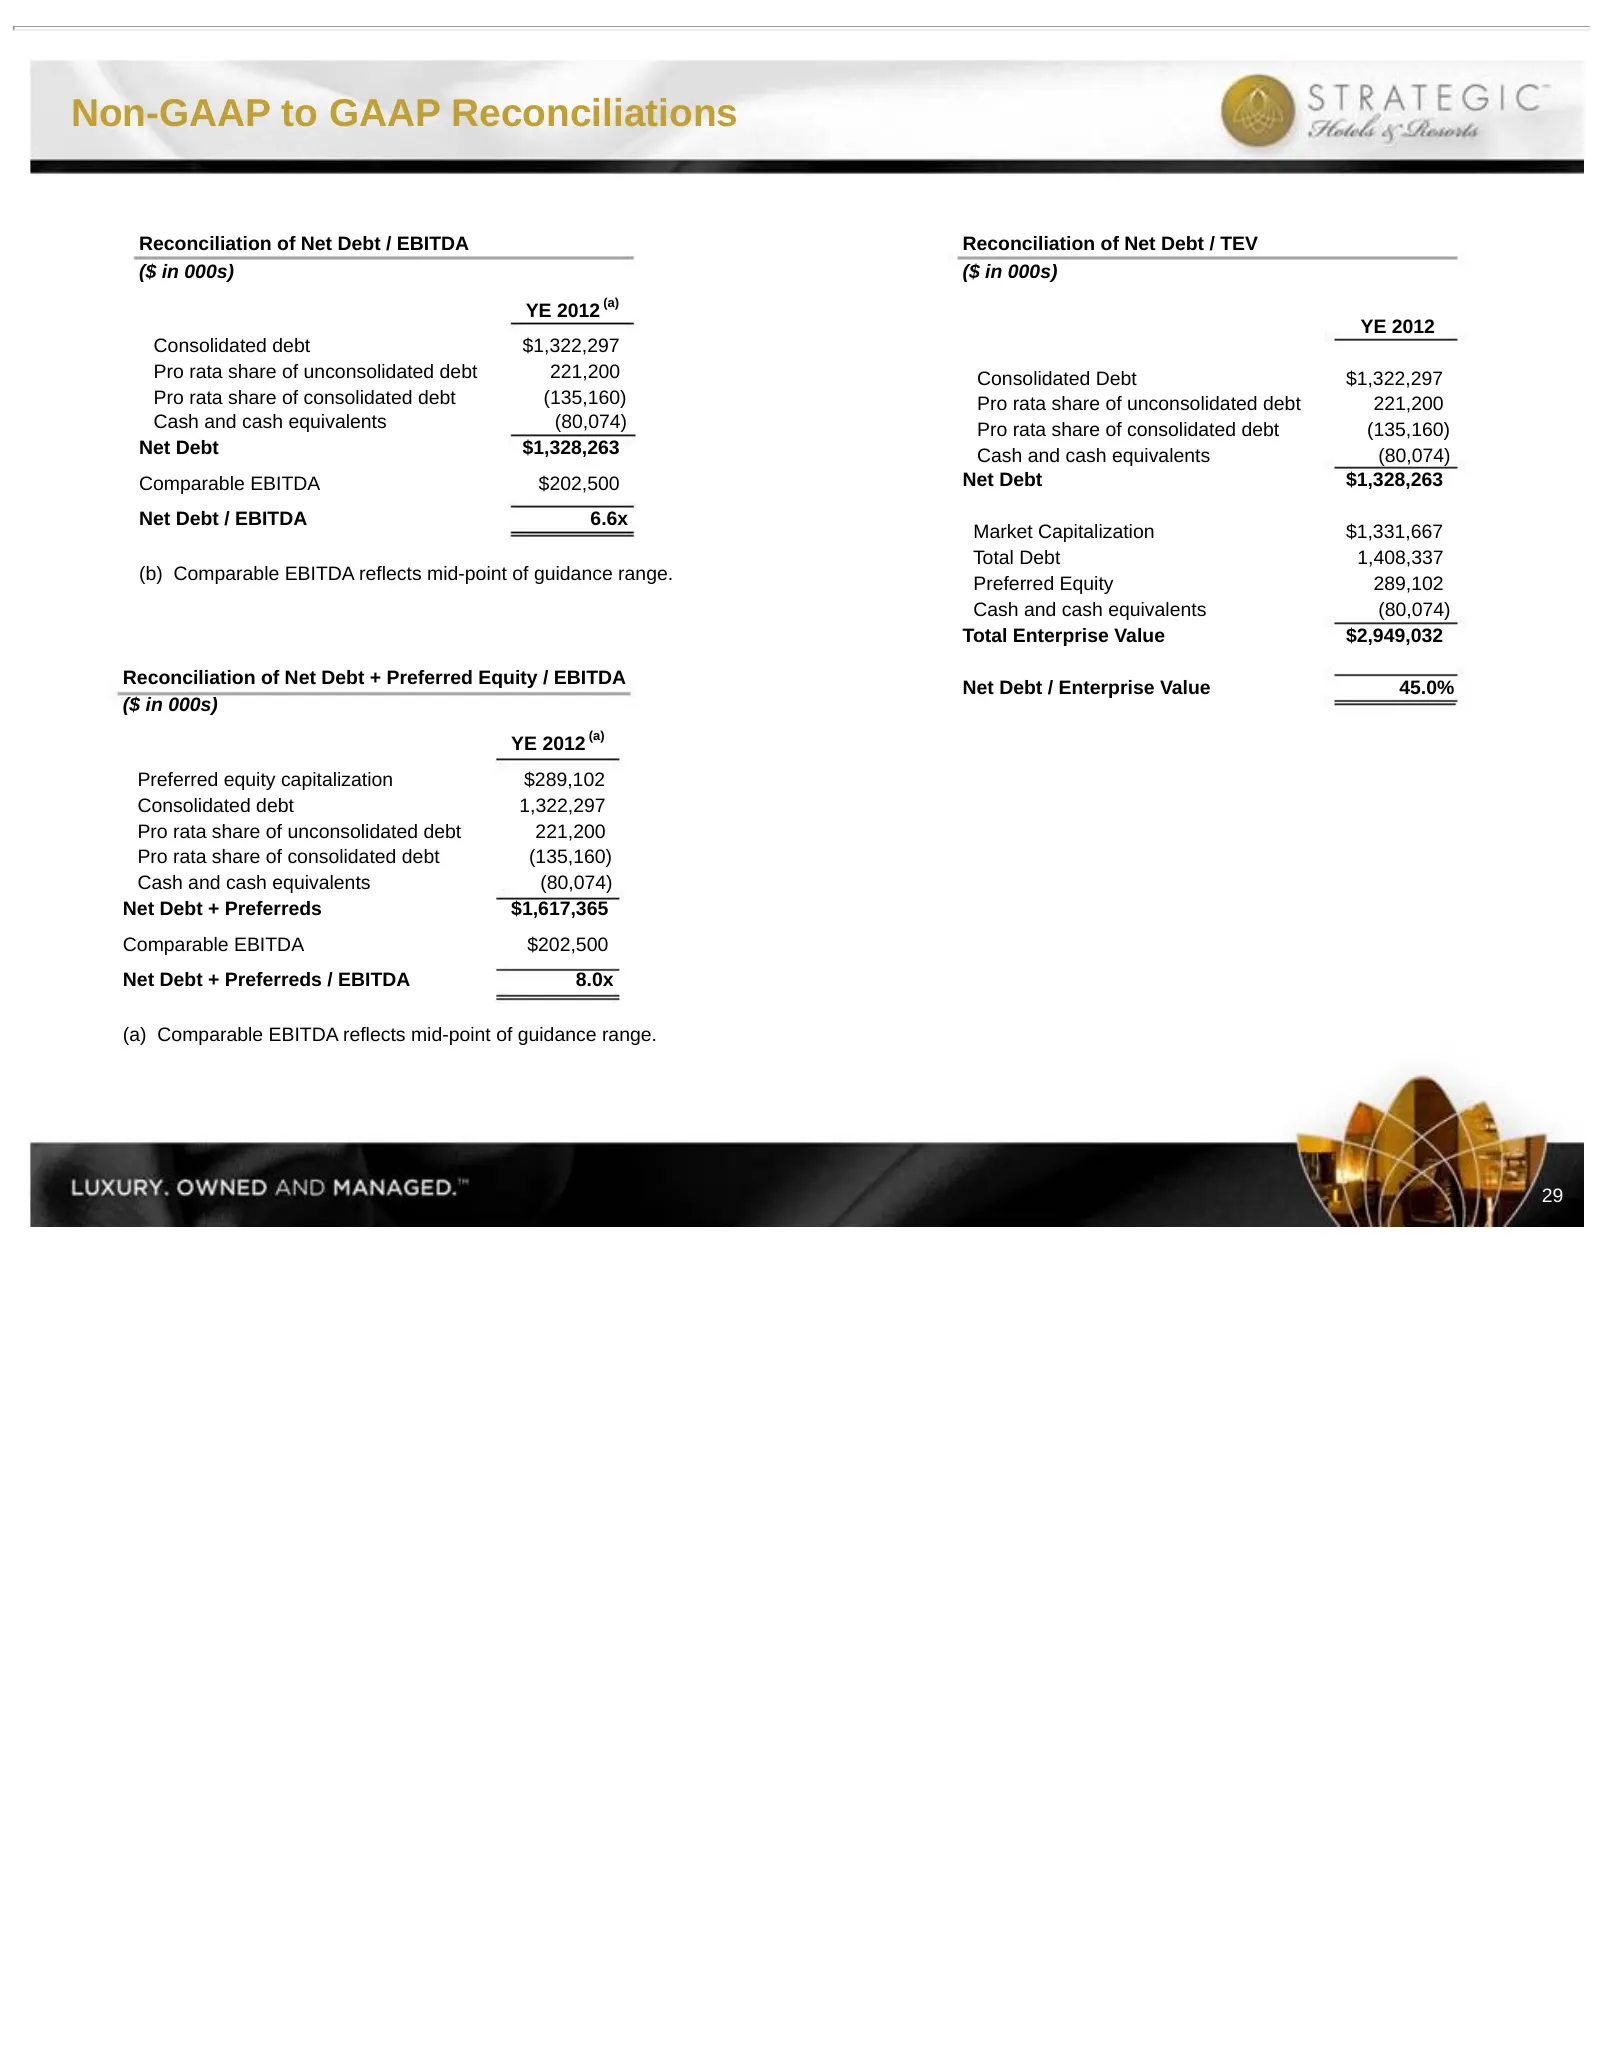
Non-GAAP to GAAP Reconciliations Reconciliation of Net Debt / EBITDA Reconciliation of Net Debt / TEV ($ in 000s) ($ in 000s) YE 2012 (a) YE 2012 Consolidated debt $1,322,297 Pro rata share of unconsolidated debt 221,200 Consolidated Debt $1,322,297 Pro rata share of consolidated debt (135,160) Pro
Slide 31: Non-GAAP to GAAP Reconciliations
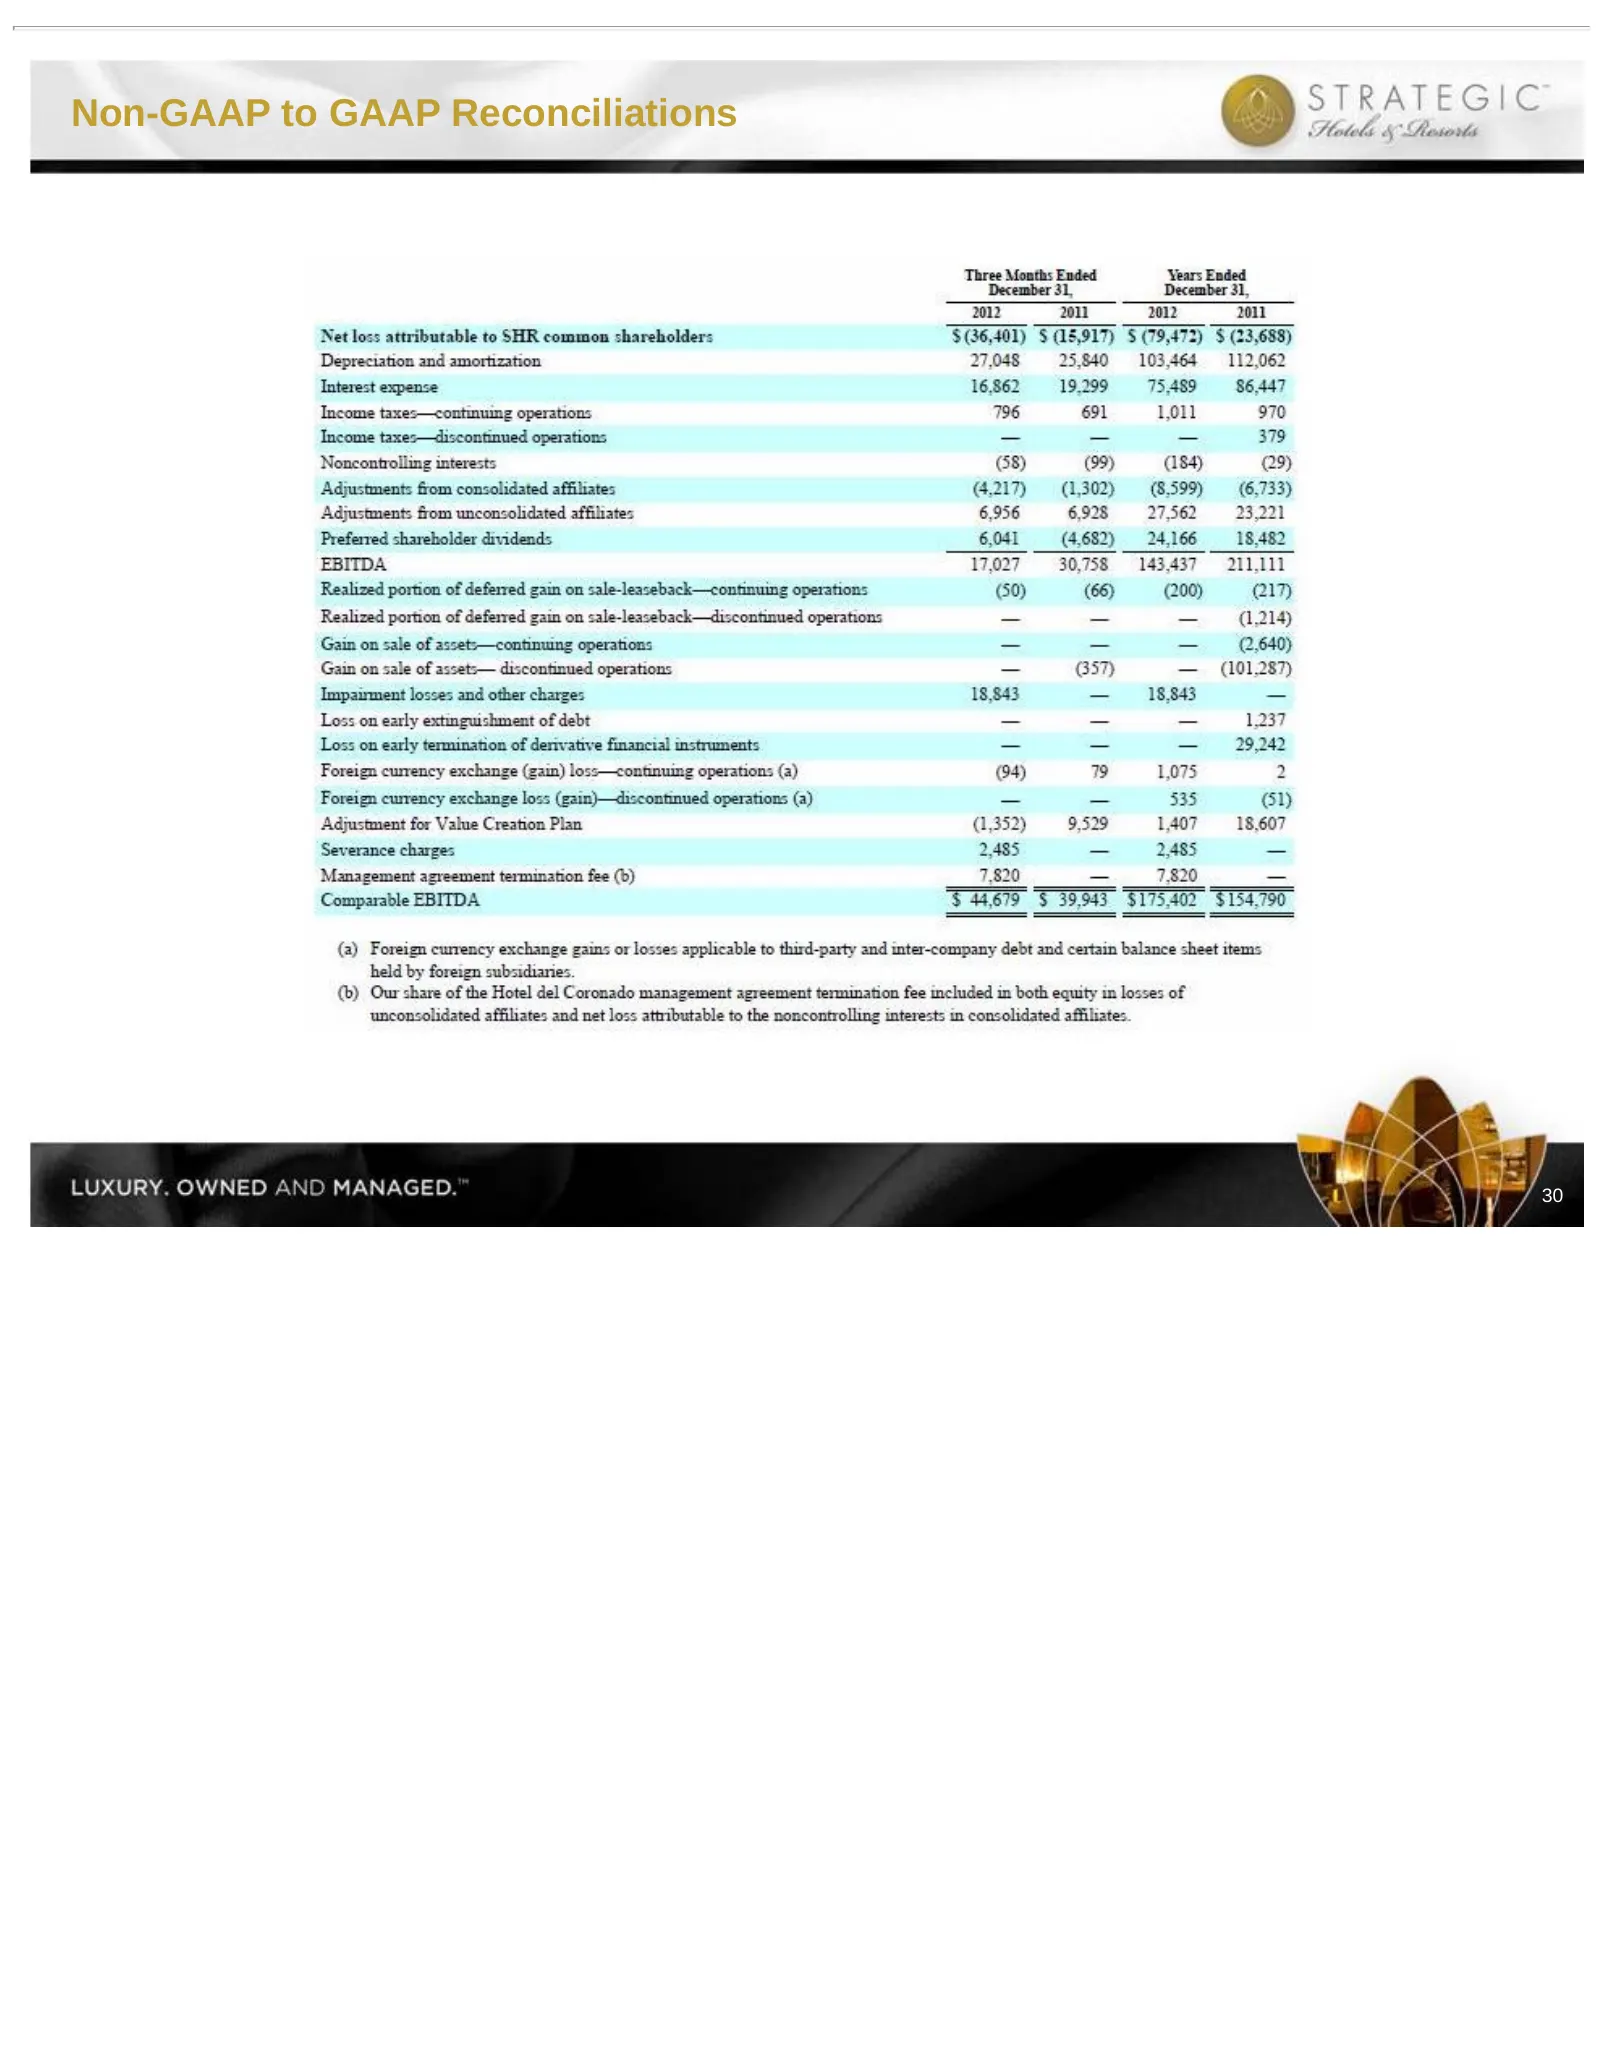
Non-GAAP to GAAP Reconciliations 30
Slide 32: Non-GAAP to GAAP Reconciliations
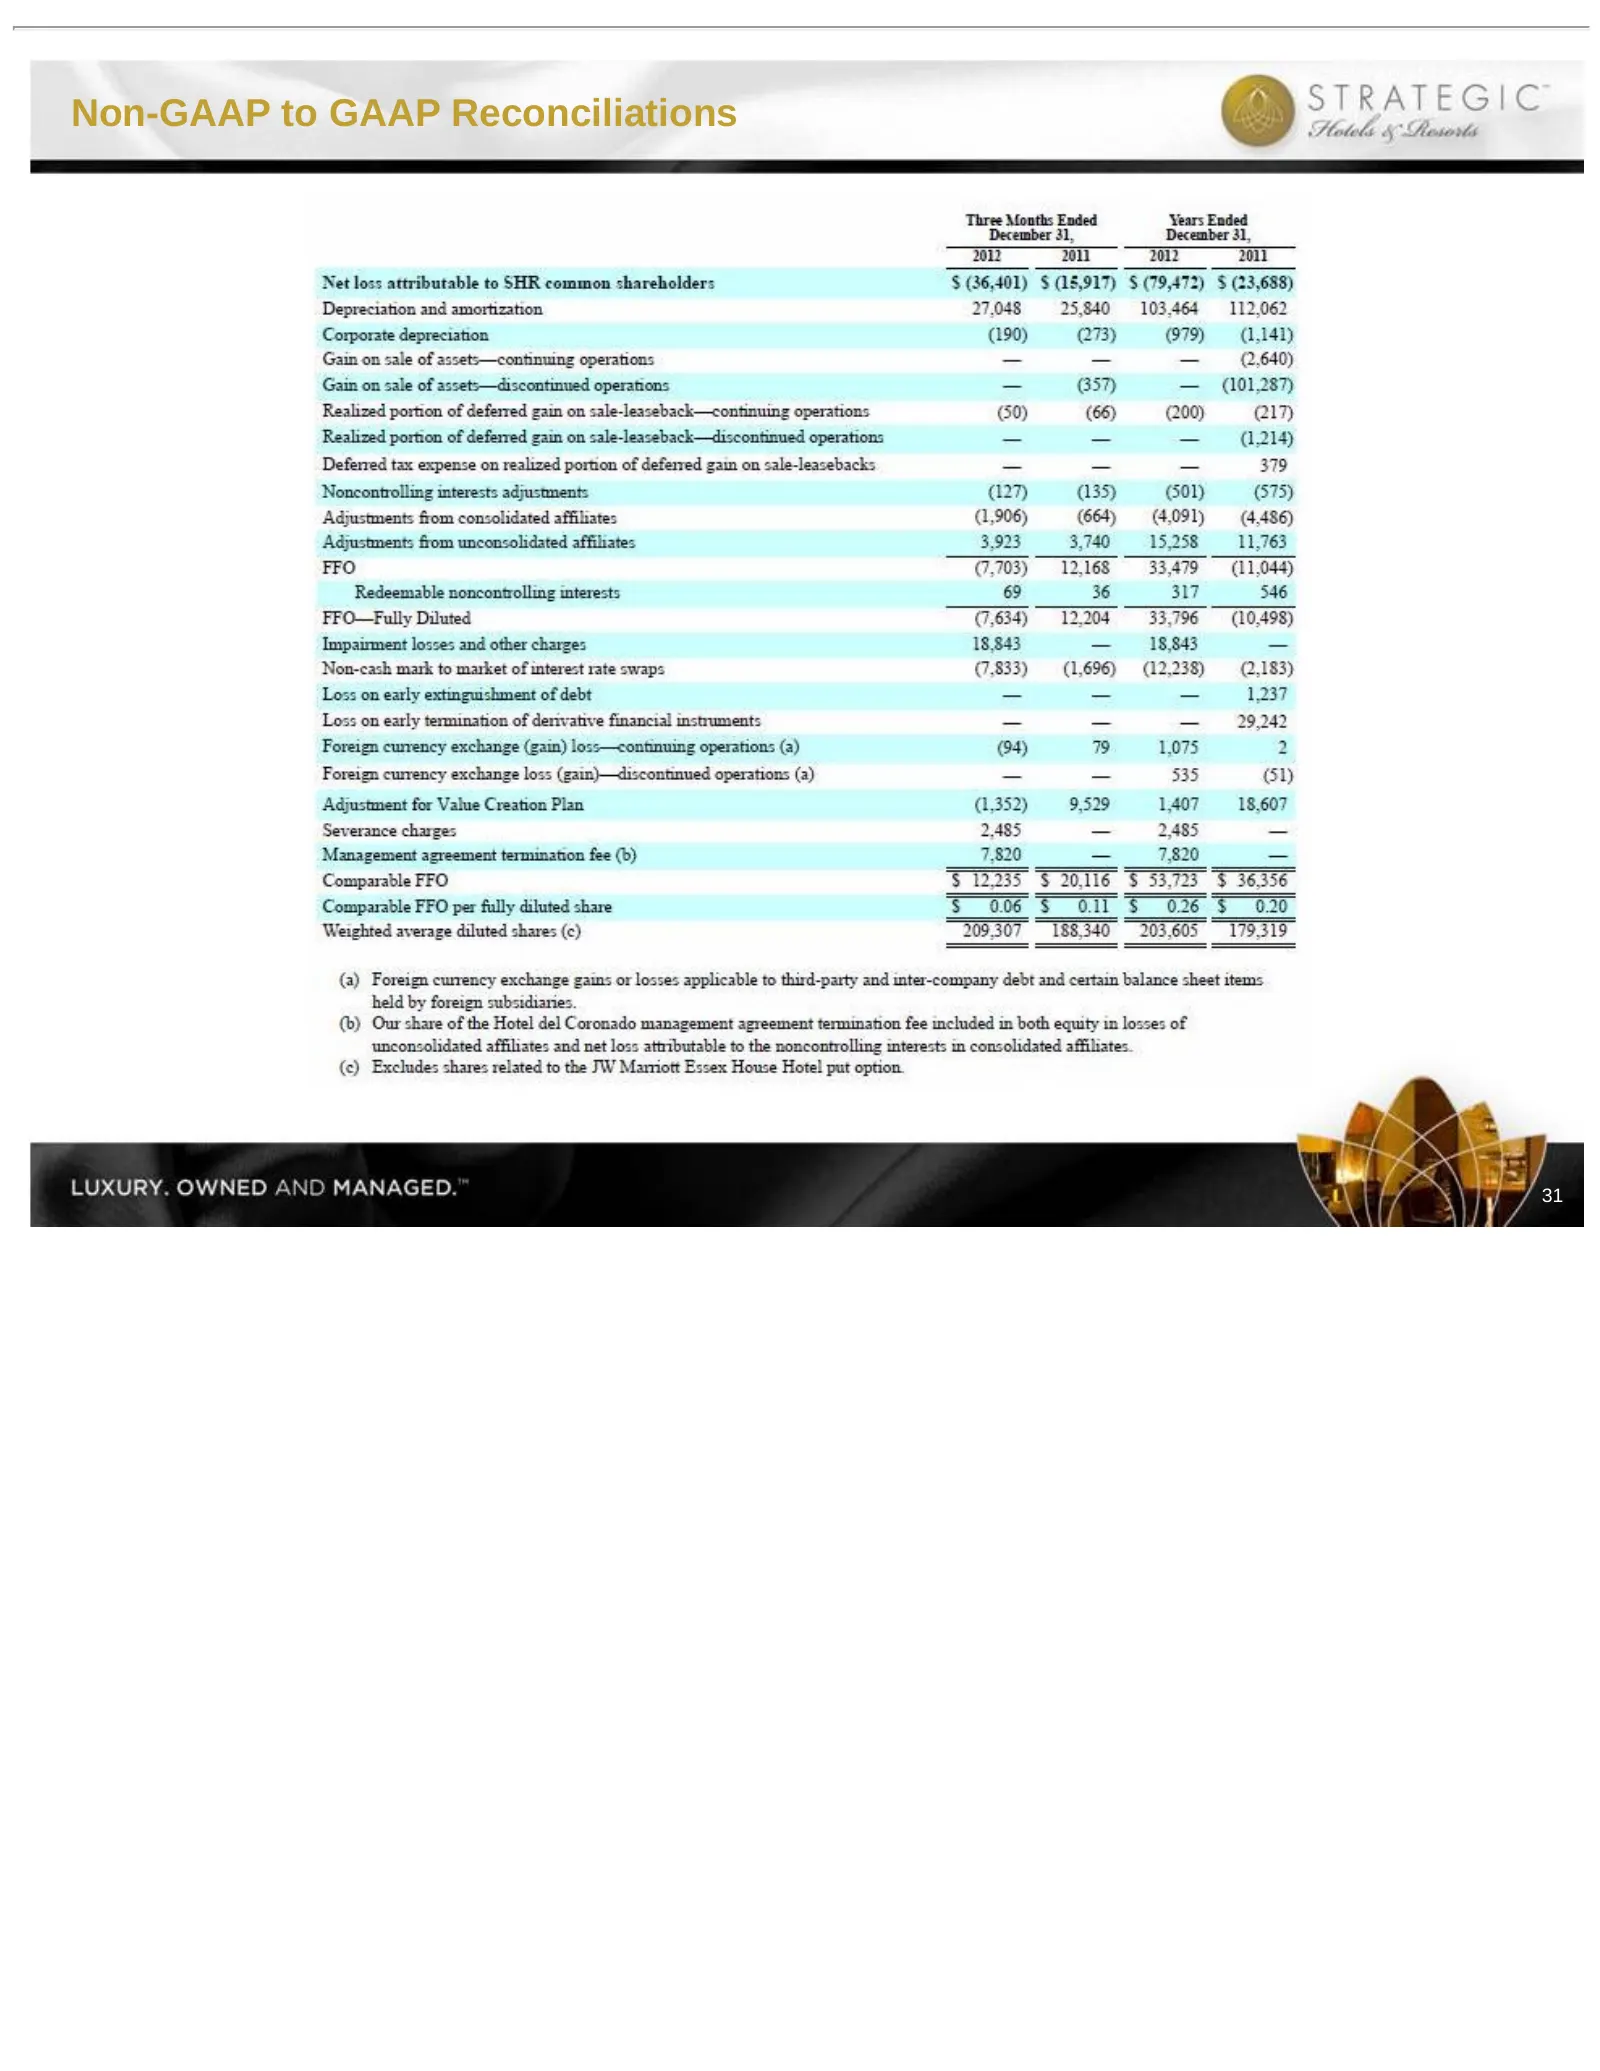
Non-GAAP to GAAP Reconciliations 31
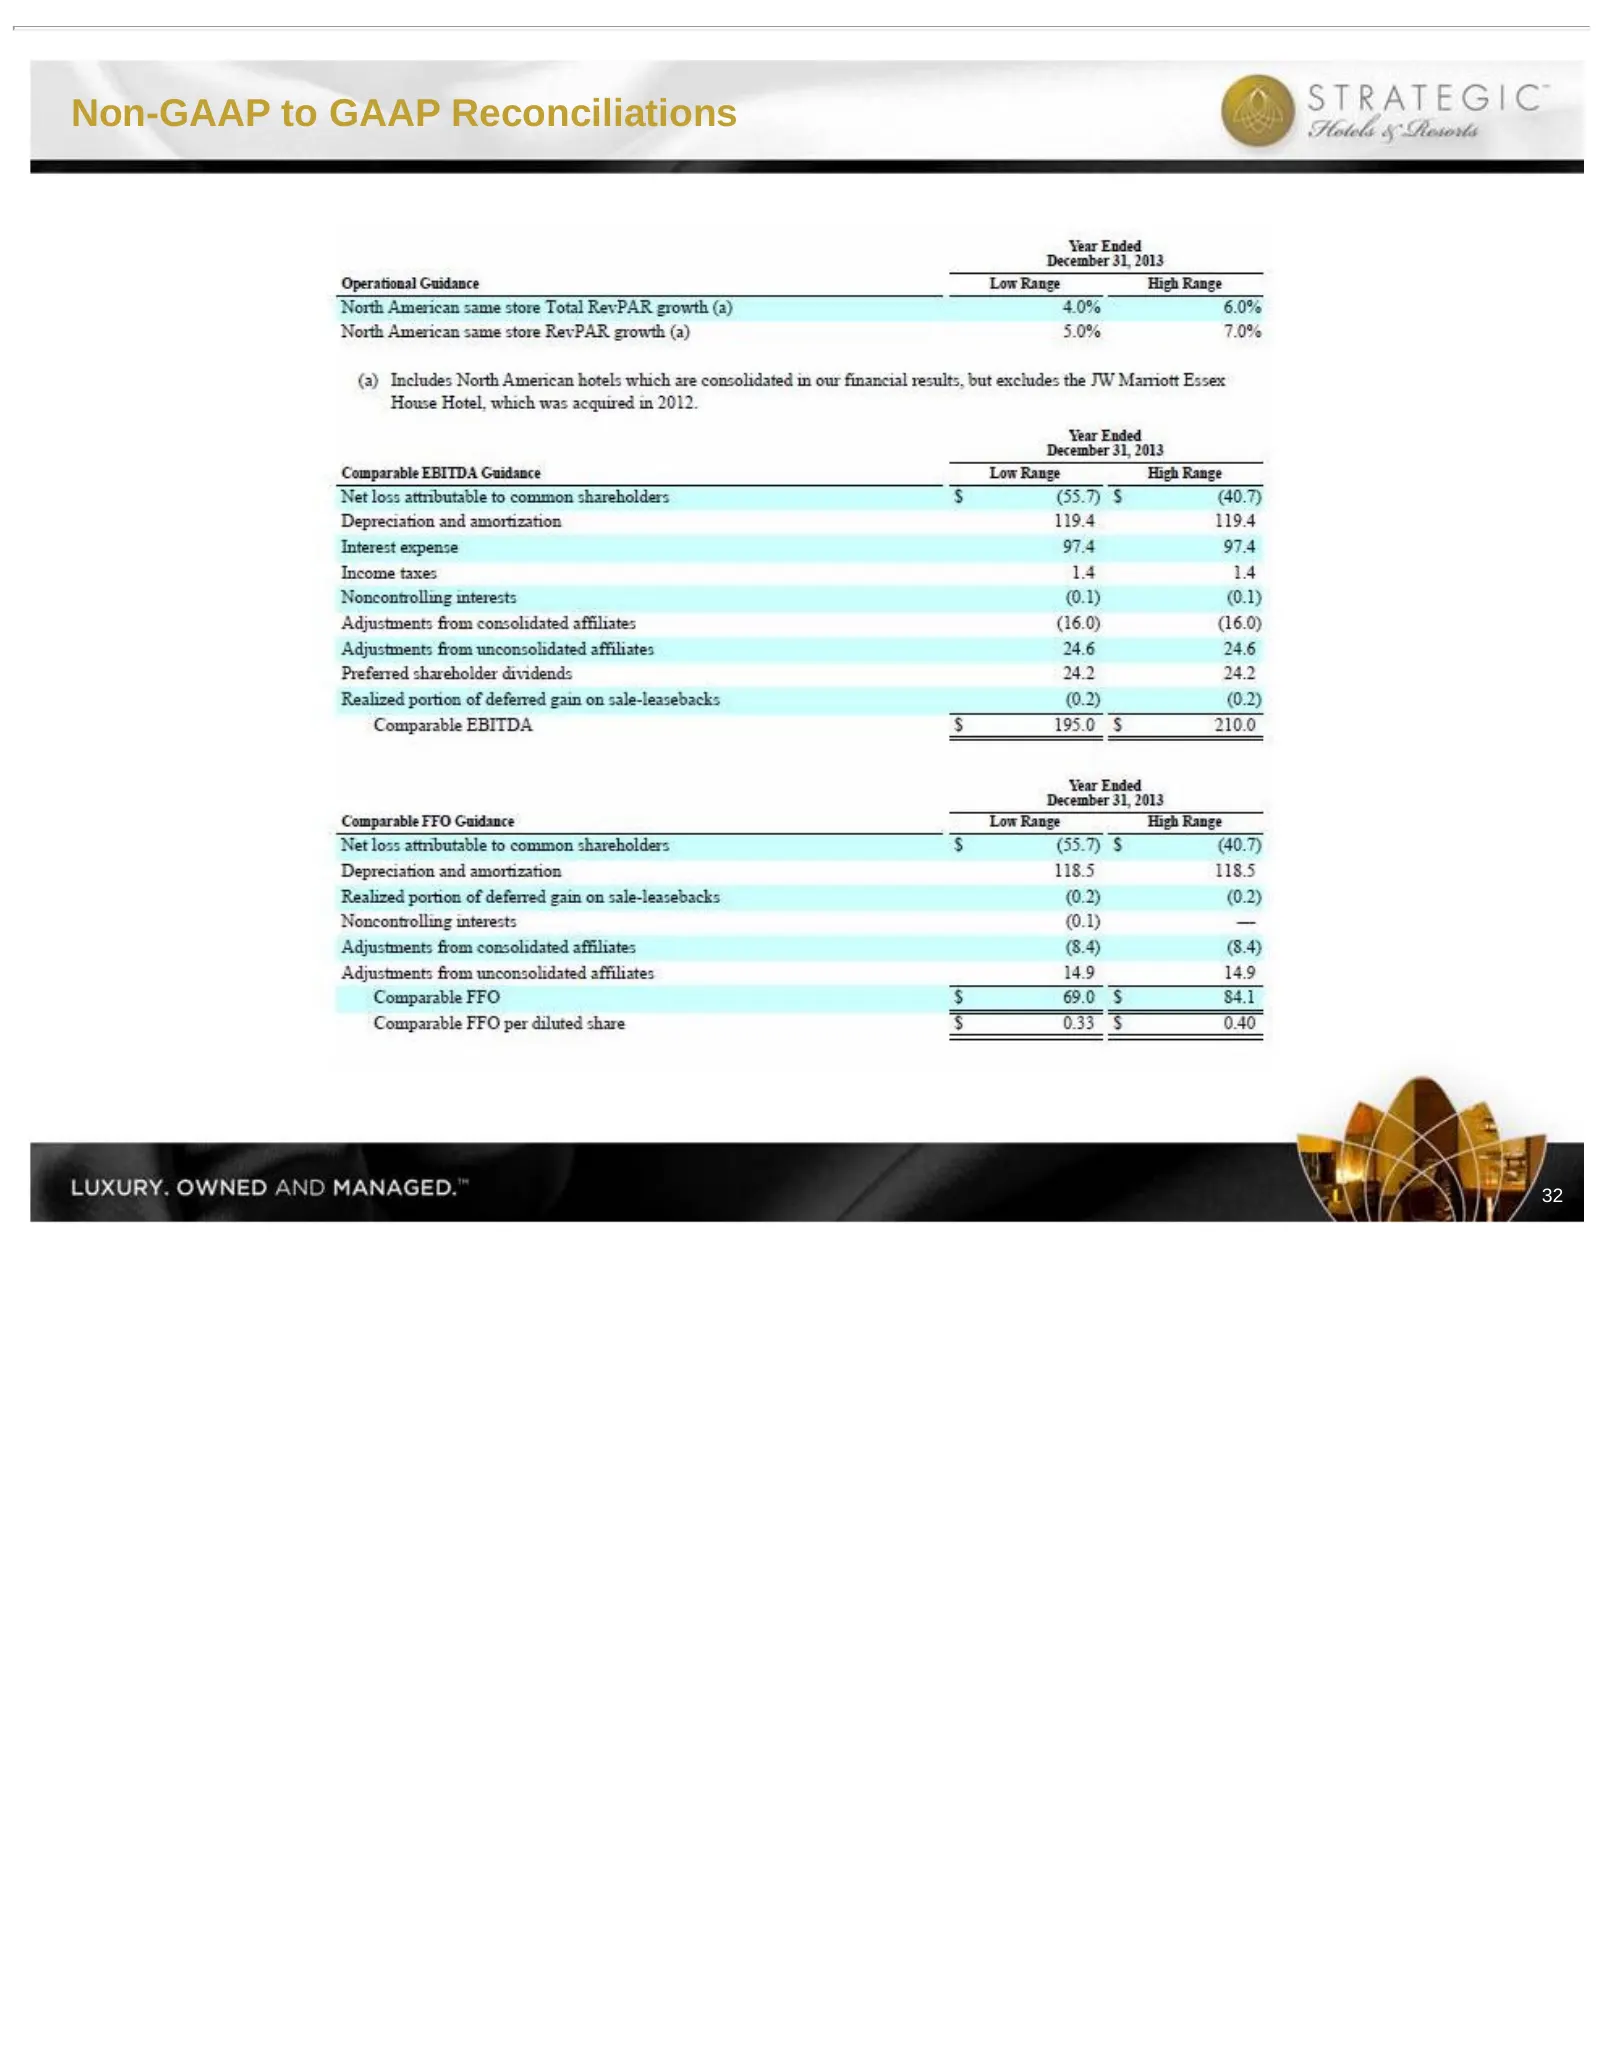
Slide 33: Non-GAAP to GAAP Reconciliations
Non-GAAP to GAAP Reconciliations 32
Slide 34: Thank You
STRATEGIC Slolels & Aesorts Thank You
Source: SEC EDGAR · 8-K filed Mar 4, 2013
More decks from Strategic Hotels and Resorts Inc
 Investor Presentation (June 2015)43 slides · Jun 1, 2015
 Investor Presentation (February 2015)43 slides · Feb 24, 2015
 Investor Presentation (January 2015)44 slides · Jan 26, 2015
 Investor Presentation (November 2014)50 slides · Nov 5, 2014
 Investor Presentation (October 2014)50 slides · Oct 3, 2014
 Investor Day (September 2014)67 slides · Sep 22, 2014