Florida East Coast Industries Inc
Florida East Coast Industries — Investor Presentation (November 2003)
37 slides from Florida East Coast Industries's investor presentation, Nov 13, 2003
Slide 1: Unlocking the Value
“Unlocking the Value” November 13, 2003
Slide 2: Florida East Coast Industries
Florida East Coast Industries This presentation contains forward-looking statements within the meaning of Section 27A of the Securities Act of 1933, as amended, and Section 21E of the Securities Exchange Act of 1934, as amended. These forward-looking statements include the Company's present expectat
Slide 3: The History of Florida East Coast Industries
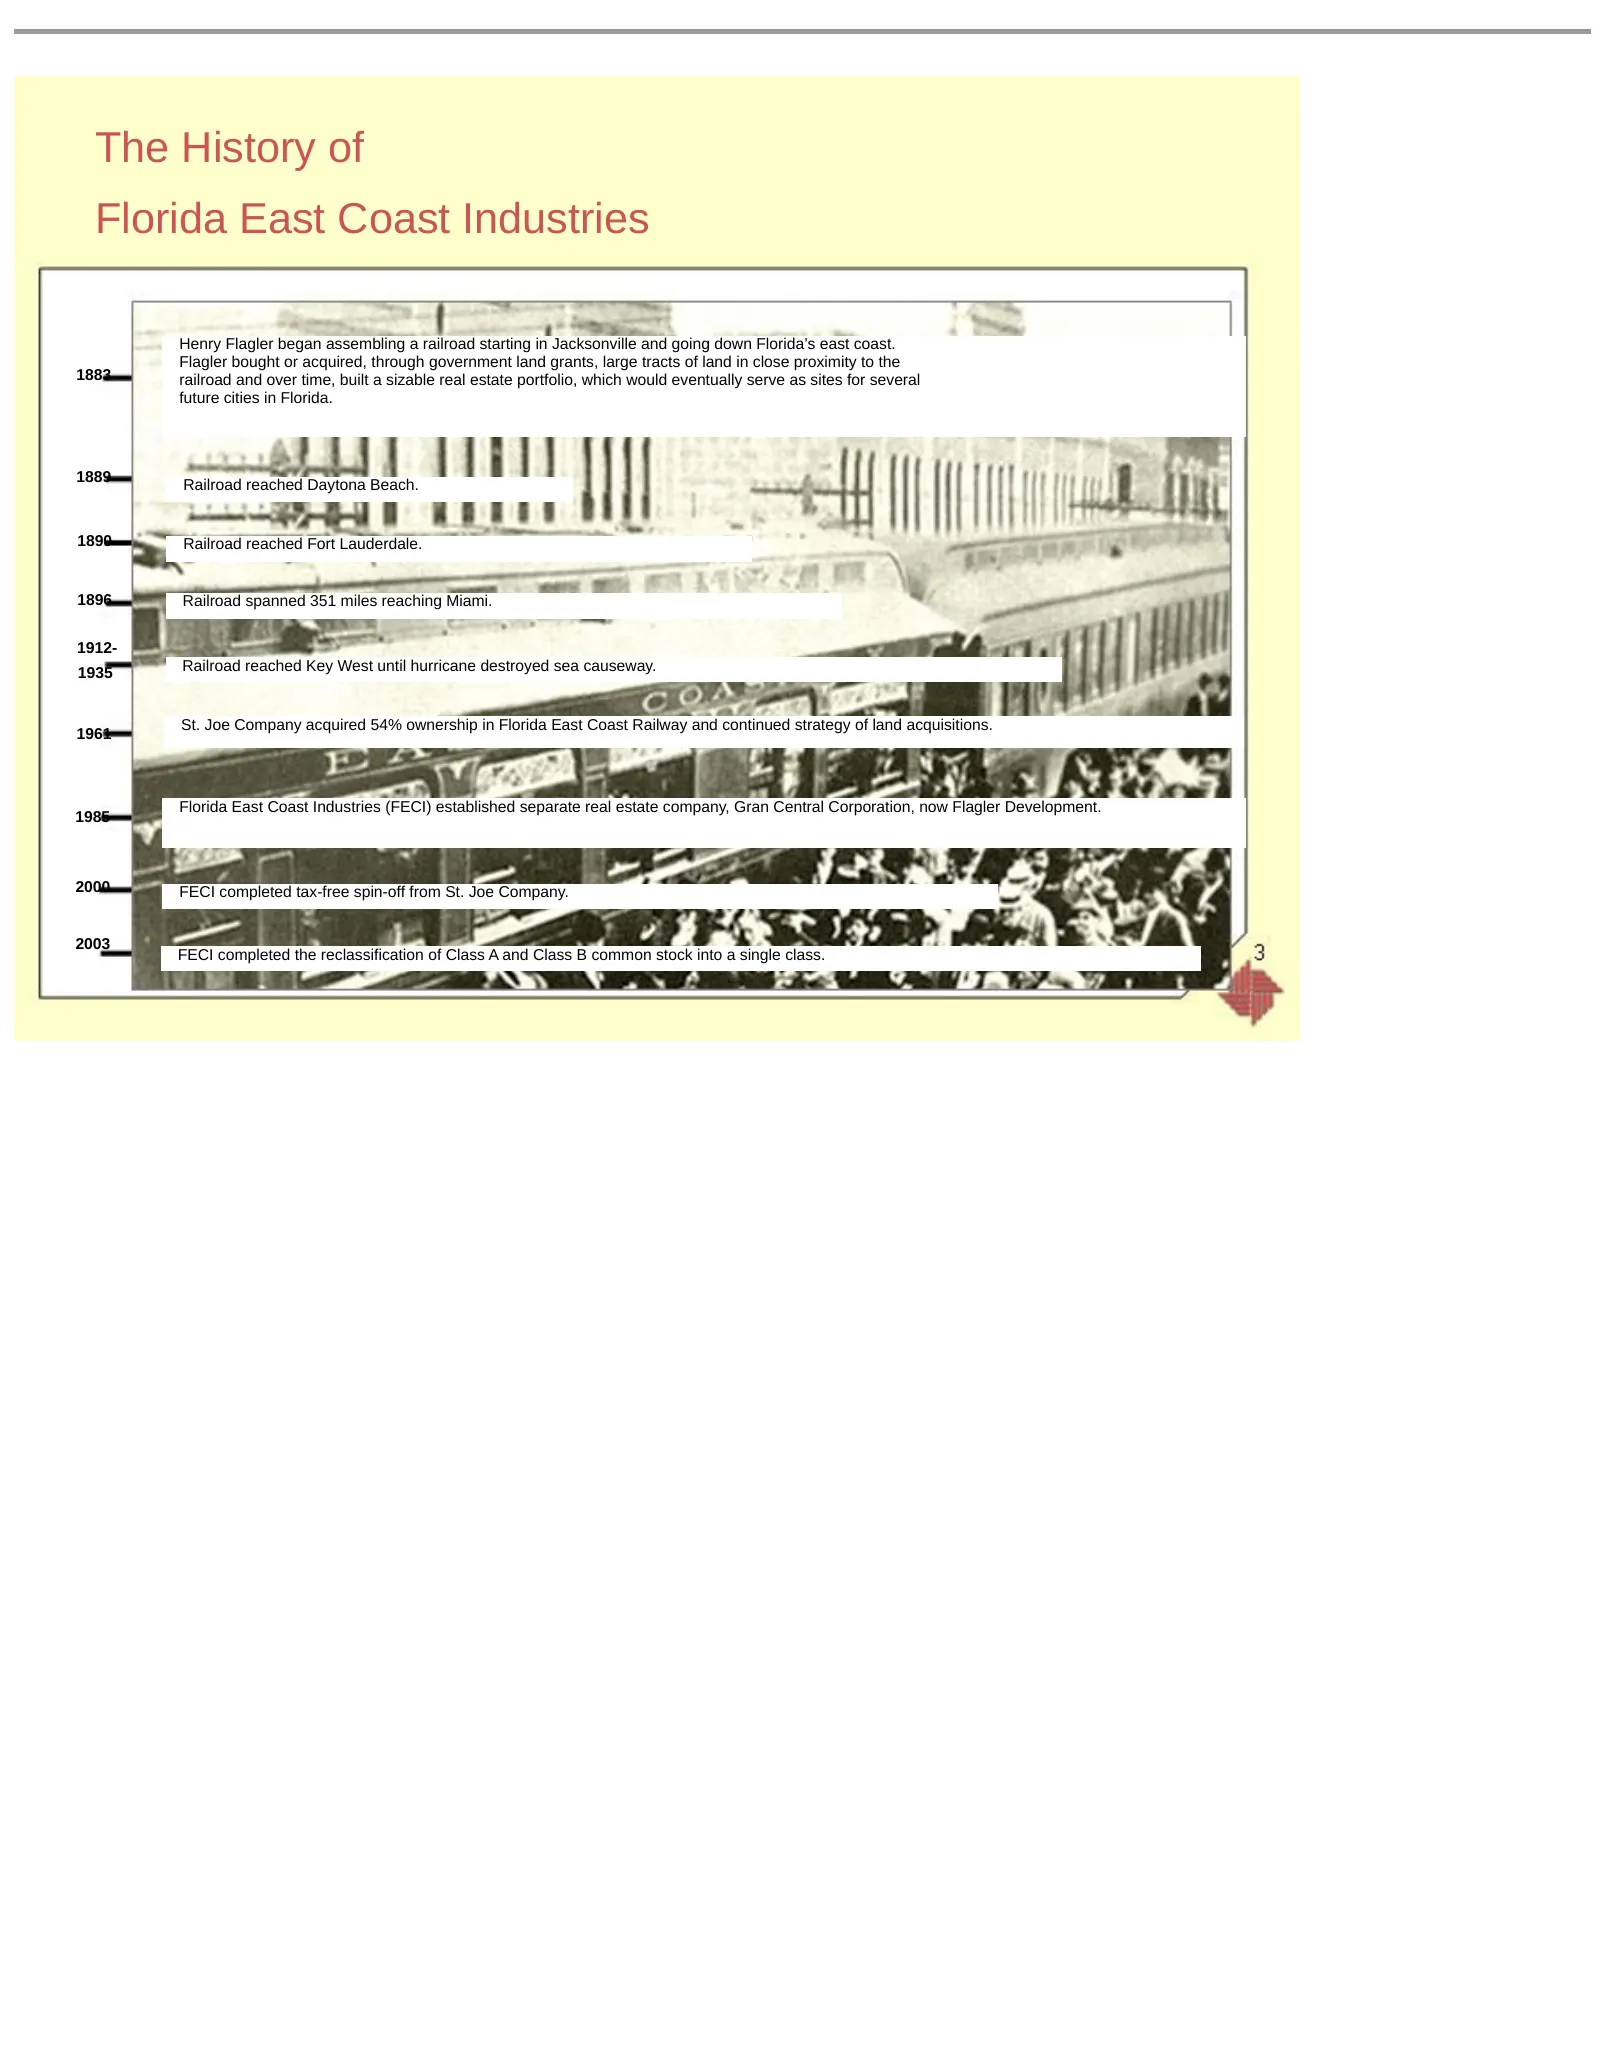
The History of Florida East Coast Industries Henry Flagler began assembling a railroad starting in Jacksonville and going down Florida’s east coast. Flagler bought or acquired, through government land grants, large tracts of land in close proximity to the 1883 railroad and over time, built a sizable
Slide 4: Florida East Coast Industries
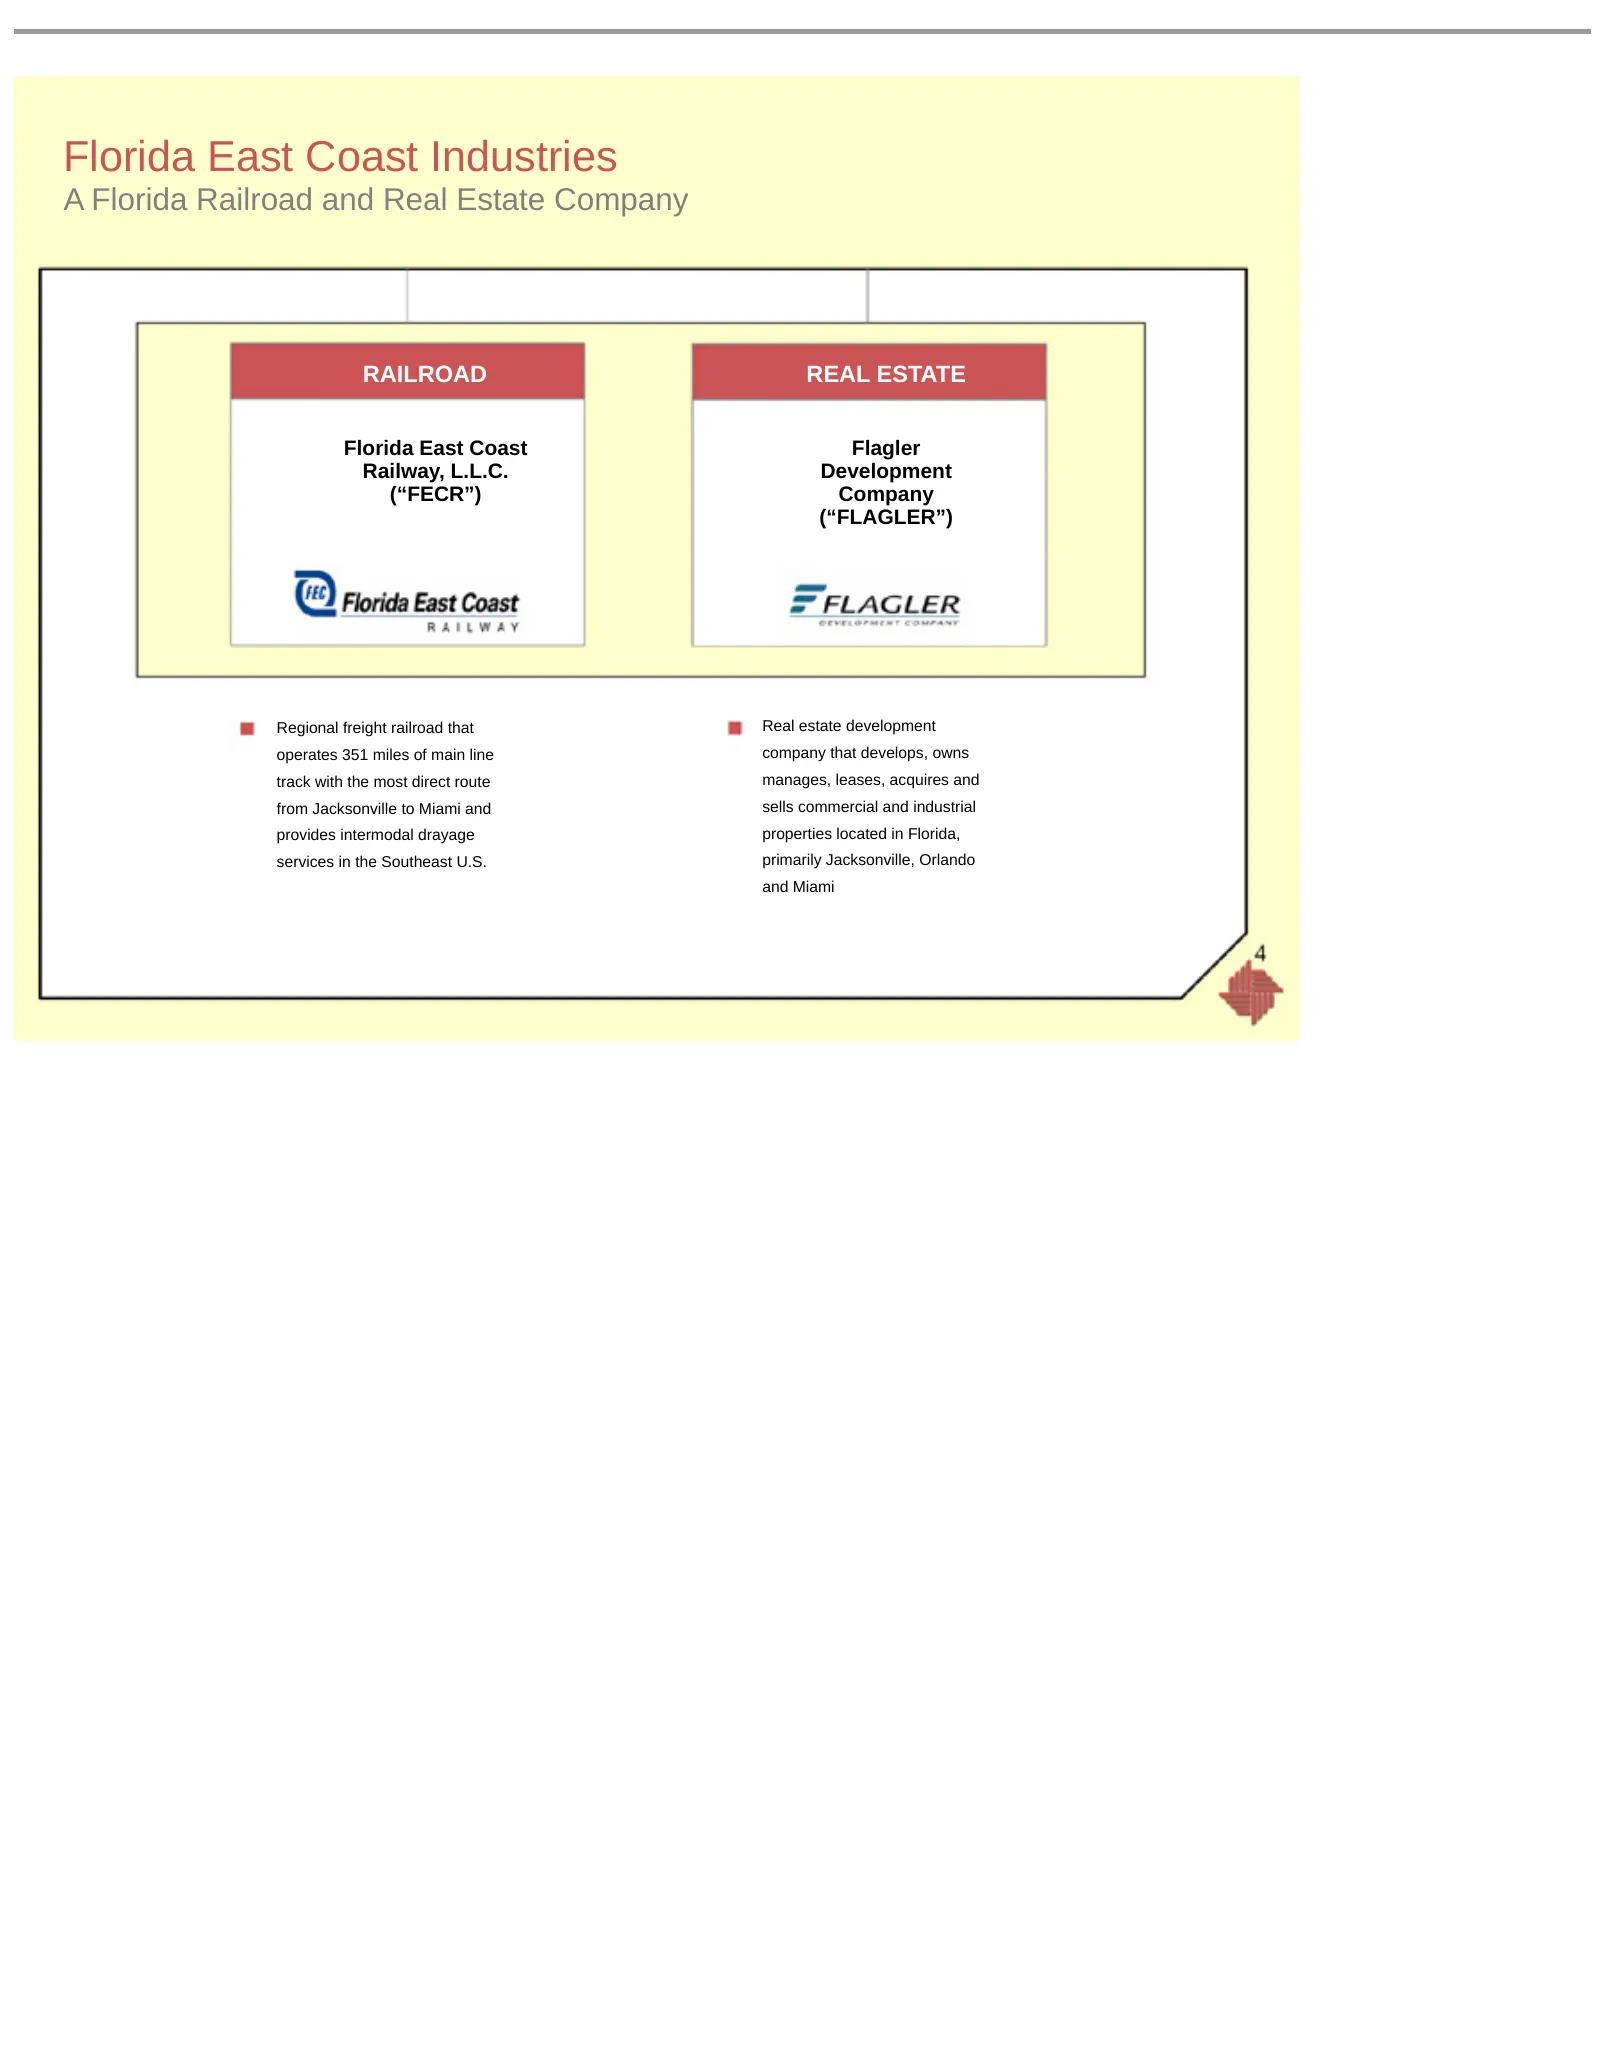
Florida East Coast Industries A Florida Railroad and Real Estate Company RAILROAD REAL ESTATE Florida East Coast Flagler Railway, L.L.C. Development (“FECR”) Company (“FLAGLER”) Regional freight railroad that Real estate development operates 351 miles of main line company that develops, owns track w
Slide 5: Key Investment Points
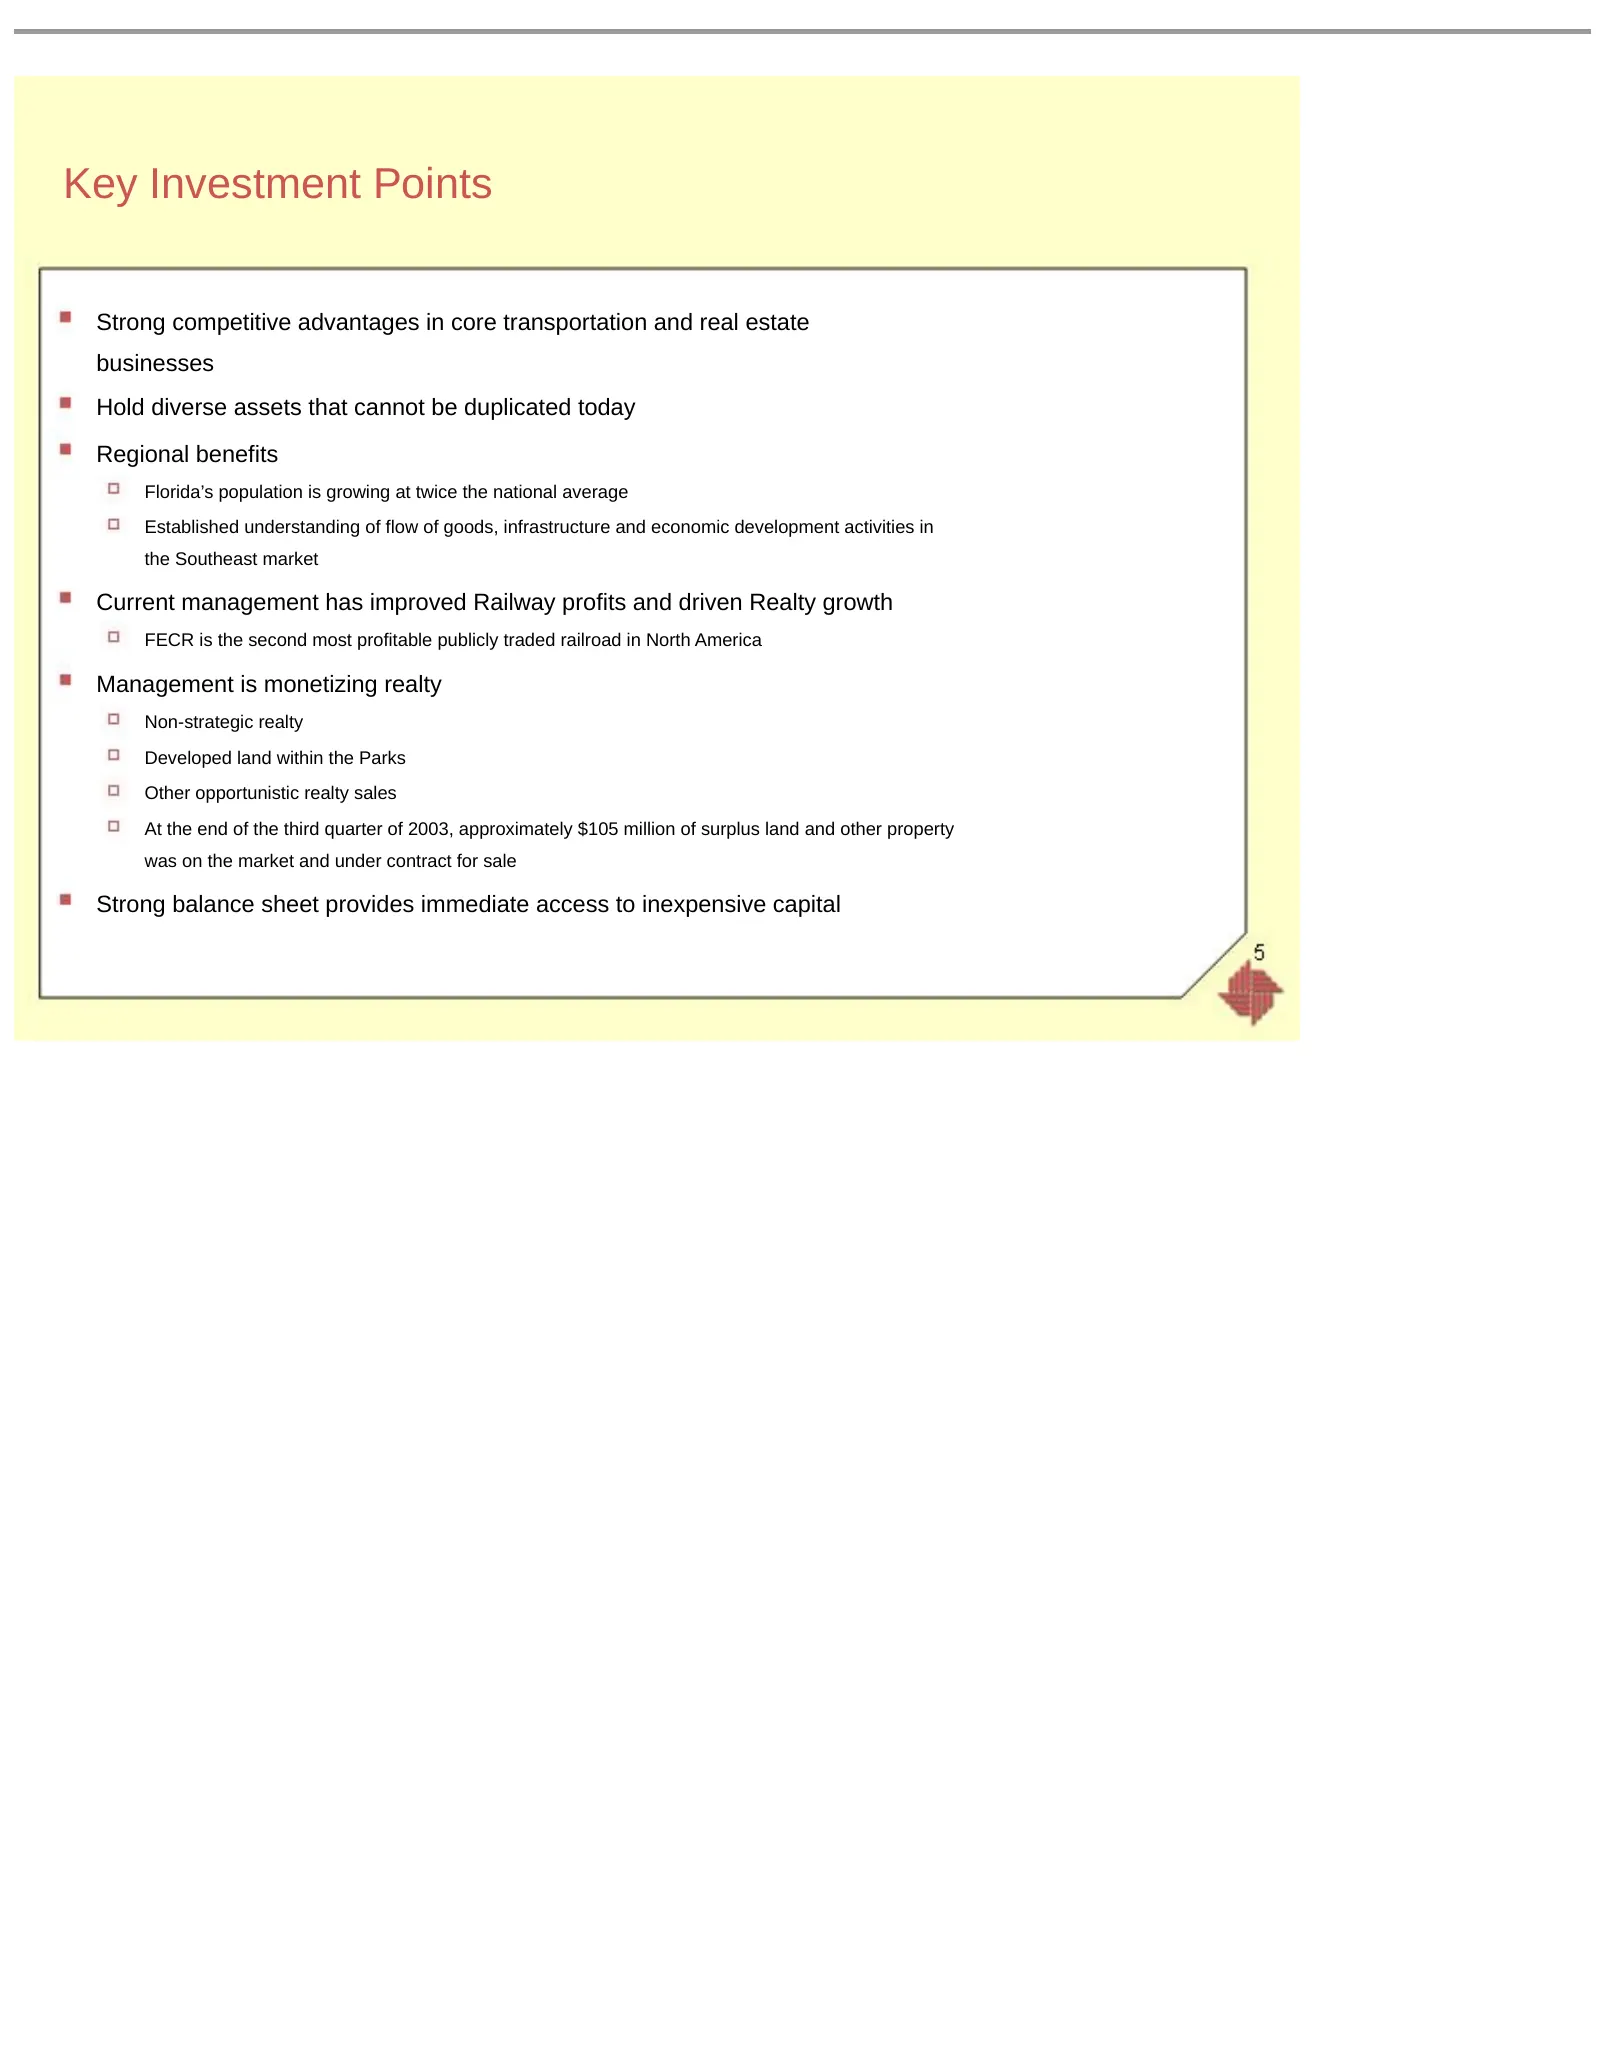
Key Investment Points Strong competitive advantages in core transportation and real estate businesses Hold diverse assets that cannot be duplicated today Regional benefits Florida’s population is growing at twice the national average Established understanding of flow of goods, infrastructure and eco
Slide 6: Florida's Growth Comparisons
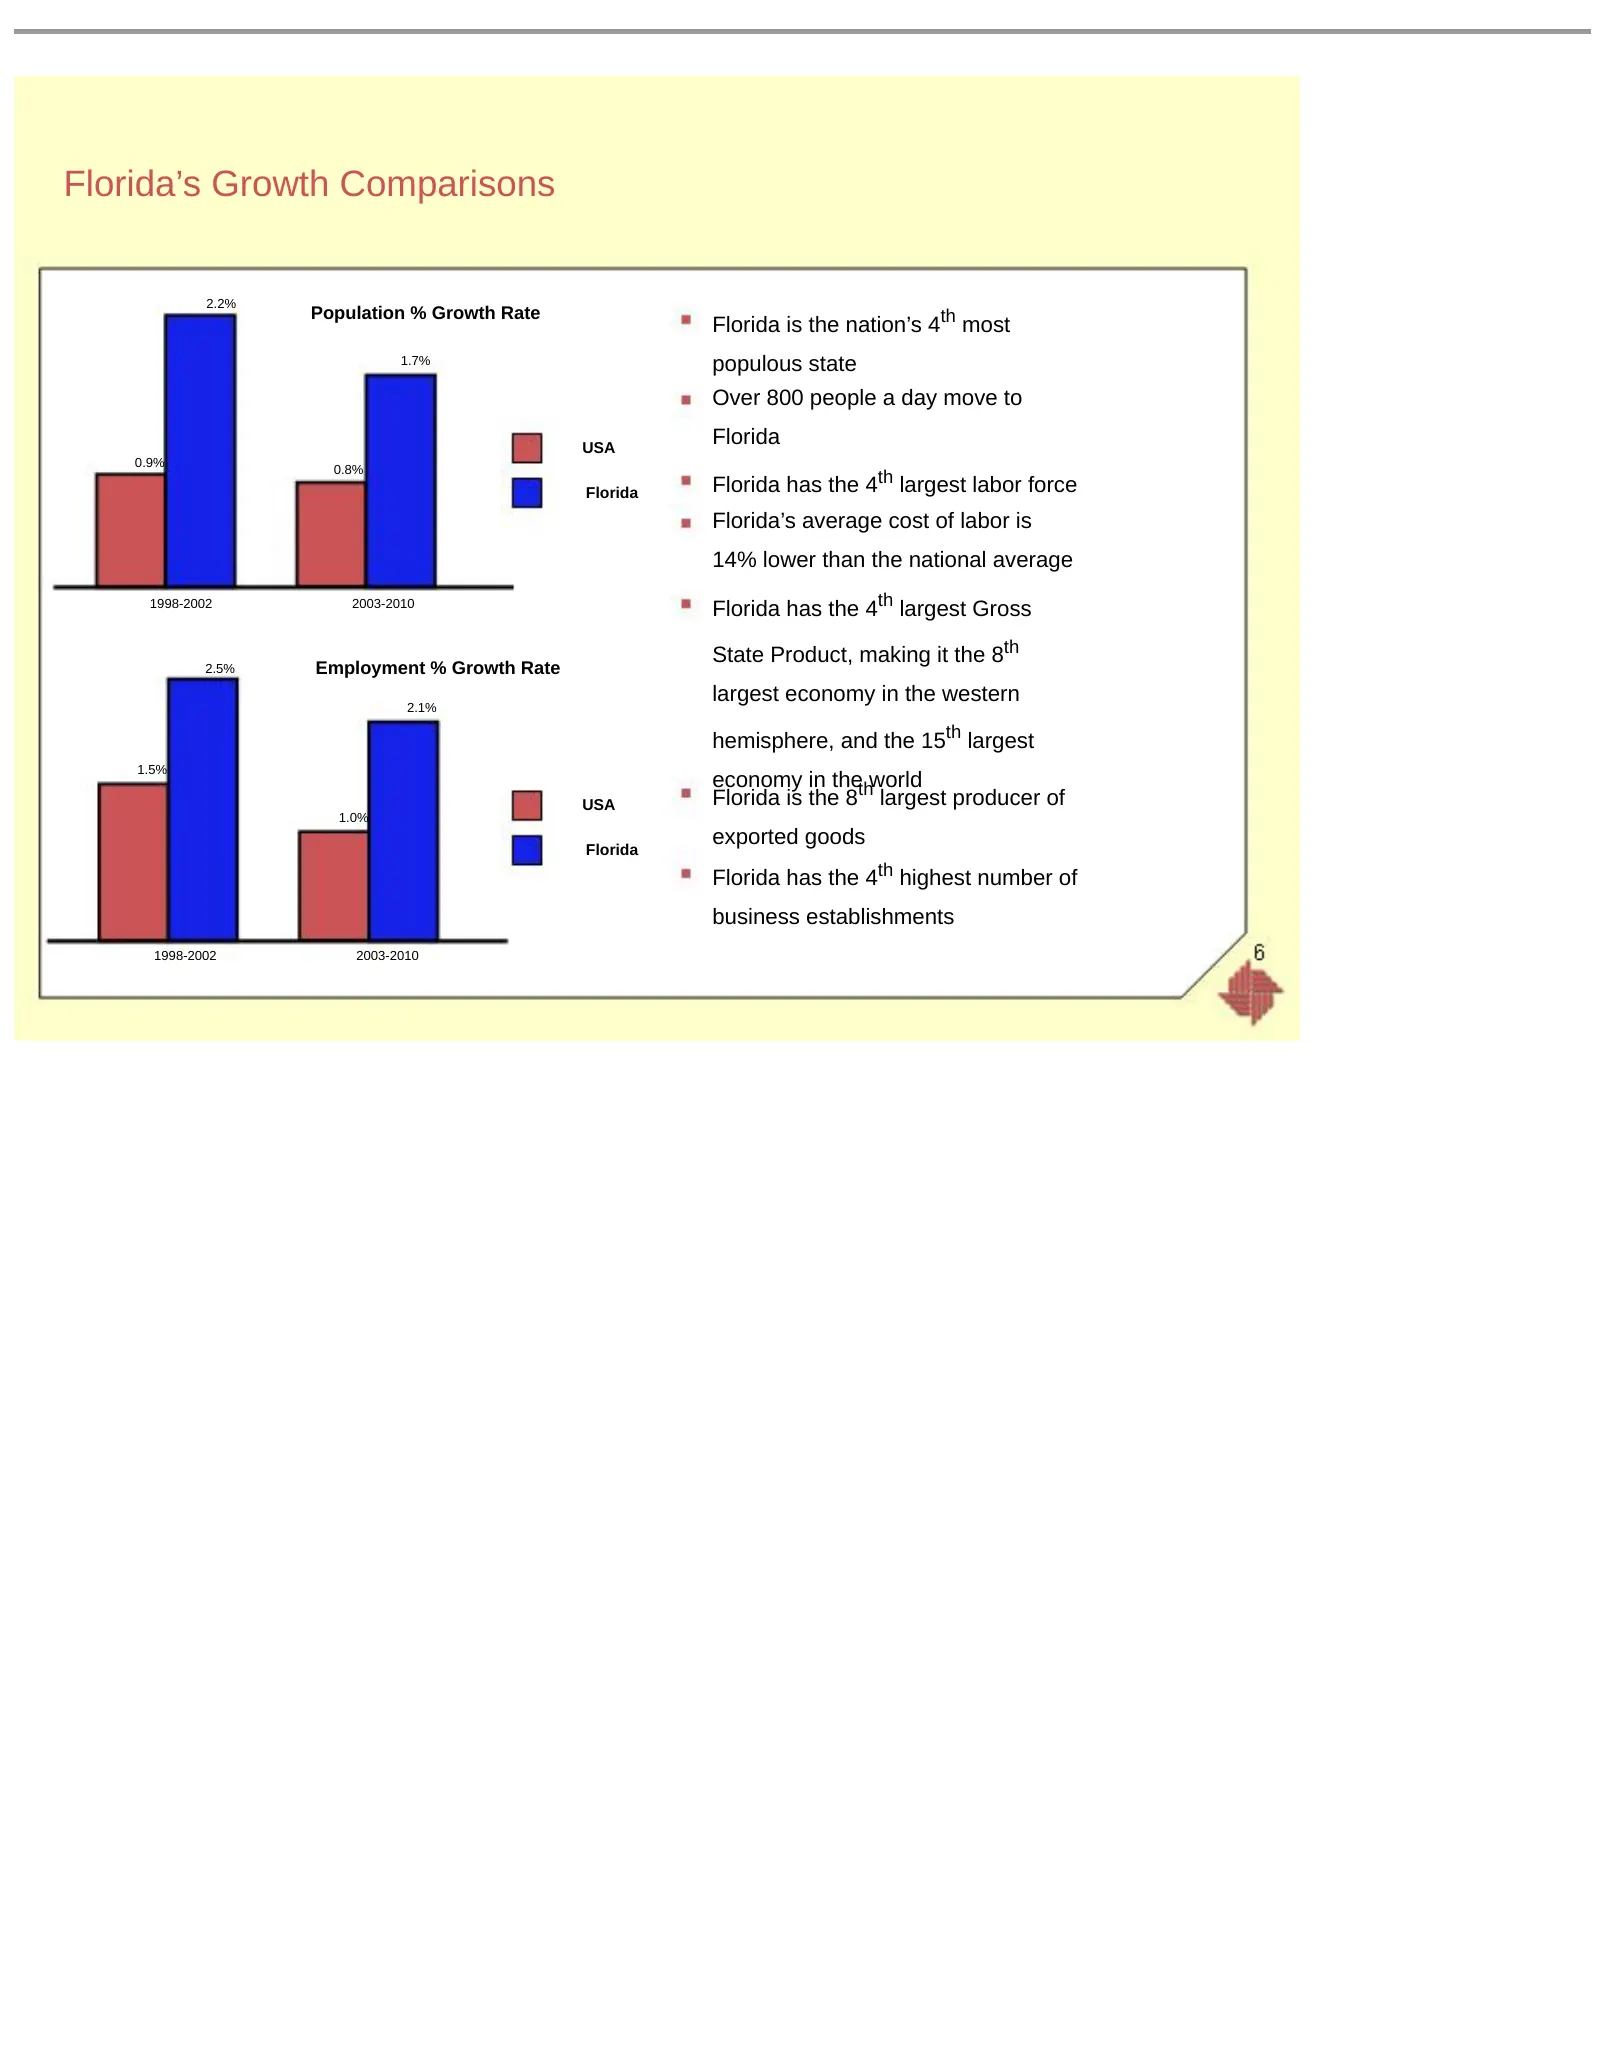
Florida’s Growth Comparisons 2.2% Population % Growth Rate Florida is the nation’s 4th most 1.7% populous state Over 800 people a day move to USA Florida 0.9% 0.8% Florida Florida has the 4th largest labor force Florida’s average cost of labor is 14% lower than the national average 1998-2002 2003-20
Slide 7: Transportation
Transportation cep tan Was (DAK: eo
Slide 8: FECR's Transportation Reach
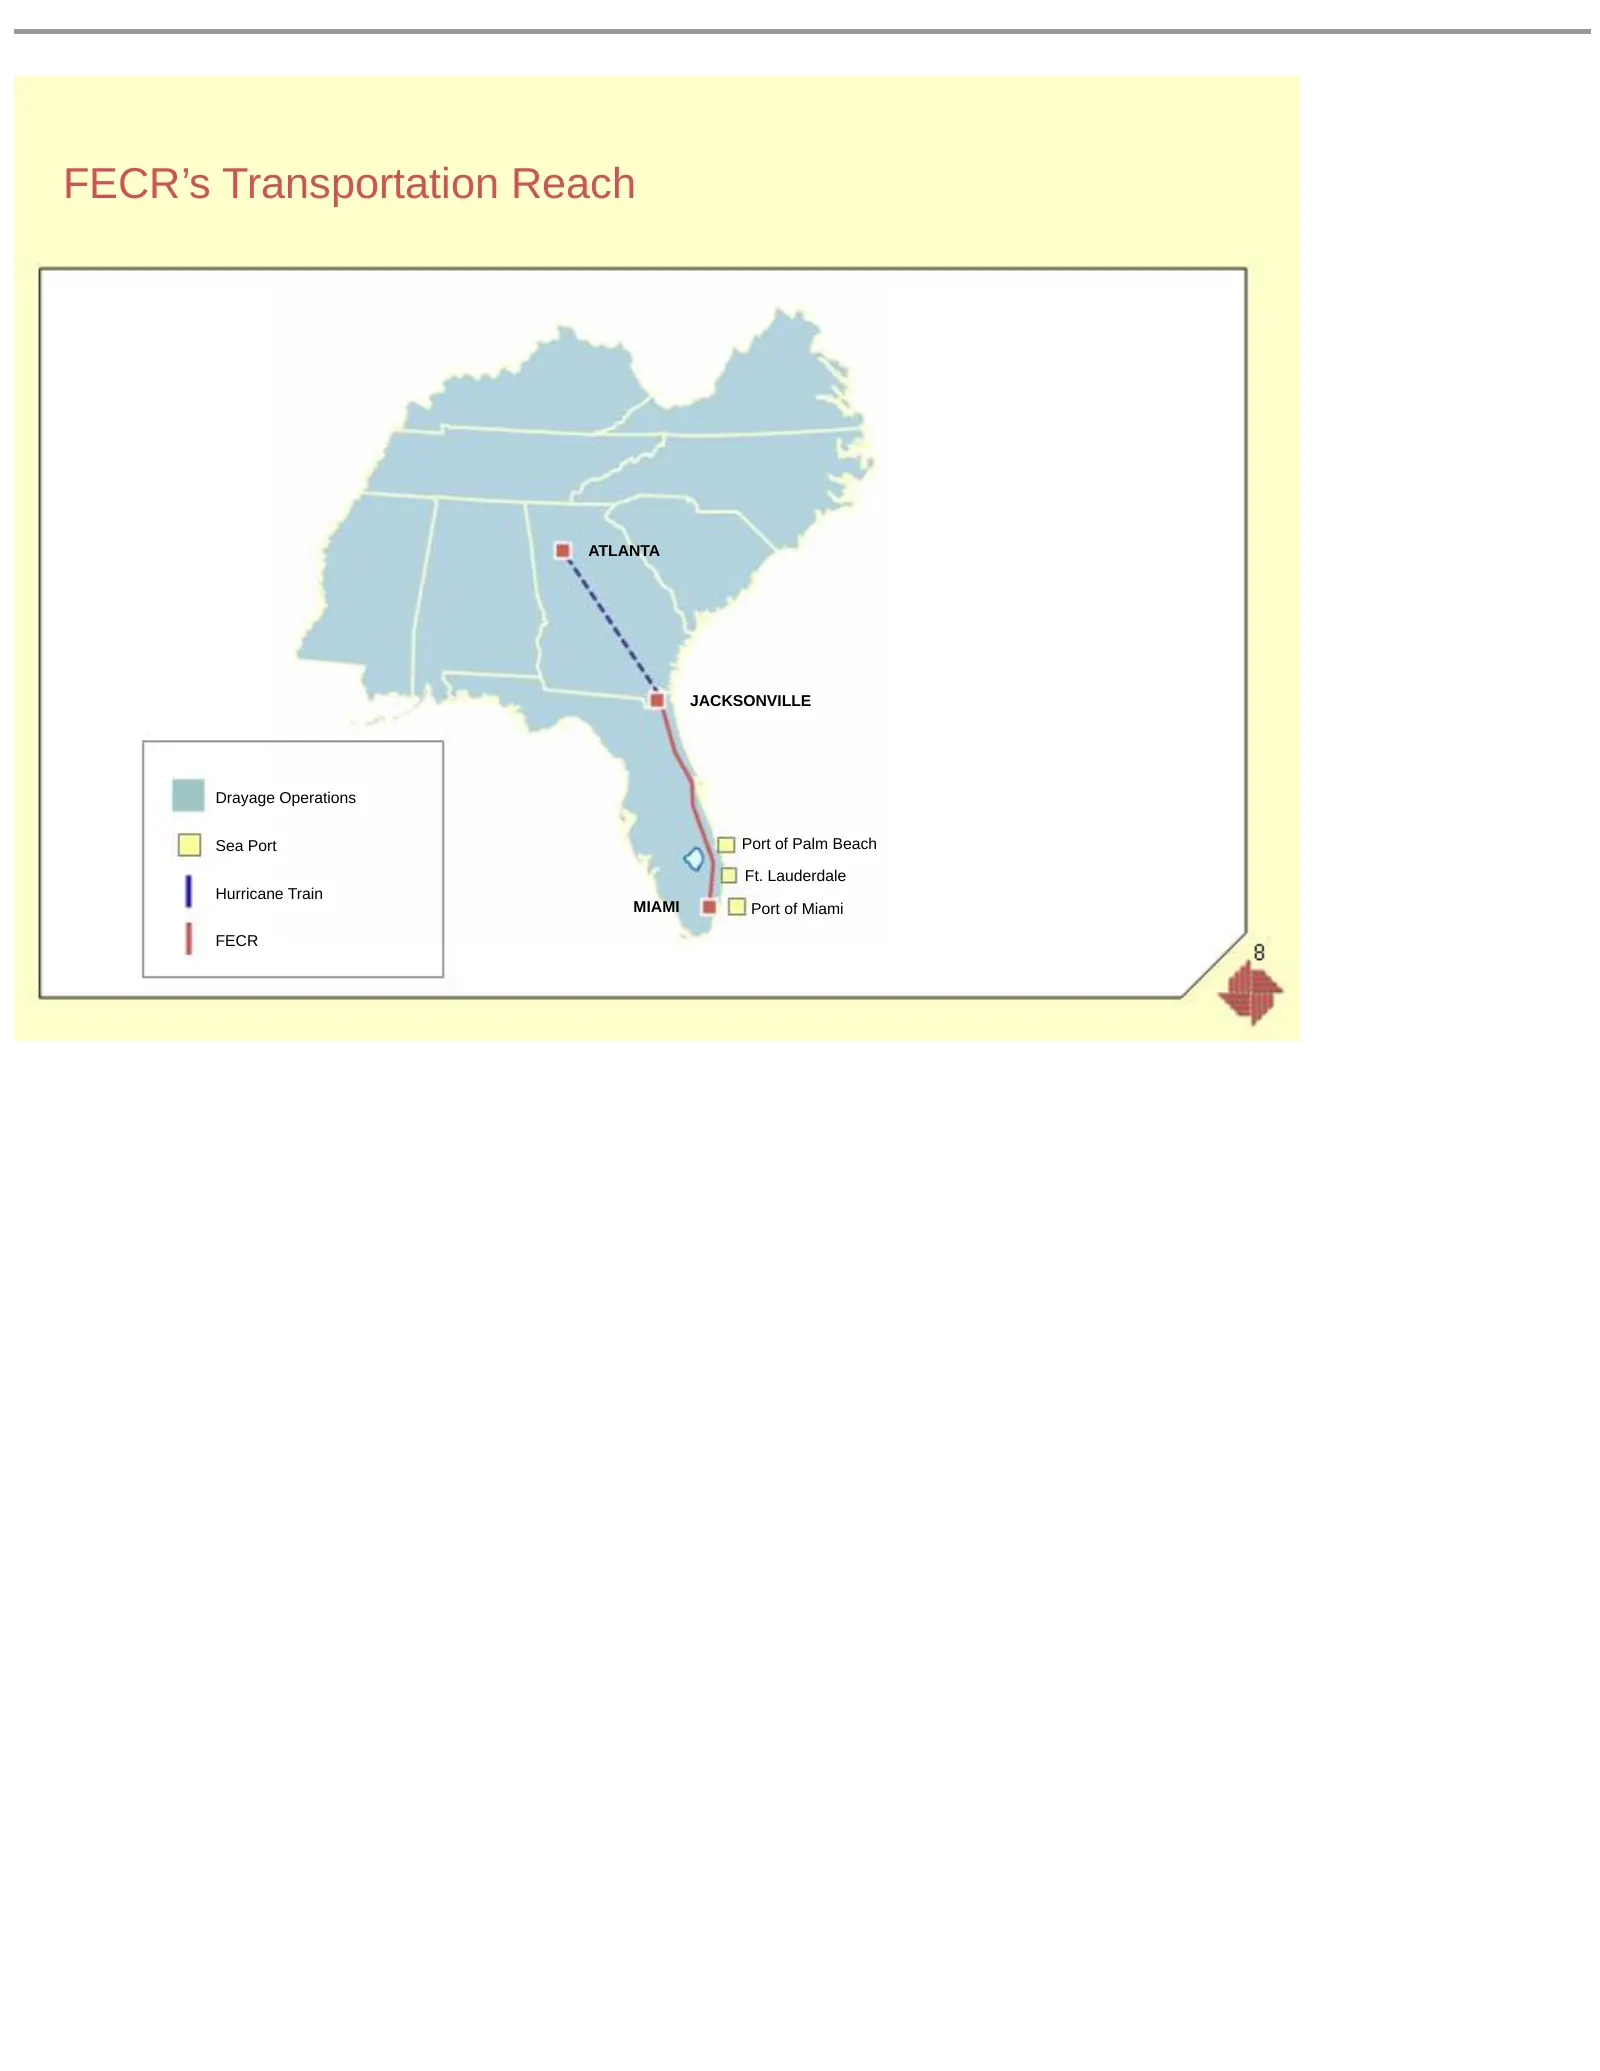
FECR’s Transportation Reach ATLANTA JACKSONVILLE Drayage Operations Sea Port Port of Palm Beach Ft. Lauderdale Hurricane Train MIAMI Port of Miami FECR
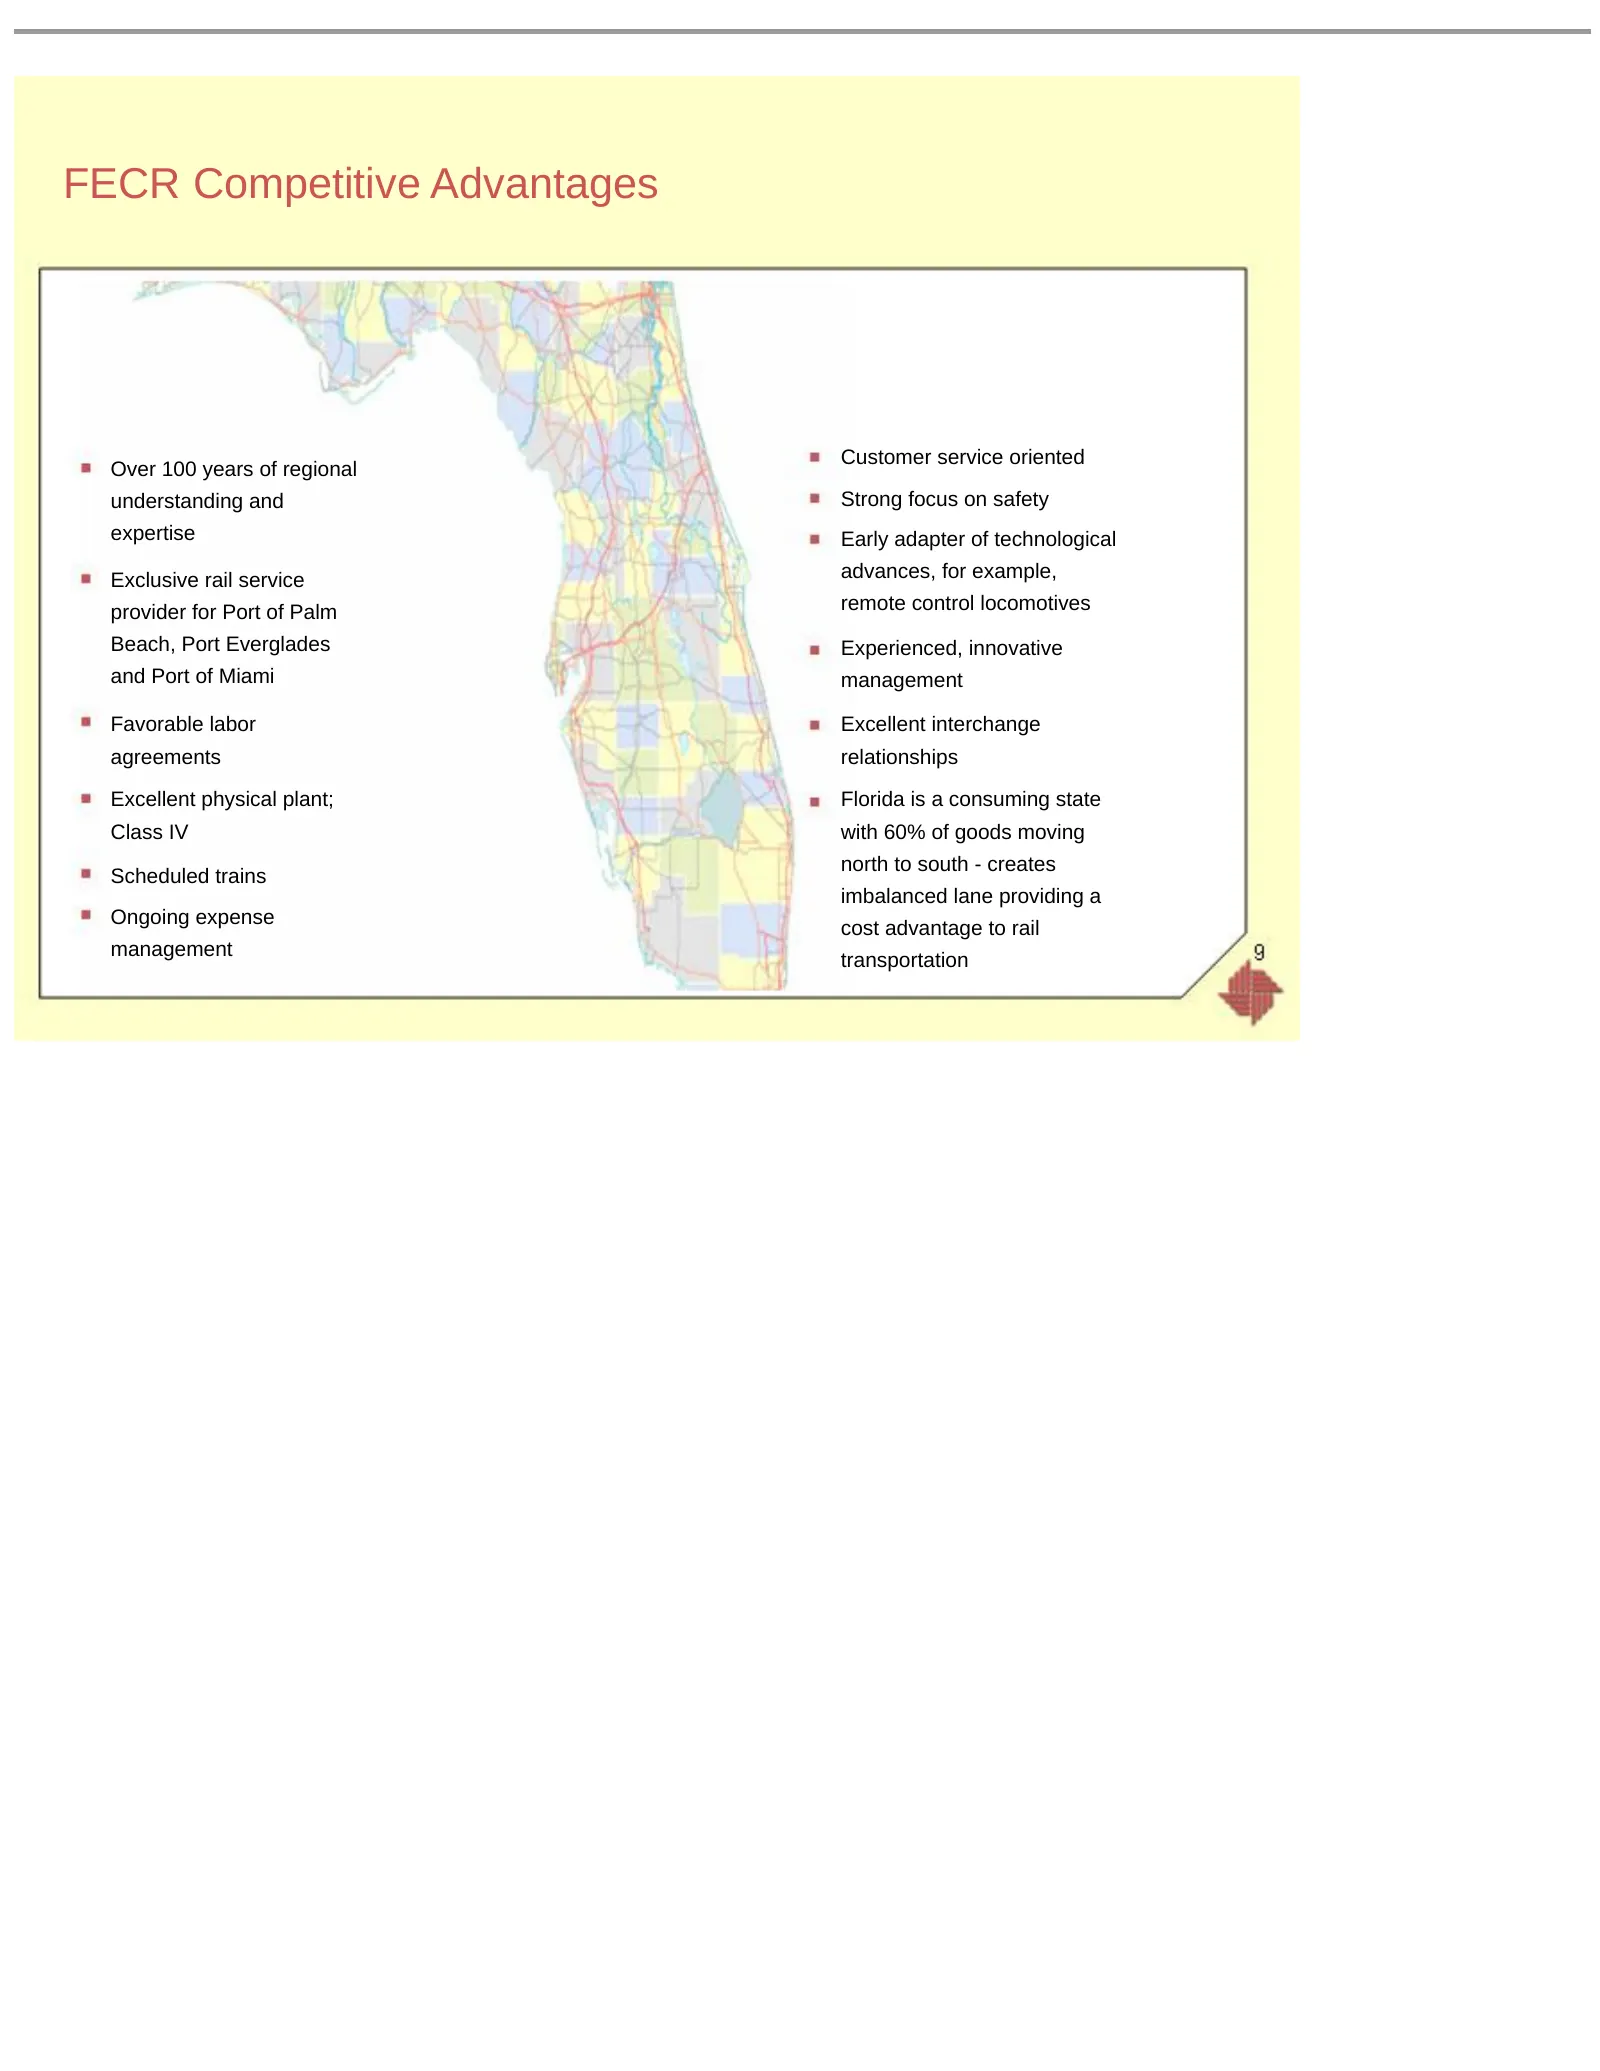
Slide 9: FECR Competitive Advantages
FECR Competitive Advantages Customer service oriented Over 100 years of regional understanding and Strong focus on safety expertise Early adapter of technological Exclusive rail service advances, for example, provider for Port of Palm remote control locomotives Beach, Port Everglades Experienced, in
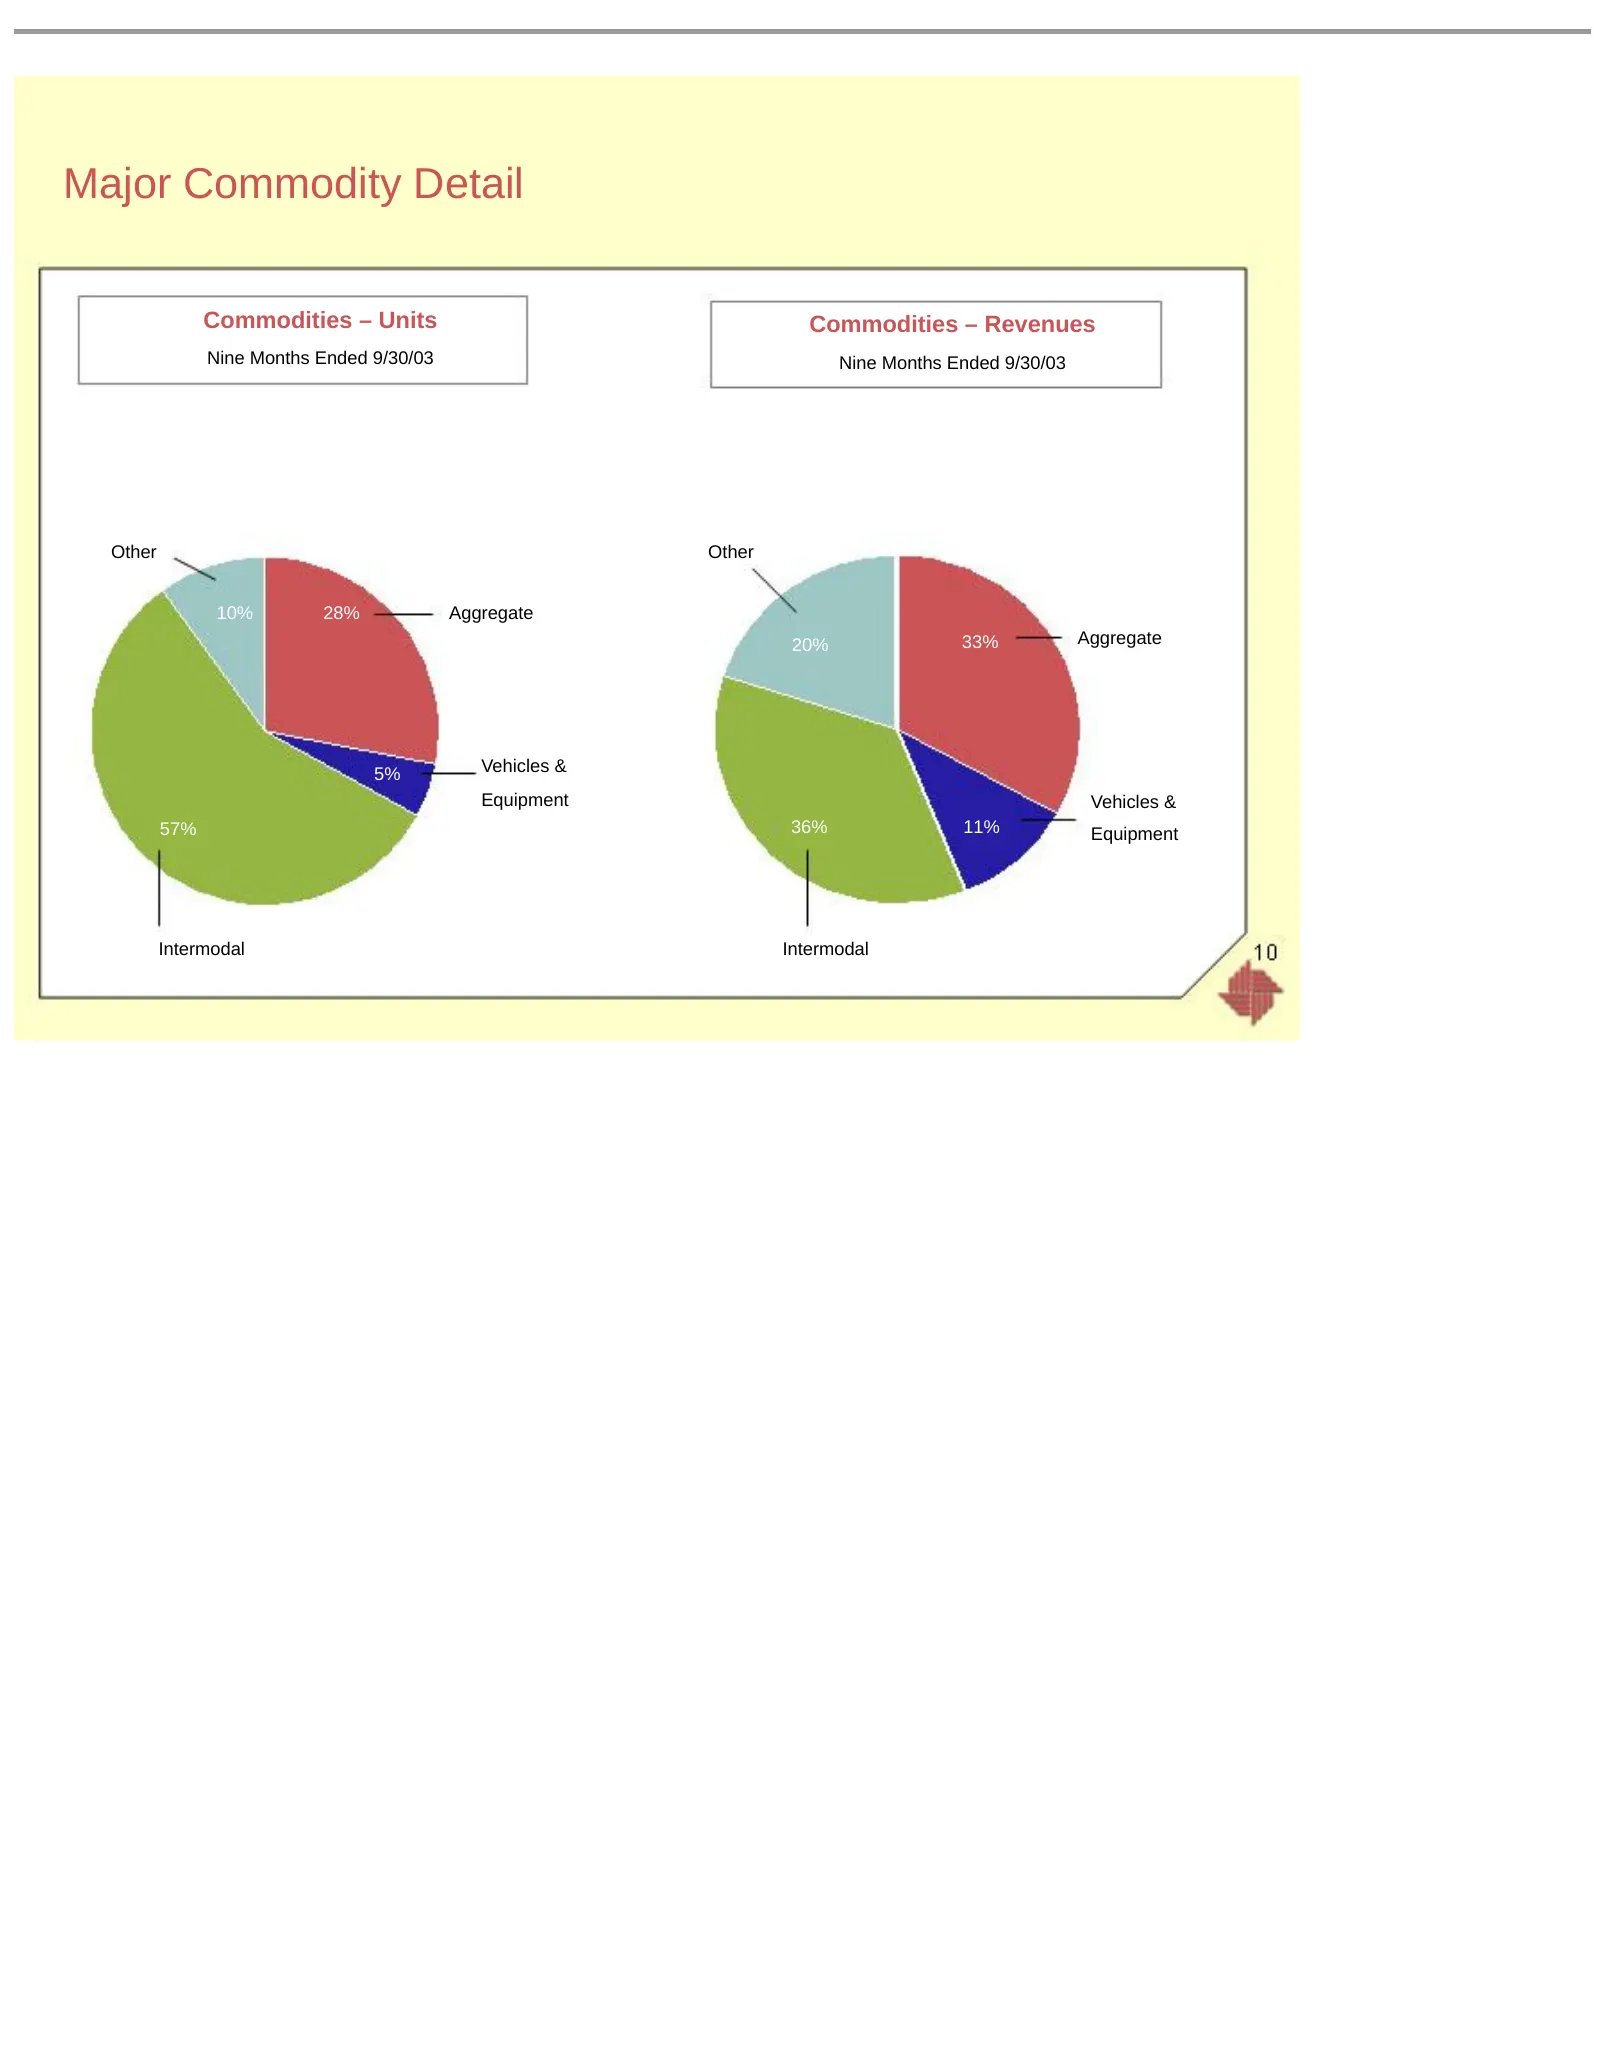
Slide 10: Major Commodity Detail
Major Commodity Detail Commodities – Units Commodities – Revenues Nine Months Ended 9/30/03 Nine Months Ended 9/30/03 Other Other 10% 28% Aggregate 20% 33% Aggregate 5% Vehicles & Equipment Vehicles & 57% 36% 11% Equipment Intermodal Intermodal
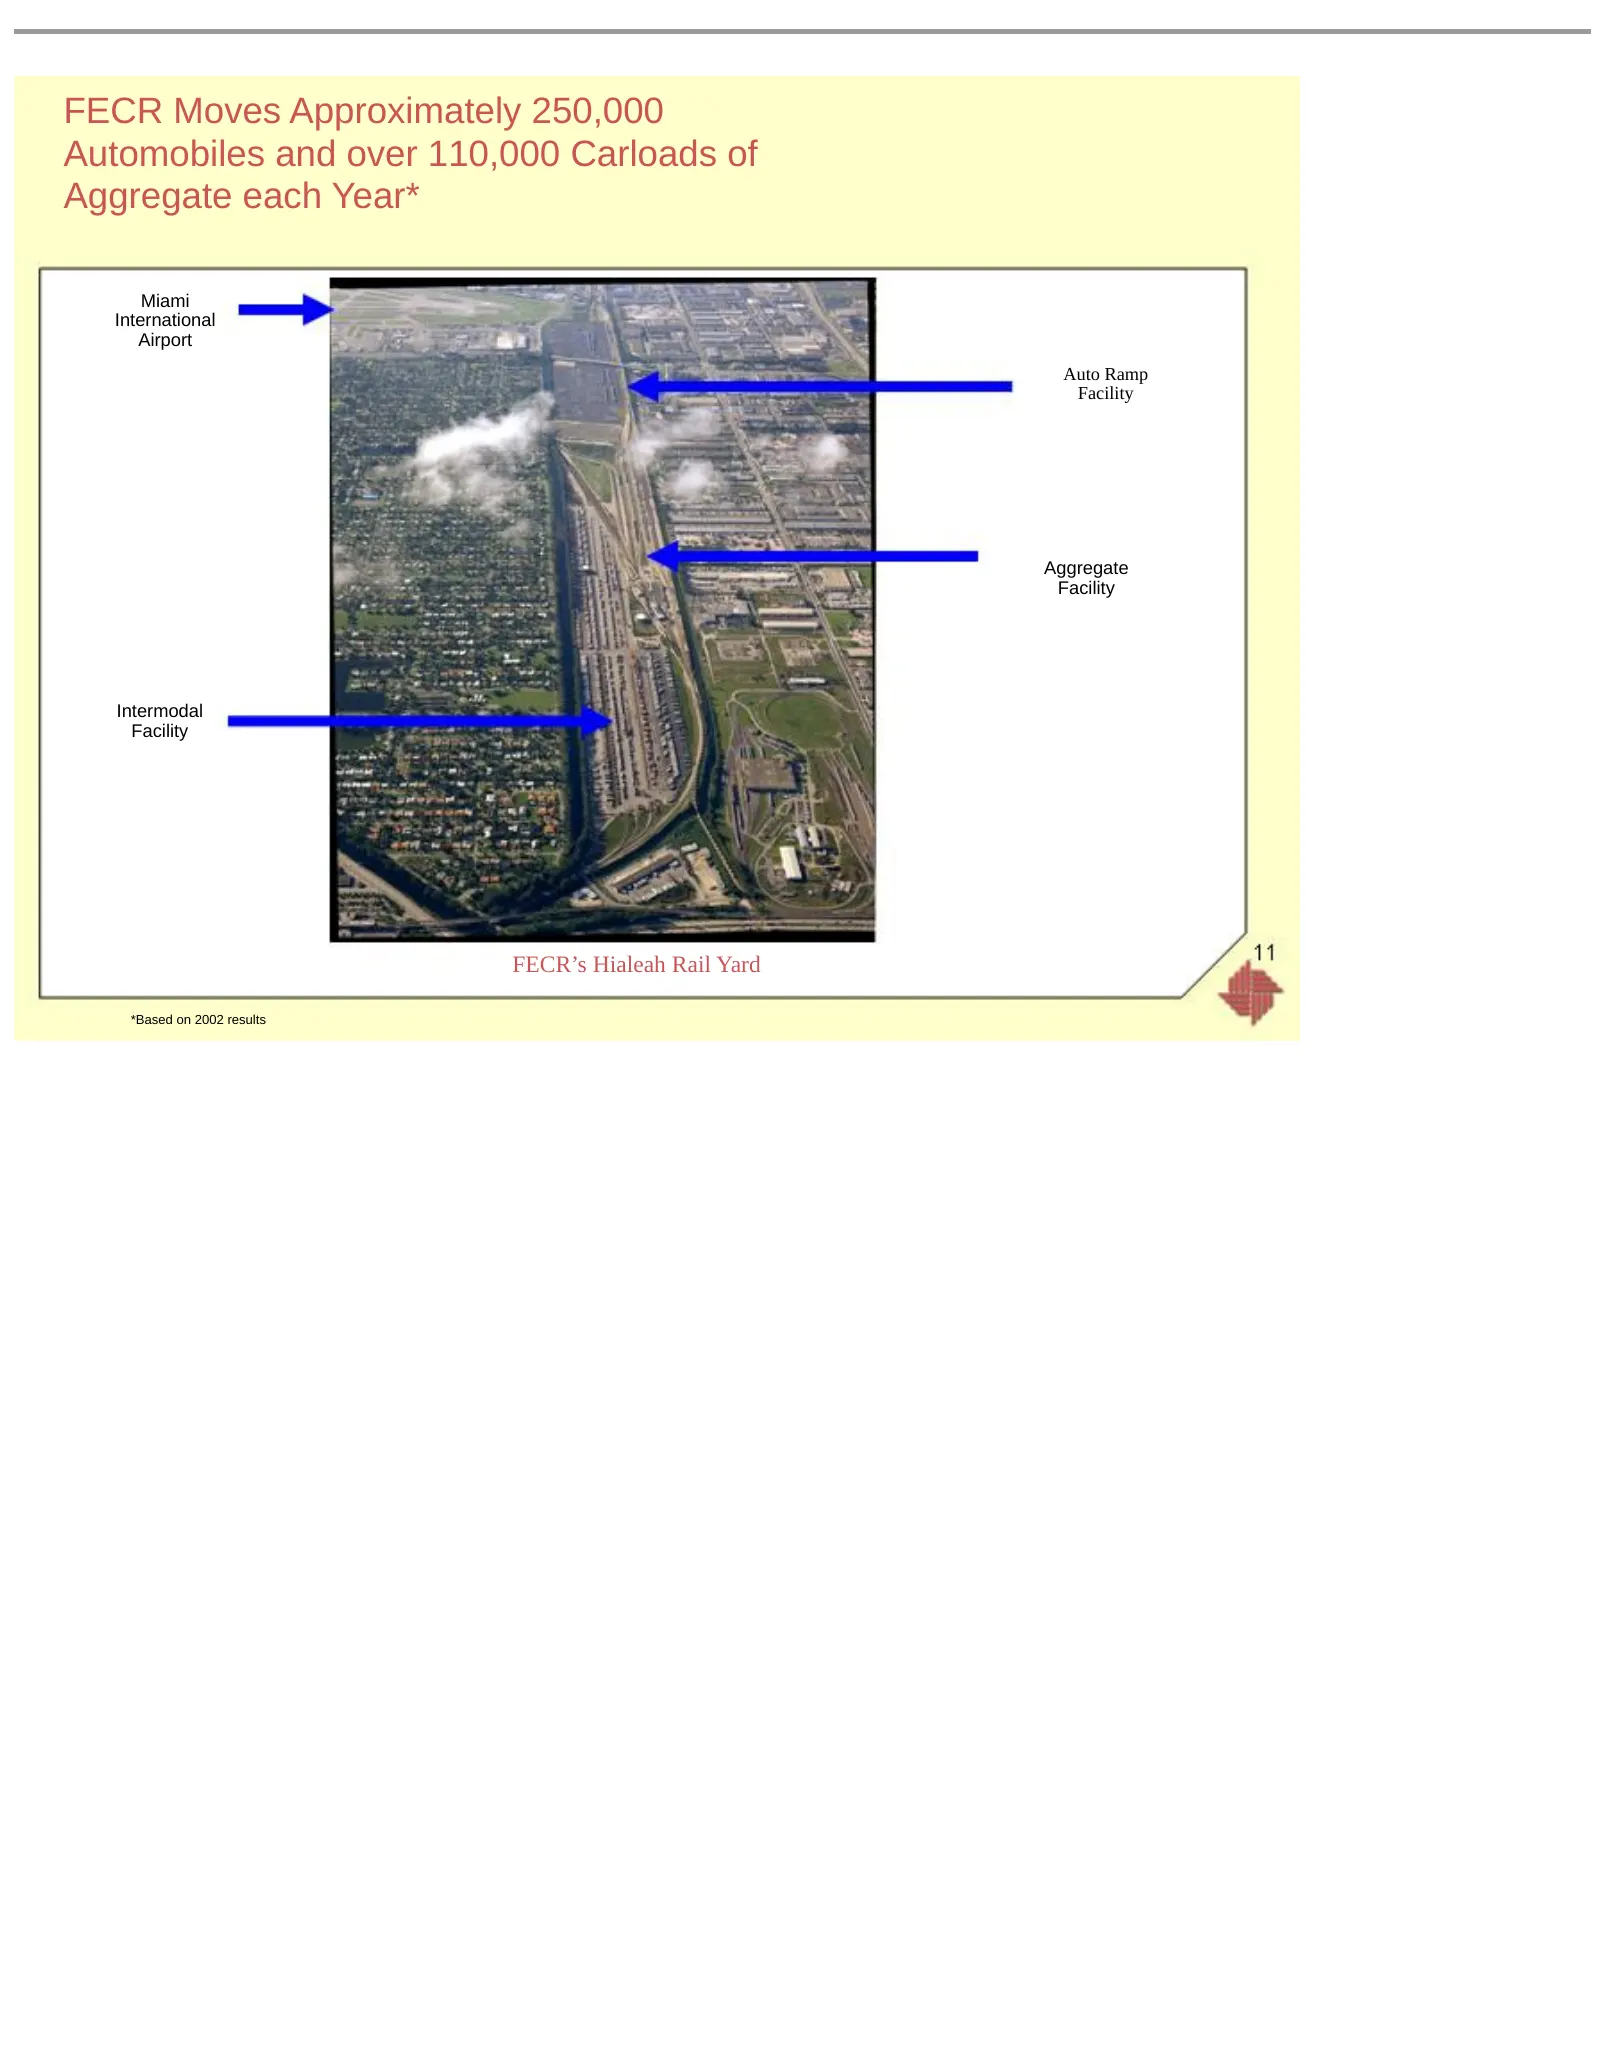
Slide 11: FECR Moves Approximately 250,000 Automobiles and over 110,000 Carloads of Aggregate
FECR Moves Approximately 250,000 Automobiles and over 110,000 Carloads of Aggregate each Year* Miami International Airport Auto Ramp Facility Aggregate Facility Intermodal Facility FECR’s Hialeah Rail Yard *Based on 2002 results
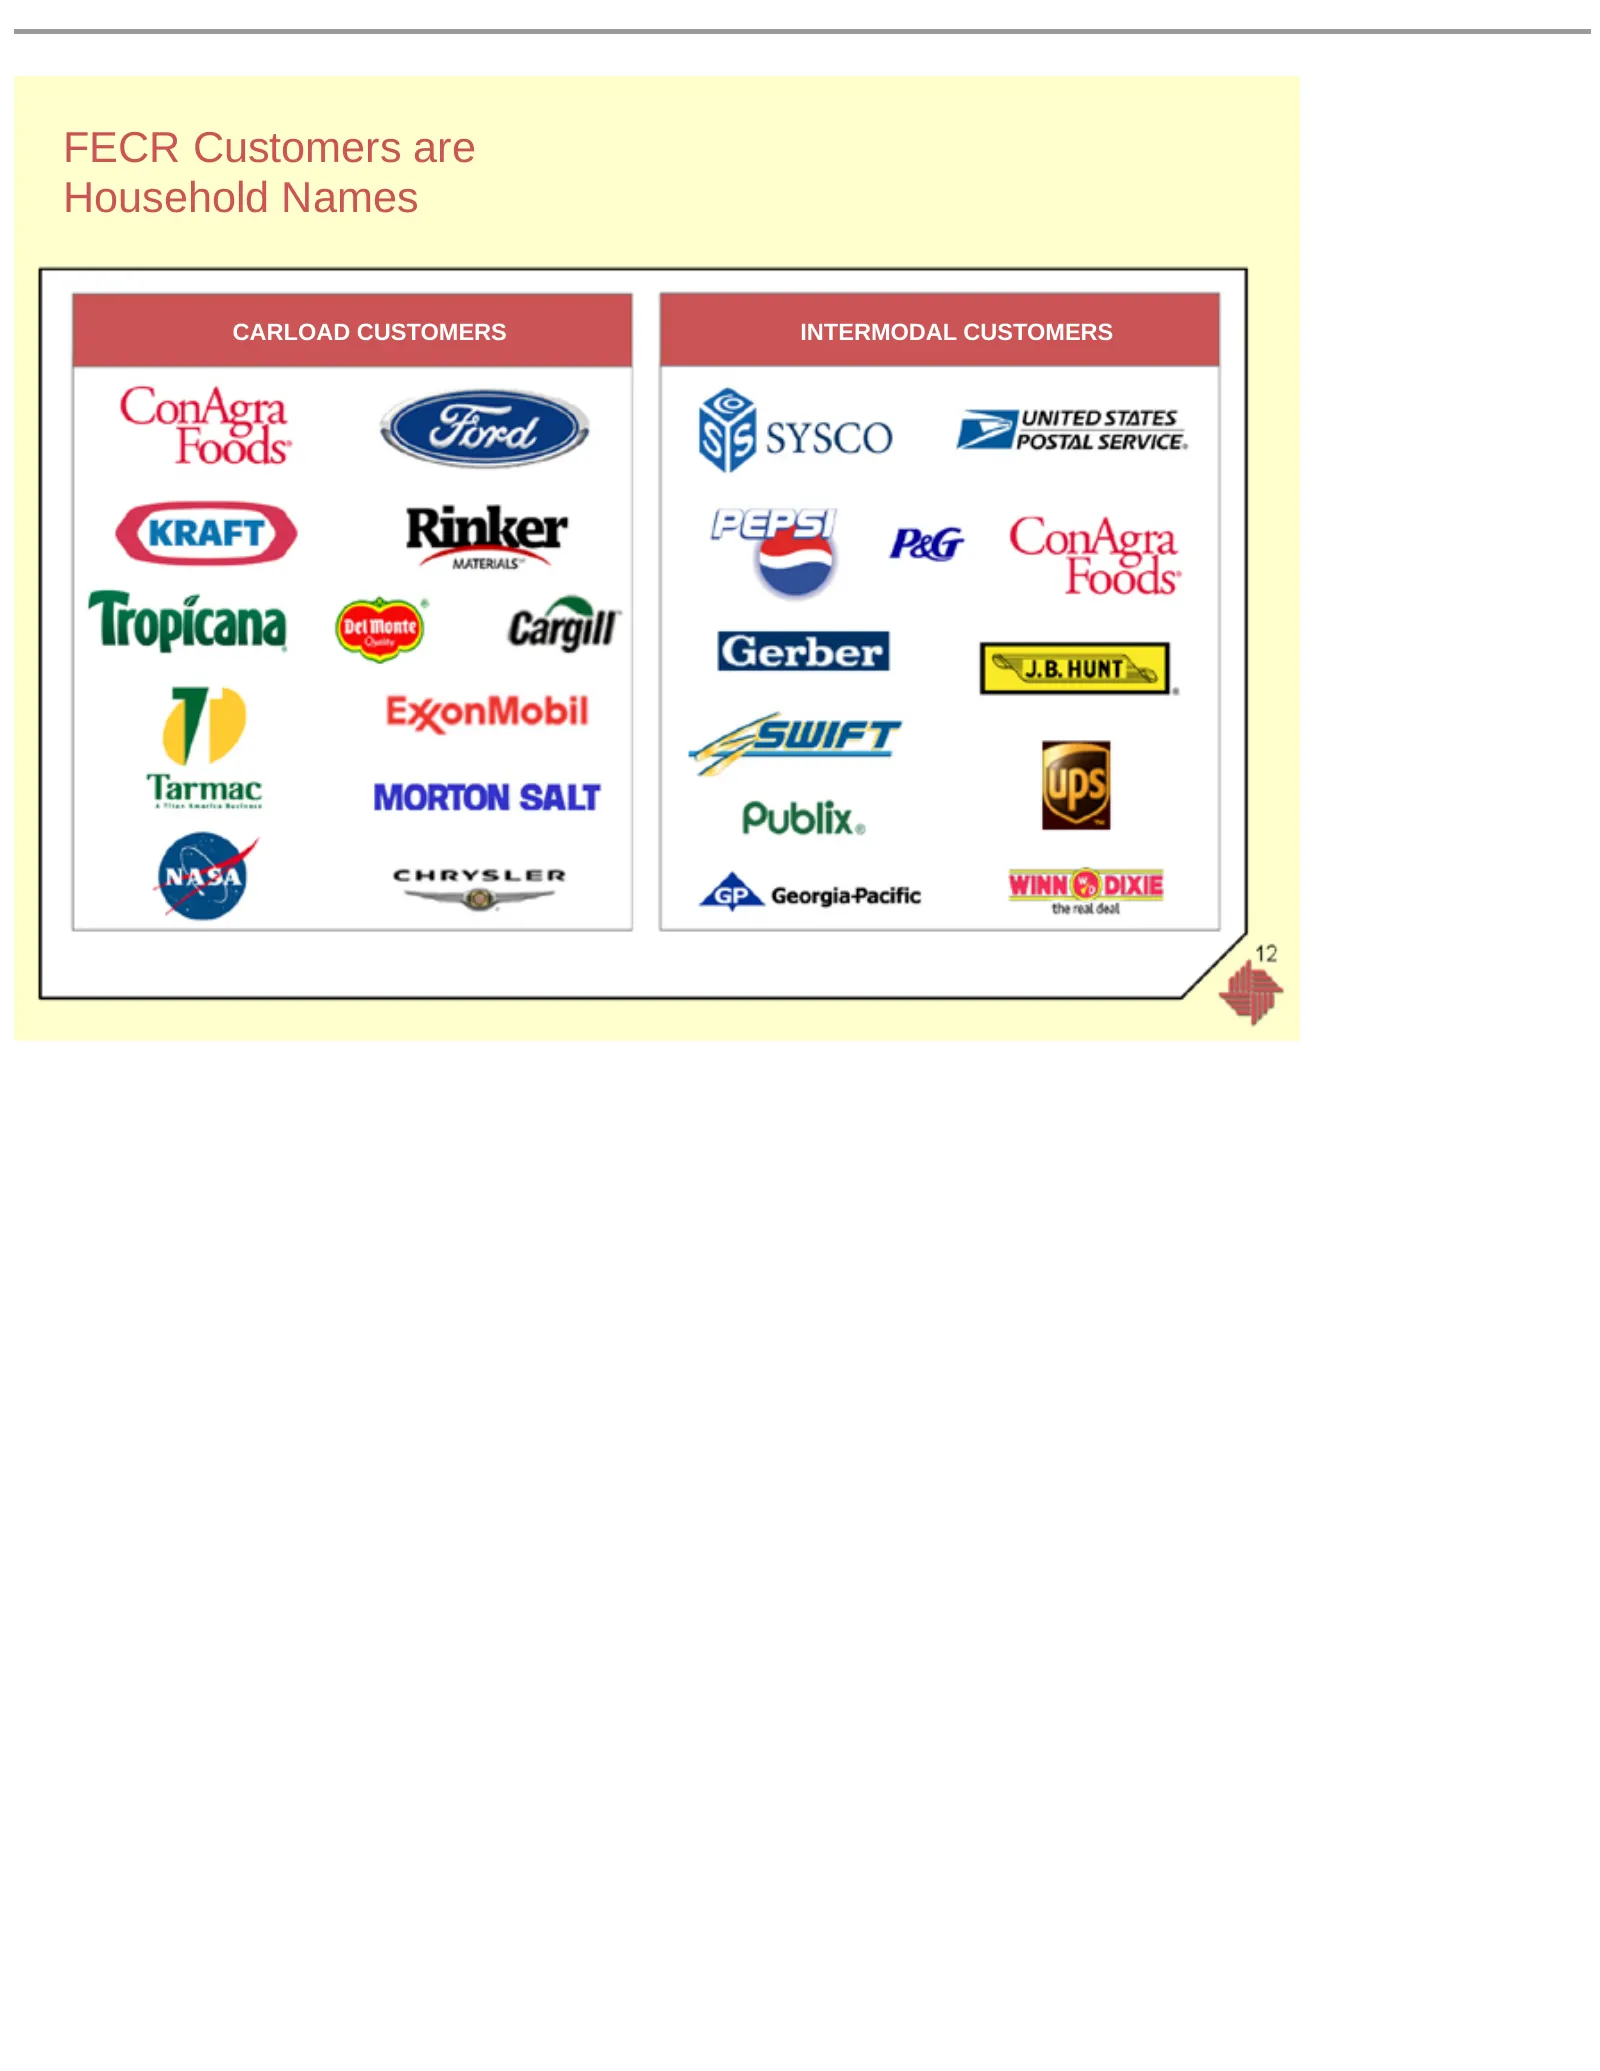
Slide 12: FECR Customers are Household Names
FECR Customers are Household Names CARLOAD CUSTOMERS INTERMODAL CUSTOMERS
Slide 13: FECR Growth Strategy: Carload
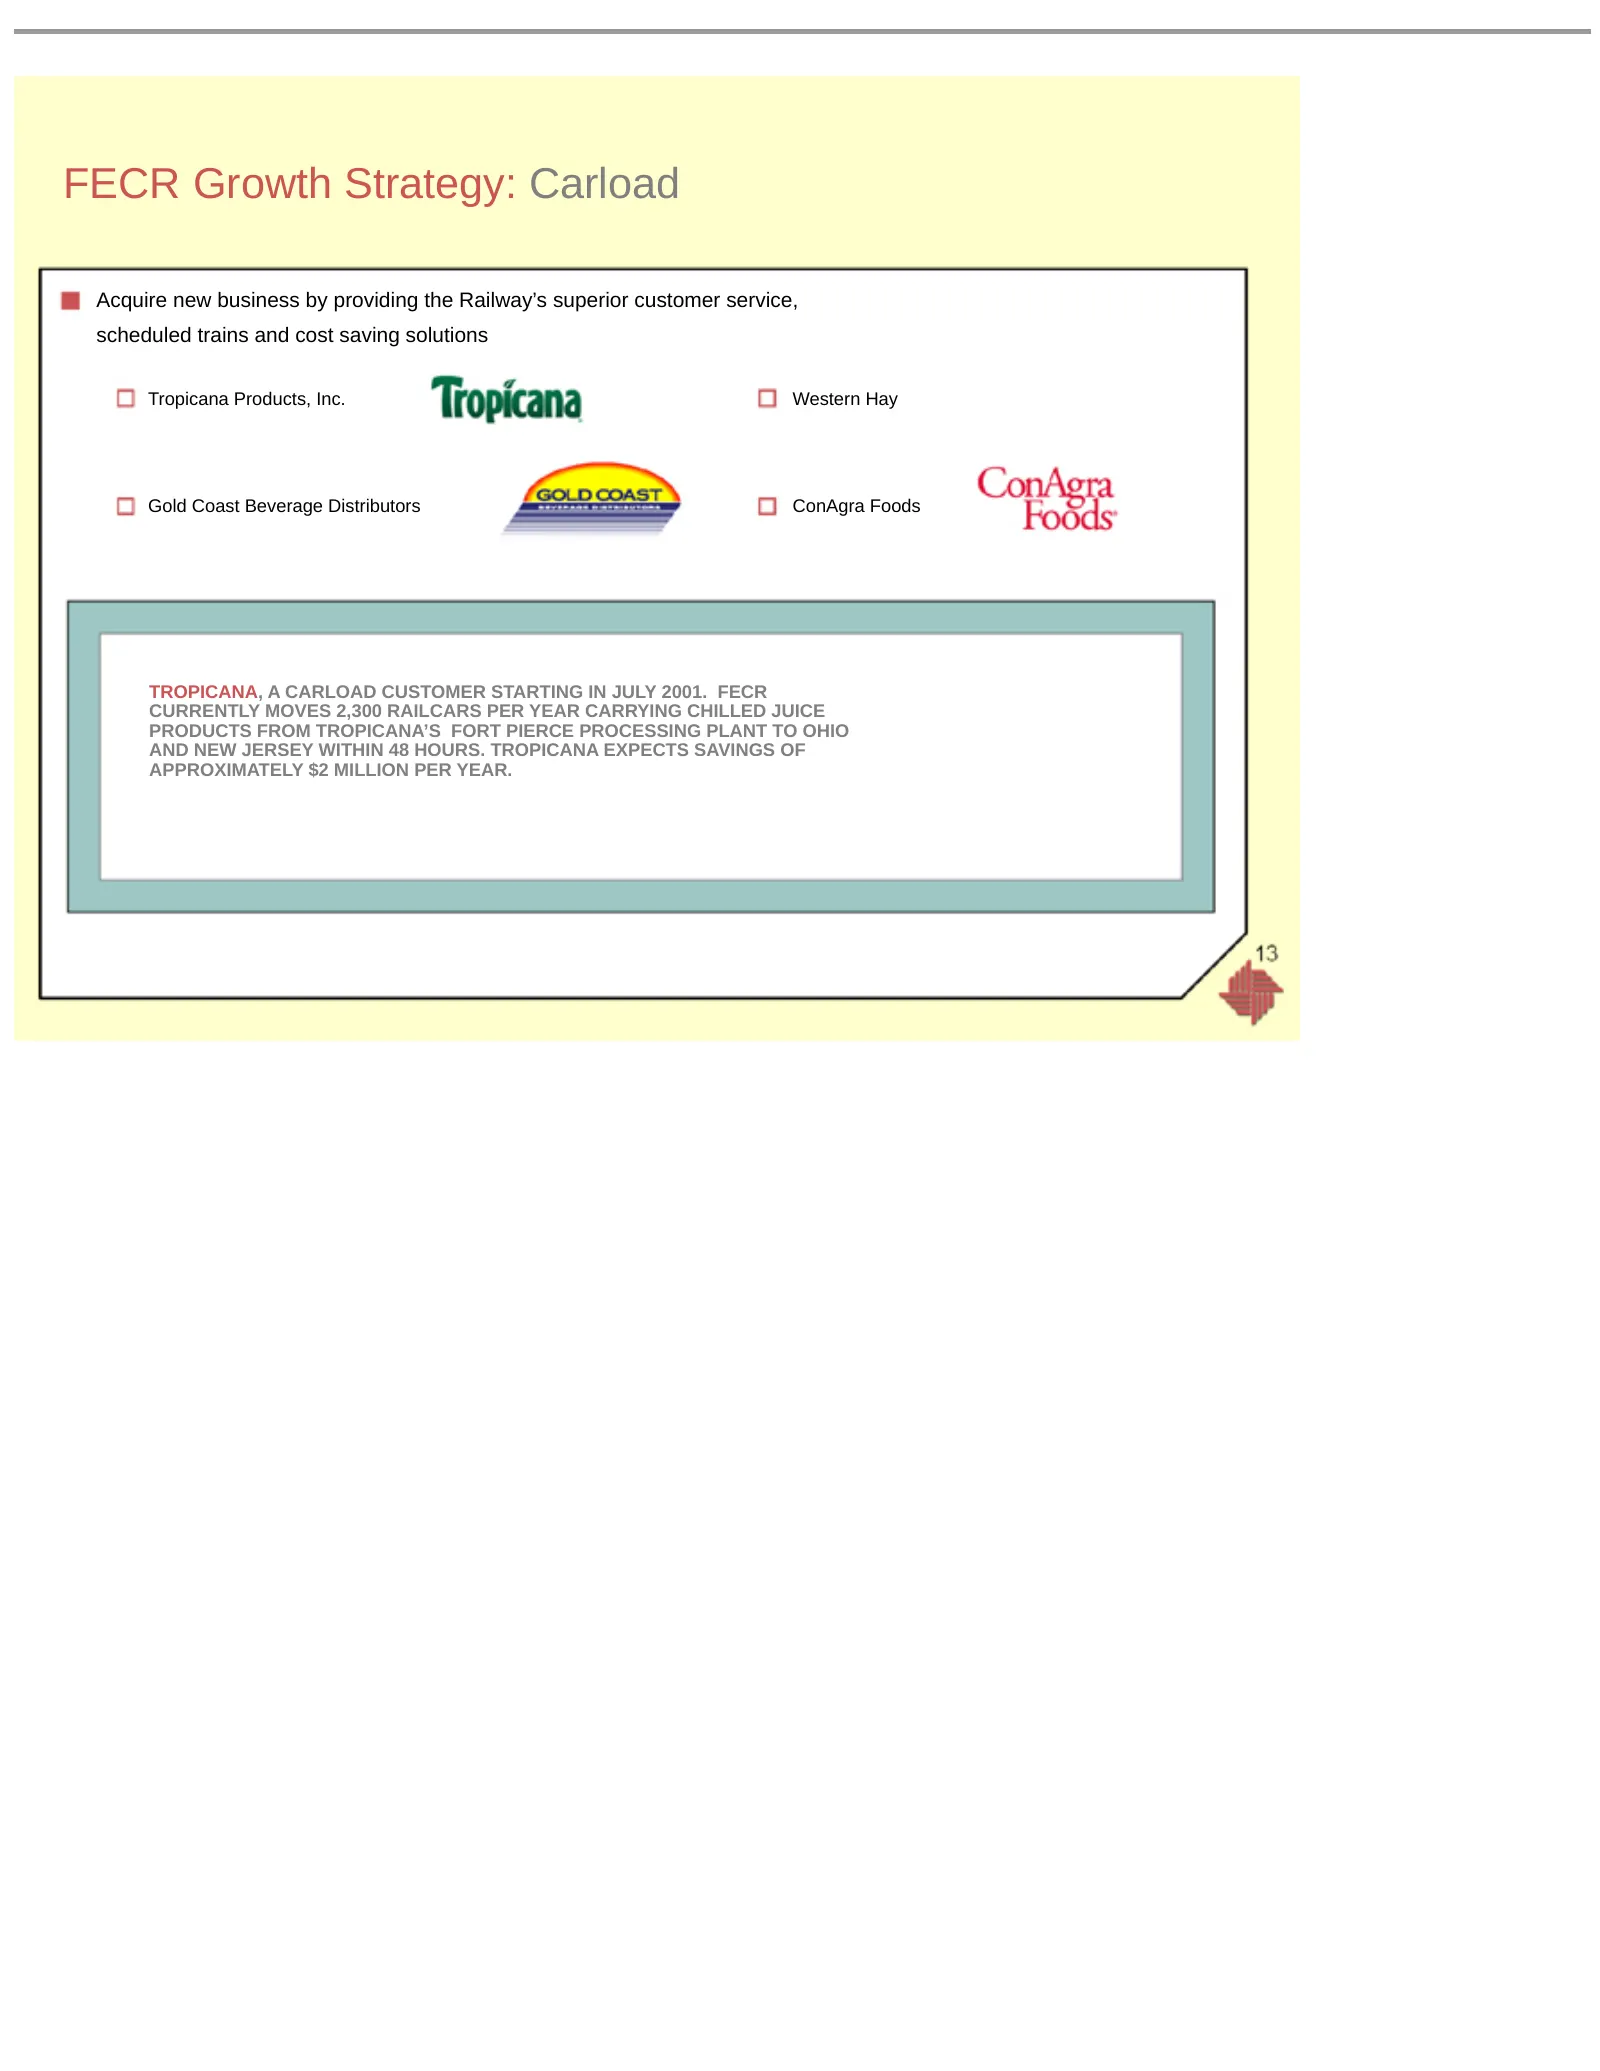
FECR Growth Strategy: Carload Acquire new business by providing the Railway’s superior customer service, scheduled trains and cost saving solutions Tropicana Products, Inc. Western Hay Gold Coast Beverage Distributors ConAgra Foods TROPICANA, A CARLOAD CUSTOMER STARTING IN JULY 2001. FECR CURRENTLY
Slide 14: FECR Growth Strategy: Carload
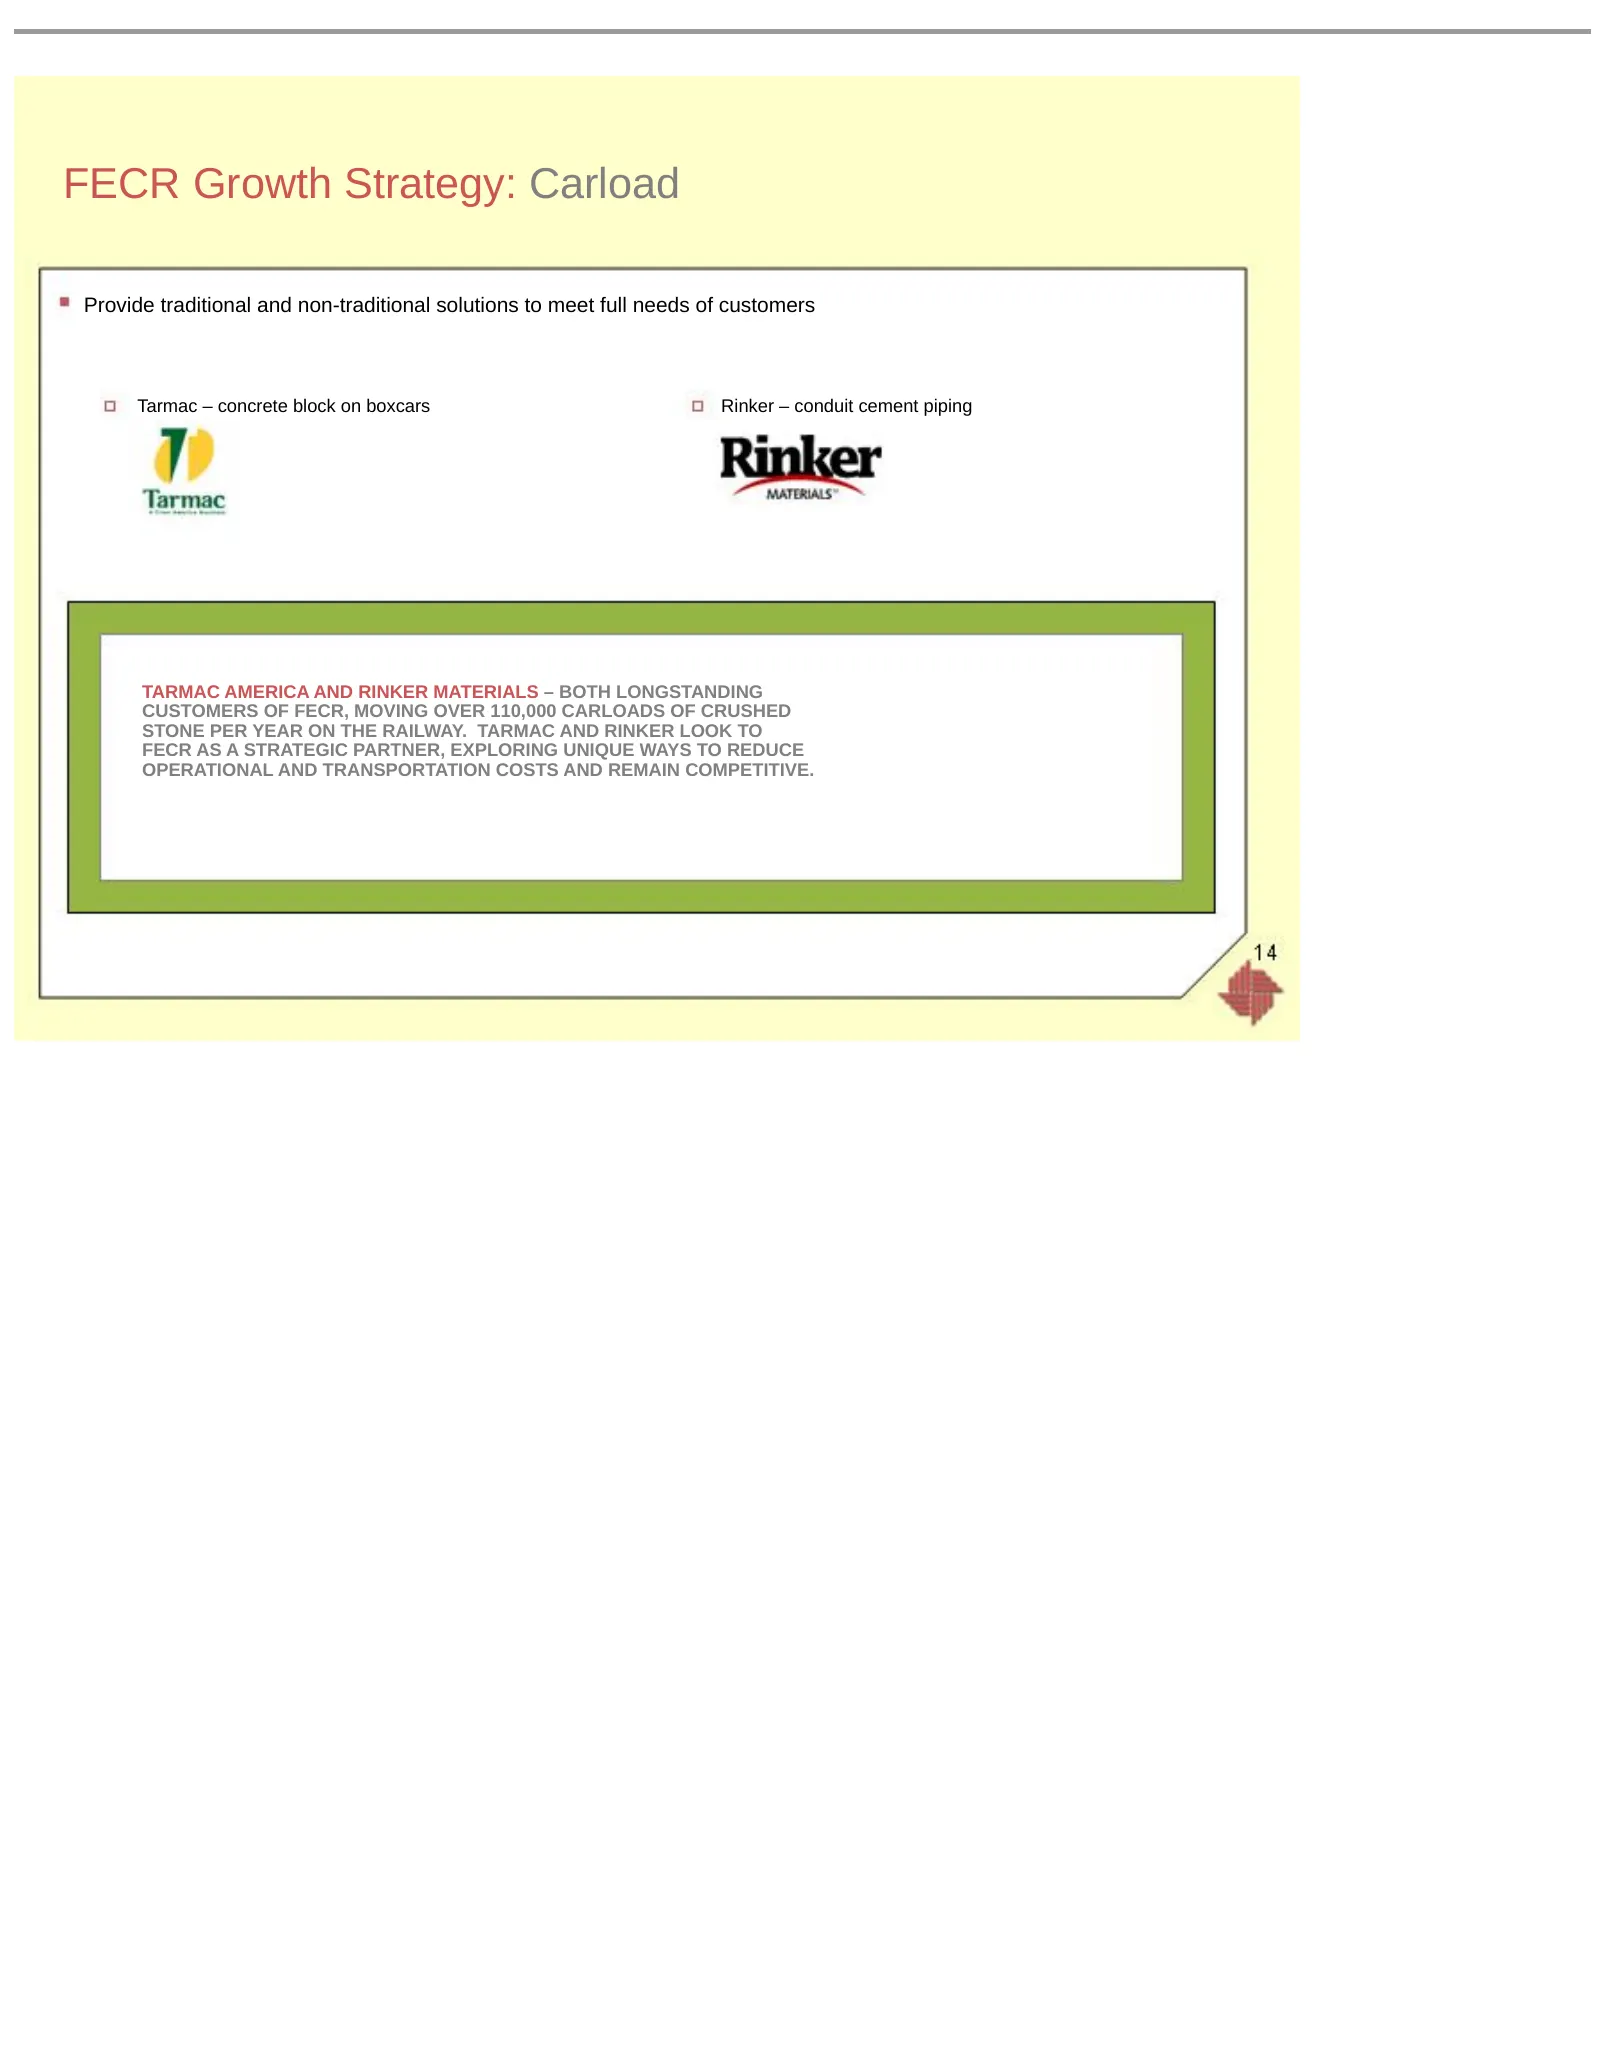
FECR Growth Strategy: Carload Provide traditional and non-traditional solutions to meet full needs of customers Tarmac – concrete block on boxcars Rinker – conduit cement piping TARMAC AMERICA AND RINKER MATERIALS – BOTH LONGSTANDING CUSTOMERS OF FECR, MOVING OVER 110,000 CARLOADS OF CRUSHED STONE P
Slide 15: FECR Growth Strategy: Intermodal
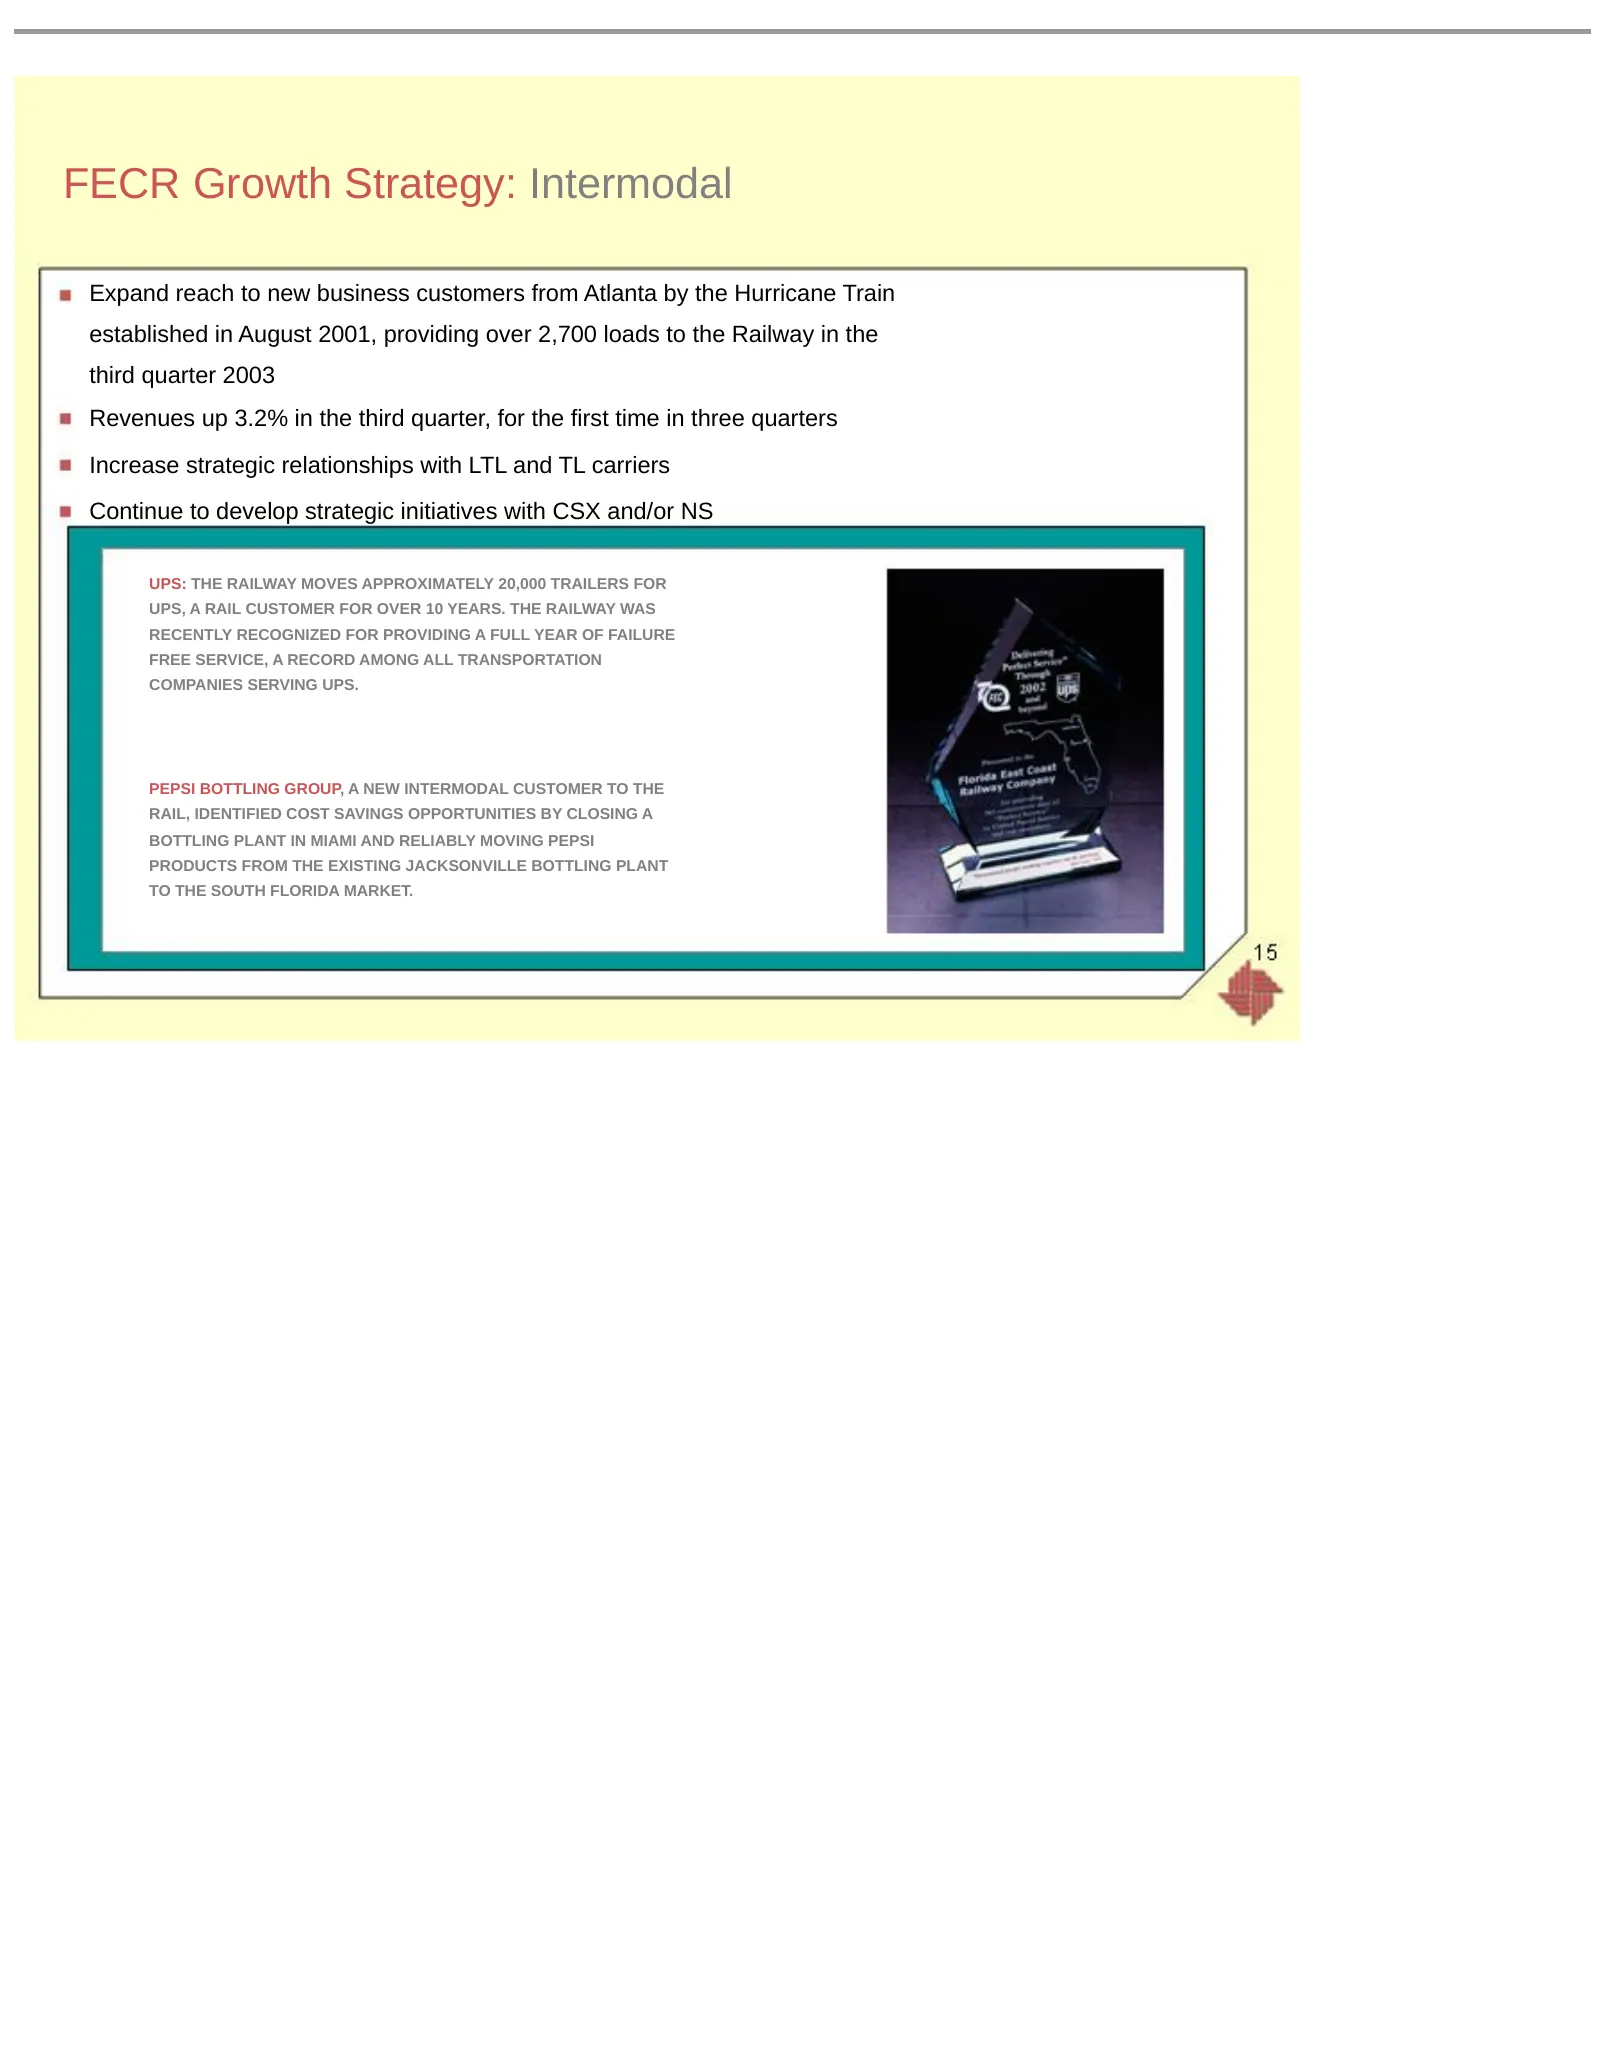
FECR Growth Strategy: Intermodal Expand reach to new business customers from Atlanta by the Hurricane Train established in August 2001, providing over 2,700 loads to the Railway in the third quarter 2003 Revenues up 3.2% in the third quarter, for the first time in three quarters Increase strategic r
Slide 16: FECR's Operating Ratio is Second Best of Publicly Traded Railroads
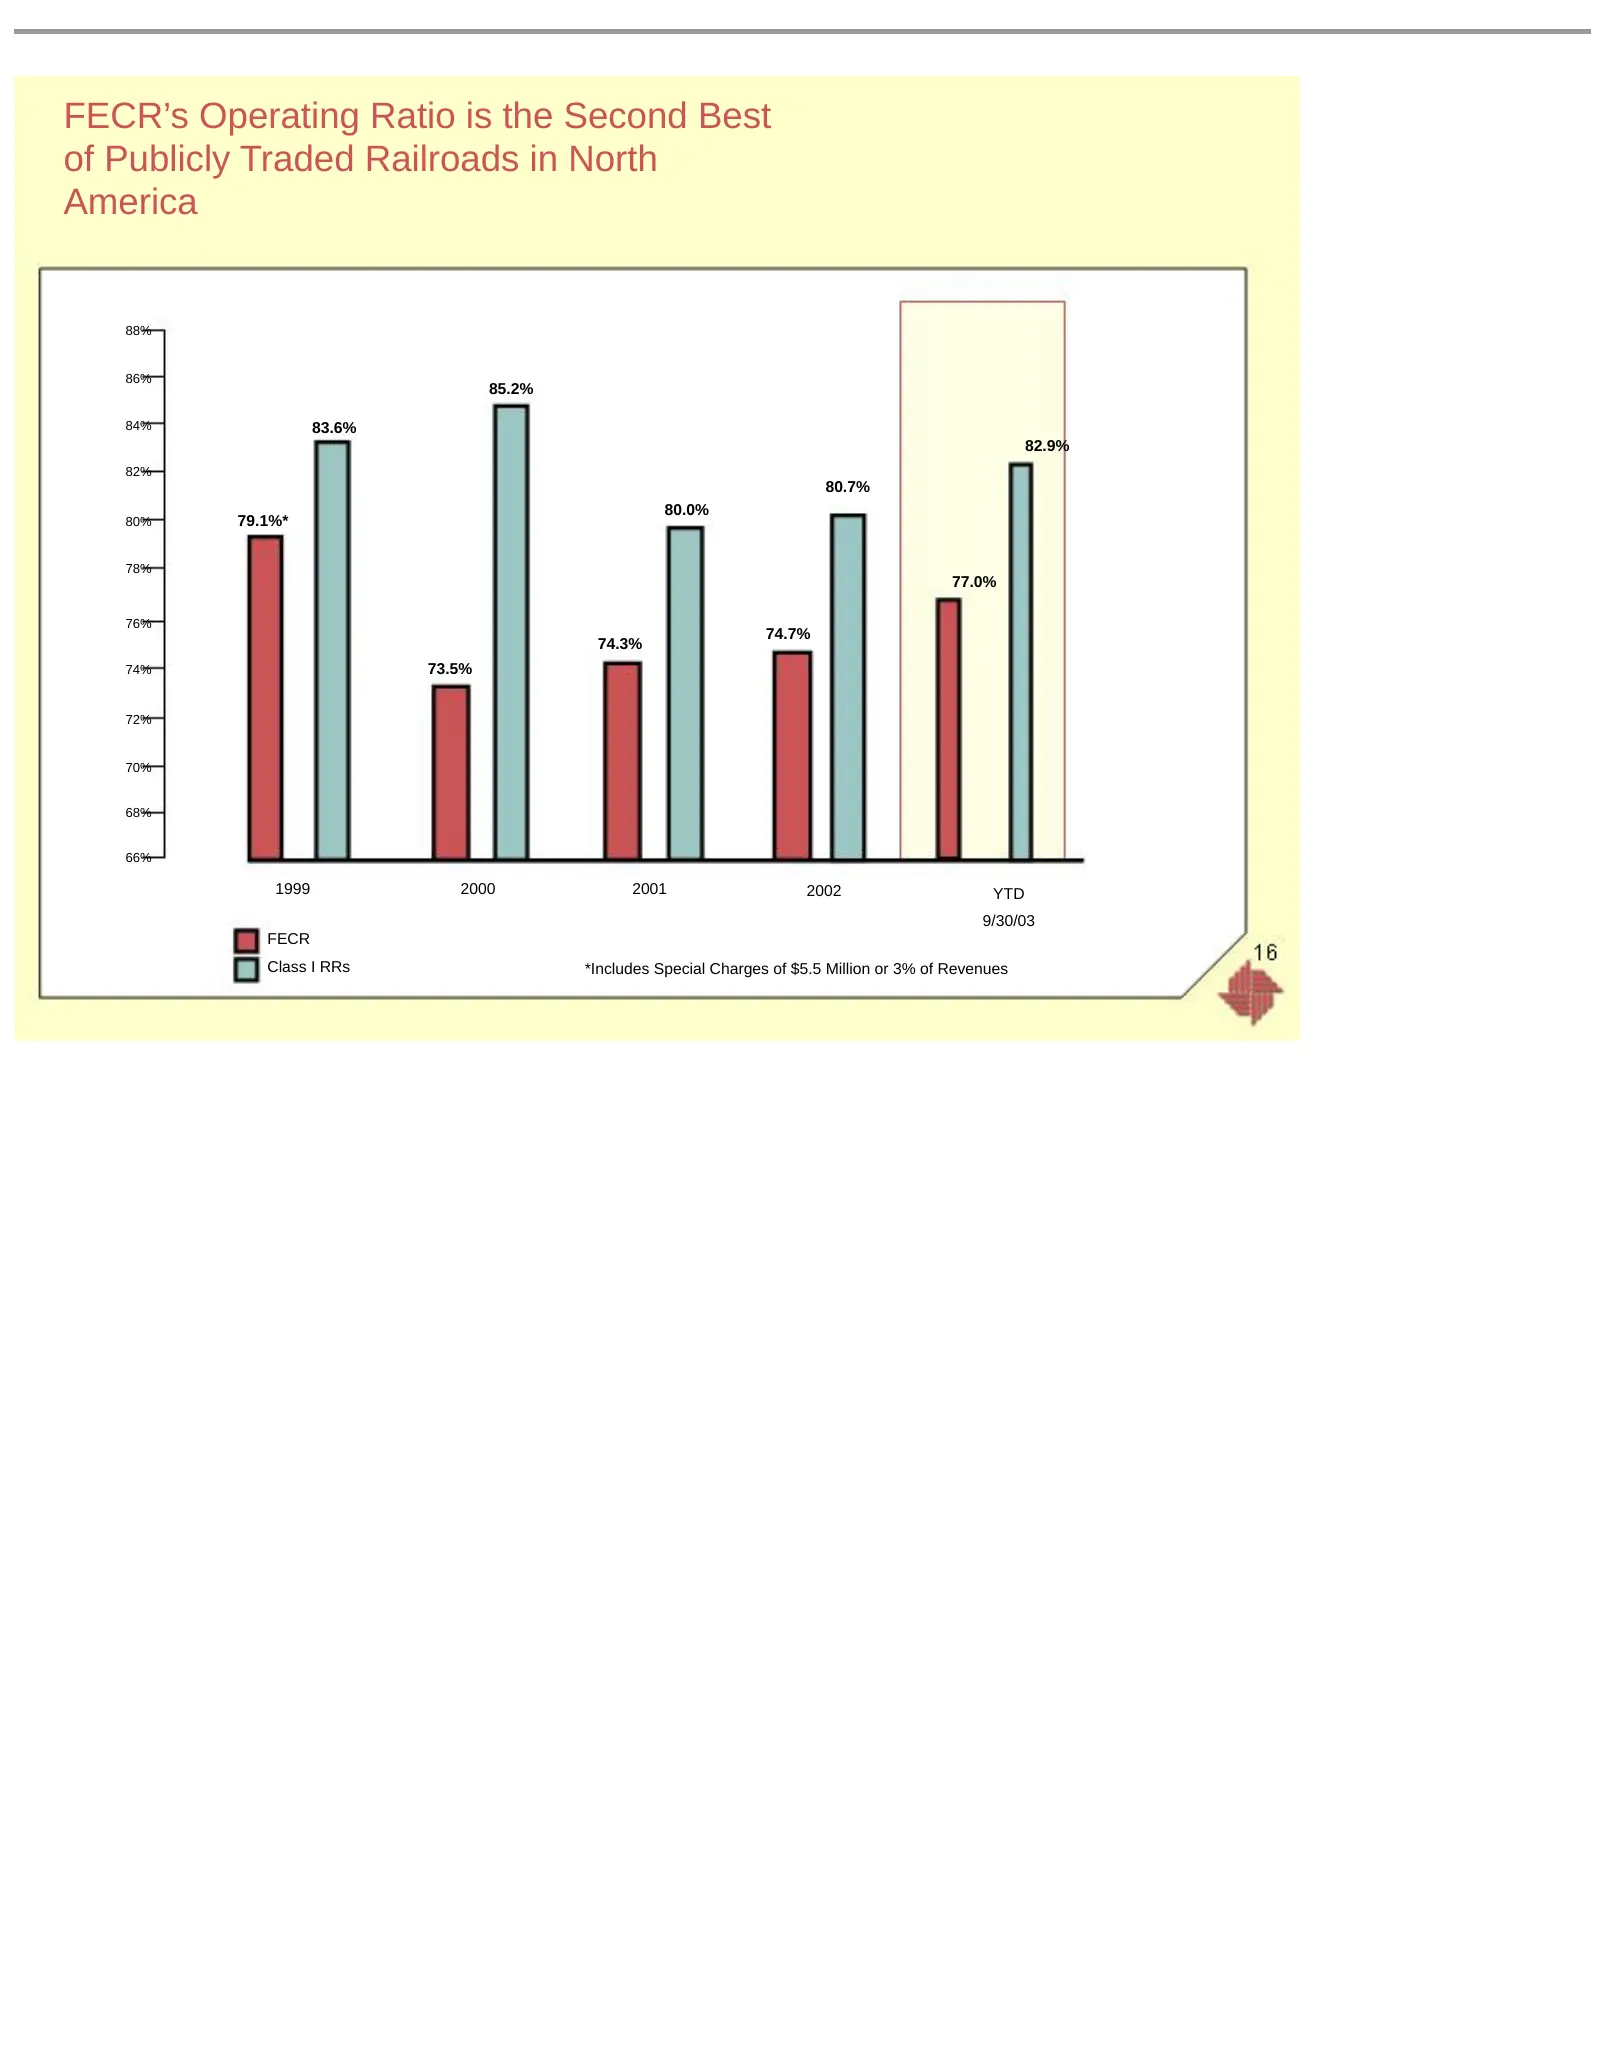
FECR’s Operating Ratio is the Second Best of Publicly Traded Railroads in North America 88% 86% 85.2% 84% 83.6% 82.9% 82% 80.7% 80.0% 80% 79.1%* 78% 77.0% 76% 74.7% 74.3% 74% 73.5% 72% 70% 68% 66% 1999 2000 2001 2002 YTD 9/30/03 FECR Class I RRs *Includes Special Charges of $5.5 Million or 3% of Rev
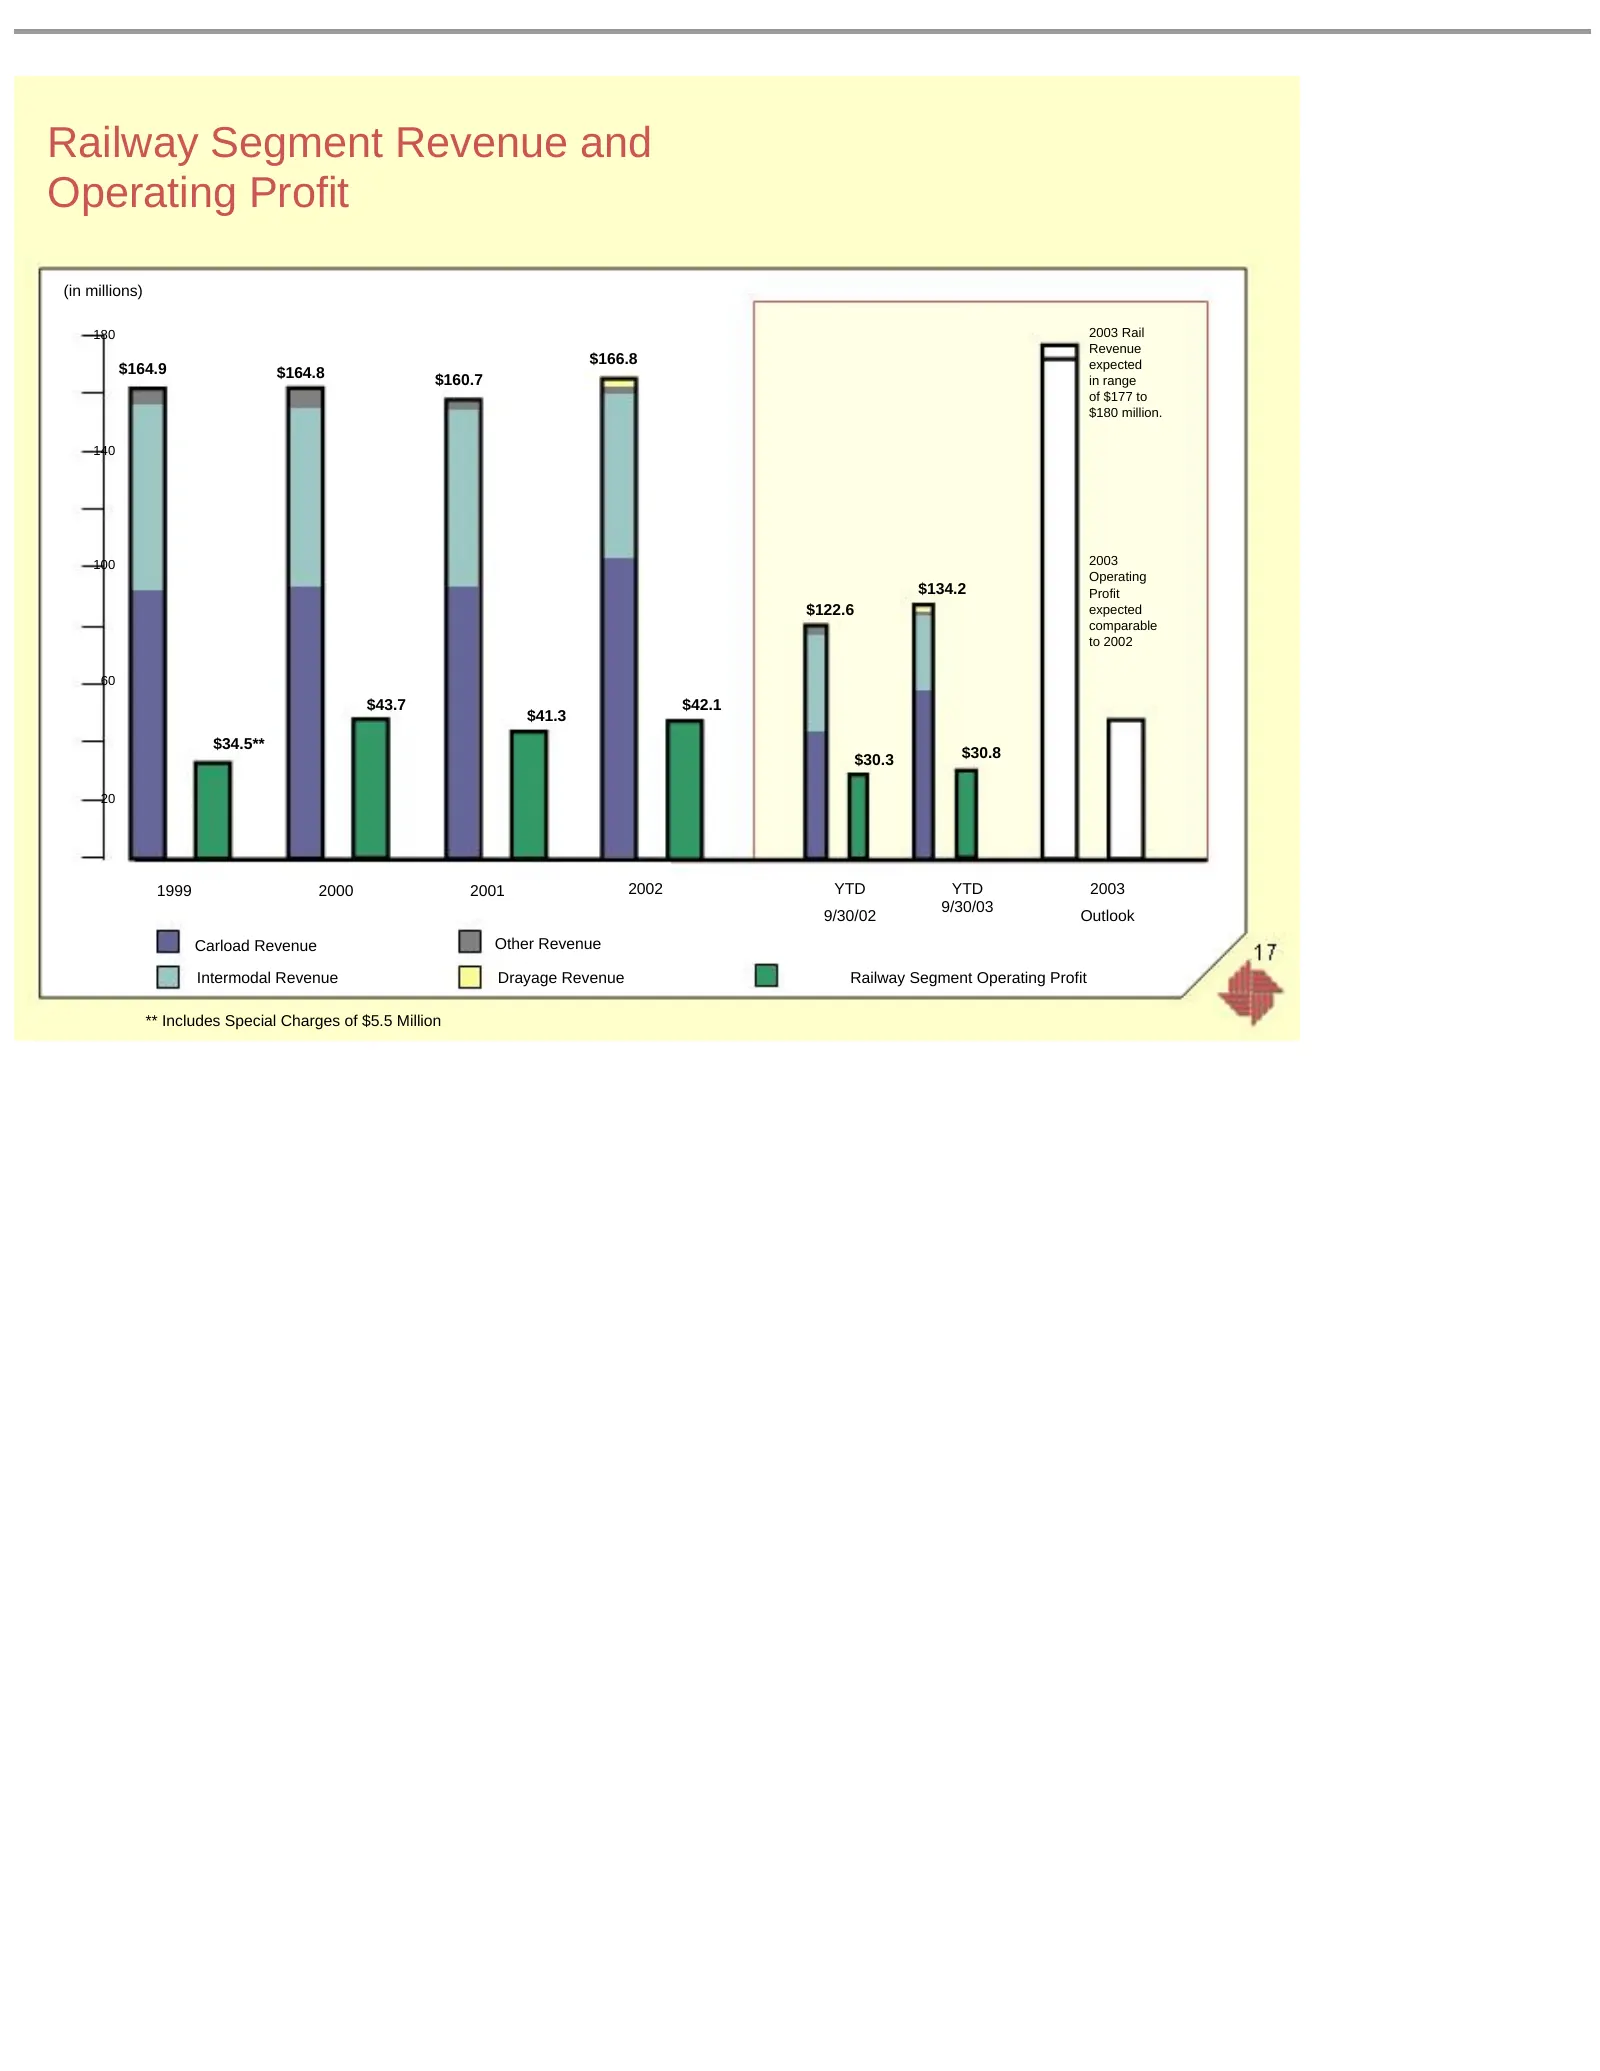
Slide 17: Railway Segment Revenue and Operating Profit
Railway Segment Revenue and Operating Profit (in millions) 180 2003 Rail Revenue $166.8 expected $164.9 $164.8 $160.7 in range of $177 to $180 million. 140 100 2003 Operating $134.2 Profit $122.6 expected comparable to 2002 60 $43.7 $42.1 $41.3 $34.5** $30.3 $30.8 20 1999 2000 2001 2002 YTD YTD 2003
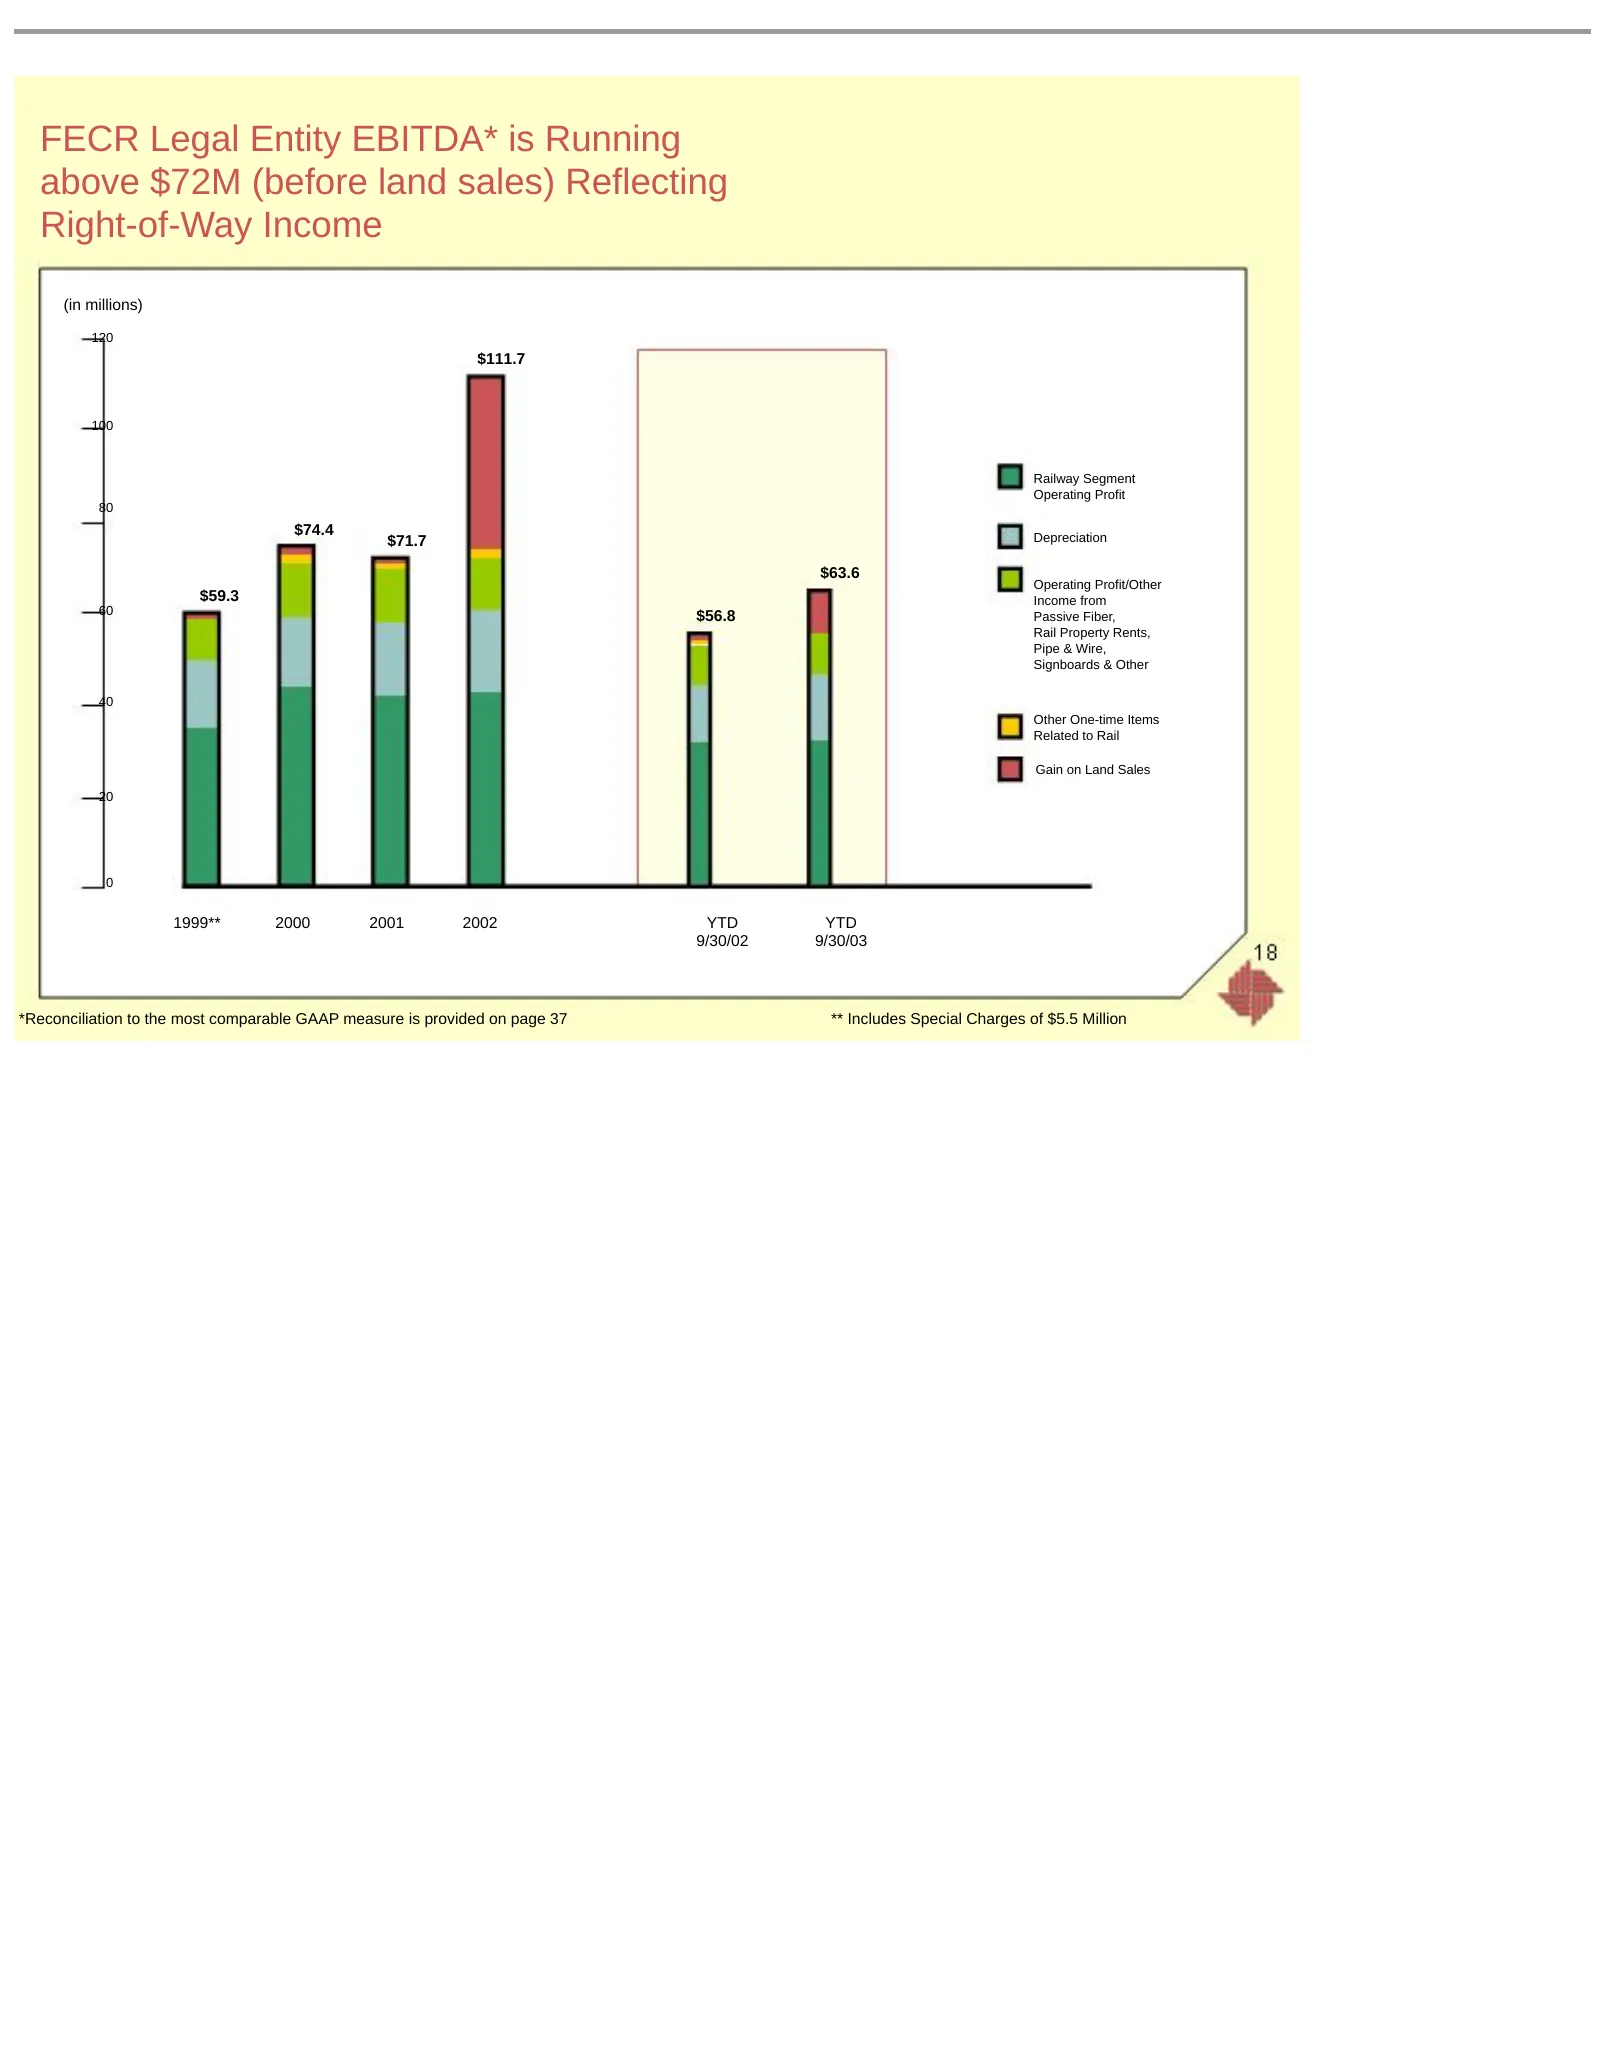
Slide 18: FECR Legal Entity EBITDA Running above $72M
FECR Legal Entity EBITDA* is Running above $72M (before land sales) Reflecting Right-of-Way Income (in millions) 120 $111.7 100 Railway Segment Operating Profit 80 $74.4 Depreciation $71.7 $63.6 Operating Profit/Other $59.3 Income from 60 $56.8 Passive Fiber, Rail Property Rents, Pipe & Wire, Signbo
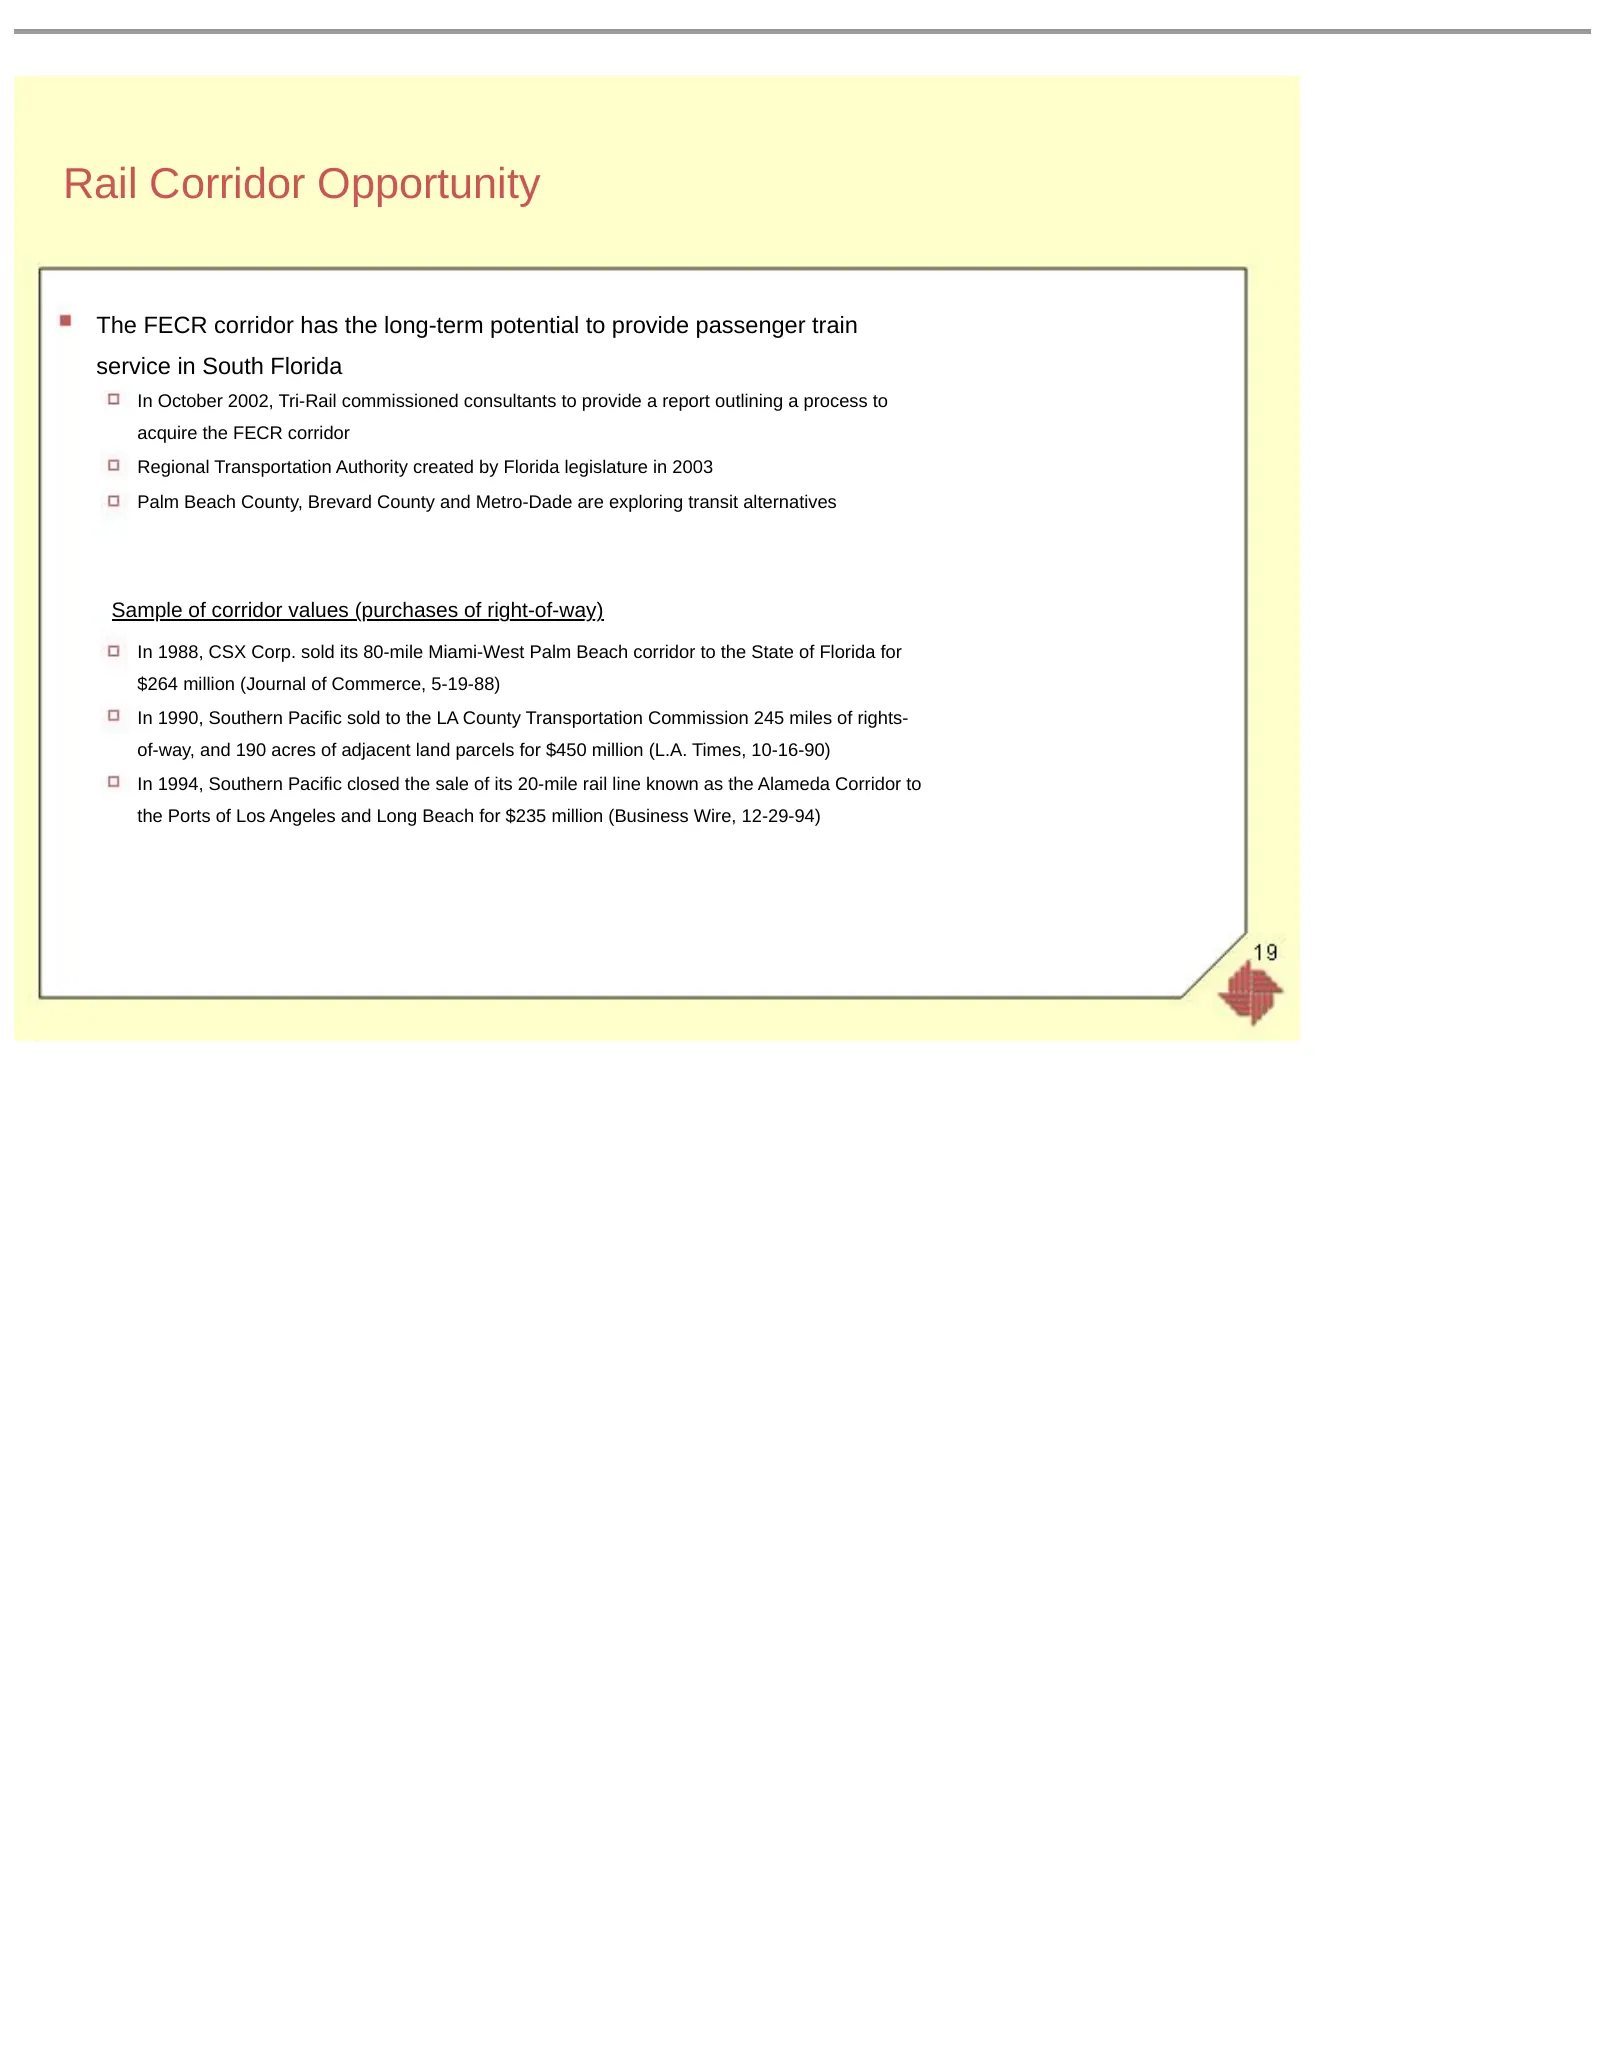
Slide 19: Rail Corridor Opportunity
Rail Corridor Opportunity The FECR corridor has the long-term potential to provide passenger train service in South Florida In October 2002, Tri-Rail commissioned consultants to provide a report outlining a process to acquire the FECR corridor Regional Transportation Authority created by Florida leg
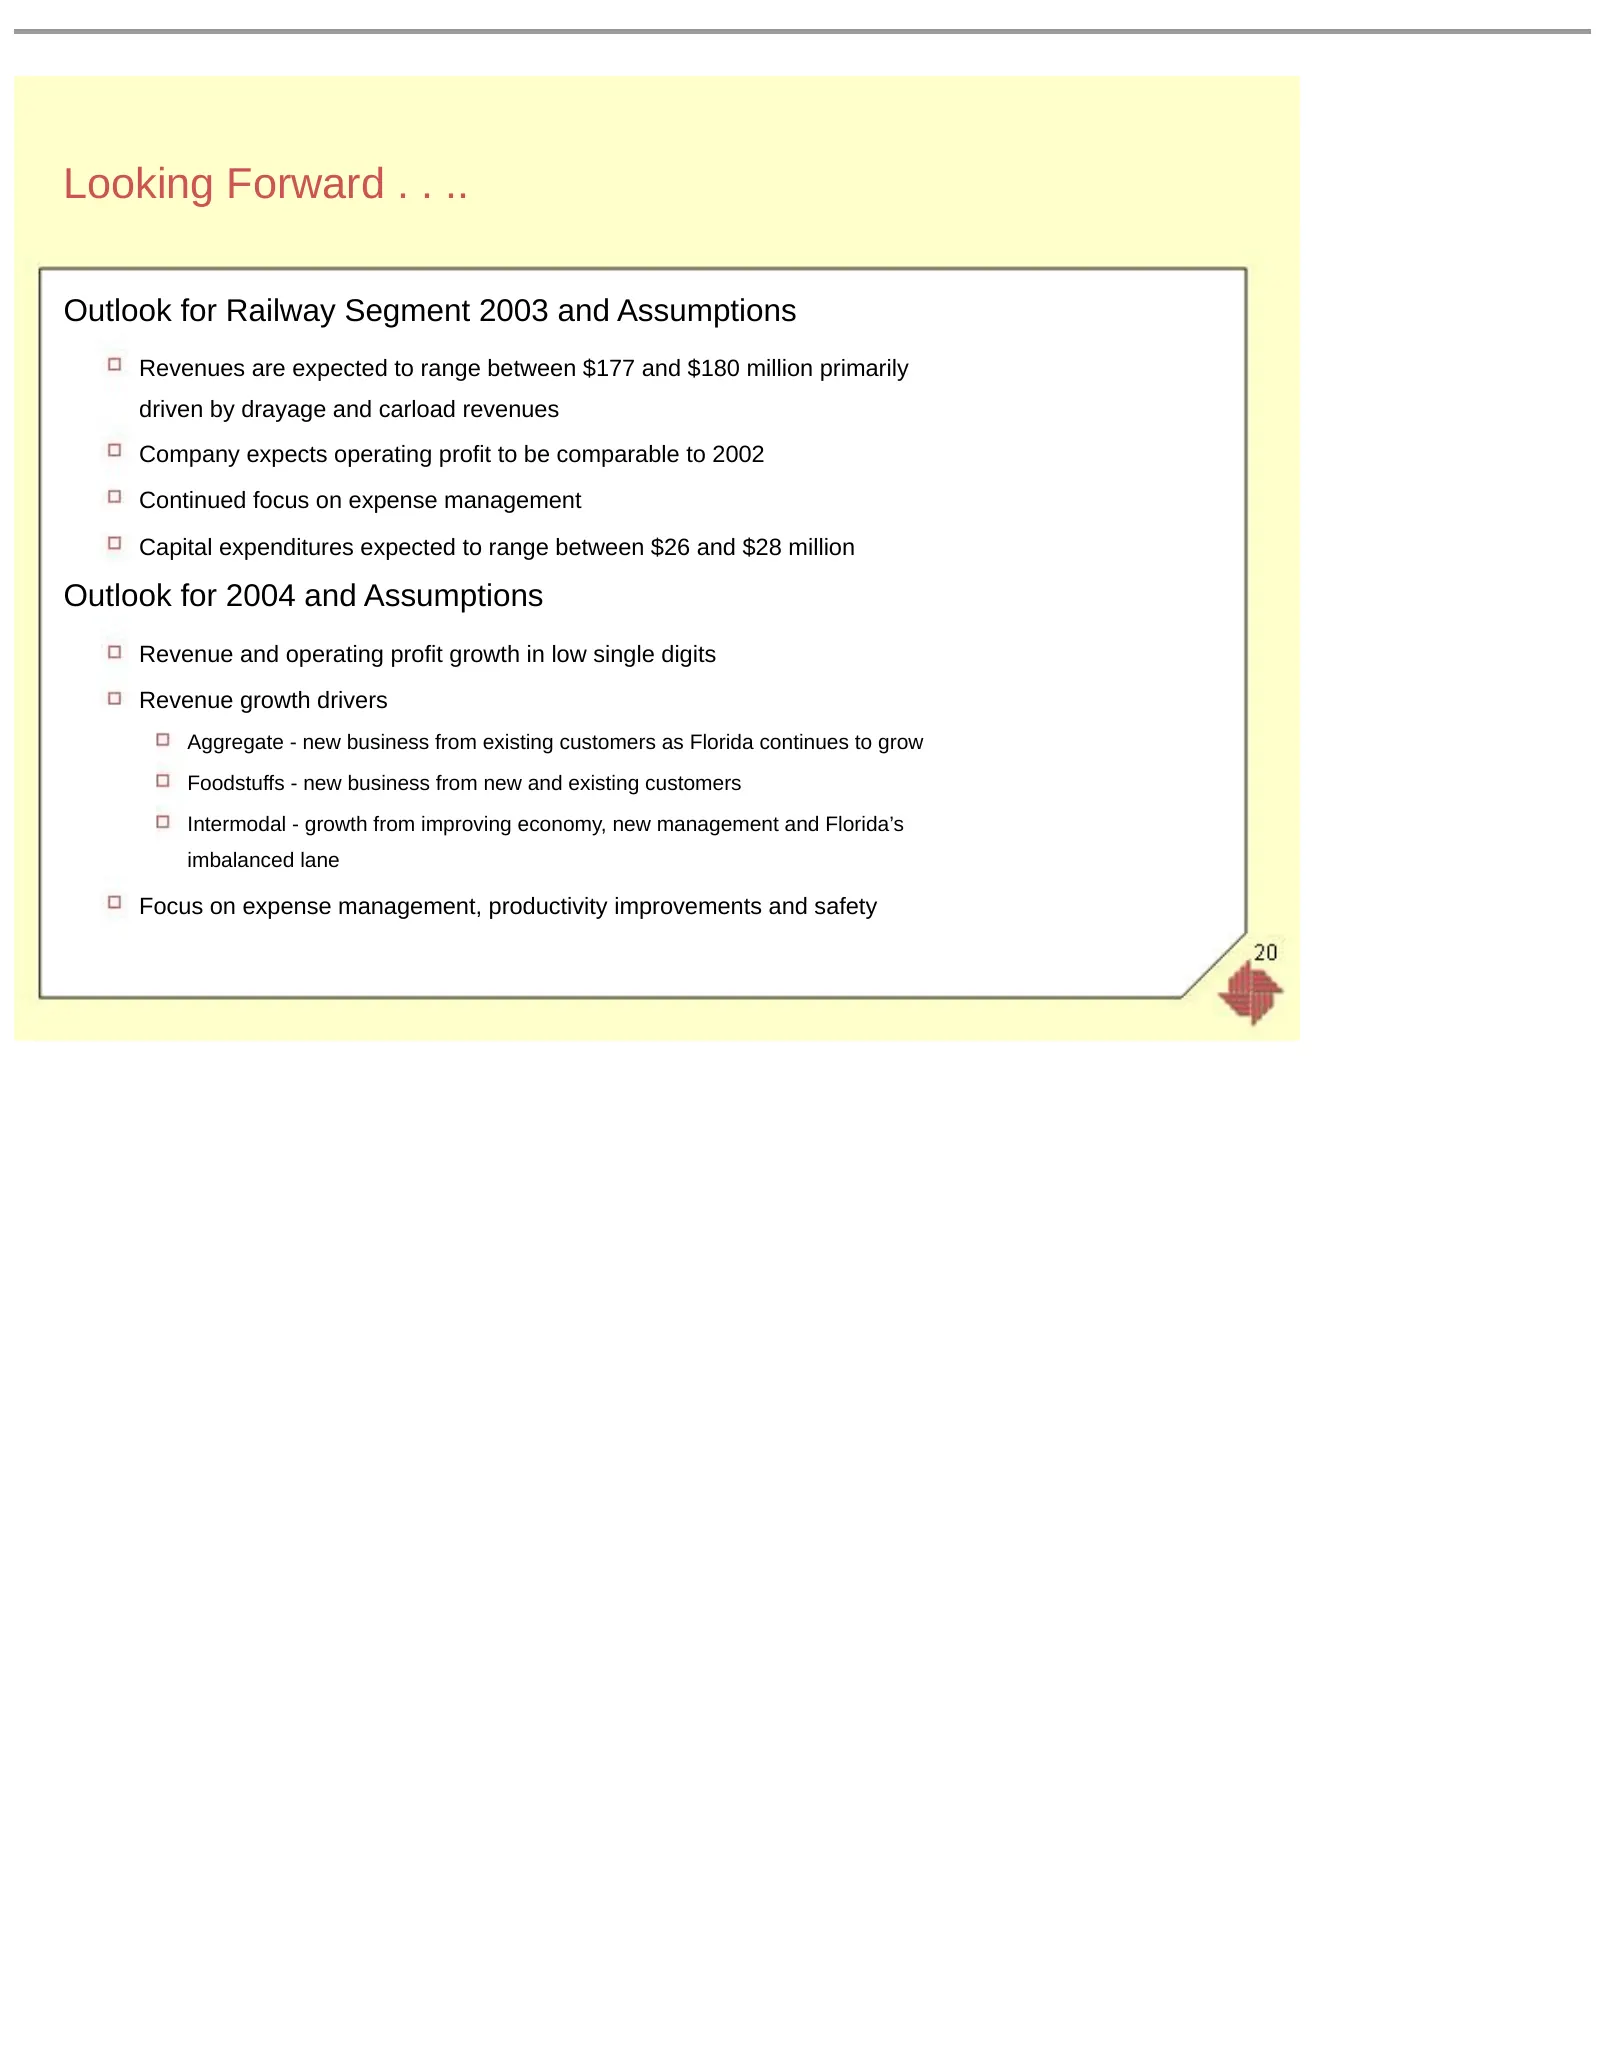
Slide 20: Looking Forward . . ..
Looking Forward . . .. Outlook for Railway Segment 2003 and Assumptions Revenues are expected to range between $177 and $180 million primarily driven by drayage and carload revenues Company expects operating profit to be comparable to 2002 Continued focus on expense management Capital expenditures e
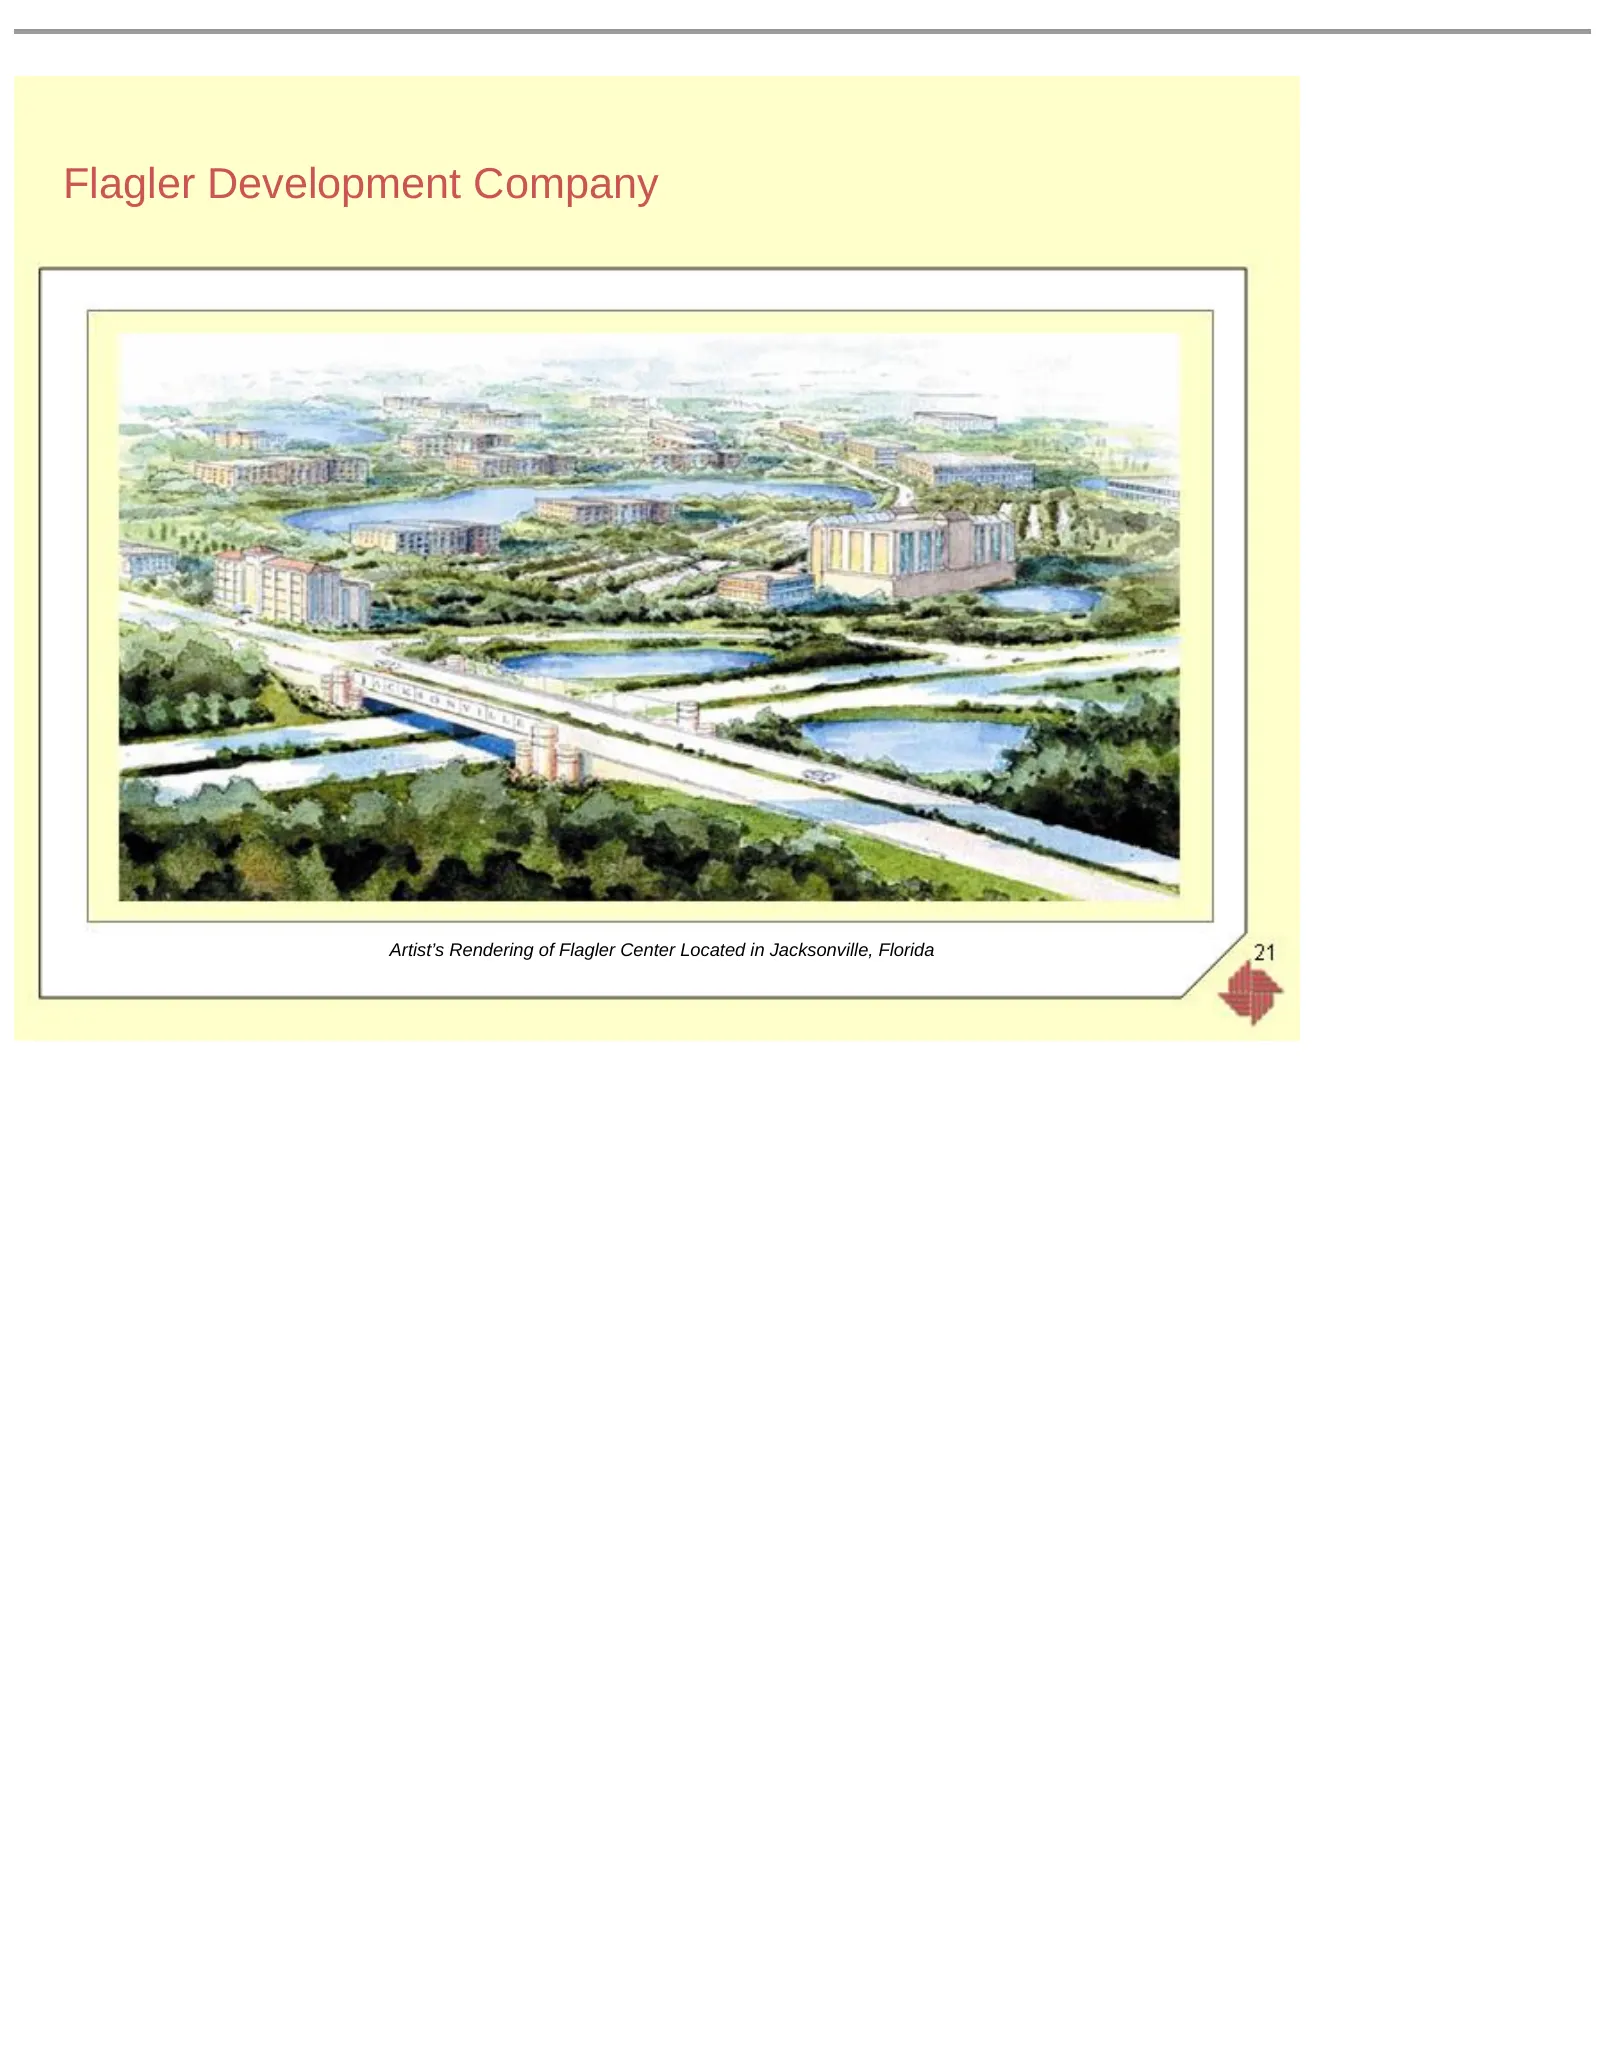
Slide 21: Flagler Development Company
Flagler Development Company Artist’s Rendering of Flagler Center Located in Jacksonville, Florida
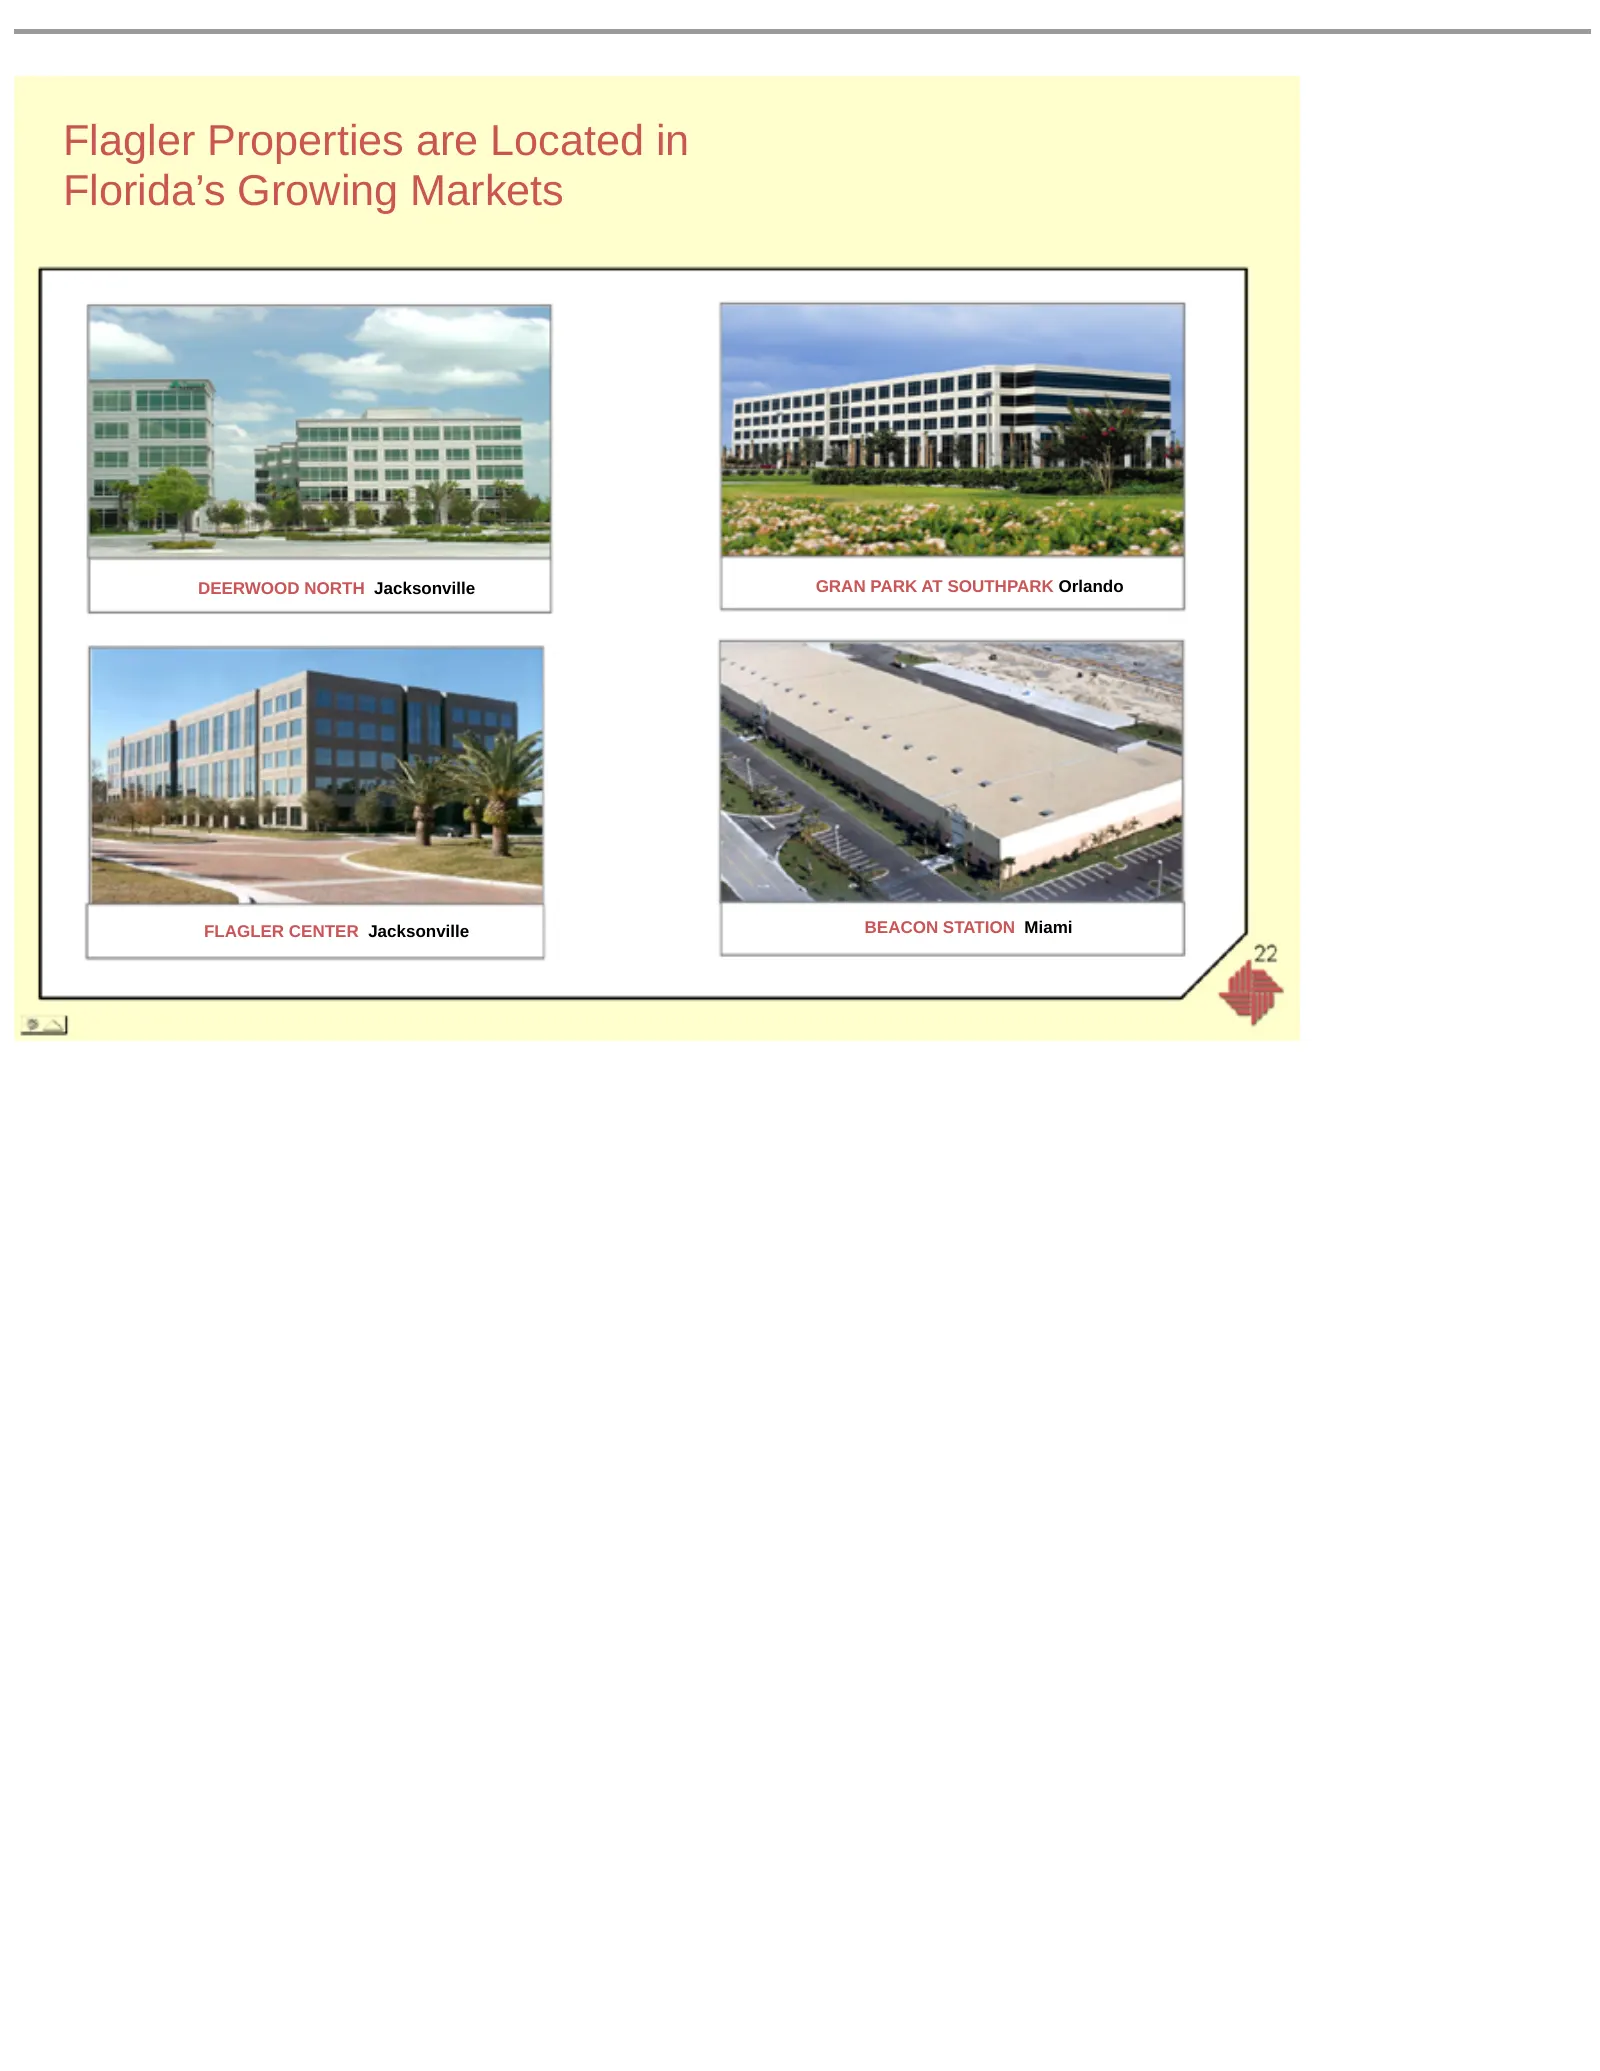
Slide 22: Flagler Properties are Located in Florida's Growing Markets
Flagler Properties are Located in Florida’s Growing Markets DEERWOOD NORTH Jacksonville GRAN PARK AT SOUTHPARK Orlando FLAGLER CENTER Jacksonville BEACON STATION Miami
Slide 23: Flagler Competitive Advantages
Flagler Competitive Advantages Strong, experienced management Established franchise of office and industrial properties Owns, leases and manages 6.6 million square feet of office and industrial space Owns 60 buildings in eight office/industrial parks Developed over 2.8 million square feet since 1999
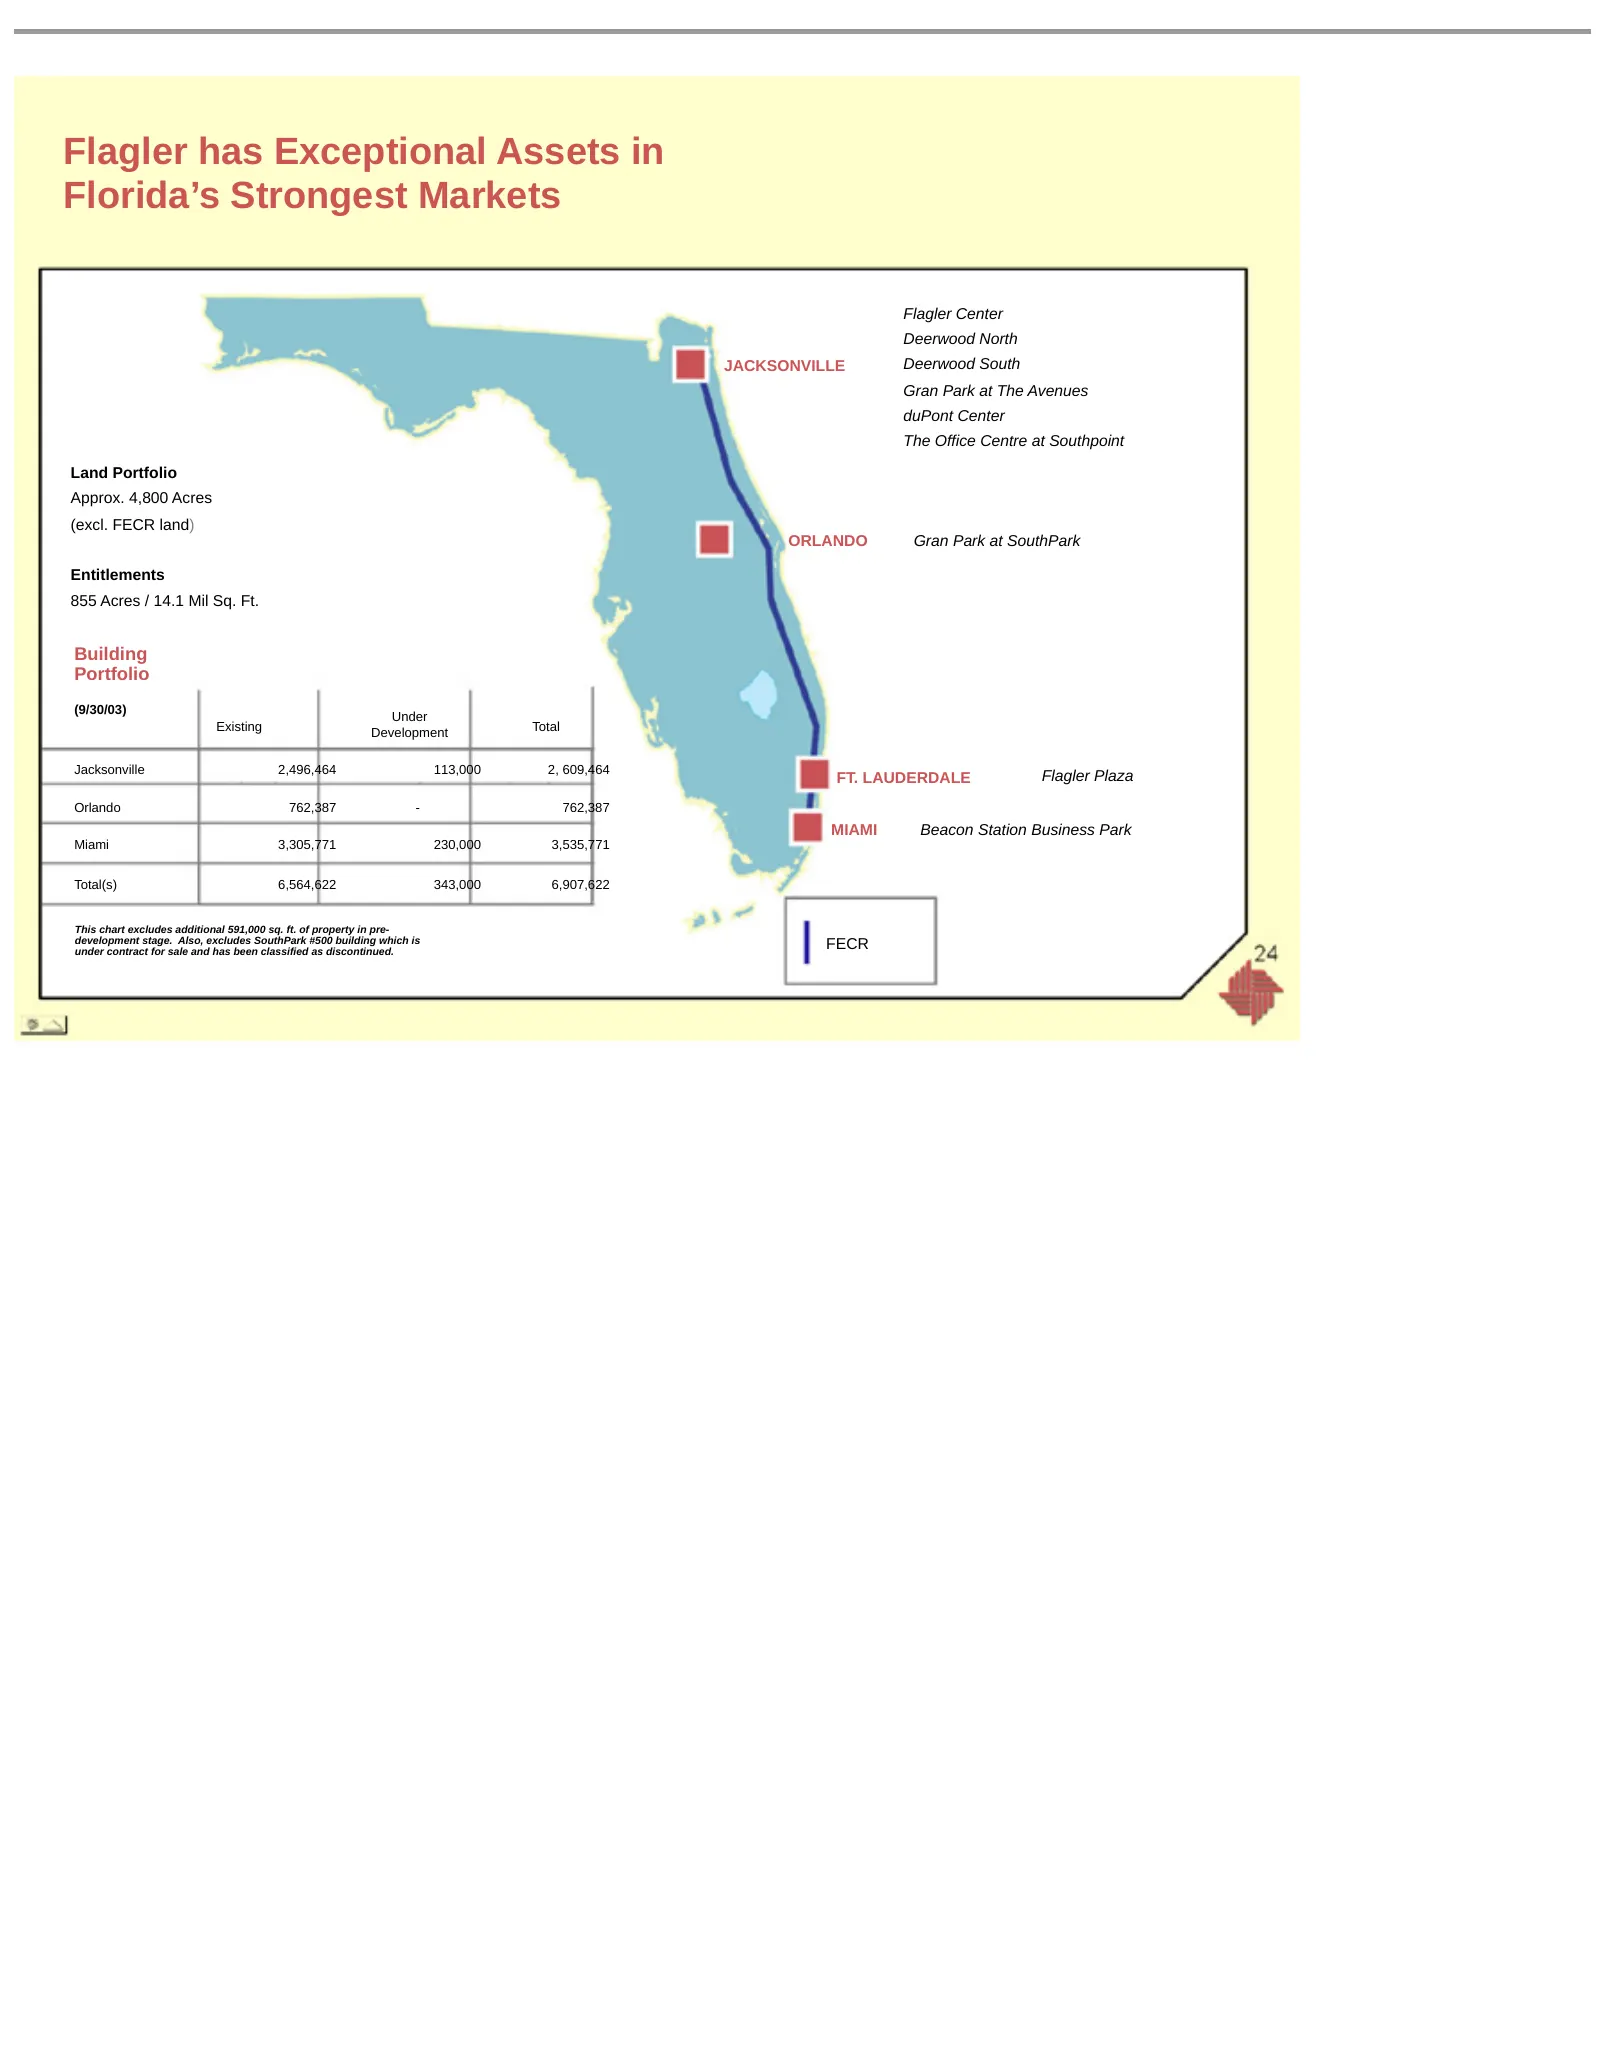
Slide 24: Flagler has Exceptional Assets in Florida's Strongest Markets
Flagler has Exceptional Assets in Florida’s Strongest Markets Flagler Center Deerwood North JACKSONVILLE Deerwood South Gran Park at The Avenues duPont Center The Office Centre at Southpoint Land Portfolio Approx. 4,800 Acres (excl. FECR land) ORLANDO Gran Park at SouthPark Entitlements 855 Acres /
Slide 25: Flagler Growth
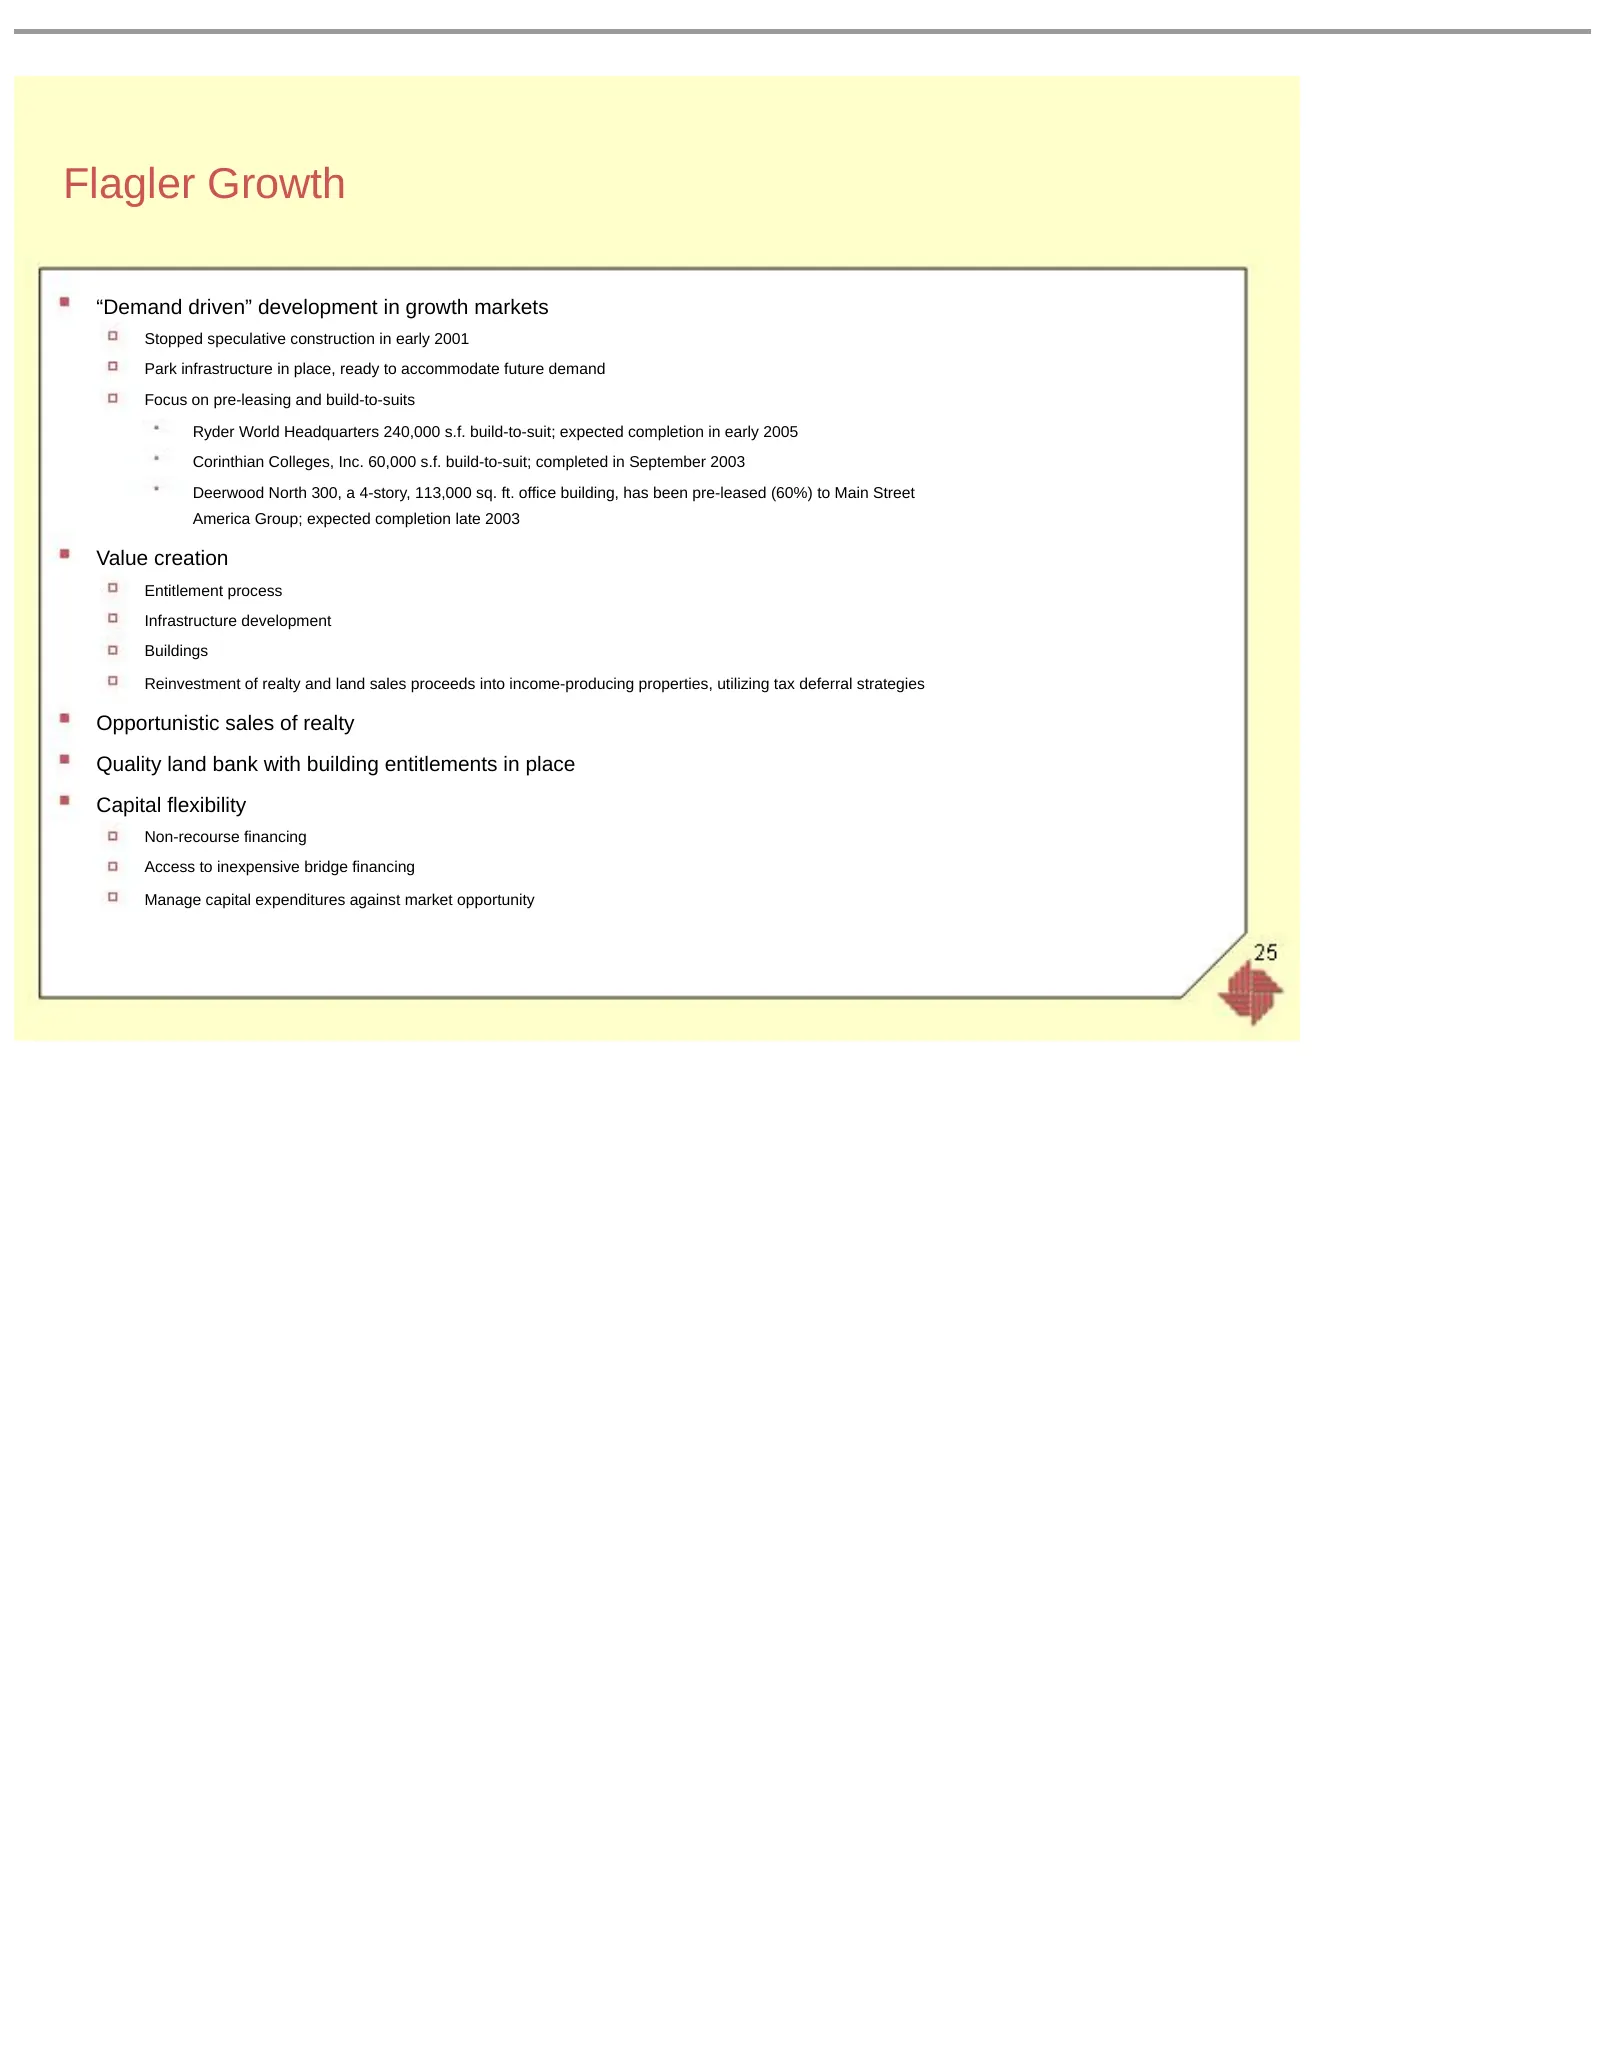
Flagler Growth “Demand driven” development in growth markets Stopped speculative construction in early 2001 Park infrastructure in place, ready to accommodate future demand Focus on pre-leasing and build-to-suits Ryder World Headquarters 240,000 s.f. build-to-suit; expected completion in early 2005
Slide 26: Flagler has a Diversified Tenant Base
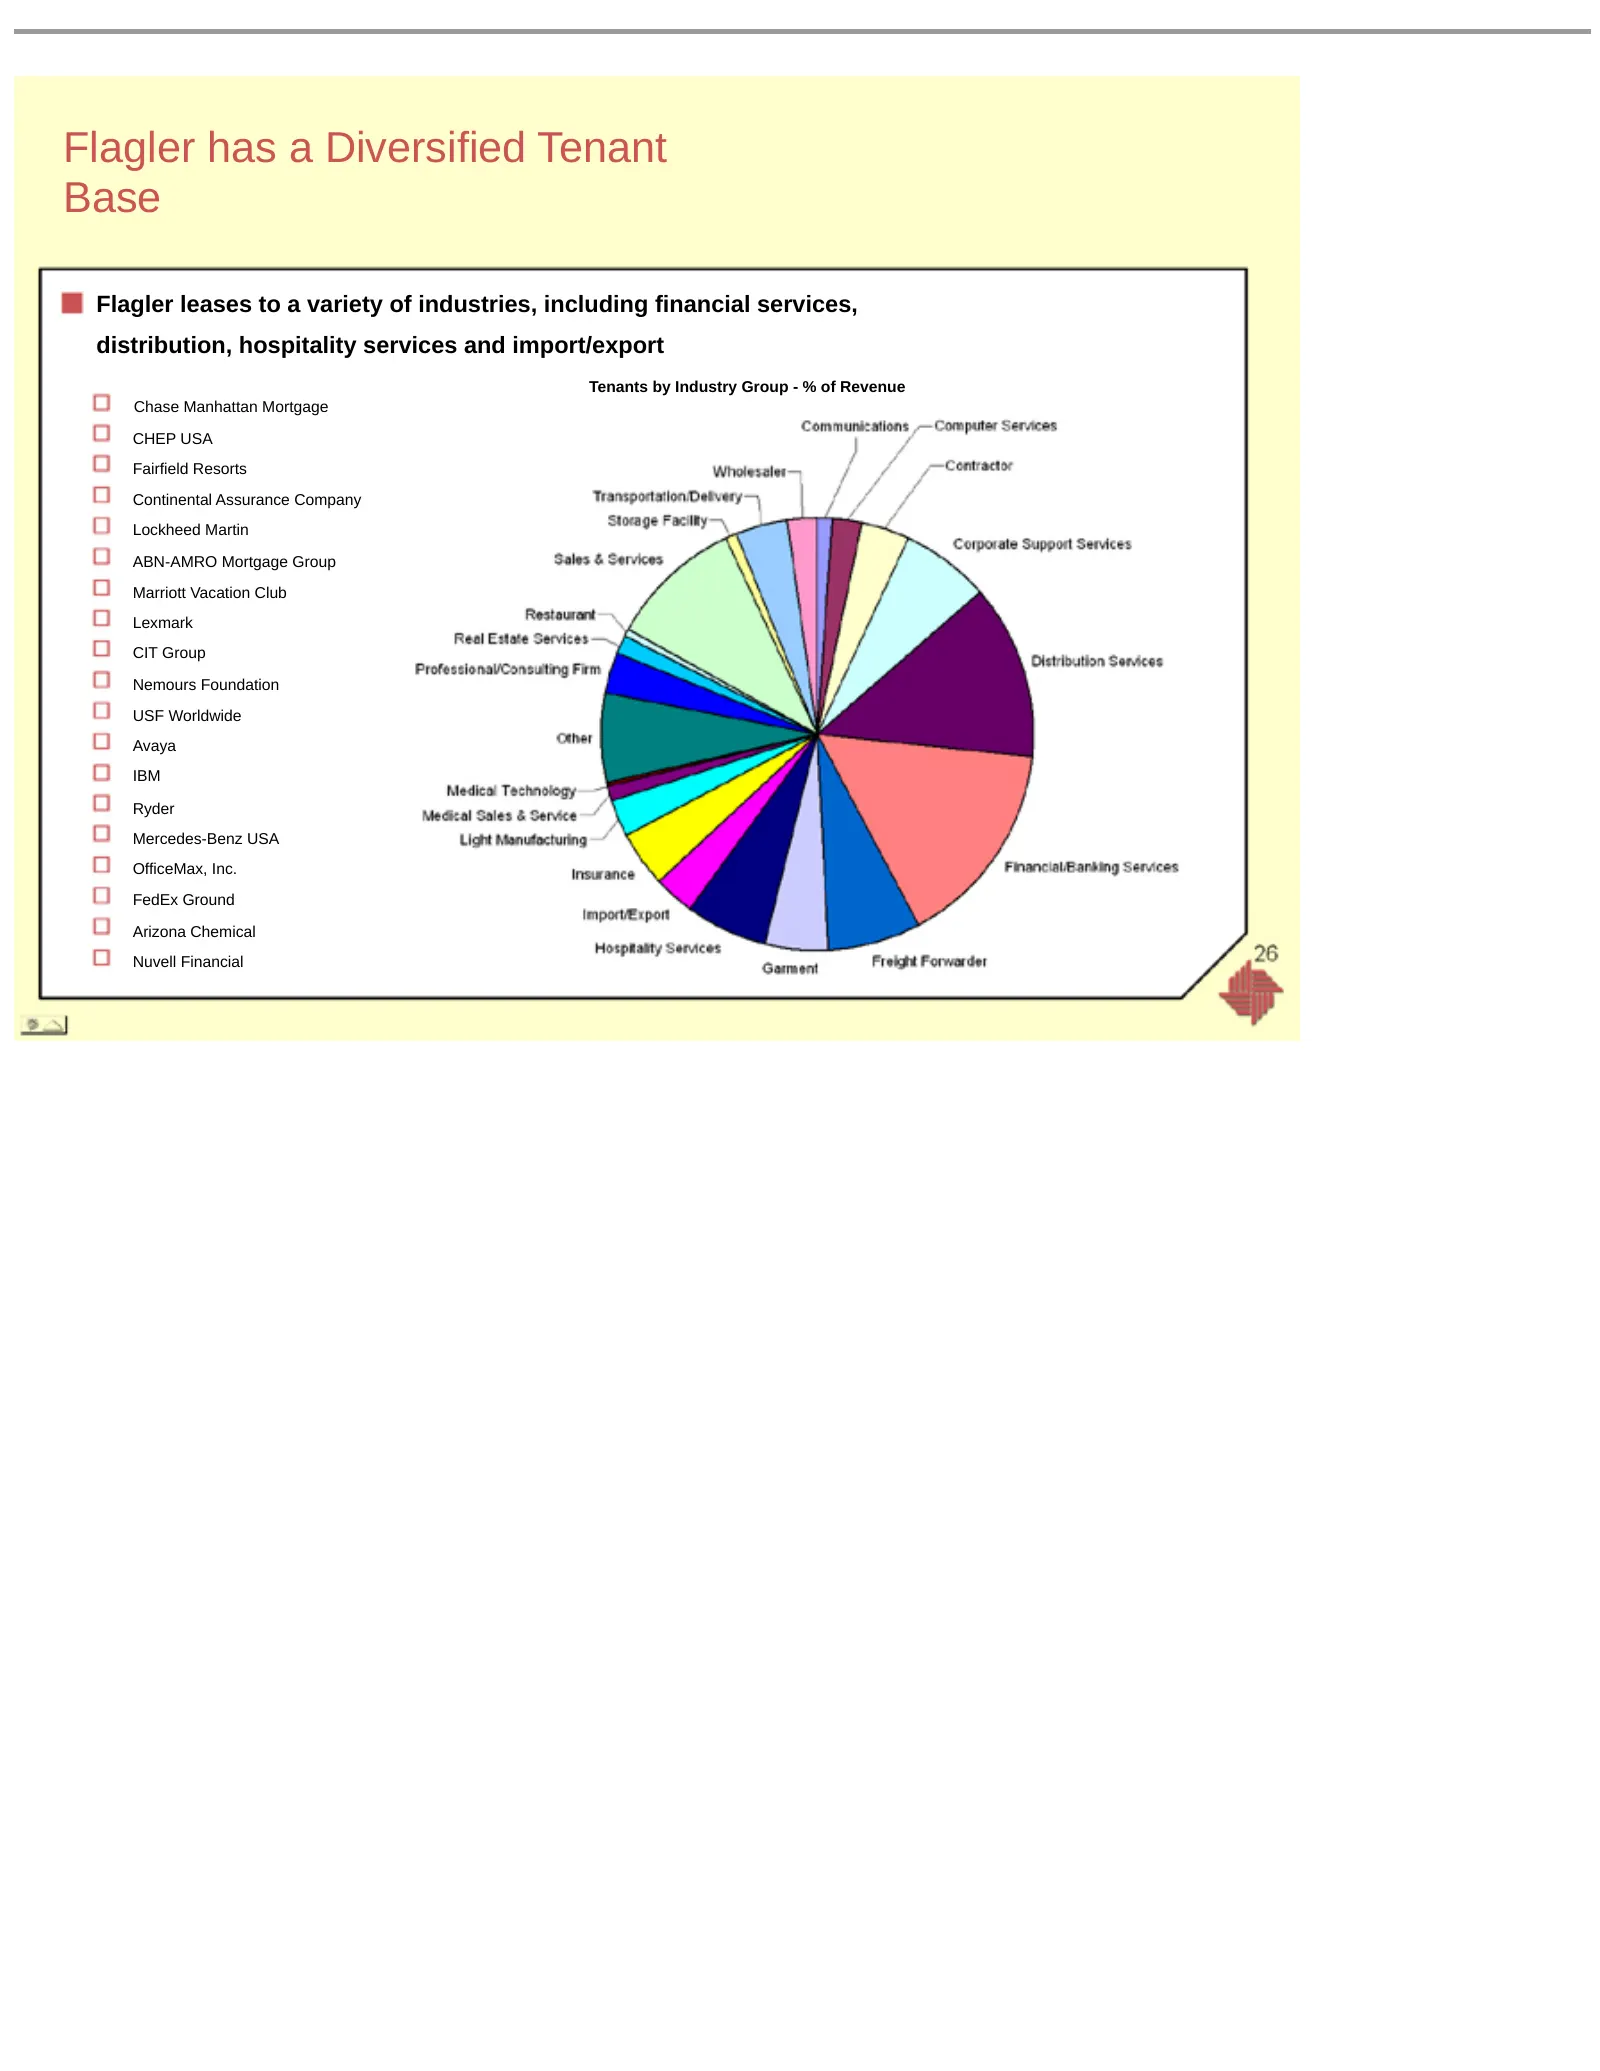
Flagler has a Diversified Tenant Base Flagler leases to a variety of industries, including financial services, distribution, hospitality services and import/export Tenants by Industry Group - % of Revenue Chase Manhattan Mortgage CHEP USA Fairfield Resorts Continental Assurance Company Lockheed Mart
Slide 27: Key Financial Metrics for Flagler
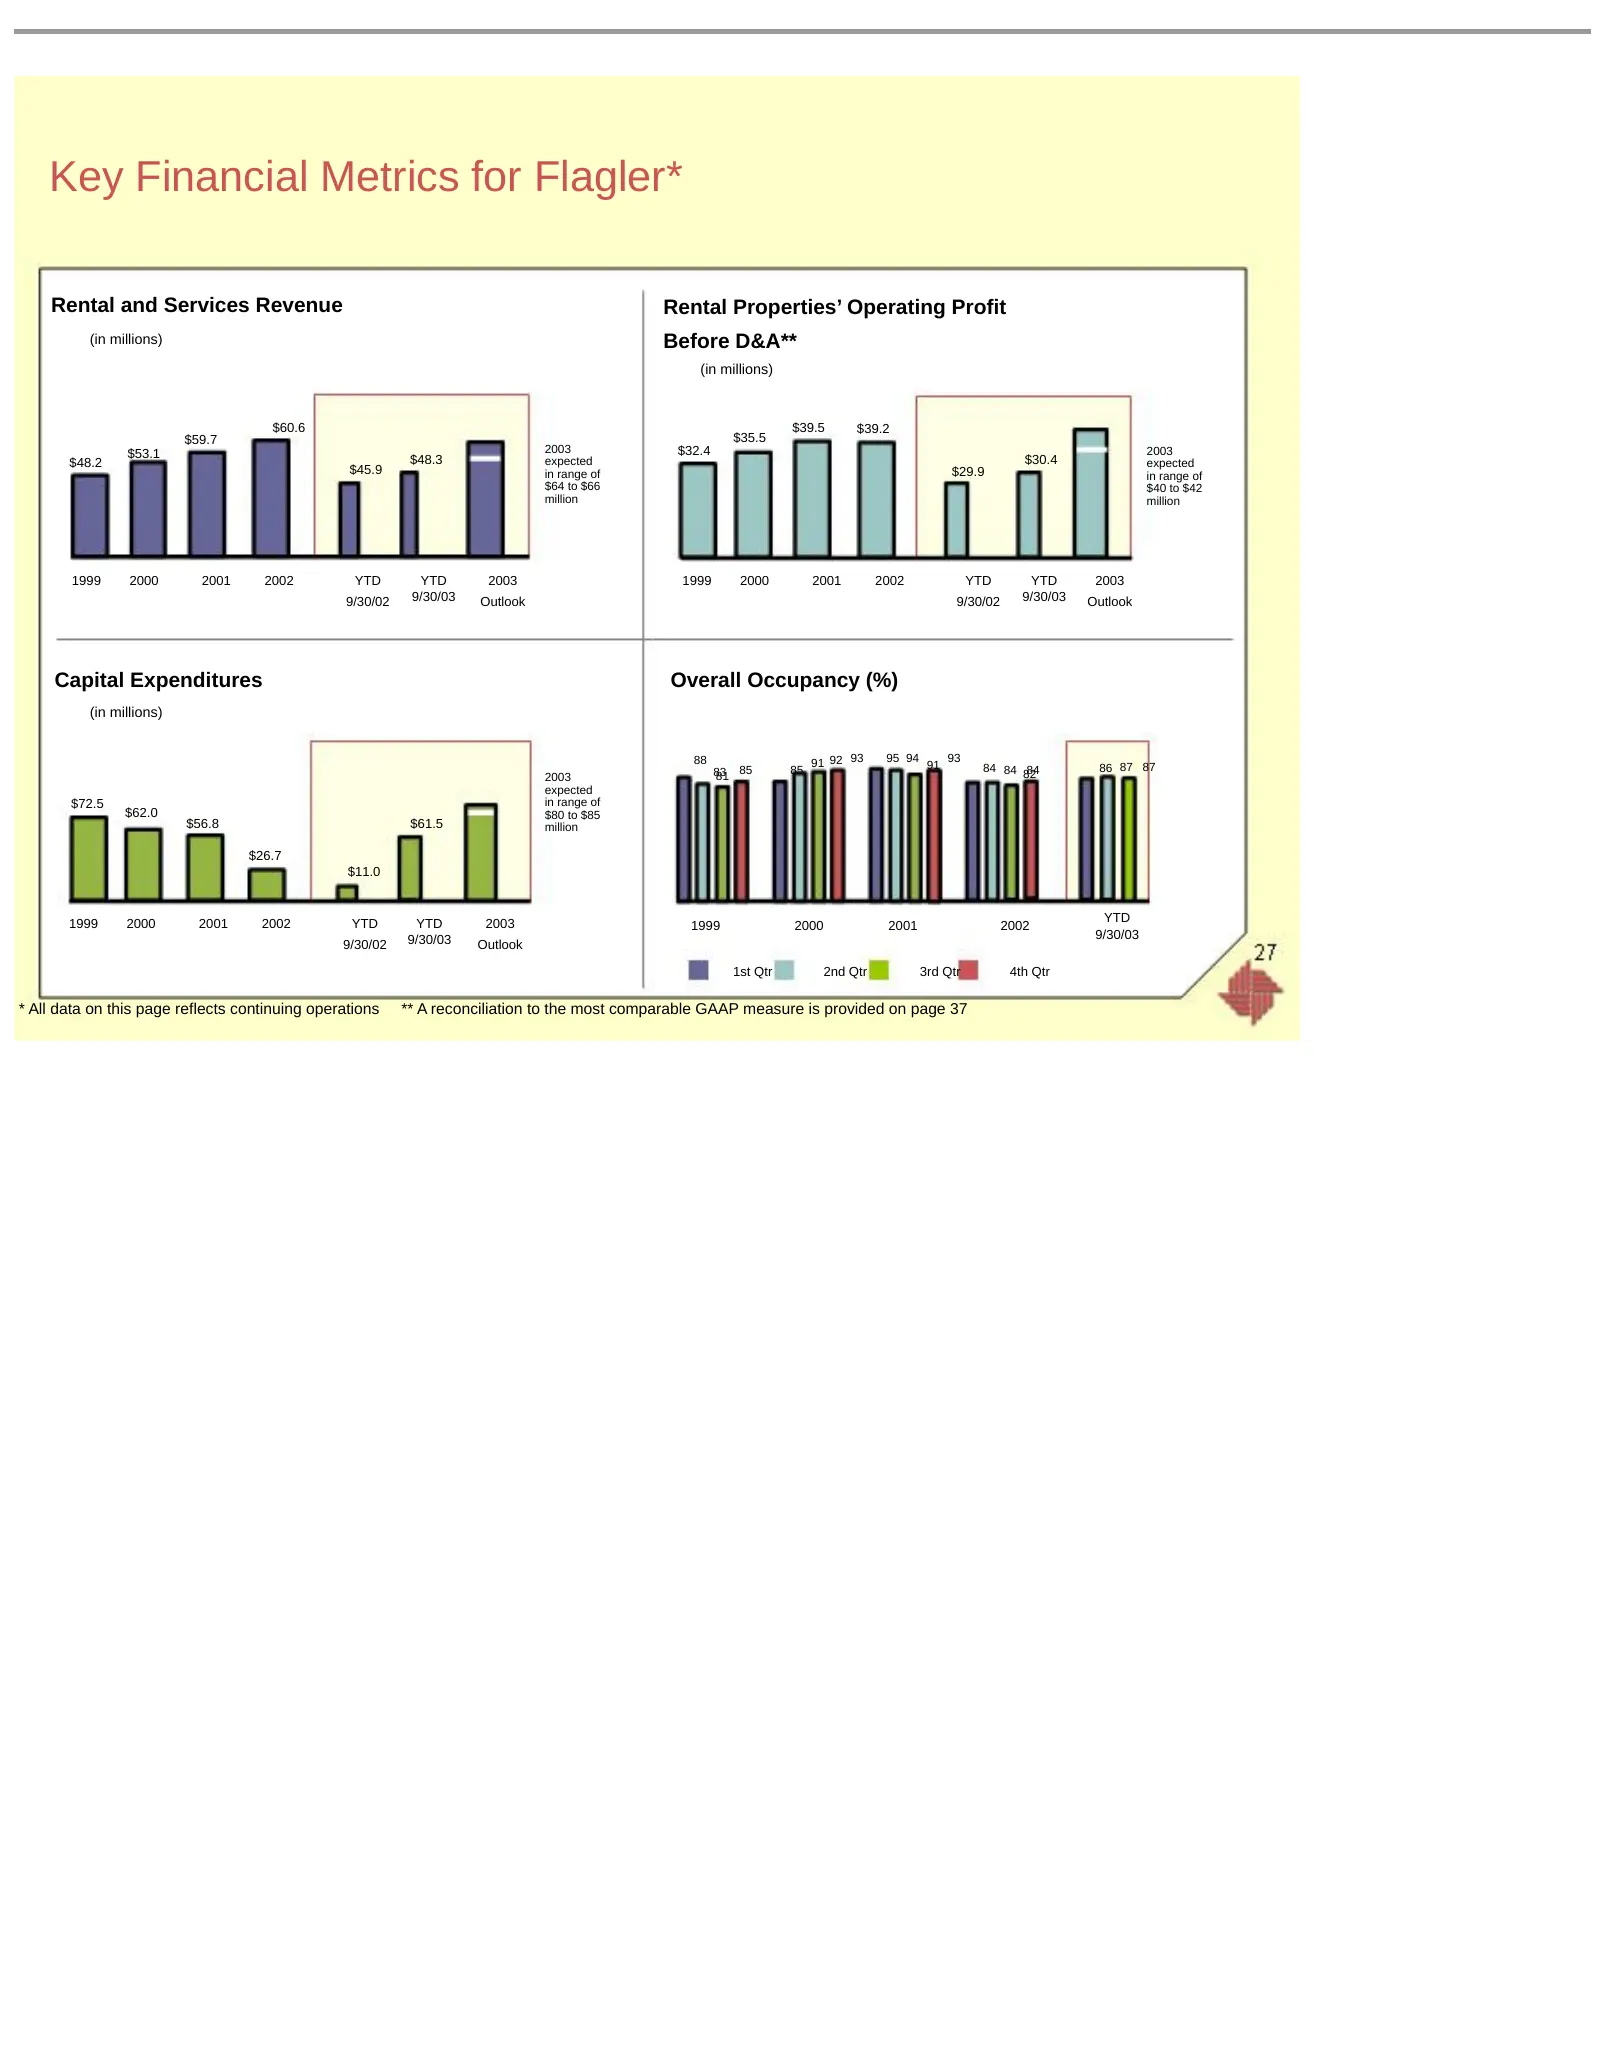
Key Financial Metrics for Flagler* Rental and Services Revenue Rental Properties’ Operating Profit (in millions) Before D&A** (in millions) $60.6 $39.5 $39.2 $59.7 $35.5 $53.1 2003 $32.4 2003 $48.2 $48.3 expected $30.4 expected $45.9 in range of $29.9 in range of $64 to $66 $40 to $42 million millio
Slide 28: Creating Value at Beacon Station
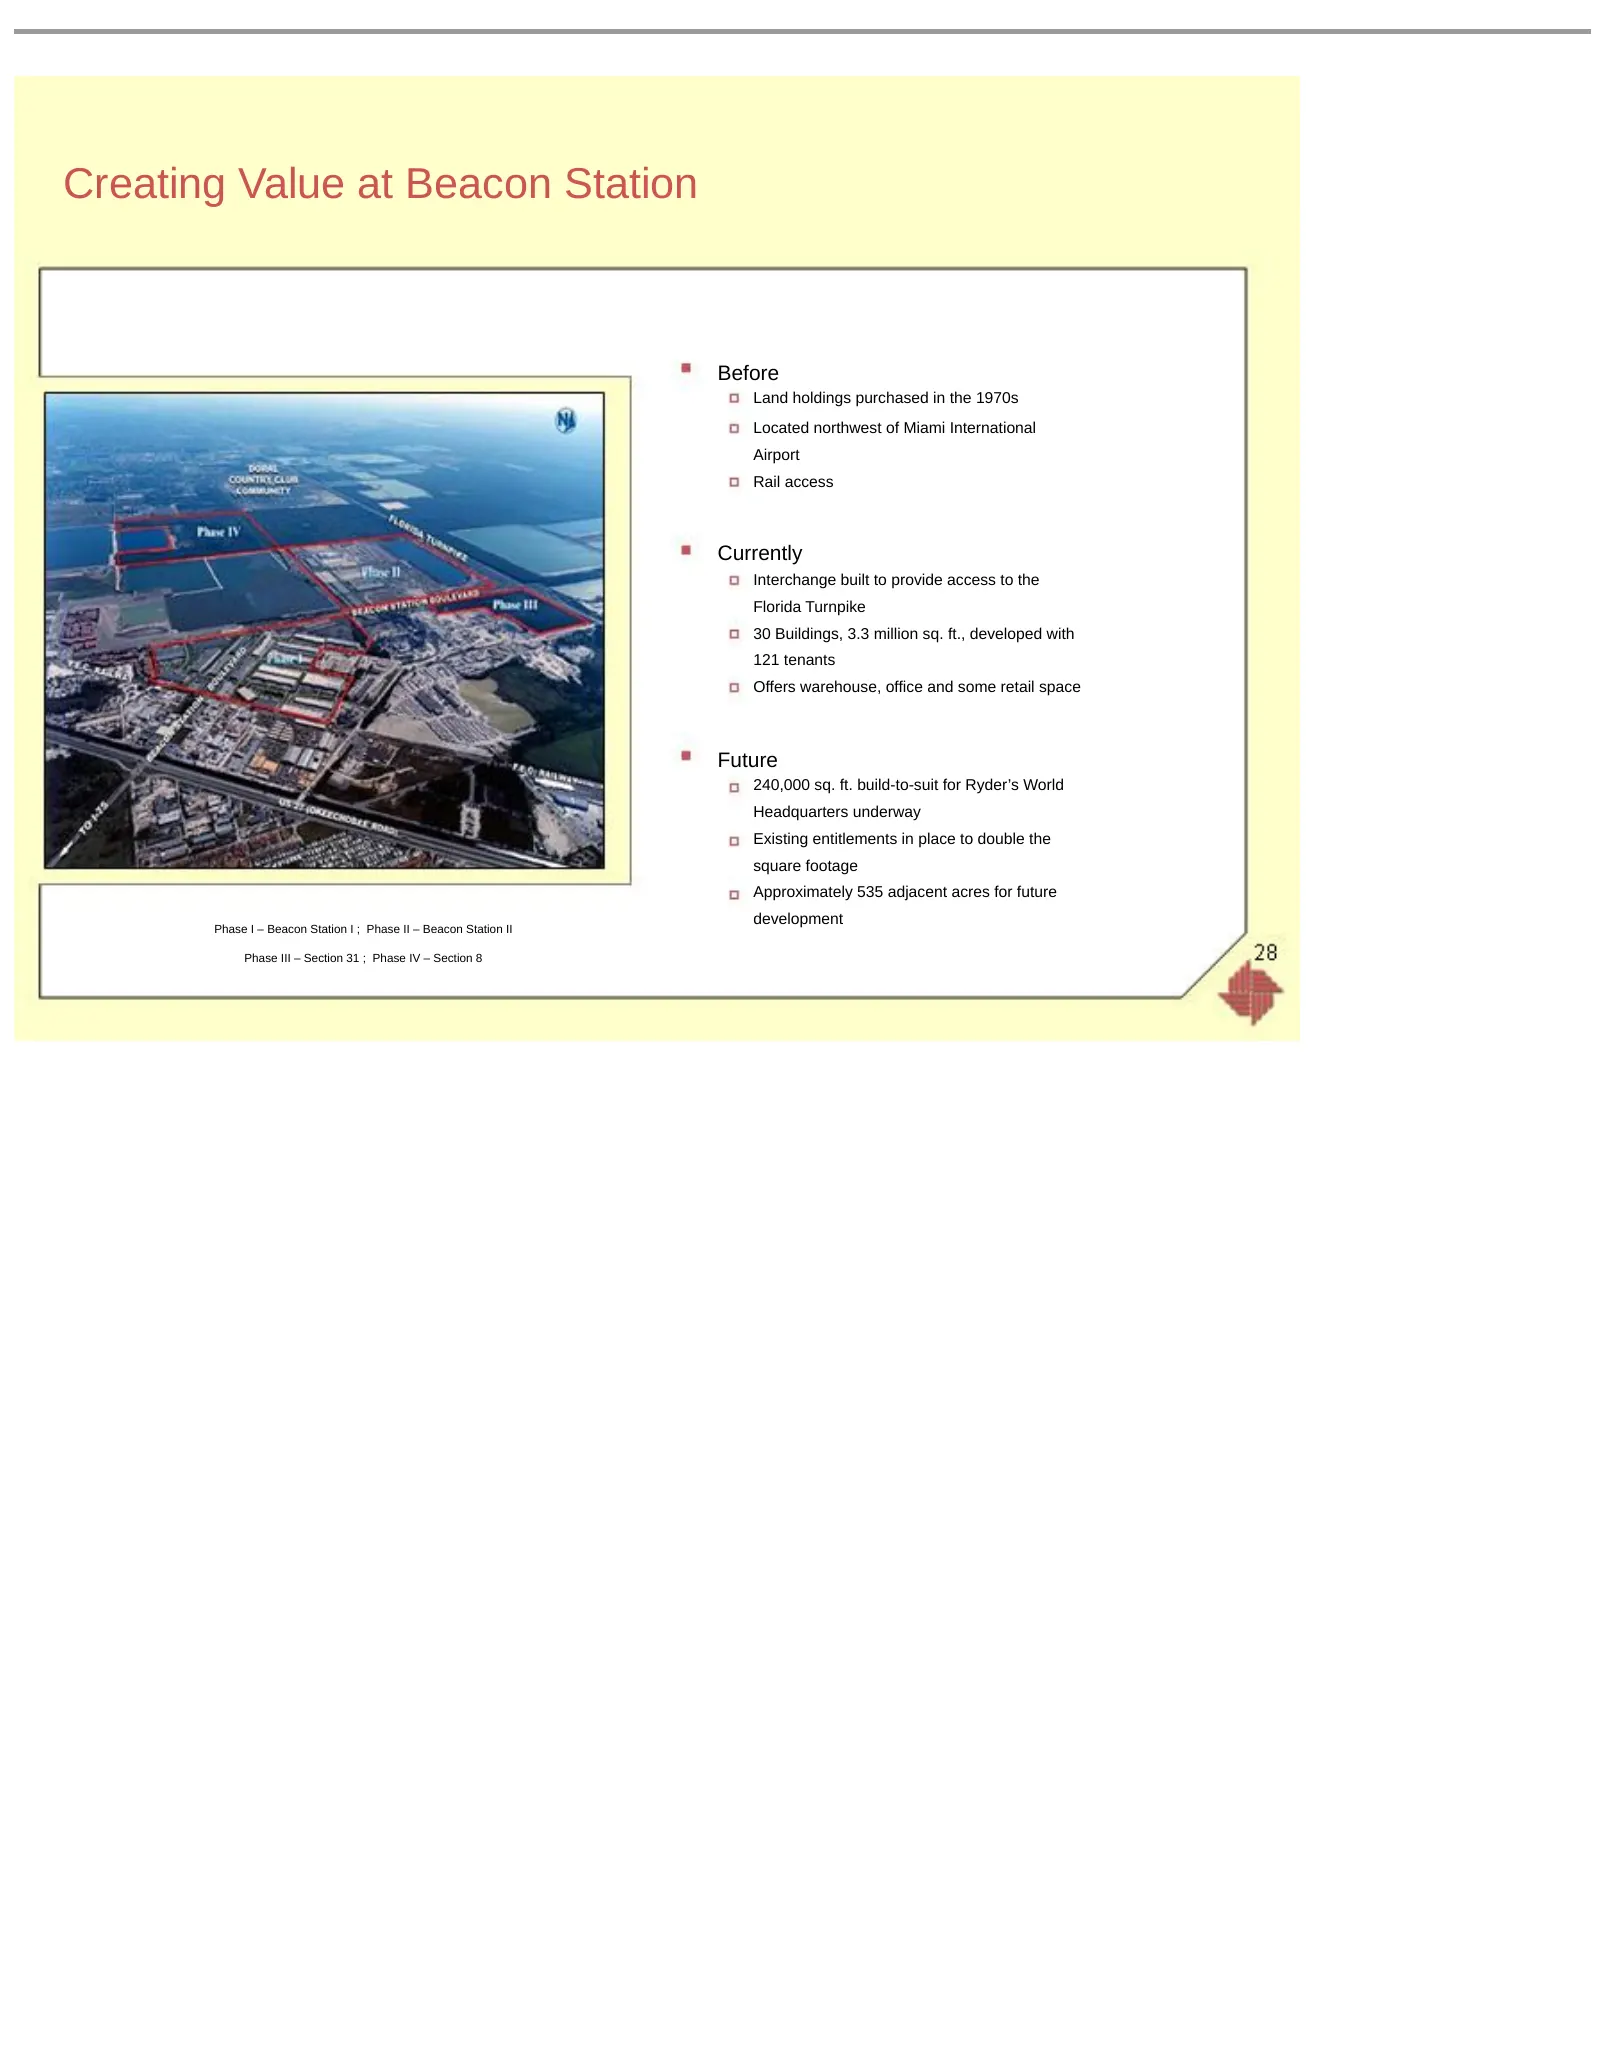
Creating Value at Beacon Station Before Land holdings purchased in the 1970s Located northwest of Miami International Airport Rail access Currently Interchange built to provide access to the Florida Turnpike 30 Buildings, 3.3 million sq. ft., developed with 121 tenants Offers warehouse, office and s
Slide 29: Value Creation at Flagler Center Located in Jacksonville
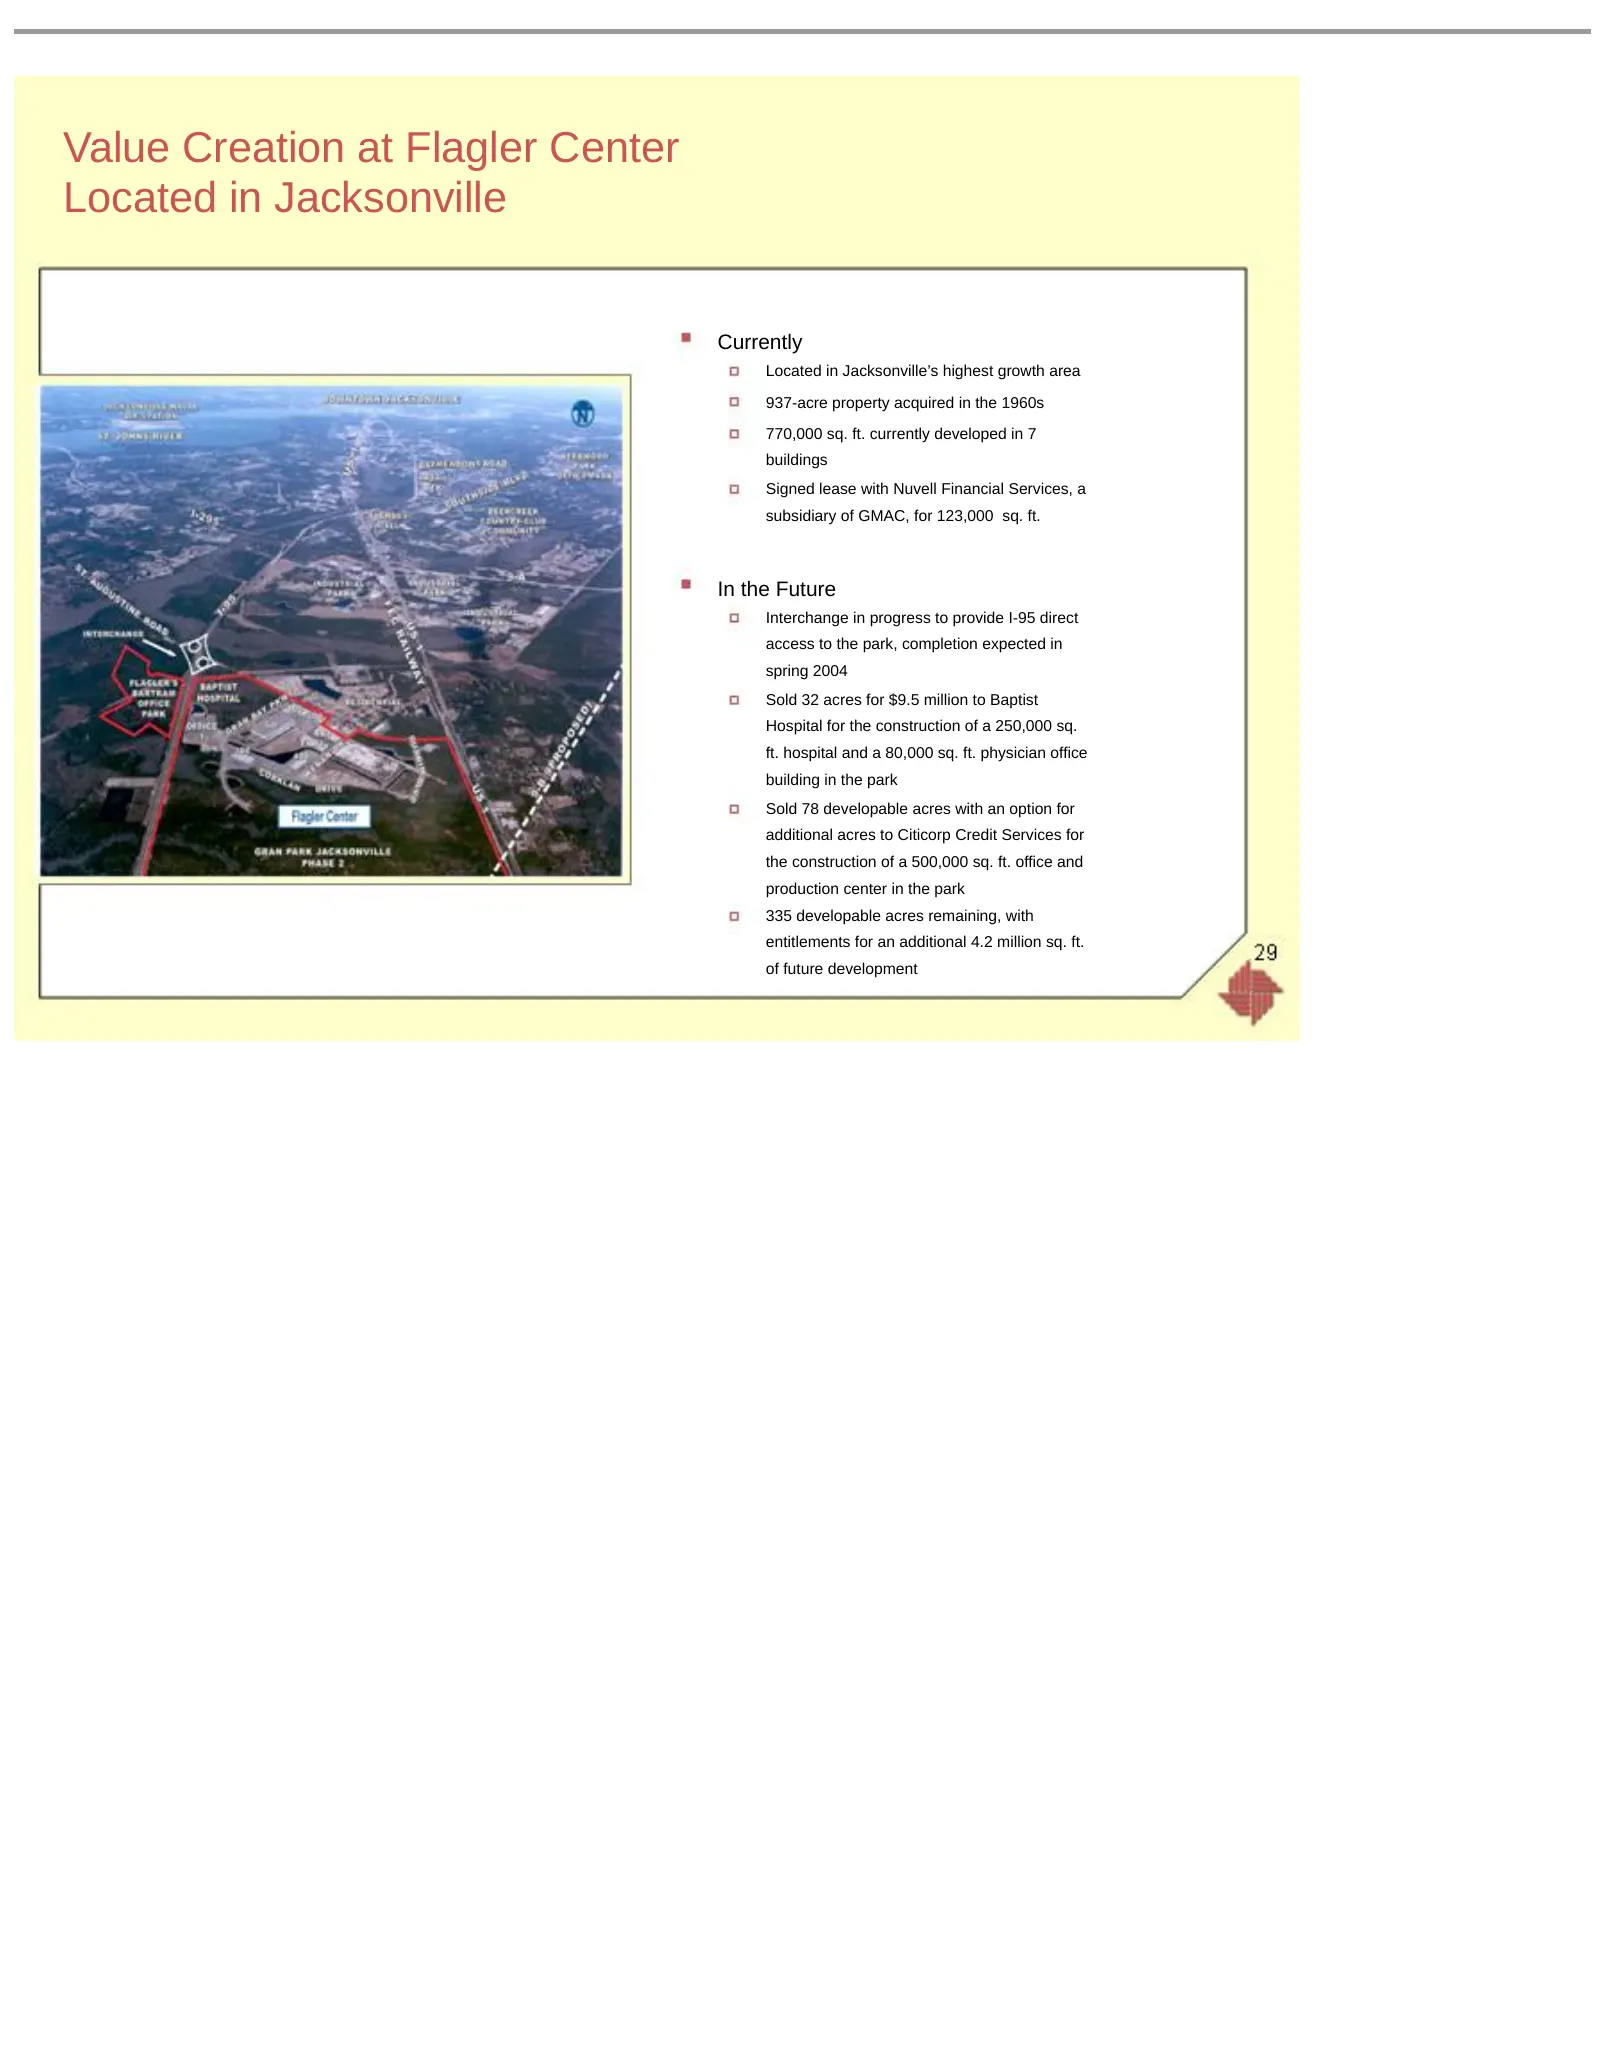
Value Creation at Flagler Center Located in Jacksonville Currently Located in Jacksonville’s highest growth area 937-acre property acquired in the 1960s 770,000 sq. ft. currently developed in 7 buildings Signed lease with Nuvell Financial Services, a subsidiary of GMAC, for 123,000 sq. ft. In the Fu
Slide 30: Realty Disposition Strategy
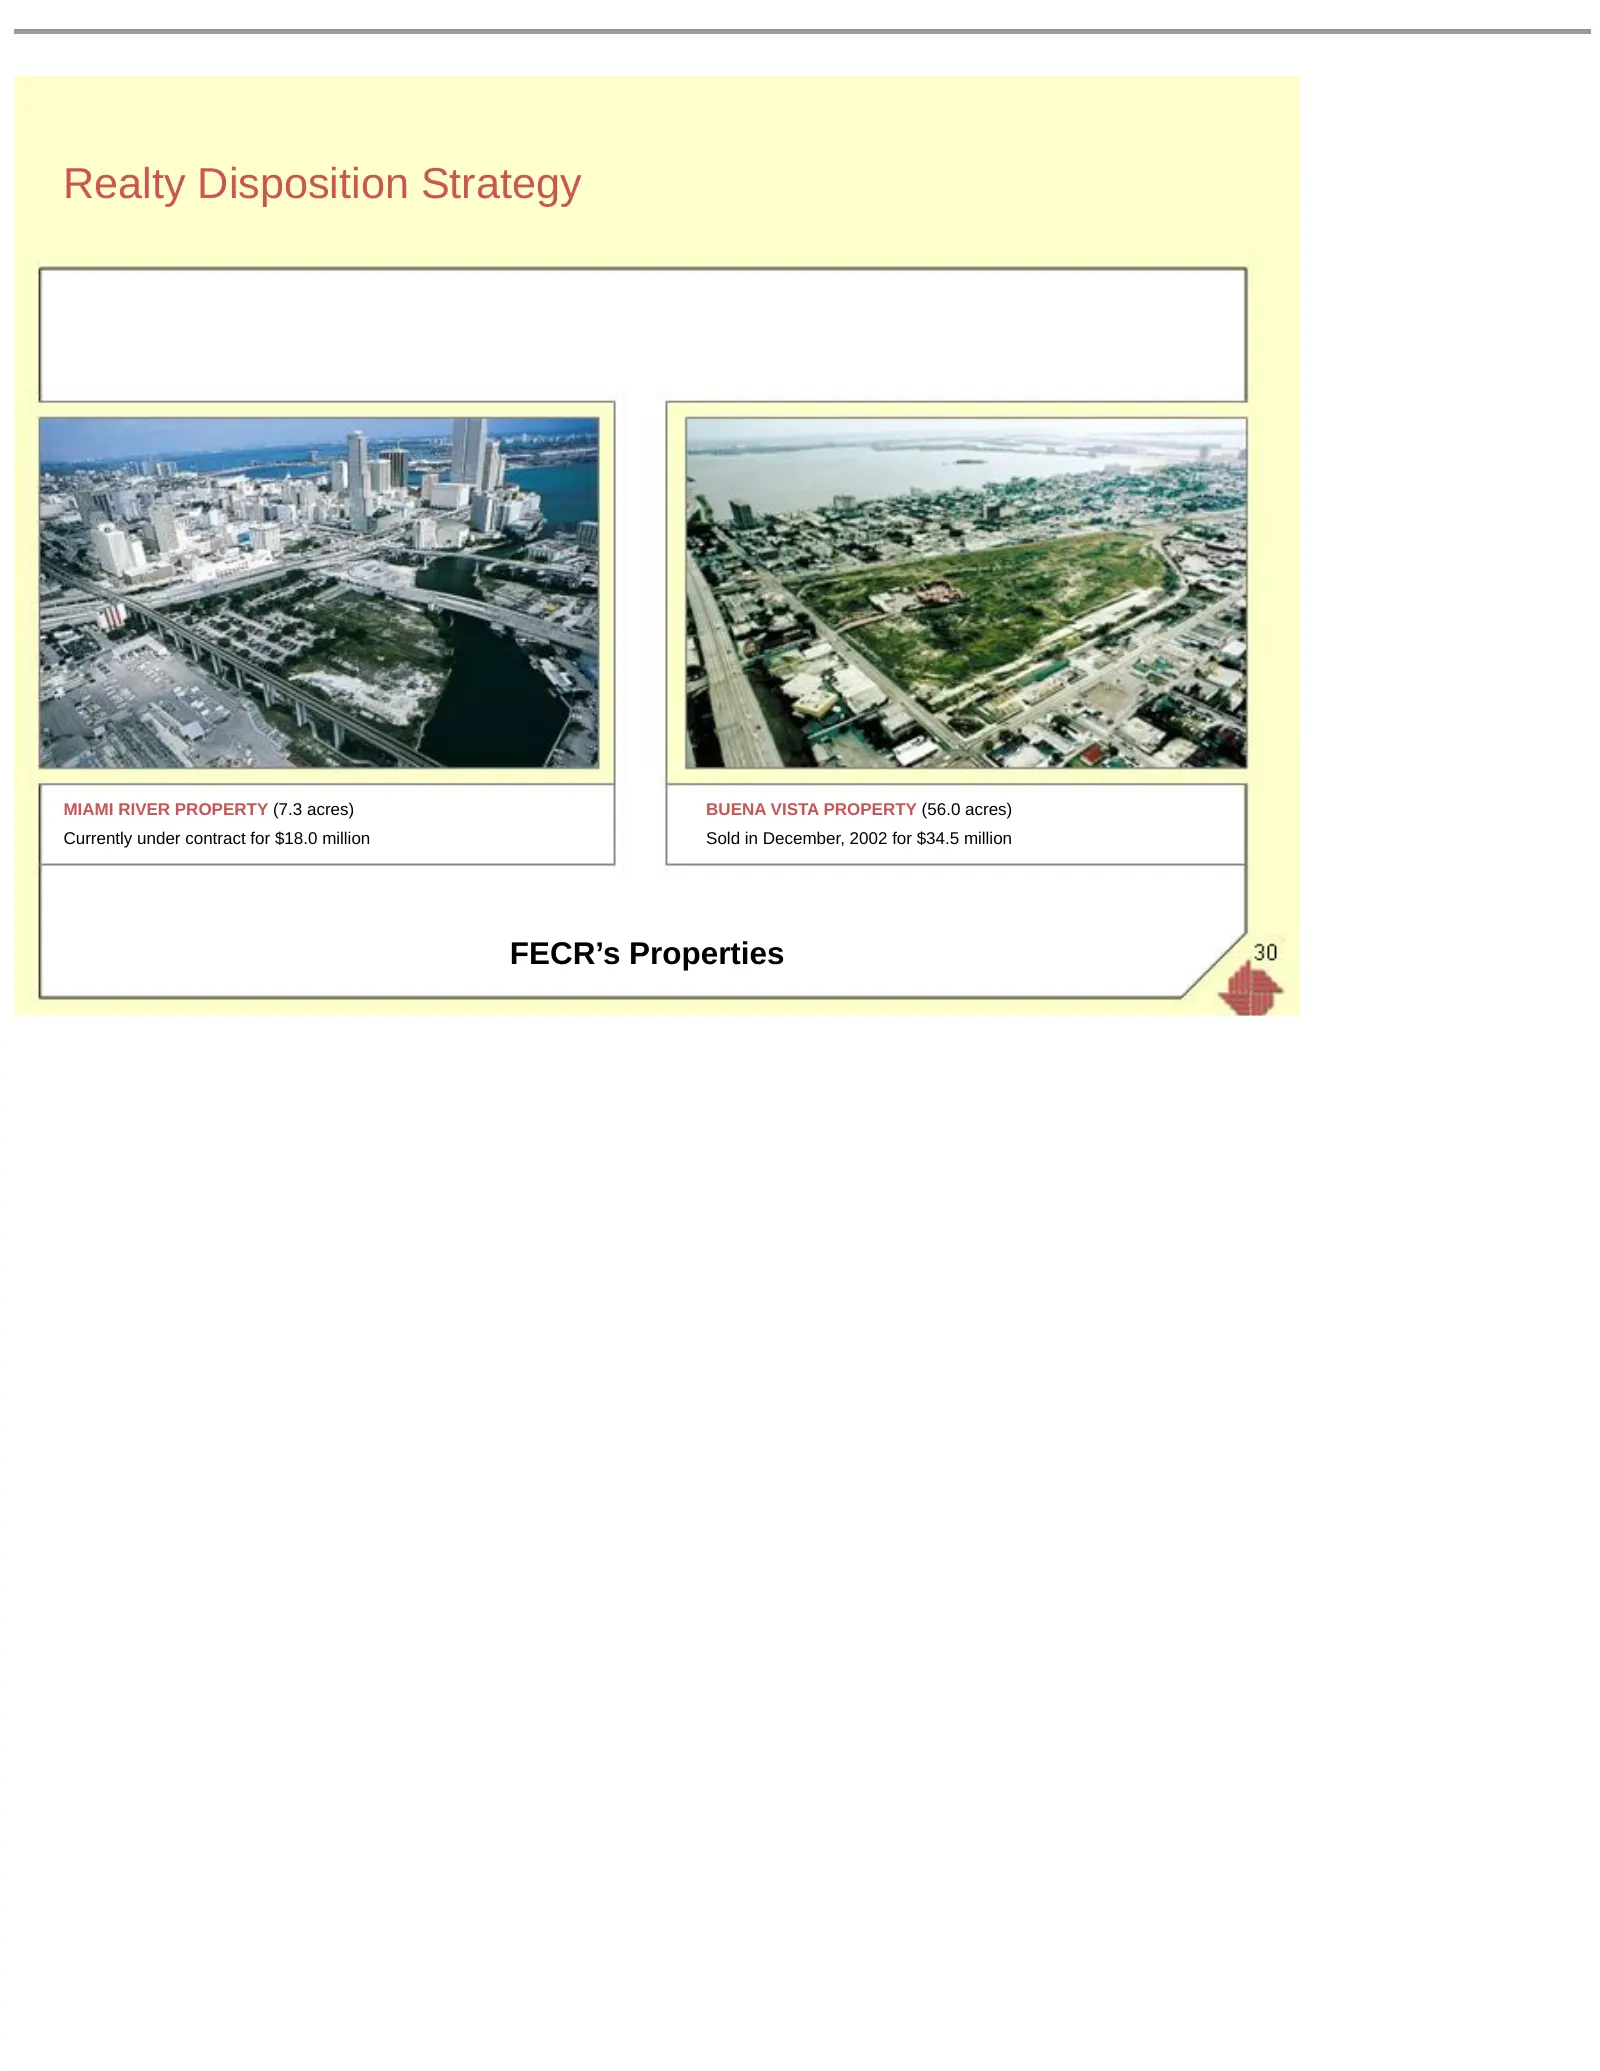
Realty Disposition Strategy MIAMI RIVER PROPERTY (7.3 acres) BUENA VISTA PROPERTY (56.0 acres) Currently under contract for $18.0 million Sold in December, 2002 for $34.5 million FECR’s Properties
Slide 31: Land and Realty Disposition Strategy
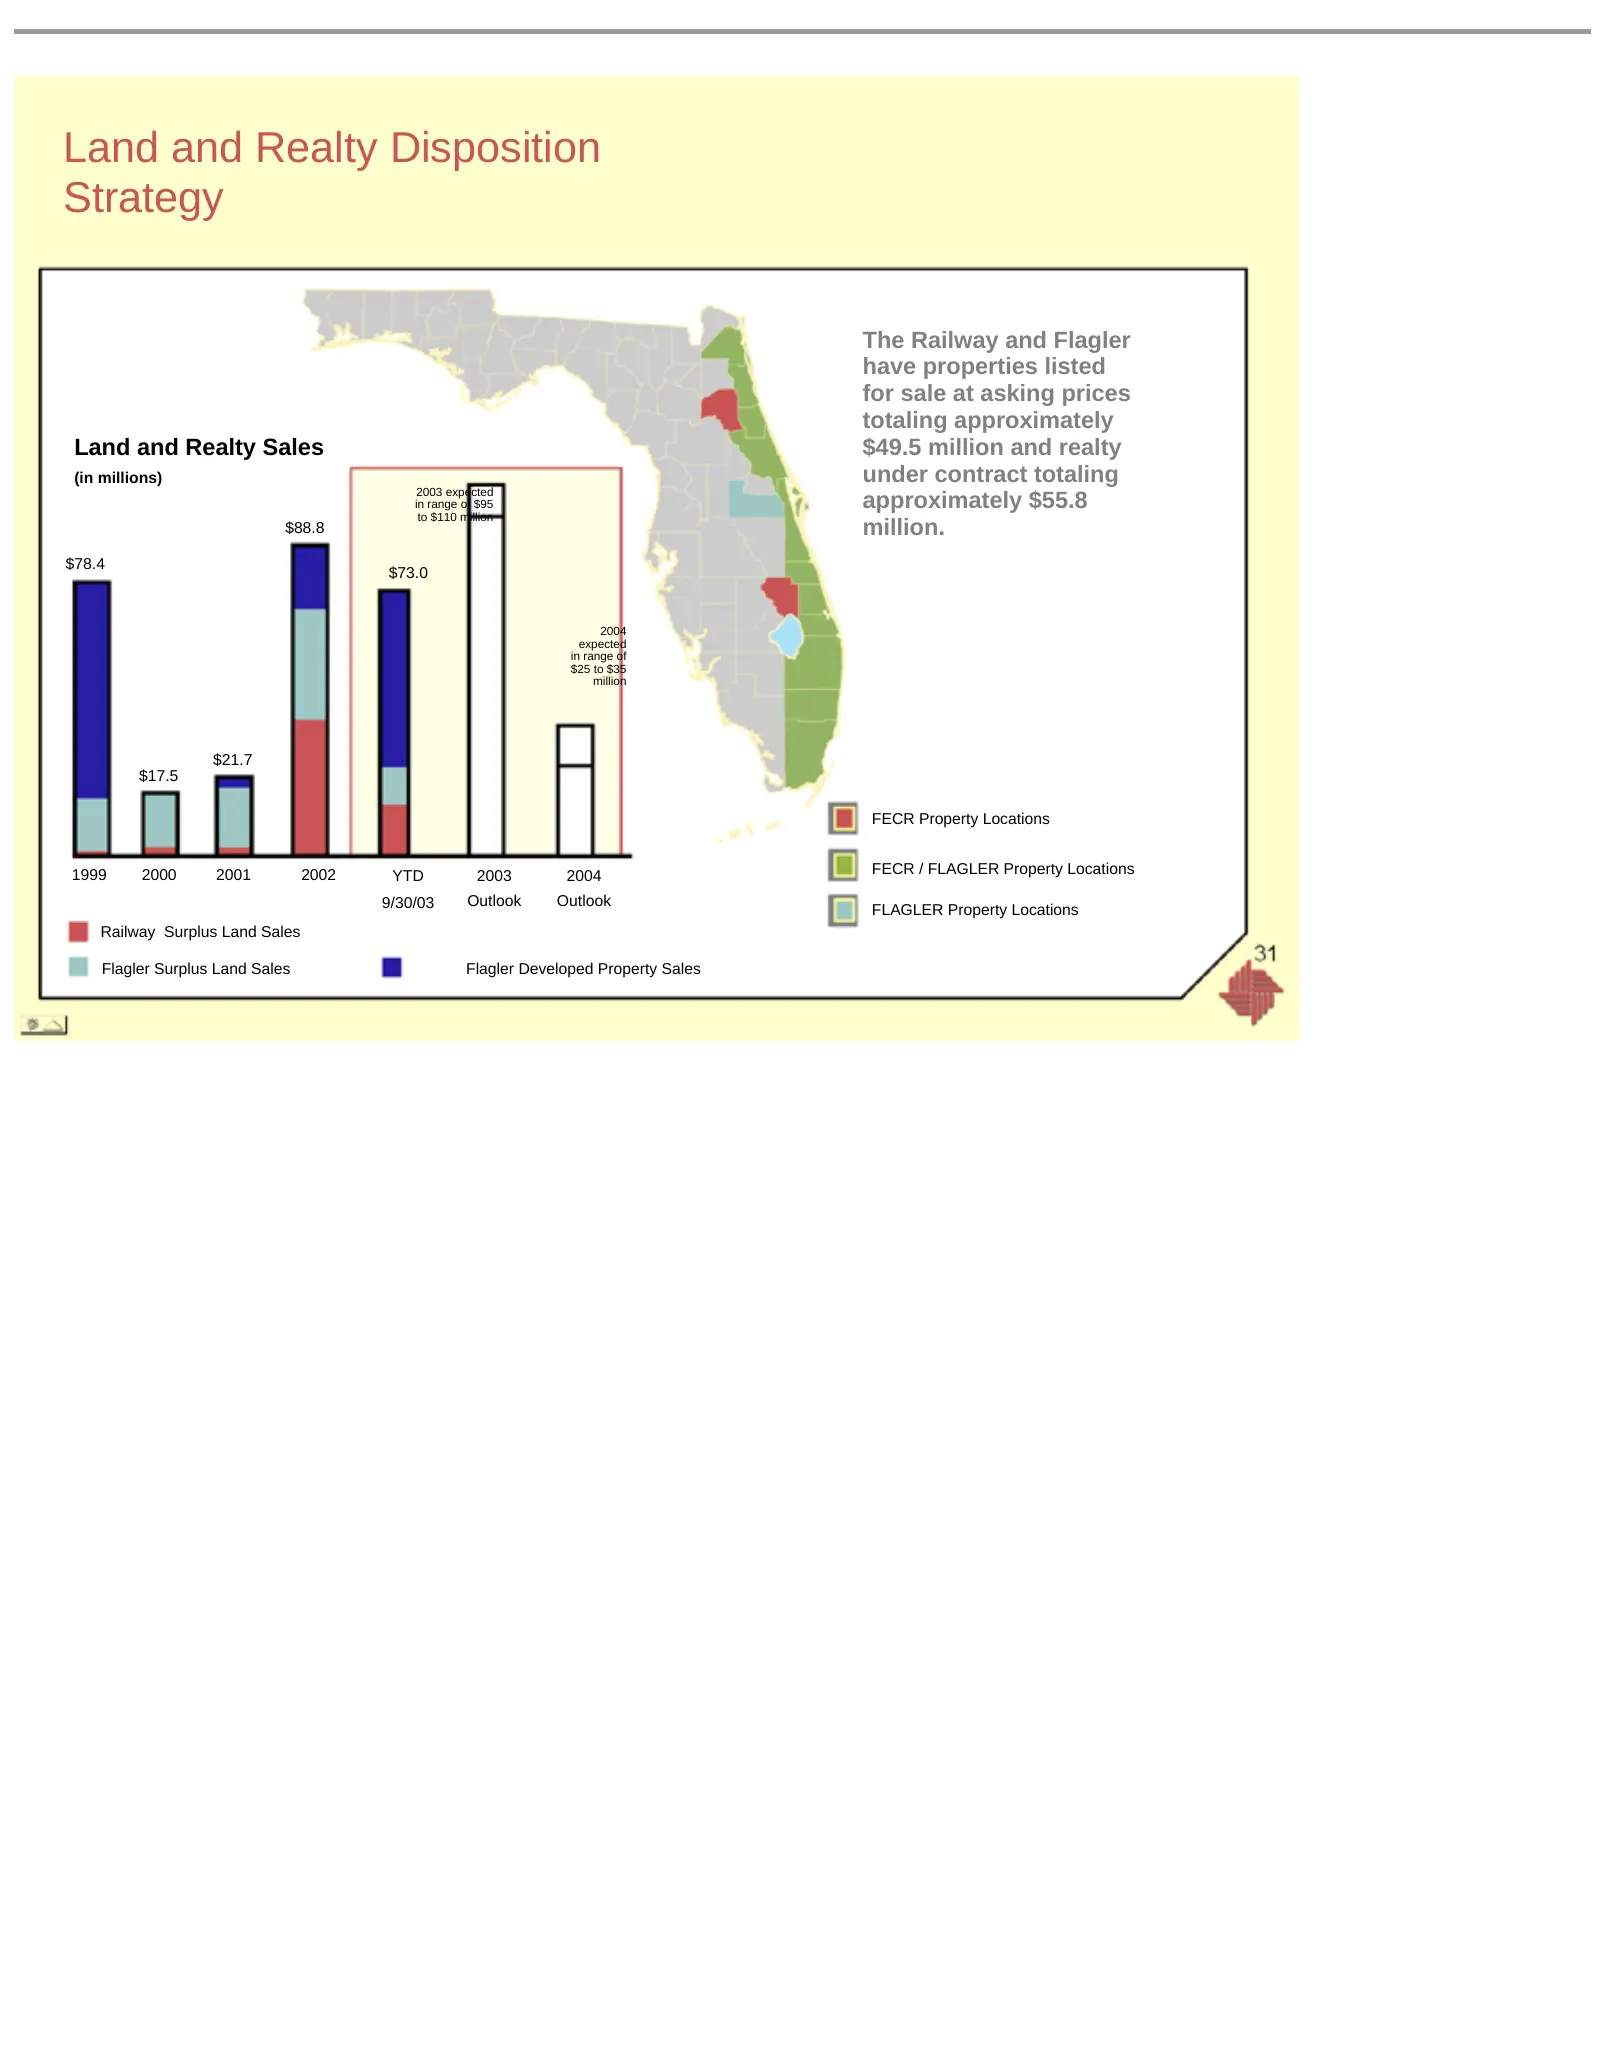
Land and Realty Disposition Strategy The Railway and Flagler have properties listed for sale at asking prices totaling approximately Land and Realty Sales $49.5 million and realty (in millions) under contract totaling 2003 expected in range of $95 approximately $55.8 to $110 million $88.8 million. $
Slide 32: Looking Forward . . ..
Looking Forward . . .. Outlook for Flagler 2003 Rental and Services revenues are expected to range between $64 and $66 million Rental Properties’ Operating Profit before Depreciation and Amortization* is expected to range between $40 and $42 million Capital Expenditures are expected to range between
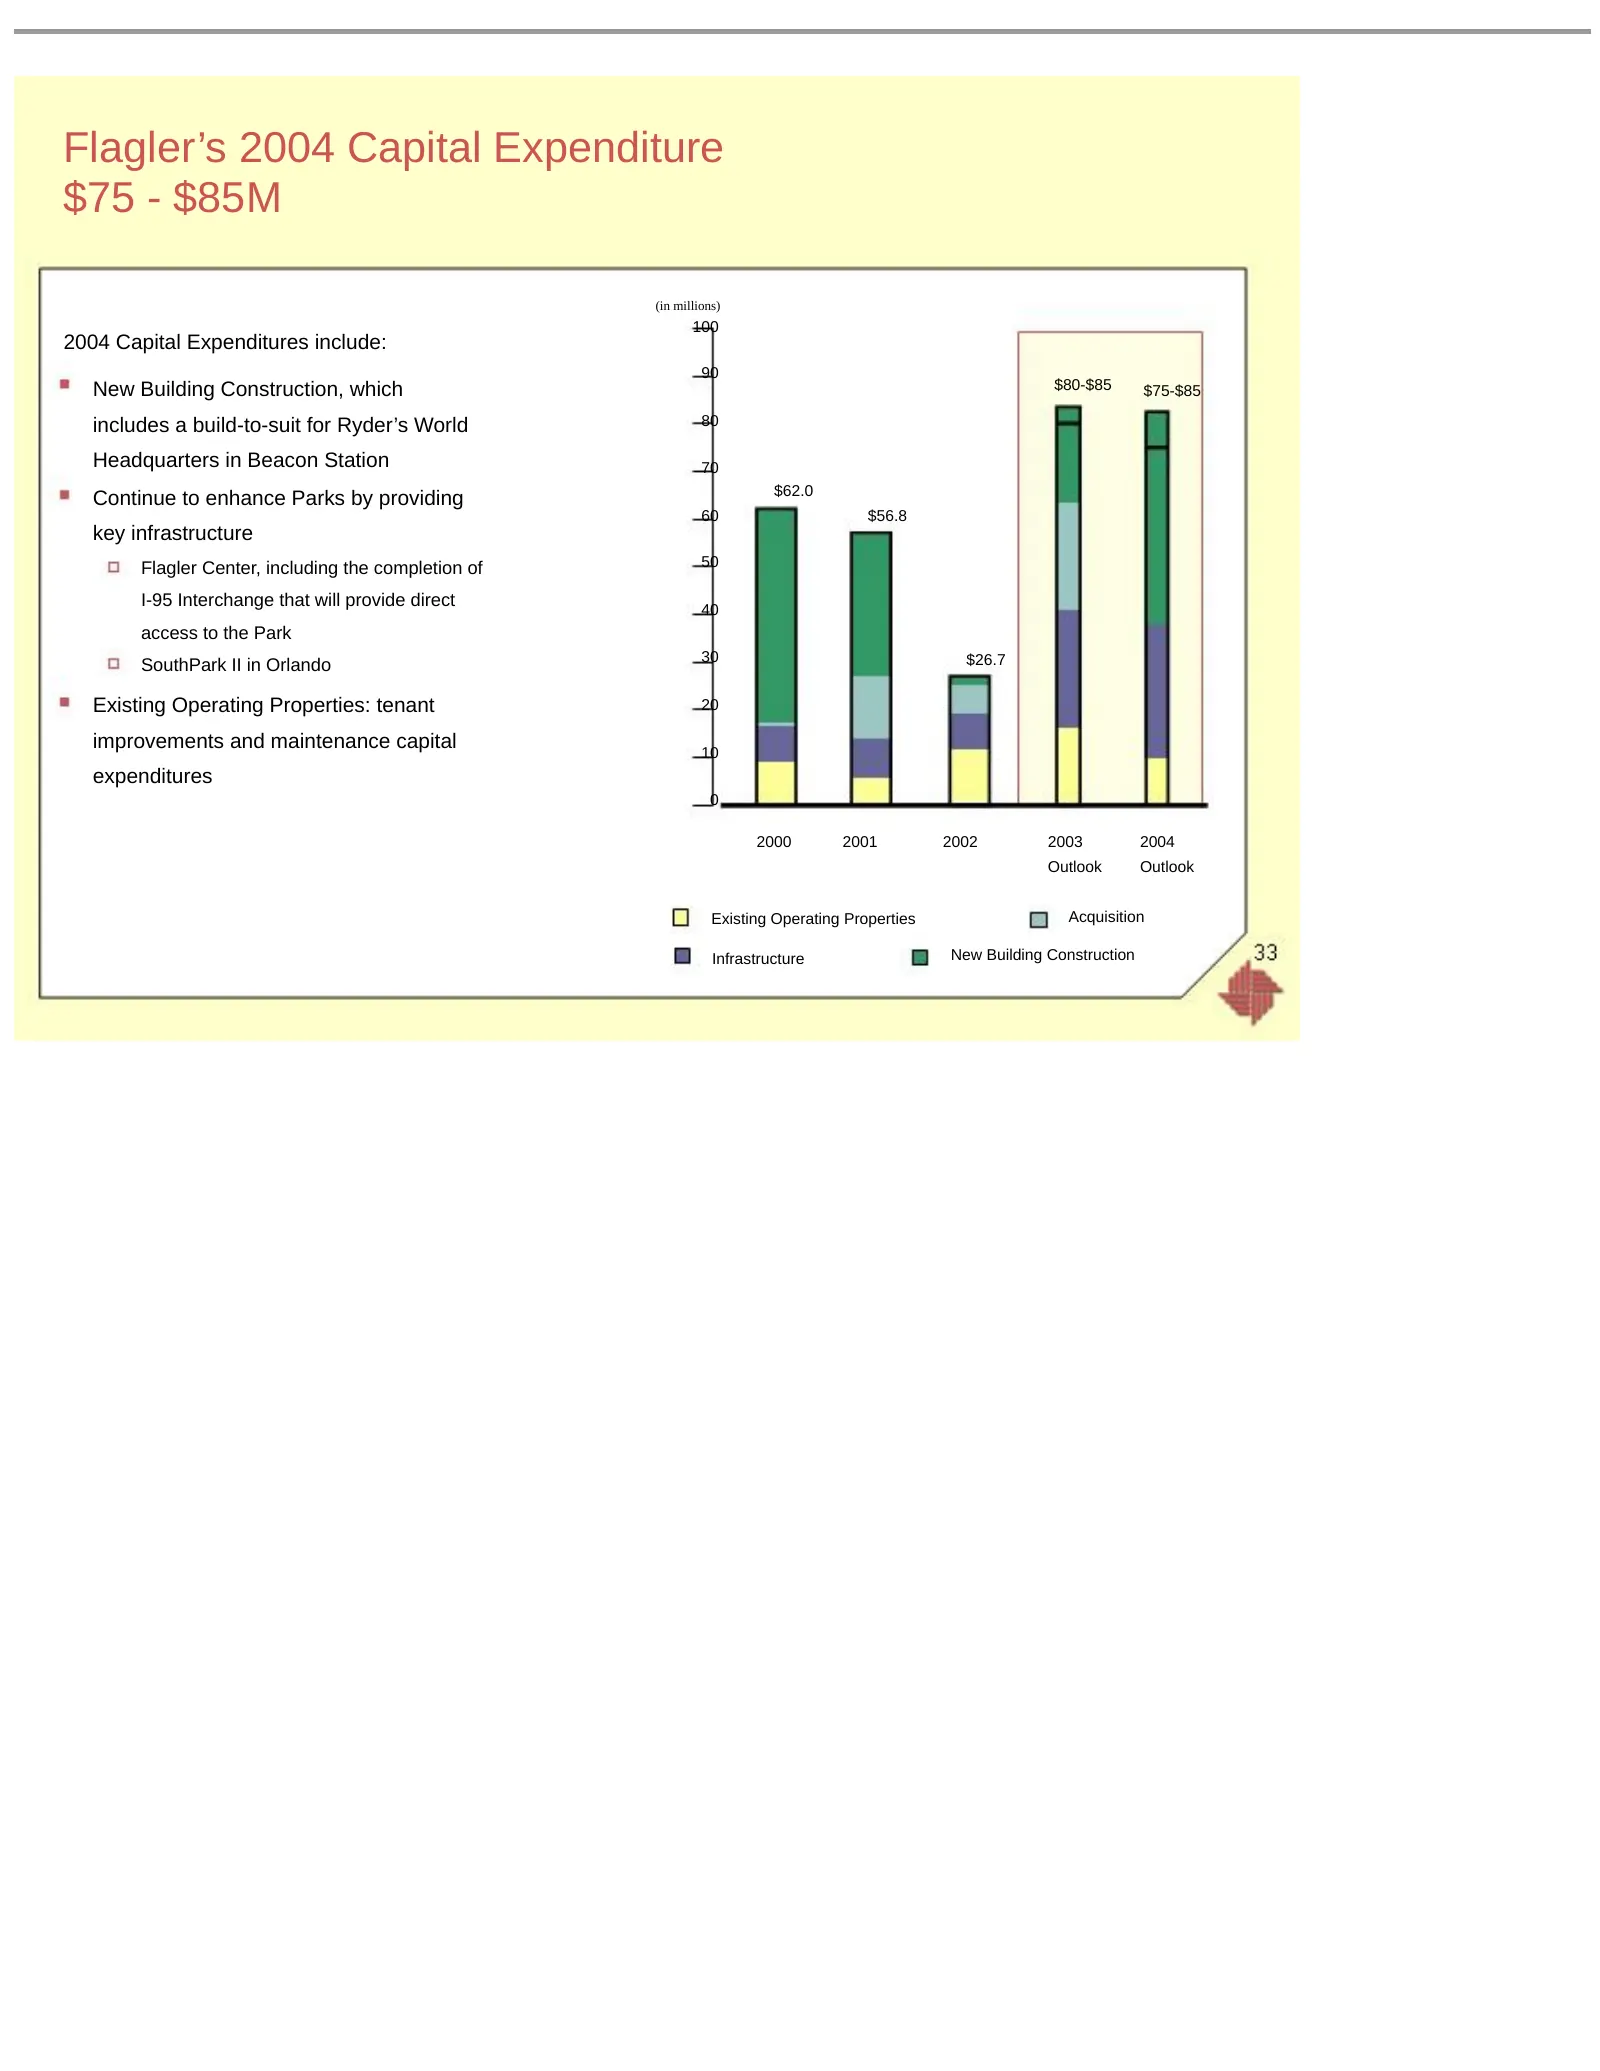
Slide 33: Flagler's 2004 Capital Expenditure $75 - $85M
Flagler’s 2004 Capital Expenditure $75 - $85M (in millions) 100 2004 Capital Expenditures include: 90 New Building Construction, which $80-$85 $75-$85 includes a build-to-suit for Ryder’s World 80 Headquarters in Beacon Station 70 $62.0 Continue to enhance Parks by providing 60 $56.8 key infrastruct
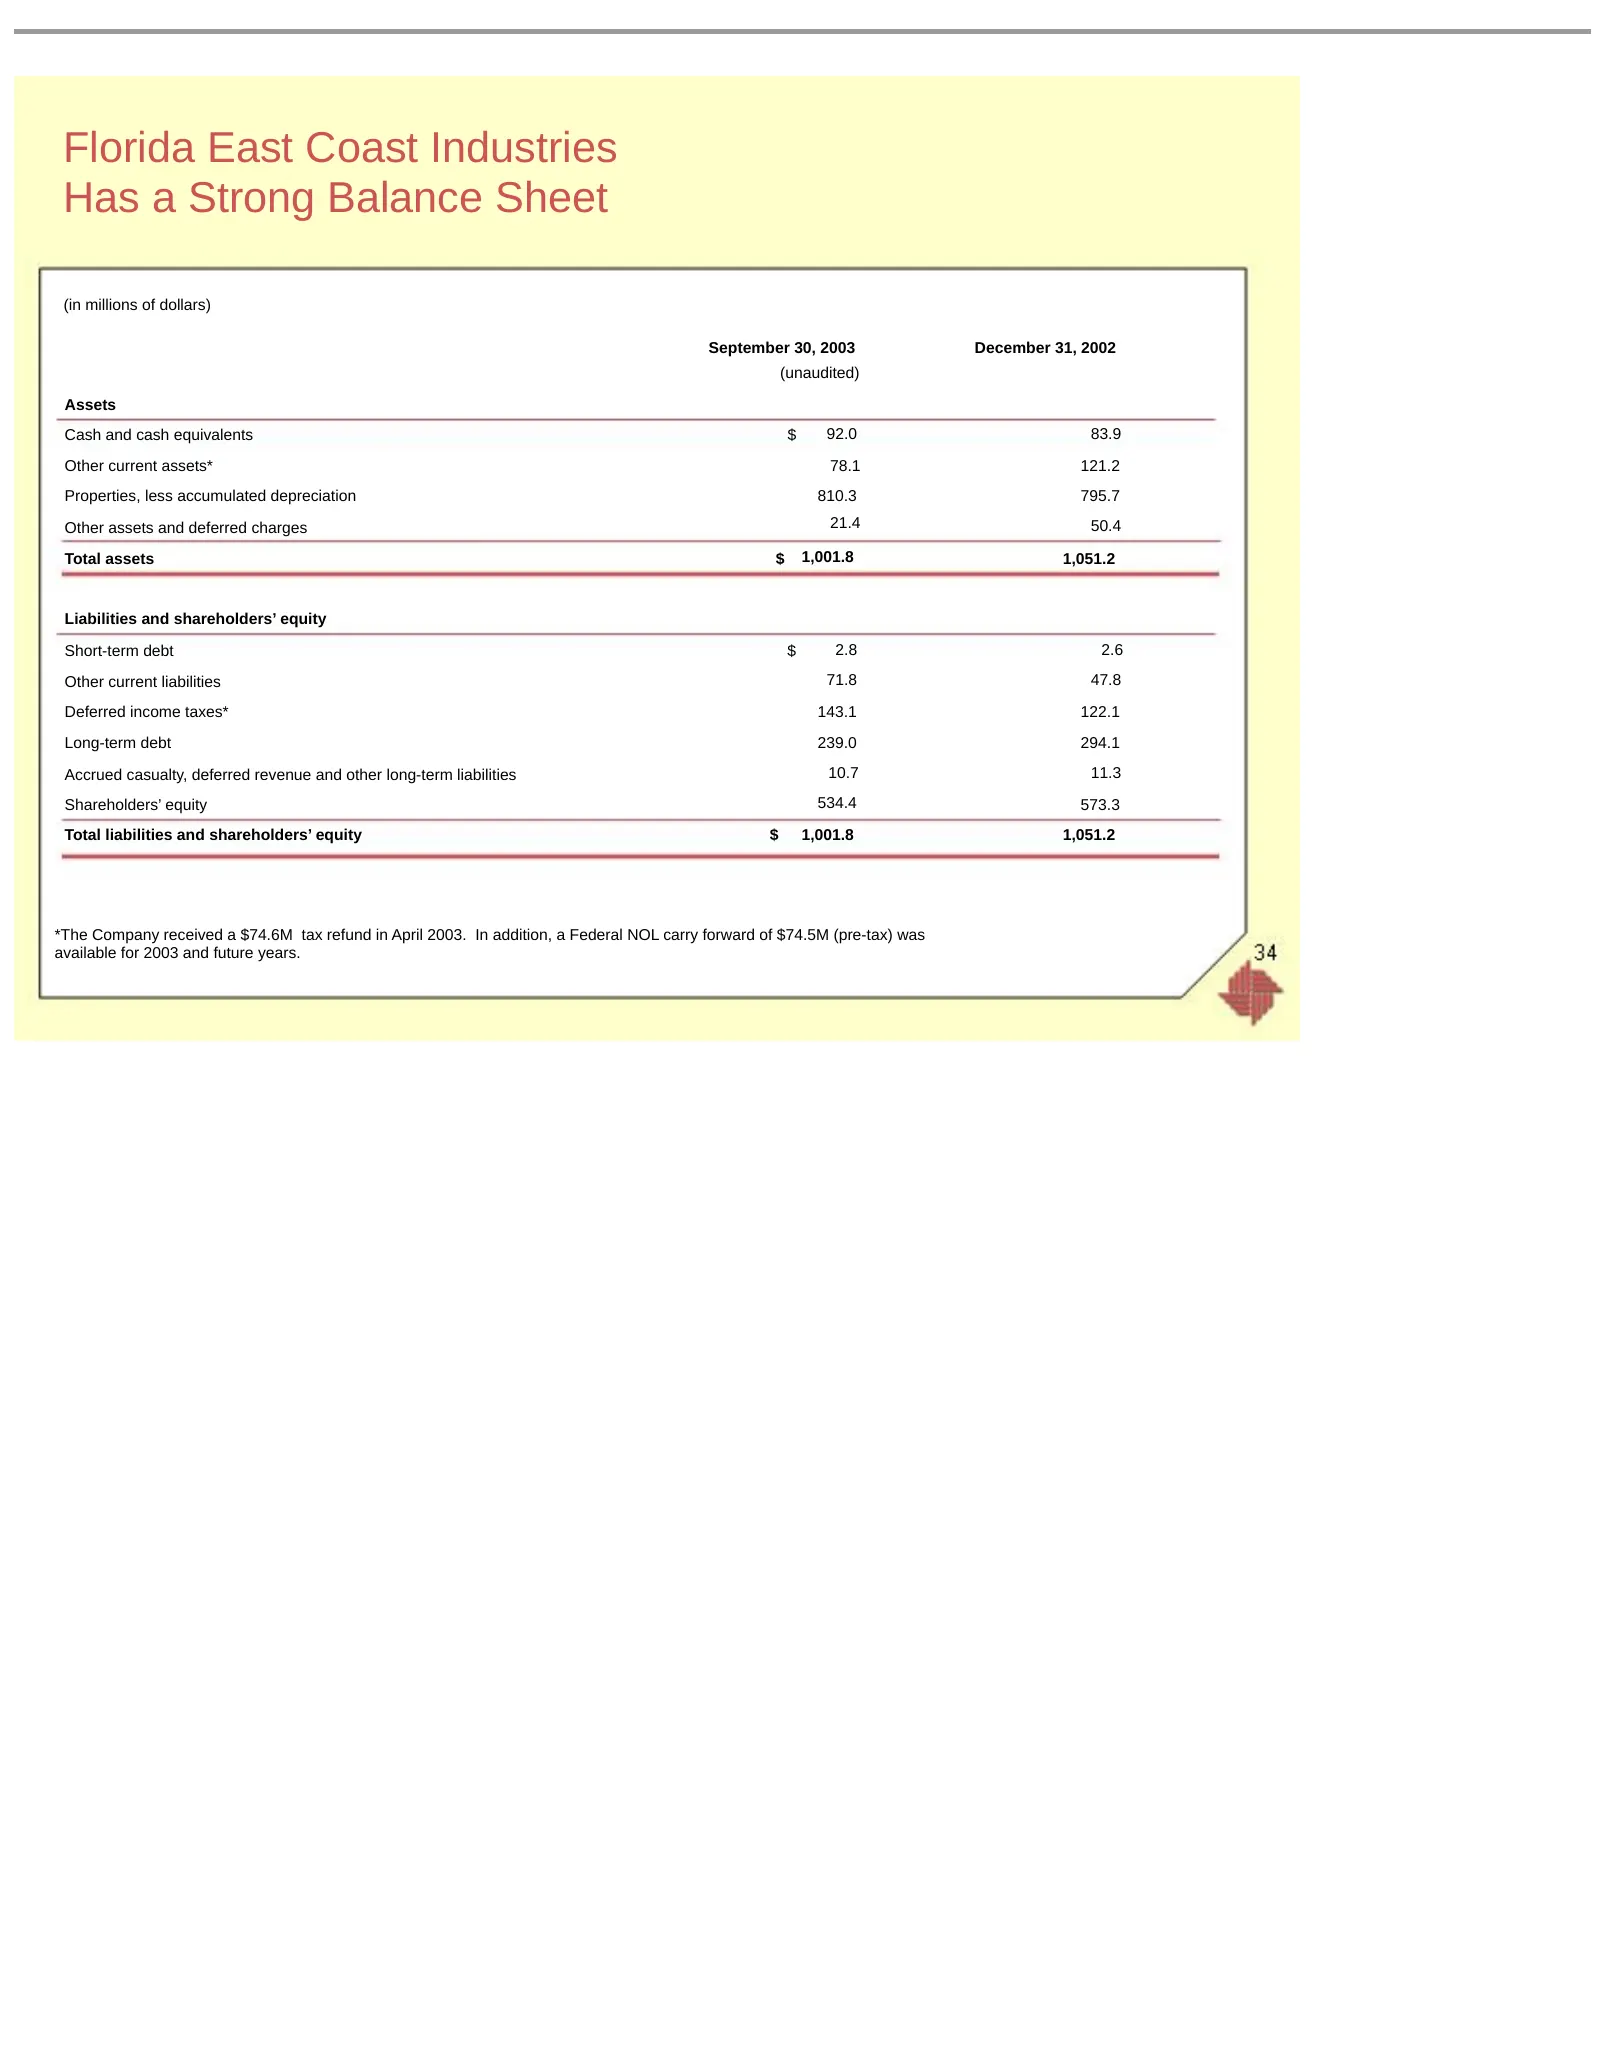
Slide 34: Florida East Coast Industries Has a Strong Balance Sheet
Florida East Coast Industries Has a Strong Balance Sheet (in millions of dollars) September 30, 2003 December 31, 2002 (unaudited) Assets Cash and cash equivalents $ 92.0 83.9 Other current assets* 78.1 121.2 Properties, less accumulated depreciation 810.3 795.7 Other assets and deferred charges 21.
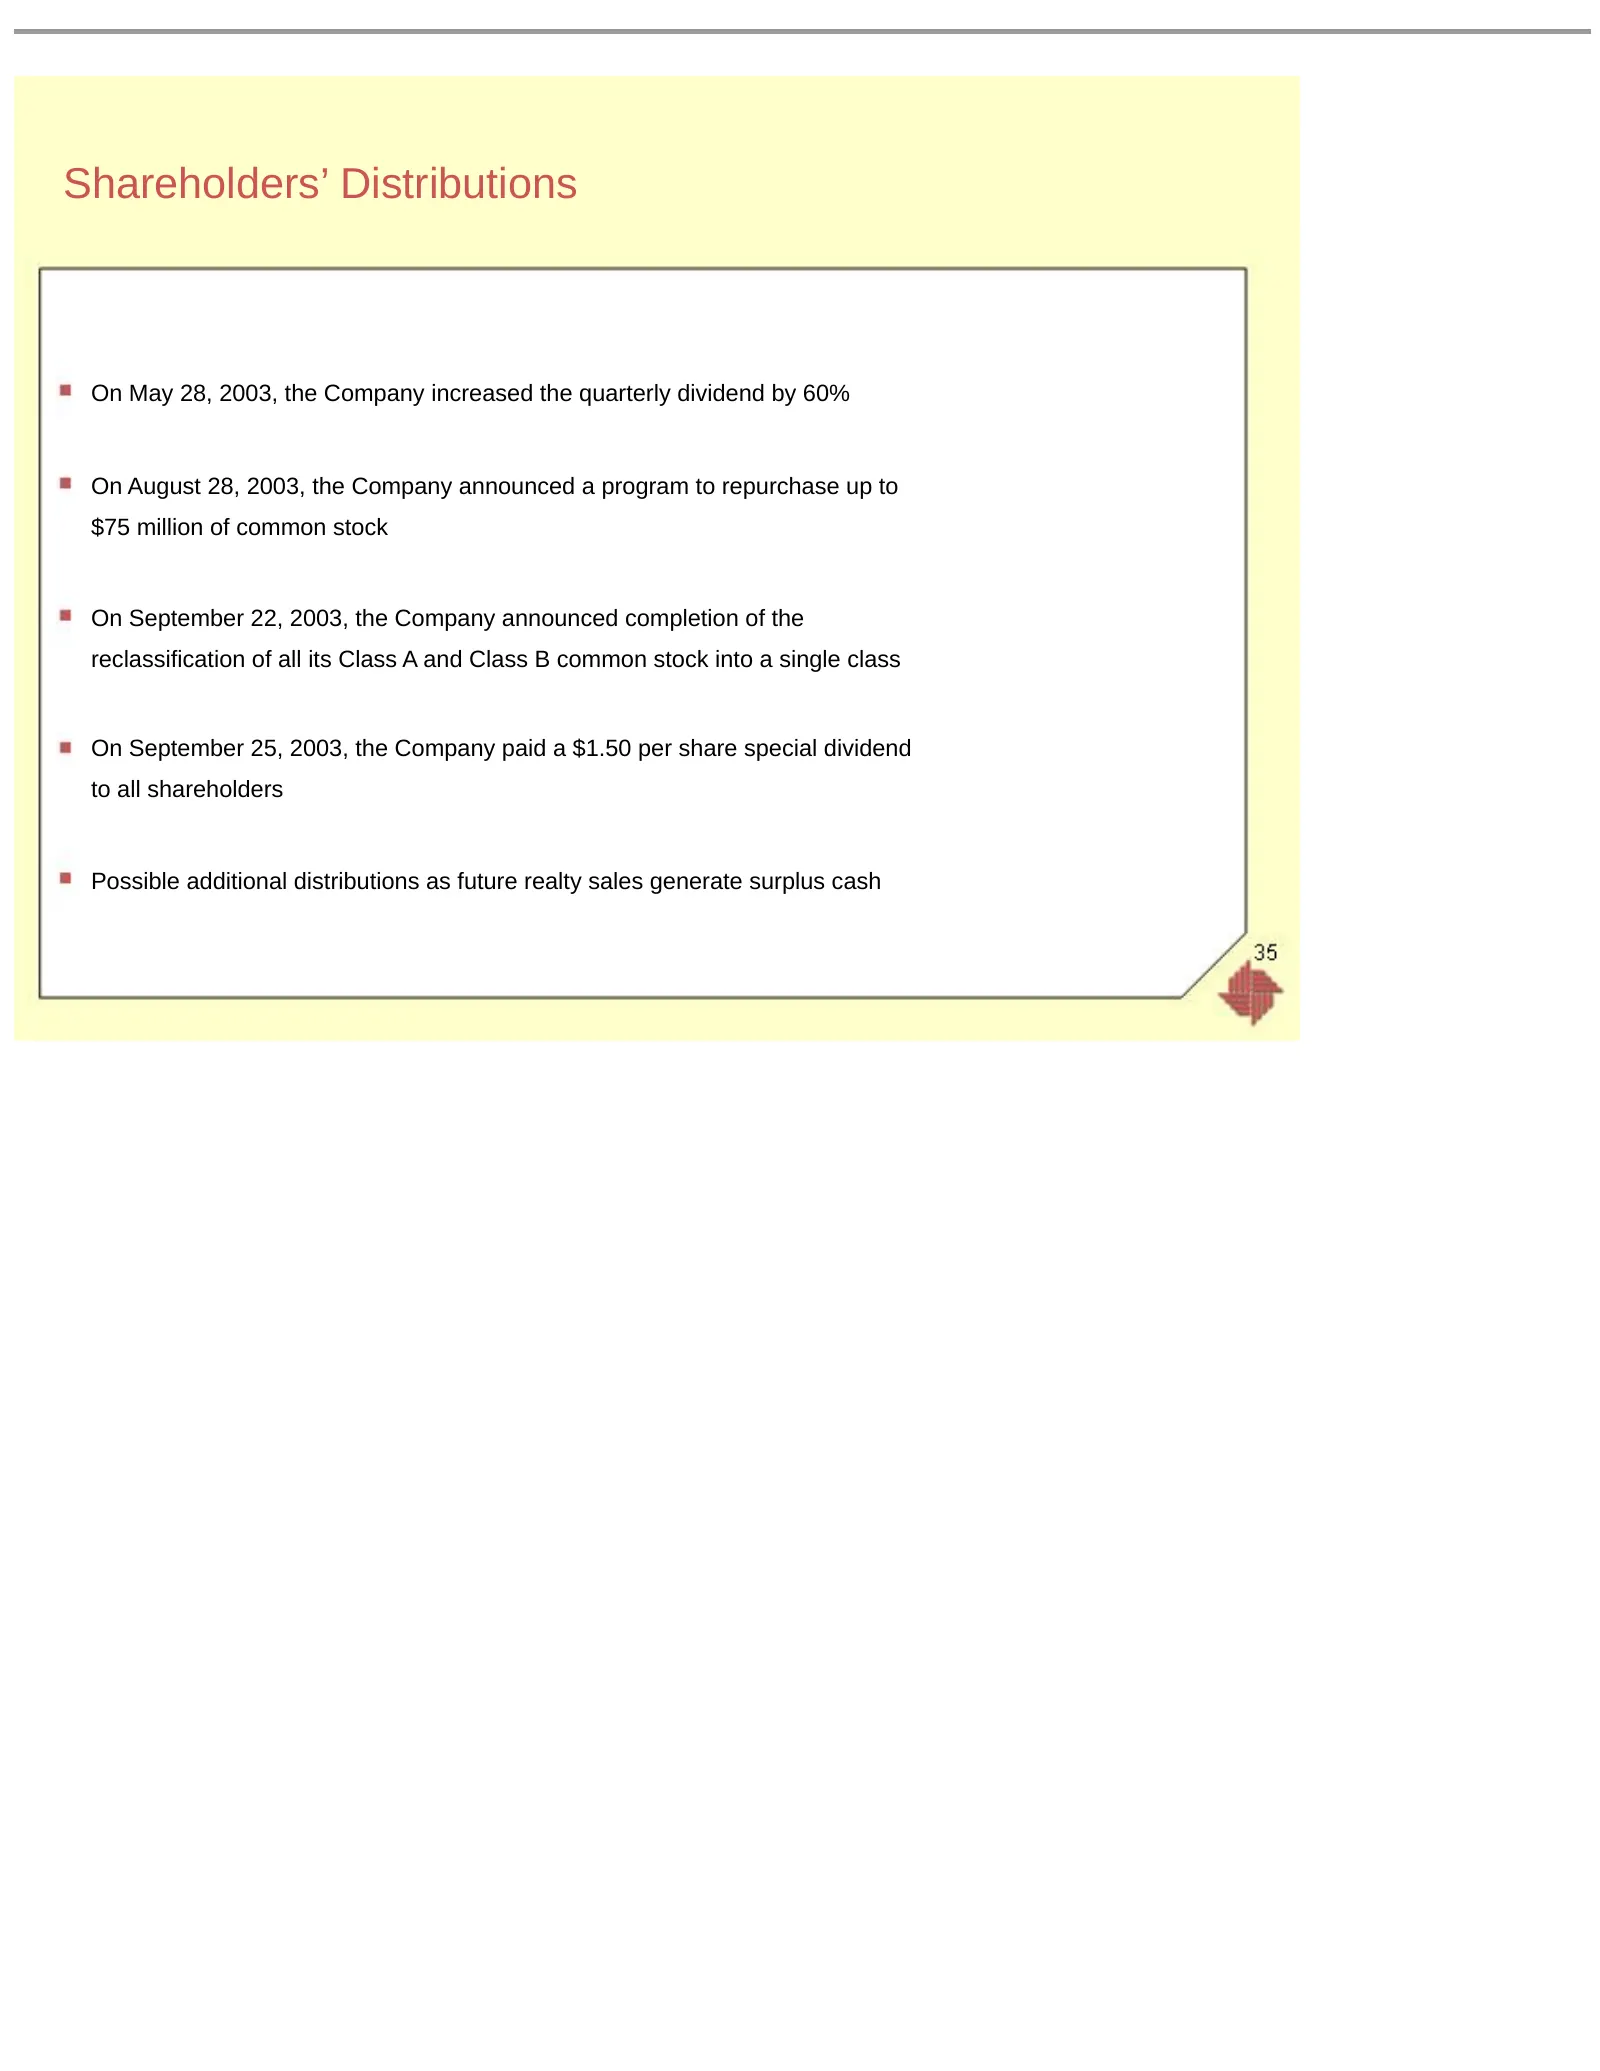
Slide 35: Shareholders' Distributions
Shareholders’ Distributions On May 28, 2003, the Company increased the quarterly dividend by 60% On August 28, 2003, the Company announced a program to repurchase up to $75 million of common stock On September 22, 2003, the Company announced completion of the reclassification of all its Class A and
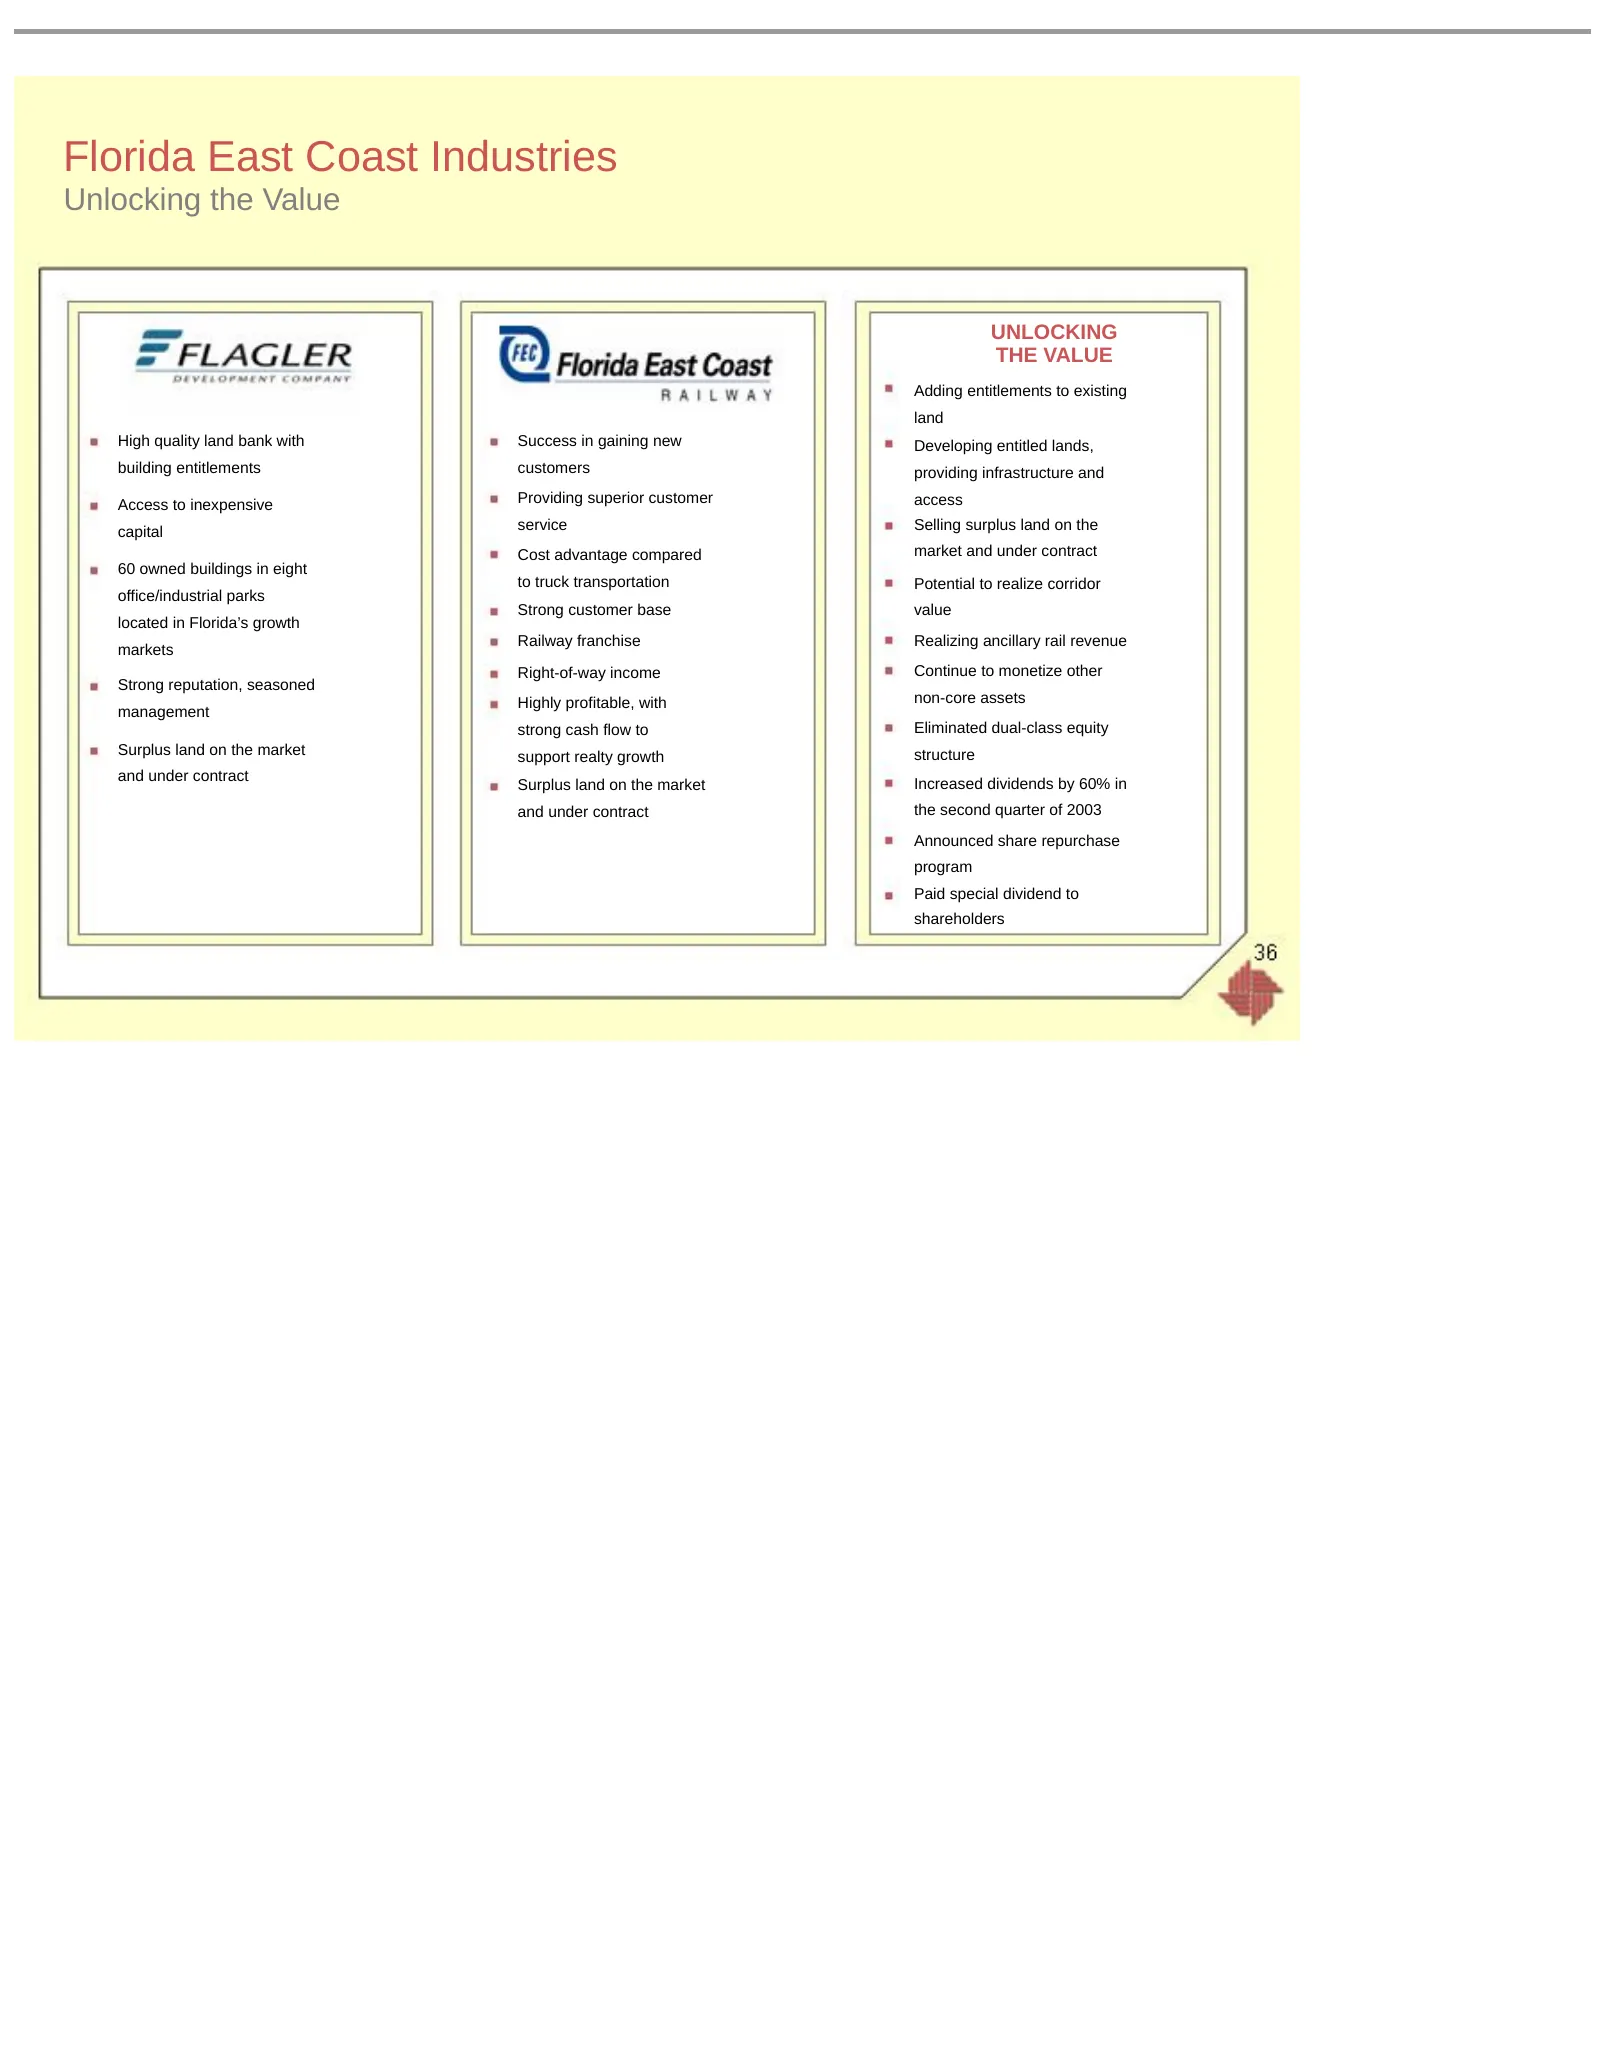
Slide 36: Unlocking the Value
Florida East Coast Industries Unlocking the Value UNLOCKING THE VALUE Adding entitlements to existing land High quality land bank with Success in gaining new Developing entitled lands, building entitlements customers providing infrastructure and Access to inexpensive Providing superior customer acce
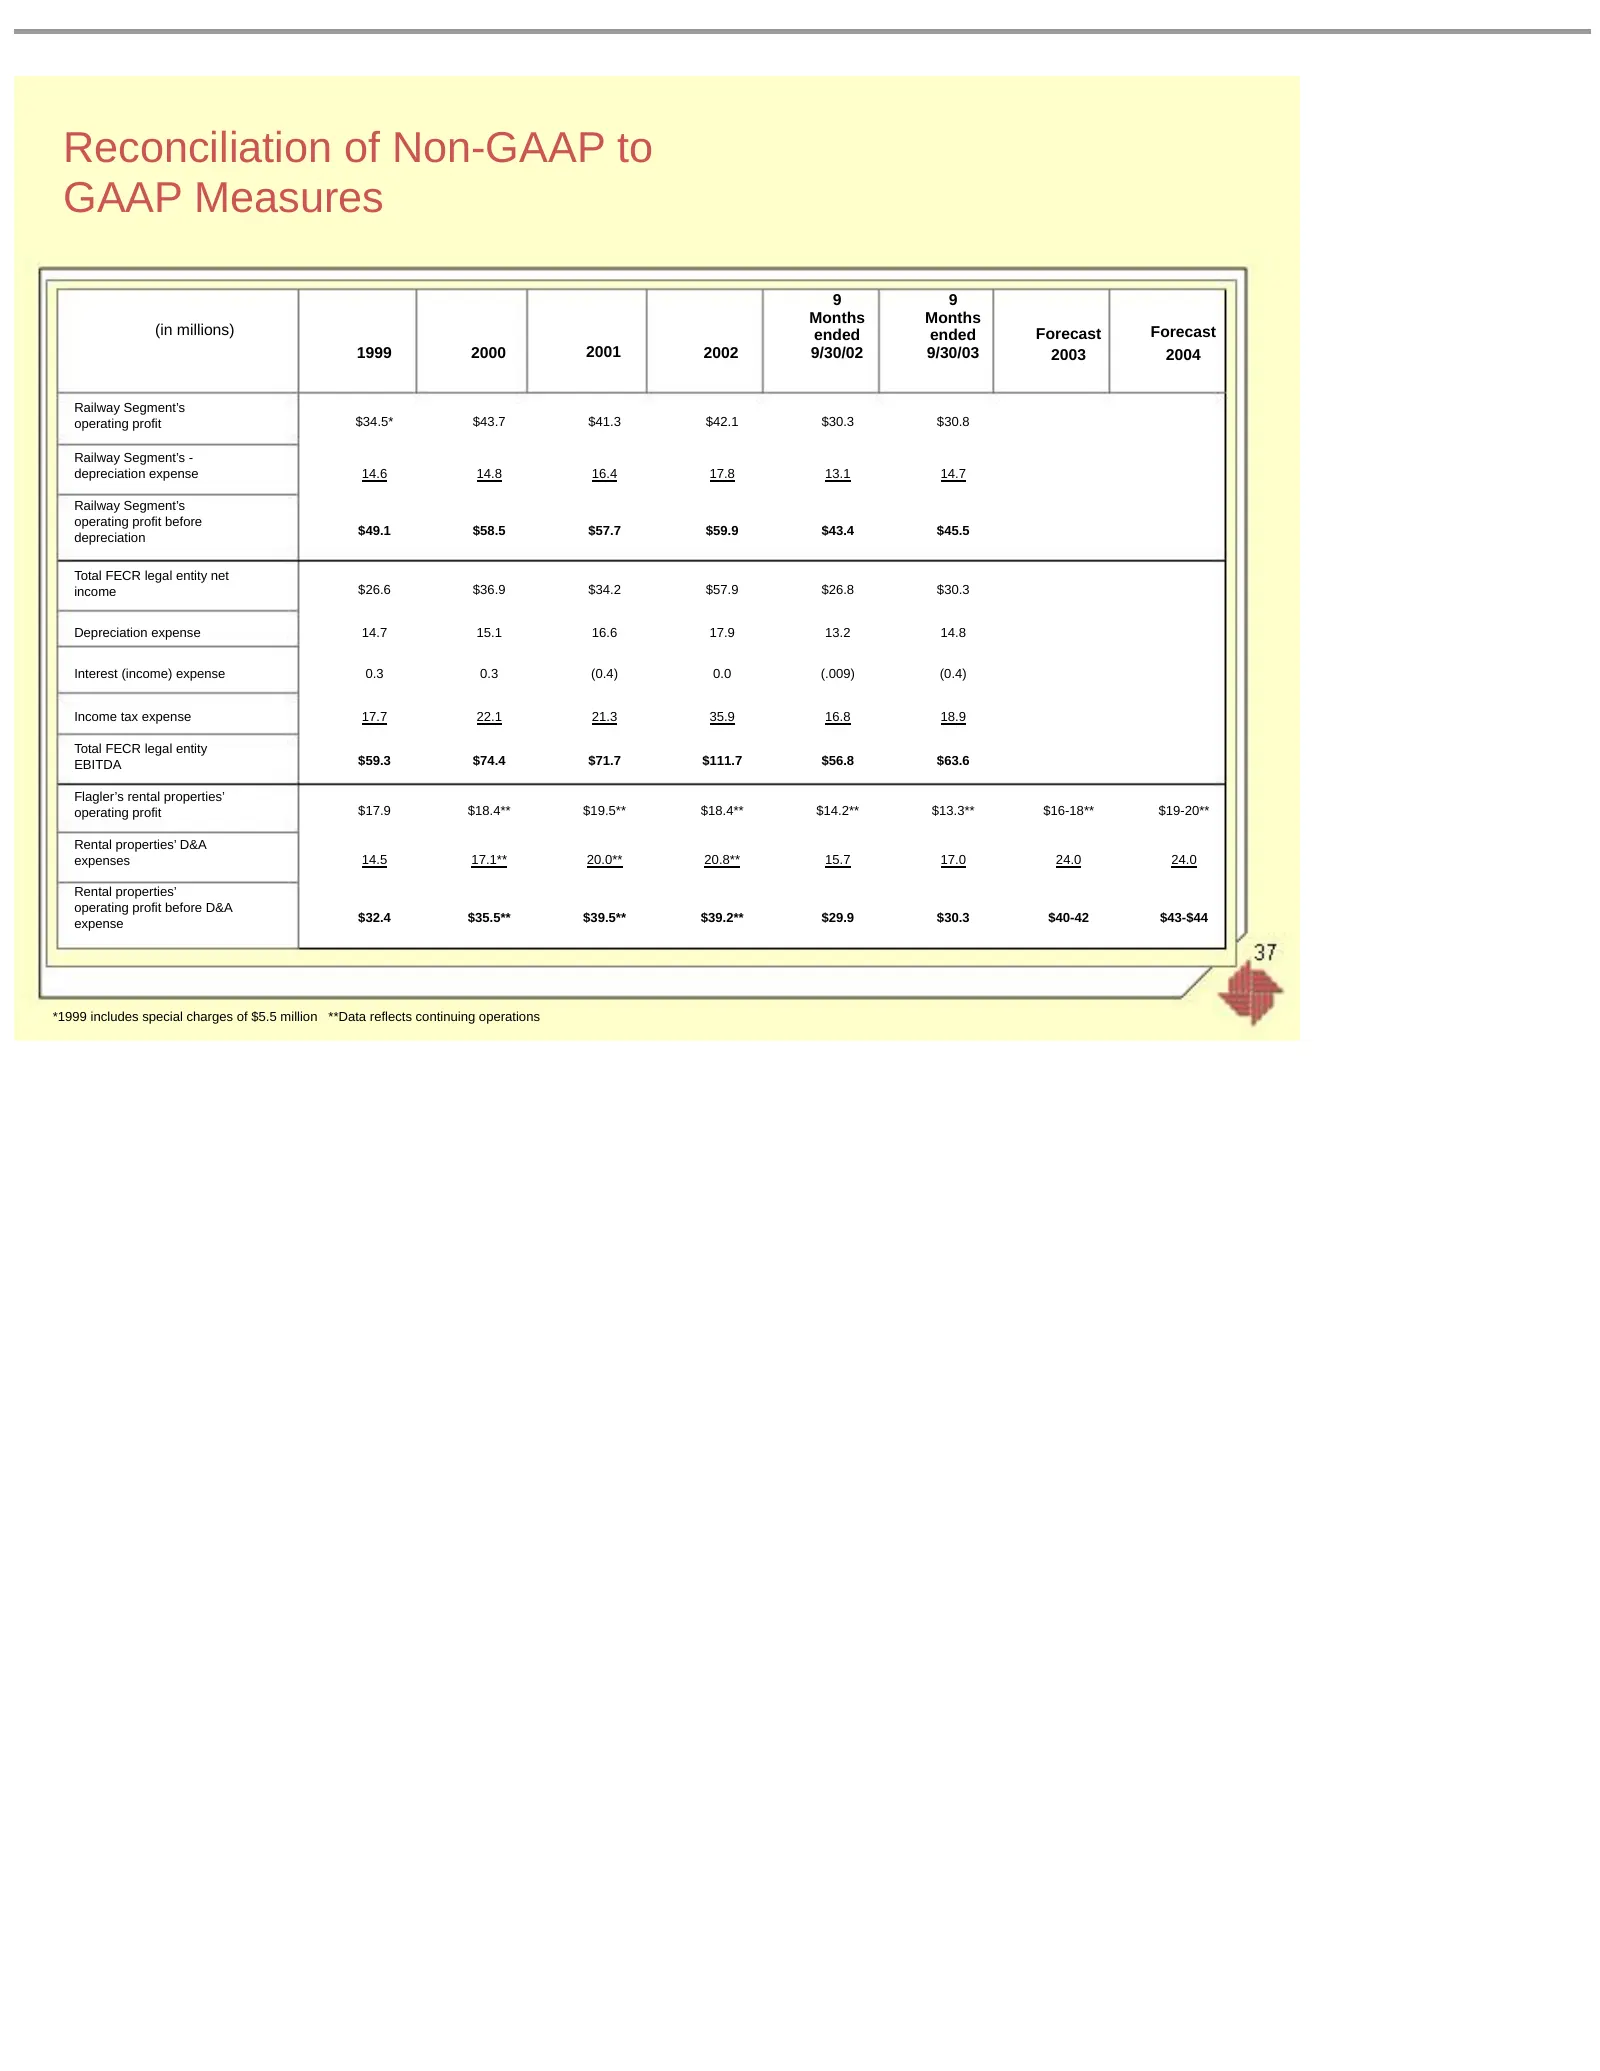
Slide 37: Reconciliation of Non-GAAP to GAAP Measures
Reconciliation of Non-GAAP to GAAP Measures 9 9 Months Months (in millions) ended ended Forecast Forecast 1999 2000 2001 2002 9/30/02 9/30/03 2003 2004 Railway Segment’s operating profit $34.5* $43.7 $41.3 $42.1 $30.3 $30.8 Railway Segment’s - depreciation expense 14.6 14.8 16.4 17.8 13.1 14.7 Railw
Source: SEC EDGAR · 8-K filed Nov 13, 2003
More decks from Florida East Coast Industries Inc
 Merger or Acquisition (May 2007)15 slides · May 31, 2007
 Q1 2007 Earnings Presentation26 slides · May 9, 2007
 Q4 2006 Earnings Presentation39 slides · Feb 15, 2007
 Q3 2006 Earnings Presentation36 slides · Nov 2, 2006
 Ryan Beck Investor Event (September 2006)80 slides · Sep 13, 2006
 Morgan Keegan 2006 Equity Conference30 slides · Sep 7, 2006