El Paso — Bear Stearns 15th Annual Global Credit Conference (May 2006)
25 slides from El Paso's conference presentation, May 16, 2006
Slide 1: Bear Stearns 15th Annual Global Credit Conference
Mark Leland Executive Vice President & Chief Financial Officer Bear Stearns 15th Annual Global Credit Conference May 16, 2006
Slide 2: Cautionary Statement Regarding Forward-looking Statements
Cautionary Statement Regarding Forward-looking Statements This presentation includes forward-looking statements and projections, made in reliance on the safe harbor provisions of the Private Securities Litigation Reform Act of 1995. The company has made every reasonable effort to ensure that the inf
Slide 3: Our Purpose
Our Purpose El Paso Corporation provides natural gas and related energy products in a safe, efficient, and dependable manner
Slide 4: Delivering on Our 2006 Plan
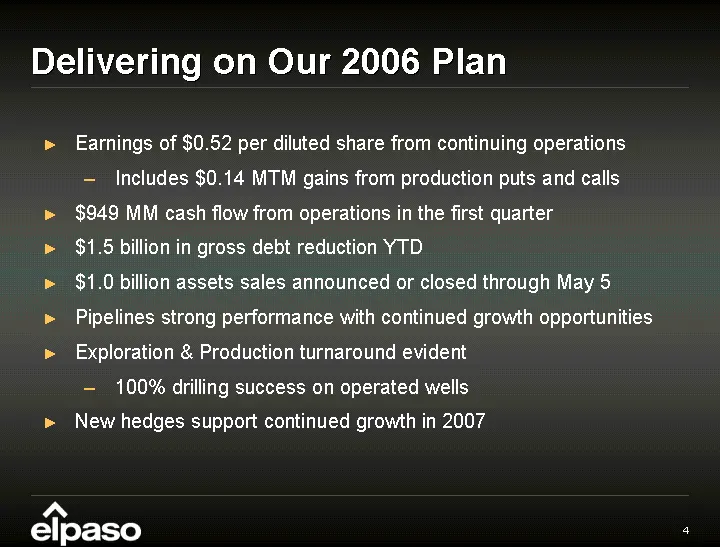
Delivering on Our 2006 Plan Earnings of $0.52 per diluted share from continuing operations Includes $0.14 MTM gains from production puts and calls $949 MM cash flow from operations in the first quarter $1.5 billion in gross debt reduction YTD $1.0 billion assets sales announced or closed through May
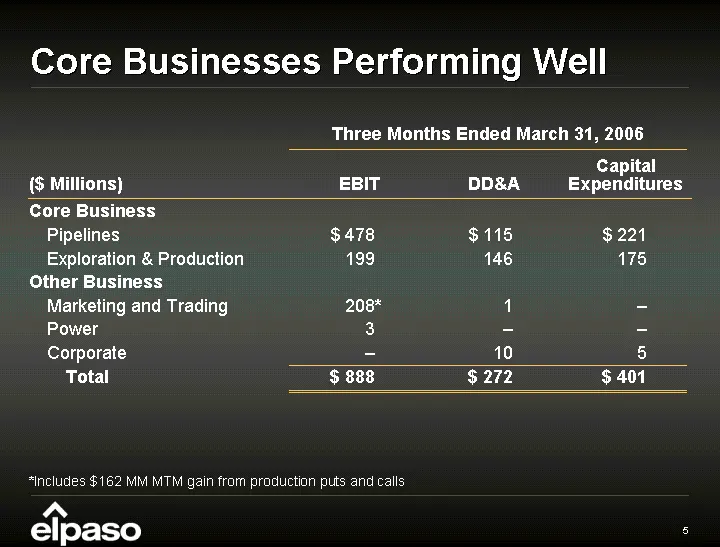
Slide 5: Core Businesses Performing Well
Core Businesses Performing Well Core Business Pipelines Exploration & Production Other Business Marketing and Trading Power Corporate Total Three Months Ended March 31, 2006 $ 478 199 208 * 3 - $ 888 Capital Expenditures EBIT DD&A *Includes $162 MM MTM gain from production puts and calls ($ Millions
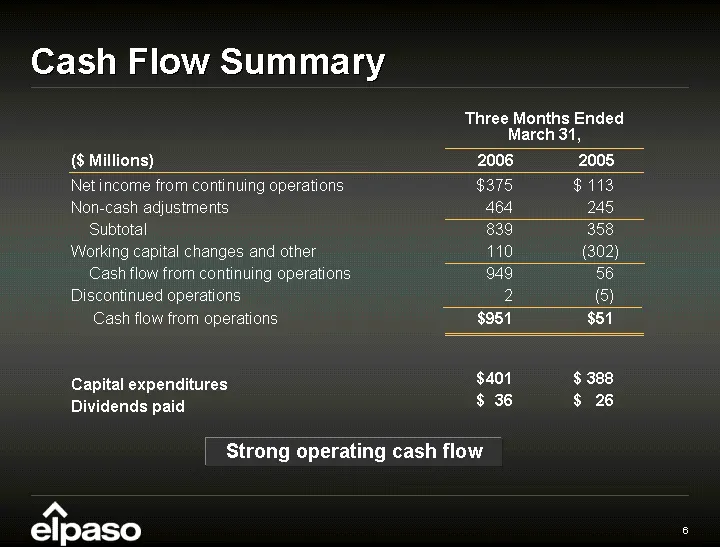
Slide 6: Cash Flow Summary
Cash Flow Summary $ 375 464 839 110 949 2 $951 $ 401 $ 36 Net income from continuing operations Non-cash adjustments Subtotal Working capital changes and other Cash flow from continuing operations Discontinued operations Cash flow from operations Capital expenditures Dividends paid $ 113 245 358 (30
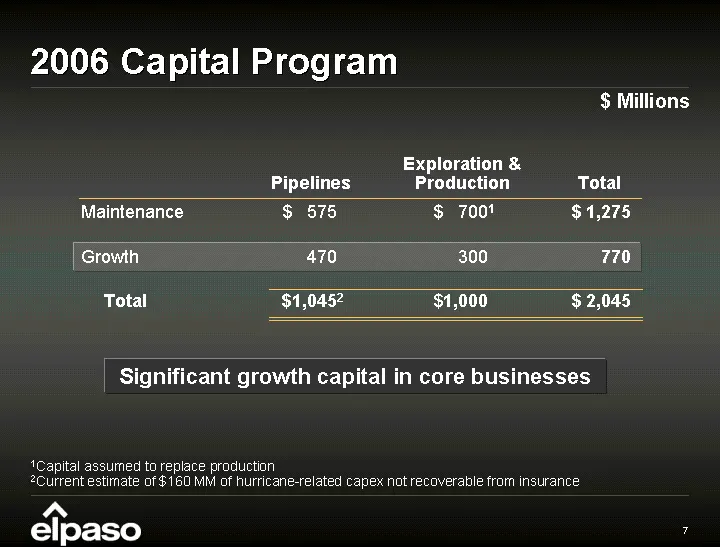
Slide 7: 2006 Capital Program
2006 Capital Program Maintenance Growth Total $ 575 470 $ 1,045 2 $ 700 1 300 $ 1,000 $ 1,275 770 $ 2,045 Pipelines Exploration & Production Total $ Millions Significant growth capital in core businesses 1Capital assumed to replace production 2Current estimate of $160 MM of hurricane-related capex n
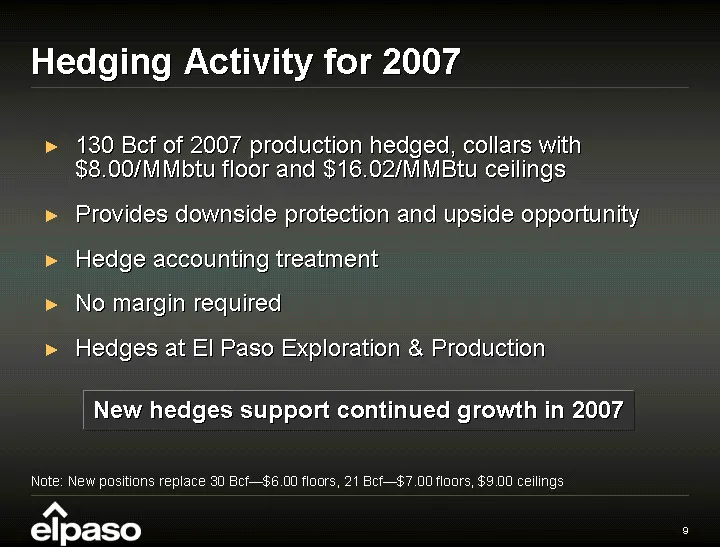
Slide 8: Hedging Activity for 2007
Hedging Activity for 2007 130 Bcf of 2007 production hedged, collars with $8.00/MMbtu floor and $16.02/MMBtu ceilings Provides downside protection and upside opportunity Hedge accounting treatment No margin required Hedges at El Paso Exploration & Production Note: New positions replace 30 Bcf-$6.00
Slide 9: Pipelines
Pipelines
Slide 10: Highlights
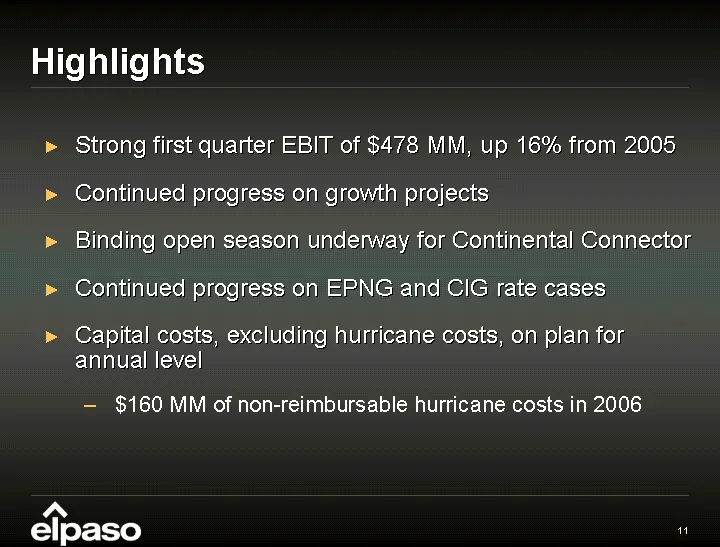
Highlights Strong first quarter EBIT of $478 MM, up 16% from 2005 Continued progress on growth projects Binding open season underway for Continental Connector Continued progress on EPNG and CIG rate cases Capital costs, excluding hurricane costs, on plan for annual level $160 MM of non-reimbursable
Slide 11: Unprecedented Growth
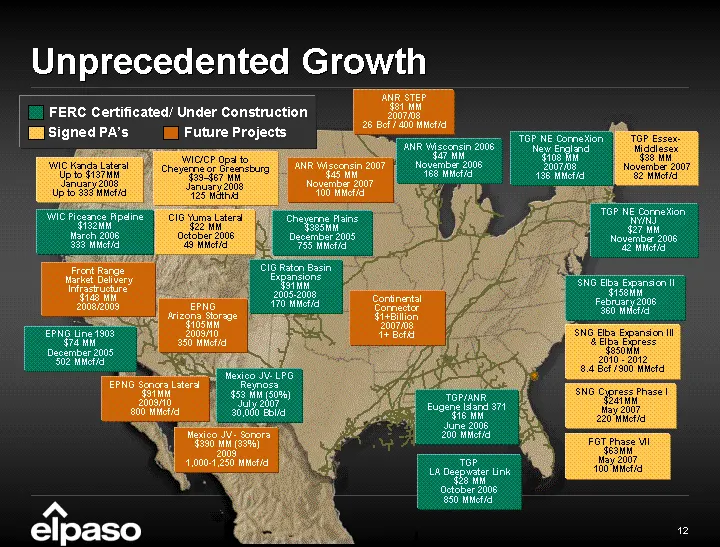
Unprecedented Growth FERC Certificated/ Under Construction Signed PA's Future Projects TGP NE ConneXion New England $108 MM 2007/08 136 MMcf/d TGP Essex- Middlesex $38 MM November 2007 82 MMcf/d TGP NE ConneXion NY/NJ $27 MM November 2006 42 MMcf/d SNG Cypress Phase I $241MM May 2007 220 MMcf/d SNG
Slide 12: Continental Connector Project
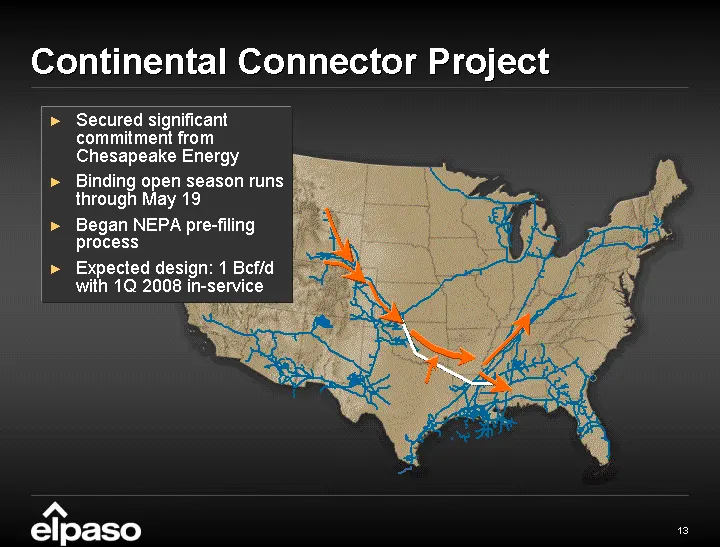
Continental Connector Project Secured significant commitment from Chesapeake Energy Binding open season runs through May 19 Began NEPA pre-filing process Expected design: 1 Bcf/d with 1Q 2008 in-service
Slide 13: 1Q 2006: Continuing to Deliver on Growth Projects
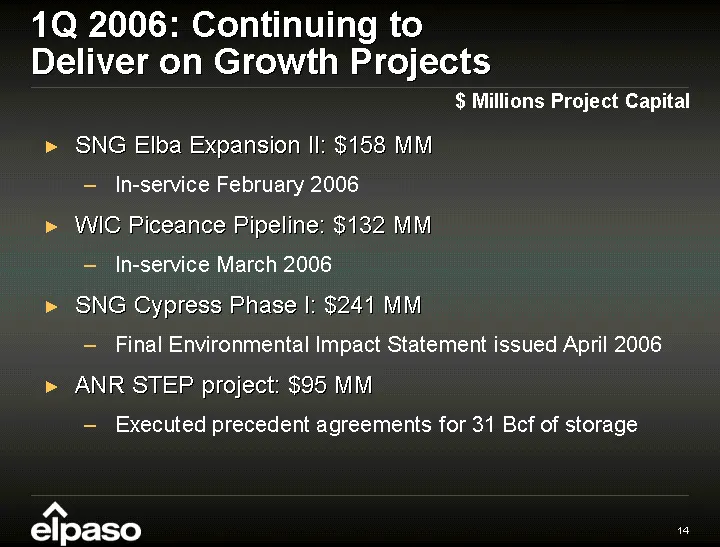
1Q 2006: Continuing to Deliver on Growth Projects SNG Elba Expansion II: $158 MM In-service February 2006 WIC Piceance Pipeline: $132 MM In-service March 2006 SNG Cypress Phase I: $241 MM Final Environmental Impact Statement issued April 2006 ANR STEP project: $95 MM Executed precedent agreements fo
Slide 14: Exploration & Production
Exploration & Production “aw elpaso
Slide 15: E&P 2006 Outlook
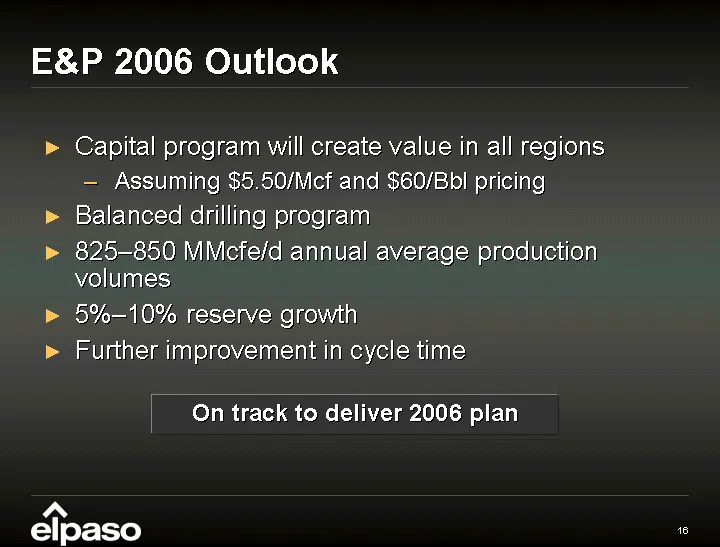
E&P 2006 Outlook Capital program will create value in all regions Assuming $5.50/Mcf and $60/Bbl pricing Balanced drilling program 825-850 MMcfe/d annual average production volumes 5%-10% reserve growth Further improvement in cycle time On track to deliver 2006 plan
Slide 16: Healthy Drilling Inventory
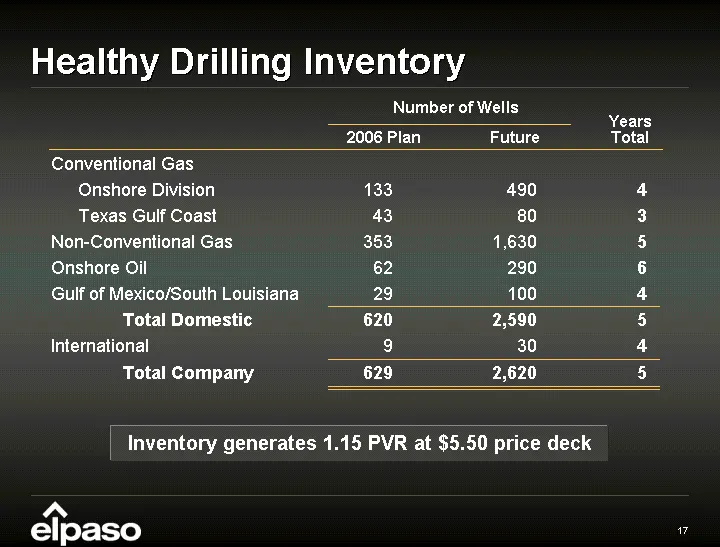
Healthy Drilling Inventory Inventory generates 1.15 PVR at $5.50 price deck Conventional Gas Onshore Division Texas Gulf Coast Non-Conventional Gas Onshore Oil Gulf of Mexico/South Louisiana Total Domestic International Total Company 133 43 353 62 29 620 9 629 2006 Plan Future Years Total 490 80 1,6
Slide 17: Balanced Drilling Portfolio for 2006
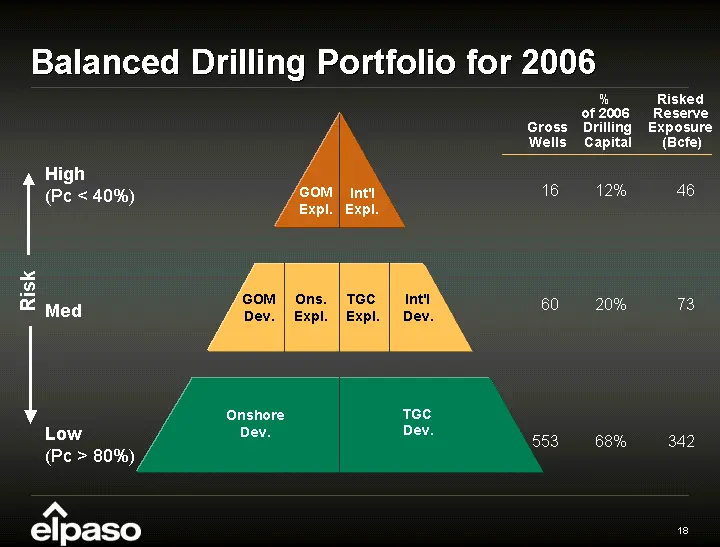
Balanced Drilling Portfolio for 2006 High (Pc < 40%) Med Low (Pc > 80%) % of 2006 Drilling Capital Risked Reserve Exposure (Bcfe) 12% 46 20% 73 68% 342 Risk 16 60 553 Gross Wells GOM Expl. Int'l Expl. GOM Dev. Ons. Expl. Onshore Dev. TGC Dev. TGC Expl. Int'l Dev.
Slide 18: Significant Drilling Success in 1Q 2006
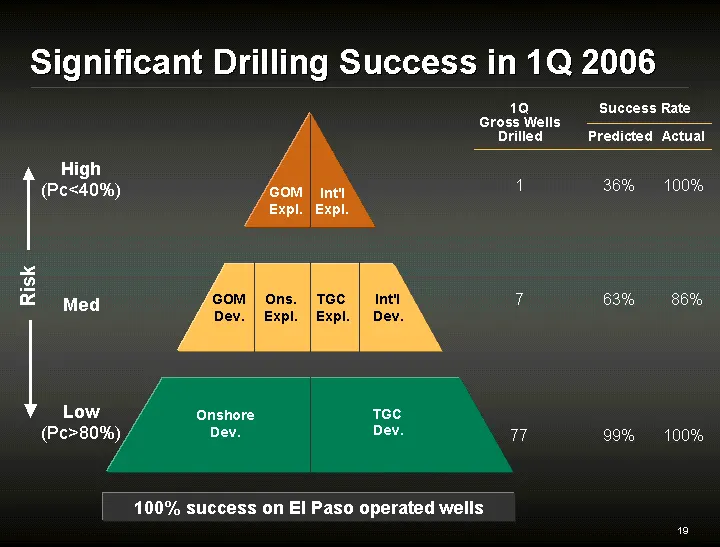
Significant Drilling Success in 1Q 2006 High (Pc<40%) Med Low (Pc>80%) Predicted Actual GOM Expl. Int'l Expl. GOM Dev. Ons. Expl. Onshore Dev. TGC Dev. 36% 100% 63% 86% 99% 100% Risk TGC Expl. Int'l Dev. 1 7 77 1Q Gross Wells Drilled Success Rate 37 100% success on El Paso operated wells
Slide 19: Roadmap to E&P Volumes
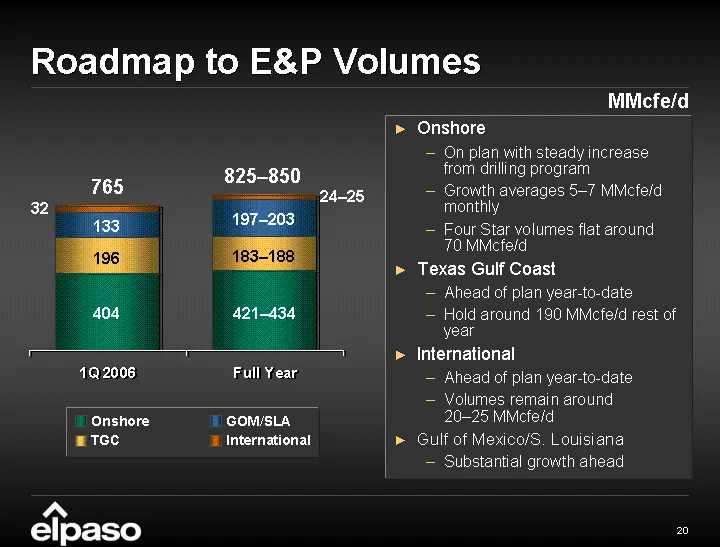
Roadmap to E&P Volumes Onshore On plan with steady increase from drilling program Growth averages 5-7 MMcfe/d monthly Four Star volumes flat around 70 MMcfe/d Texas Gulf Coast Ahead of plan year-to-date Hold around 190 MMcfe/d rest of year International Ahead of plan year-to-date Volumes remain arou
Slide 20: Road Map to E&P Volumes Gulf of Mexico
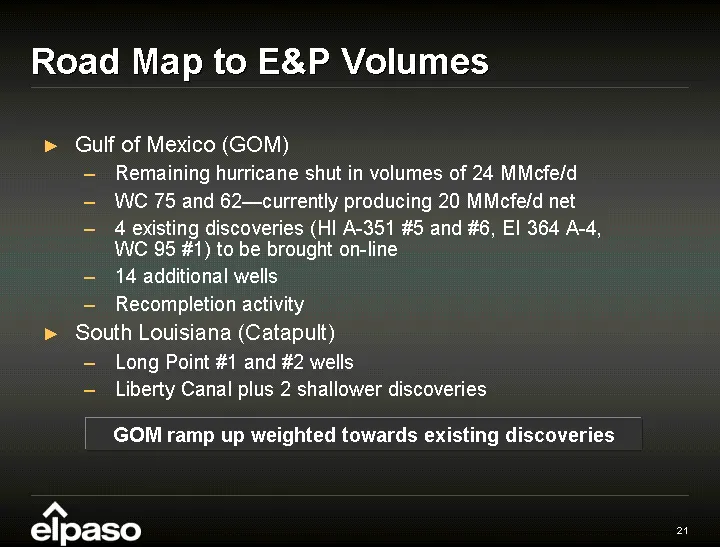
Road Map to E&P Volumes Gulf of Mexico (GOM) Remaining hurricane shut in volumes of 24 MMcfe/d WC 75 and 62-currently producing 20 MMcfe/d net 4 existing discoveries (HI A-351 #5 and #6, EI 364 A-4, WC 95 #1) to be brought on-line 14 additional wells Recompletion activity South Louisiana (Catapult)
Slide 21: Summary
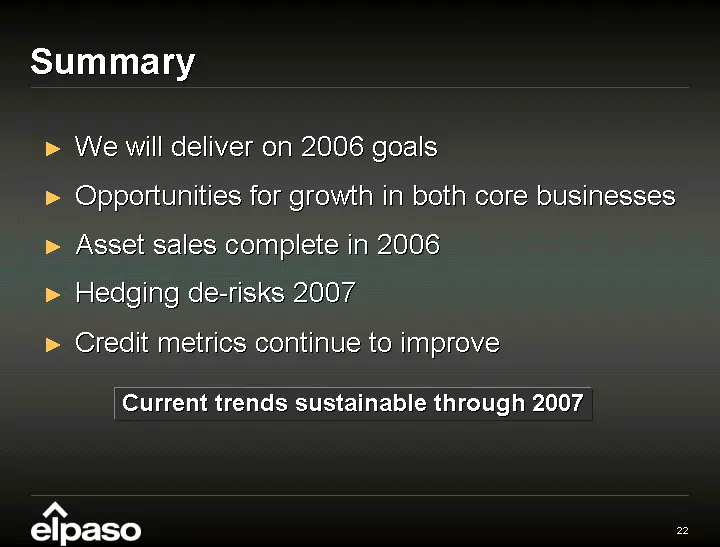
Summary We will deliver on 2006 goals Opportunities for growth in both core businesses Asset sales complete in 2006 Hedging de-risks 2007 Credit metrics continue to improve Current trends sustainable through 2007
Slide 22: Appendix
Appendix
Slide 23: Disclosure of Non-GAAP Financial Measures
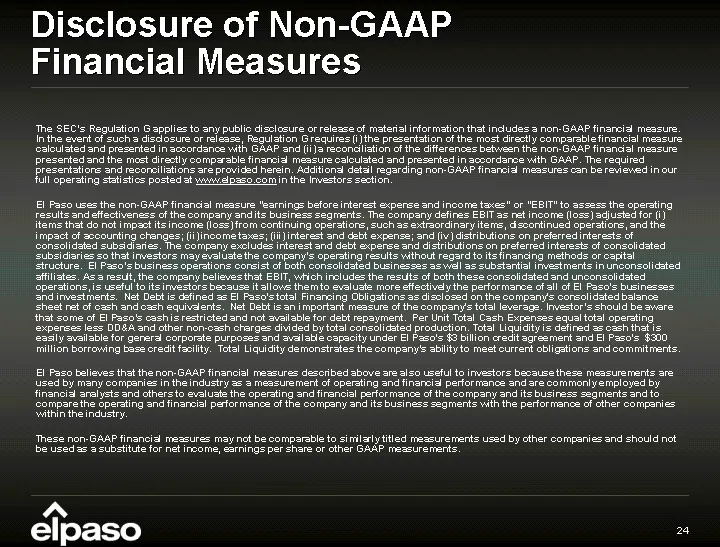
Disclosure of Non-GAAP Financial Measures The SEC's Regulation G applies to any public disclosure or release of material information that includes a non-GAAP financial measure. In the event of such a disclosure or release, Regulation G requires (i) the presentation of the most directly comparable fi
Slide 24: Net Debt Reconciliation
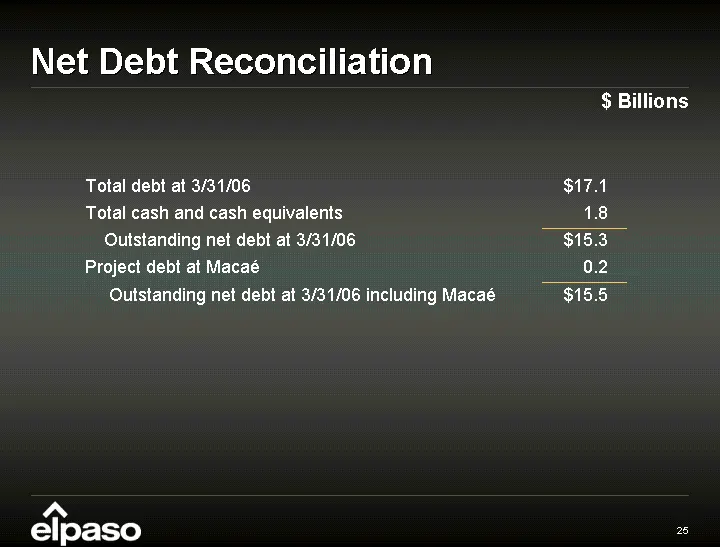
Net Debt Reconciliation Total debt at 3/31/06 Total cash and cash equivalents Outstanding net debt at 3/31/06 Project debt at Macae Outstanding net debt at 3/31/06 including Macae $ 17.1 1.8 $ 15.3 0.2 $15.5 $ Billions
Slide 25: Bear Stearns 15th Annual Global Credit Conference
Mark Leland Executive Vice President & Chief Financial Officer Bear Stearns 15th Annual Global Credit Conference May 16, 2006
Source: SEC EDGAR · 8-K filed May 16, 2006
More decks from El Paso Corp.
 Corporate Update (March 2012)53 slides · Mar 28, 2012
 Merger or Acquisition (December 2011)39 slides · Dec 6, 2011
 Merger or Acquisition (October 2011)20 slides · Oct 17, 2011
 Investor Day (May 2011)170 slides · May 24, 2011
 Technical Presentation (October 2009)30 slides · Oct 15, 2009
 Investor Presentation (June 2009)27 slides · Jun 5, 2009