AMERICAN EAGLE ENERGY — Investor Presentation (September 2014)
28 slides from AMERICAN EAGLE ENERGY's investor presentation, Sep 29, 2014
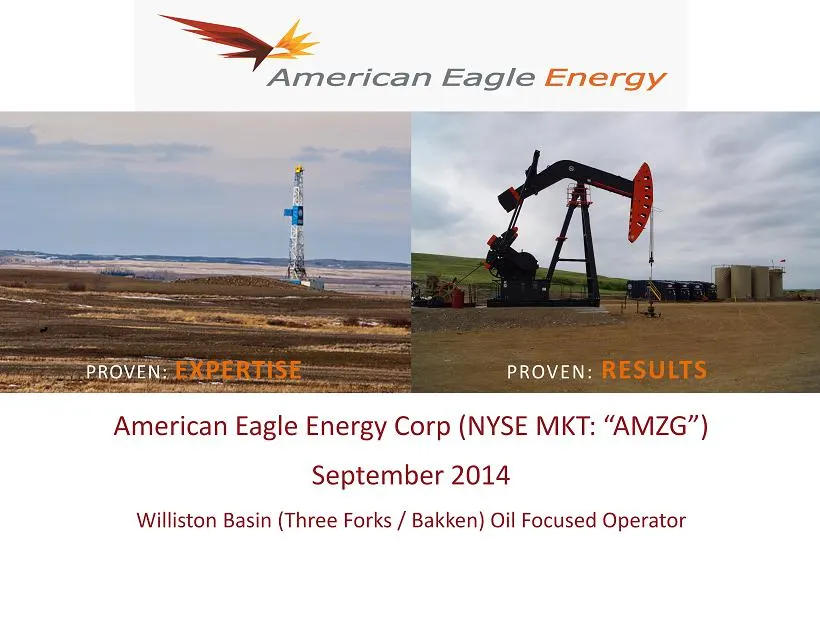
Slide 1: American Eagle Energy Corp – Williston Basin Oil Focused Operator
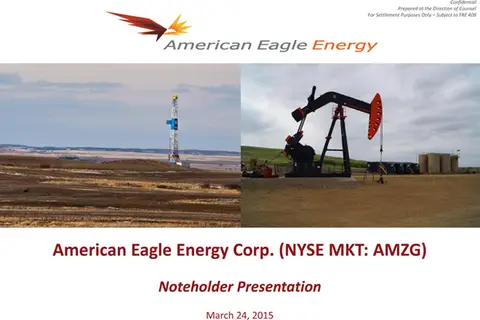
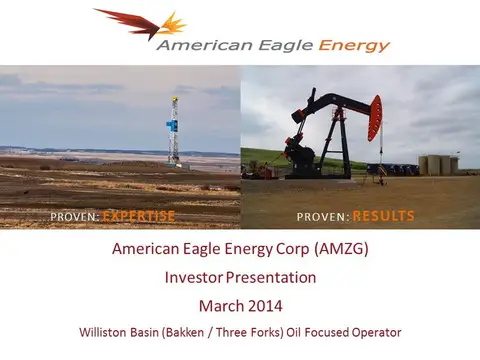
American Eagle Energy Corp (NYSE MKT: “AMZG”) September 2014 Williston Basin (Three Forks / Bakken ) Oil Focused Operator PROVEN: EXPERTISE PROVEN: RESULTS
Slide 2: Forward Looking Information
F ORWARD L OOKING I NFORMATION 2 This presentation contains forward - looking statements within the meaning of Section 27A of the Securities Act of 1933, as amended (the “Securities Act”), and Section 21 E o f the Securities Exchange Act of 1934, as amended (the “Exchange Act”). You can identify for
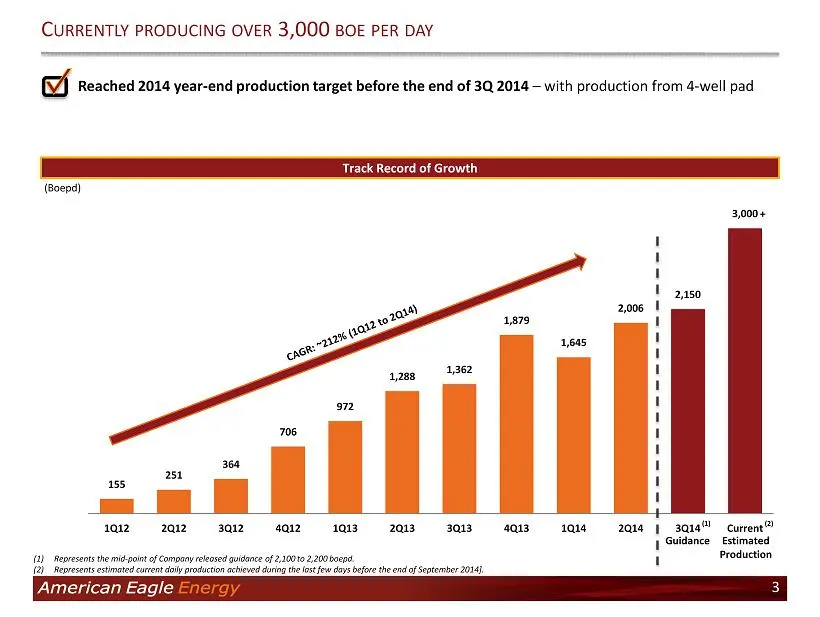
Slide 3: Currently Producing Over 3,000 BOE per Day
155 251 364 706 972 1,288 1,362 1,879 1,645 2,006 2,150 3,000 1Q12 2Q12 3Q12 4Q12 1Q13 2Q13 3Q13 4Q13 1Q14 2Q14 3Q14 Current ■ Reached 2014 year - end production target before the end of 3 Q 2014 – with production from 4 - well pad C URRENTLY PRODUCING OVER 3,000 BOE PER DAY 3 Track Record of Growth
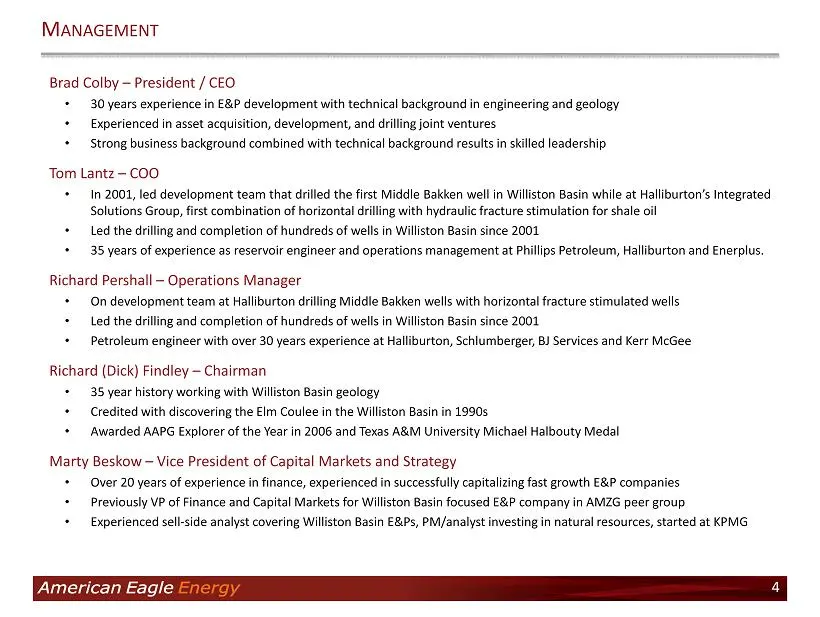
Slide 4: Management team
Brad Colby – President / CEO • 30 years experience in E&P development with technical background in engineering and geology • Experienced in asset acquisition, development, and drilling joint ventures • Strong business background combined with technical background results in skilled leadership Tom La
Slide 5: Company snapshot
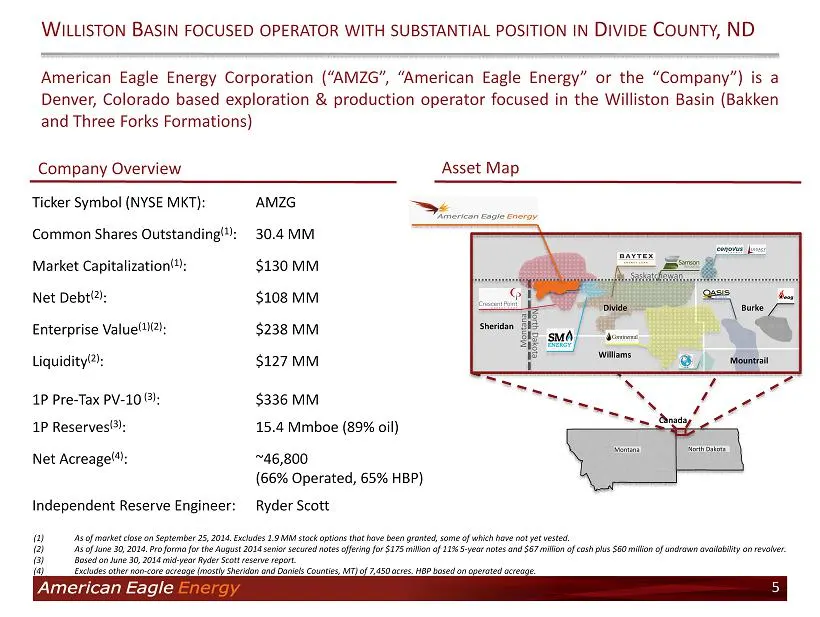
Ticker Symbol (NYSE MKT): AMZG Common Shares Outstanding (1) : 30.4 MM Market Capitalization (1) : $130 MM Net Debt (2) : $108 MM Enterprise Value (1)(2) : $238 MM Liquidity (2) : 1P Pre - Tax PV - 10 (3) : $127 MM $336 MM 1P Reserves (3) : 15.4 Mmboe (89% oil) Net Acreage (4) : ~46,800 (66% Operate
Slide 6: Spyglass Project Area Stacks Up with the Core of the Williston
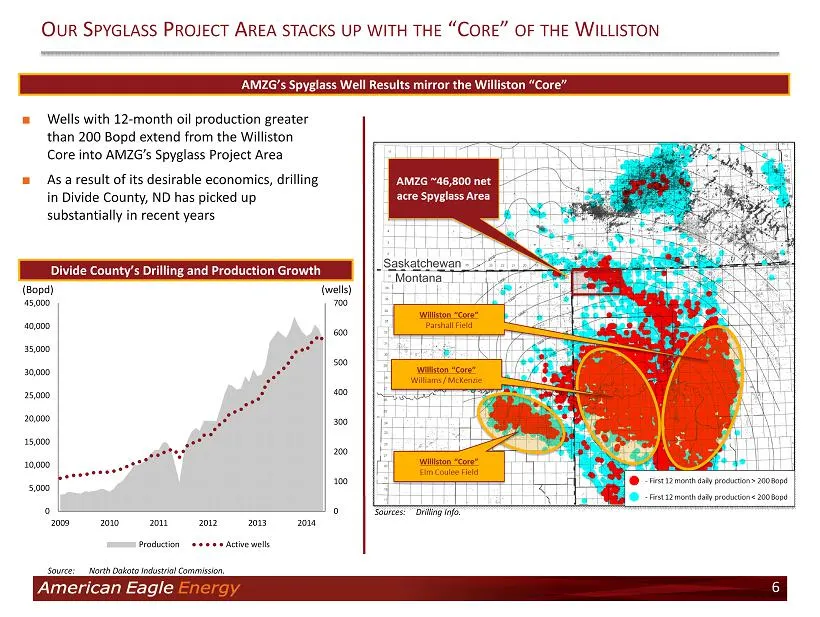
0 100 200 300 400 500 600 700 0 5,000 10,000 15,000 20,000 25,000 30,000 35,000 40,000 45,000 2009 2010 2011 2012 2013 2014 Production Active wells O UR S PYGLASS P ROJECT A REA STACKS UP WITH THE “C ORE ” OF THE W ILLISTON 6 AMZG’s Spyglass Well Results mirror the Williston “Core” ■ Wells with 12 -
Slide 7: The Divide County Advantage
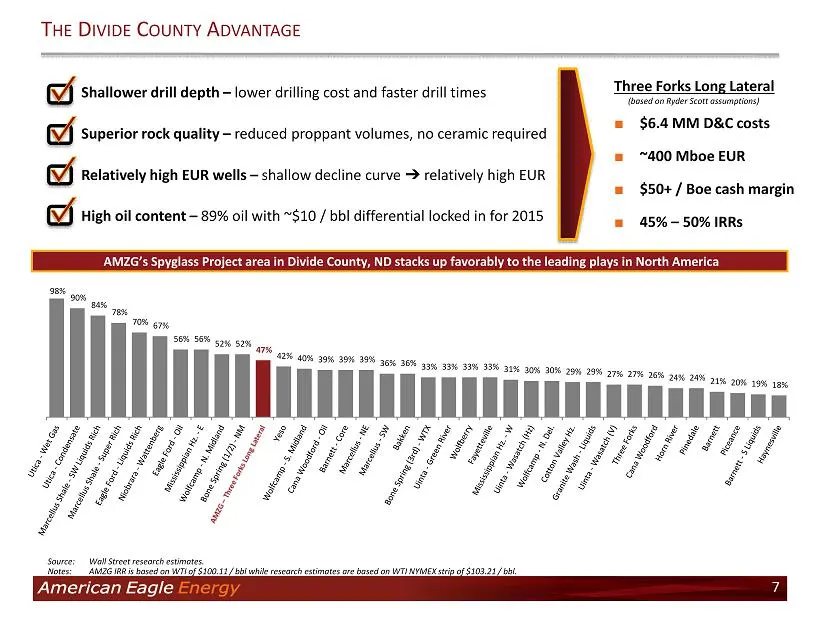
98% 90% 84% 78% 70% 67% 56% 56% 52% 52% 47% 42% 40% 39% 39% 39% 36% 36% 33% 33% 33% 33% 31% 30% 30% 29% 29% 27% 27% 26% 24% 24% 21% 20% 19% 18% ■ Shallower drill depth – lower drilling cost and faster drill times ■ Superior rock quality – reduced proppant volumes, no ceramic required ■ Relatively hi
Slide 8: Reserve Summary
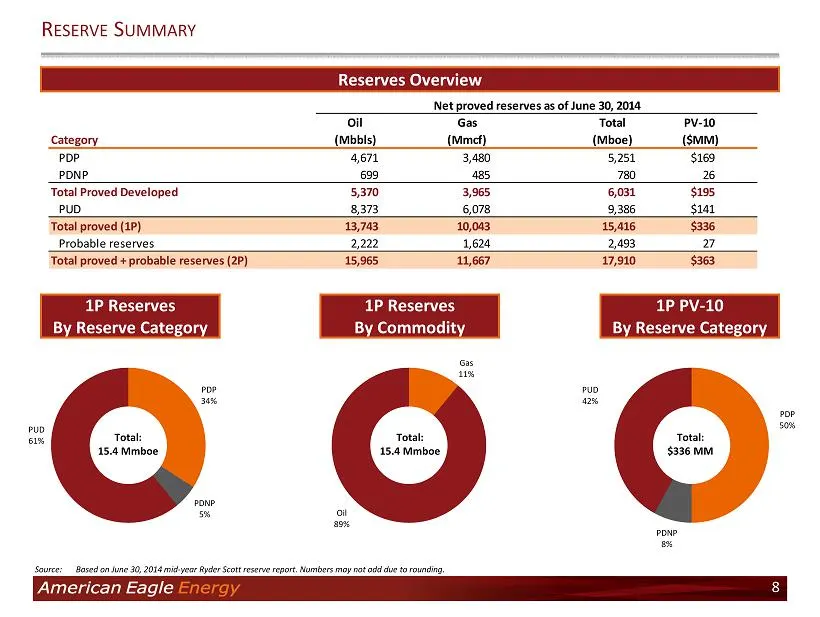
R ESERVE S UMMARY 8 1P Reserves By Reserve Category 1P Reserves By Commodity 1P PV - 10 B y Reserve Category Oil Gas Total PV-10 Category (Mbbls) (Mmcf) (Mboe) ($MM) PDP 4,671 3,480 5,251 $169 PDNP 699 485 780 26 Total Proved Developed 5,370 3,965 6,031 $195 PUD 8,373 6,078 9,386 $141 Total proved (
Slide 9: Production and reserve growth
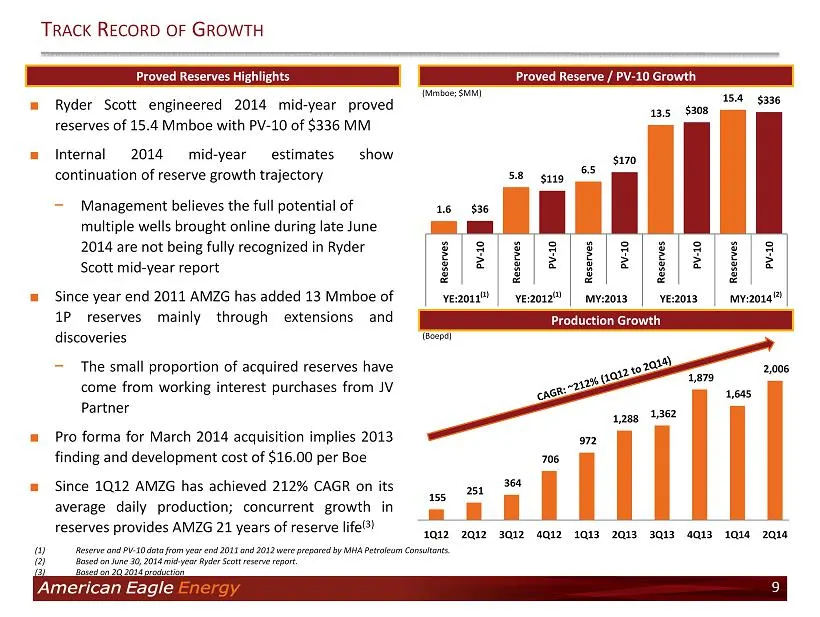
155 251 364 706 972 1,288 1,362 1,879 1,645 2,006 2,250 1Q12 2Q12 3Q12 4Q12 1Q13 2Q13 3Q13 4Q13 1Q14 2Q14 Jul-14 1.6 5.8 6.5 13.5 15.4 $36 $119 $170 $308 $336 $- $50 $100 $150 $200 $250 $300 $350 $400 0 2 4 6 8 10 12 14 16 18 Reserves PV-10 Reserves PV-10 Reserves PV-10 Reserves PV-10 Reserves PV-10
Slide 10: Spyglass Project – Offset Operators
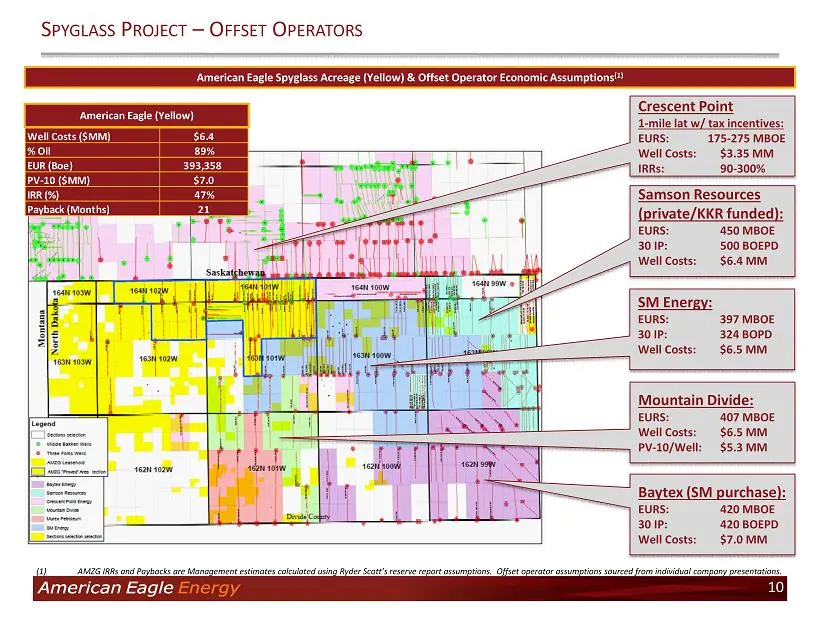
S PYGLASS P ROJECT – O FFSET O PERATORS American Eagle Spyglass Acreage (Yellow) & Offset Operator Economic Assumptions (1) 10 (1) AMZG IRRs and Paybacks are Management estimates calculated using Ryder Scott’s reserve report assumptions. Offset operator assumptions sourced from individual com pan y
Slide 11: Divide County Decline Rates Are Relatively Favorable
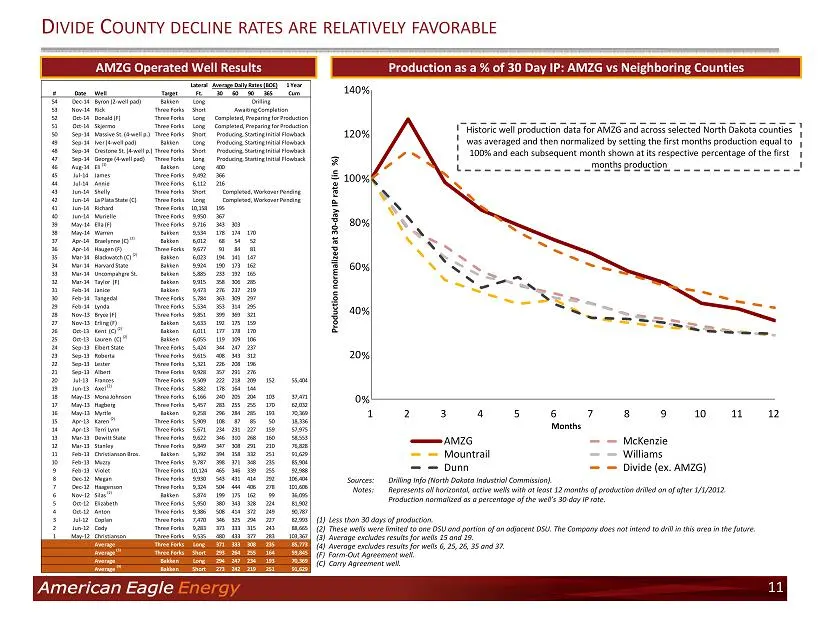
0 20 40 60 80 100 120 140 1 2 3 4 5 6 7 8 9 10 11 12 Production normalized at 30 - day IP rate (in %) AMZG McKenzie Mountrail Williams Dunn Divide (ex. AMZG) D IVIDE C OUNTY DECLINE RATES ARE RELATIVELY FAVORABLE Production as a % of 30 Day IP: AMZG vs Neighboring Counties AMZG Operated Well Results
Slide 12: Lower Drill Depth and Better Rock Quality Lead to Lower D&C Costs
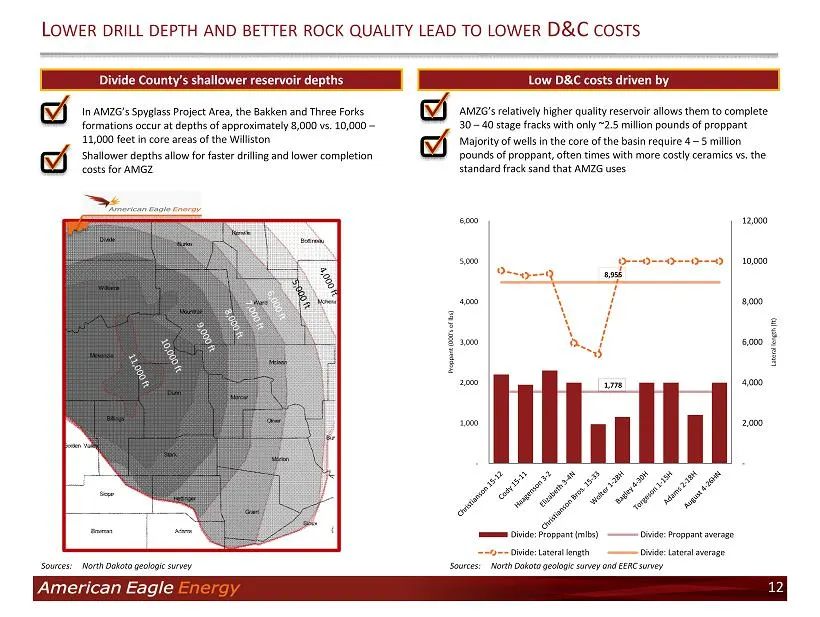
■ AMZG’s relatively higher quality reservoir allows them to complete 30 – 40 stage fracks with only ~2.5 million pounds of proppant ■ Majority of wells in the core of the basin require 4 – 5 million pounds of proppant, often times with more costly ceramics vs. the standard frack sand that AMZG uses
Slide 13: Focus on Efficiency Has Reduced Drilling Days Over Time
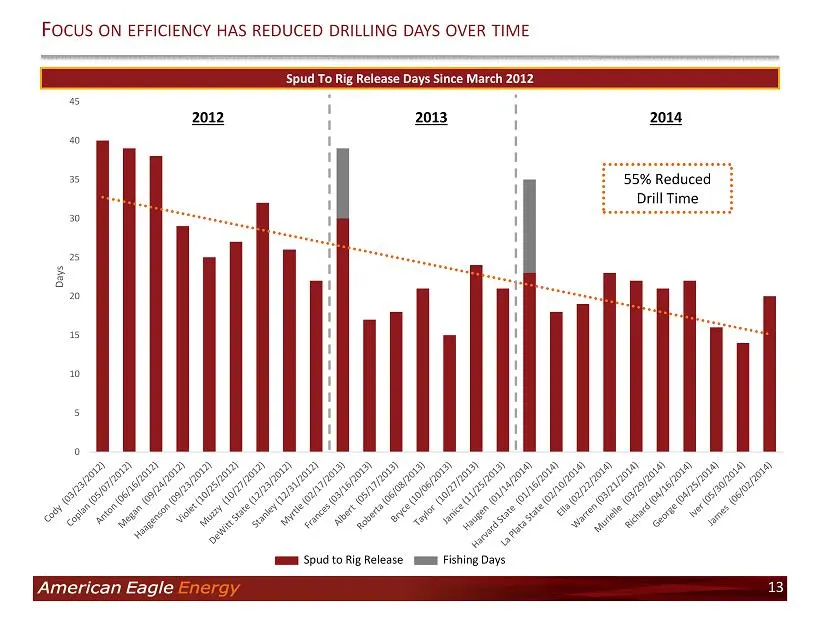
F OCUS ON EFFICIENCY HAS REDUCED DRILLING DAYS OVER TIME 13 0 5 10 15 20 25 30 35 40 45 Days 55% Reduced Drill Time Spud to Rig Release Fishing Days Spud To Rig R elease Days Since March 2012 2012 2013 2014
Slide 14: Highly Economic Wells with Upside on Reduced Drilling and Completion Cost
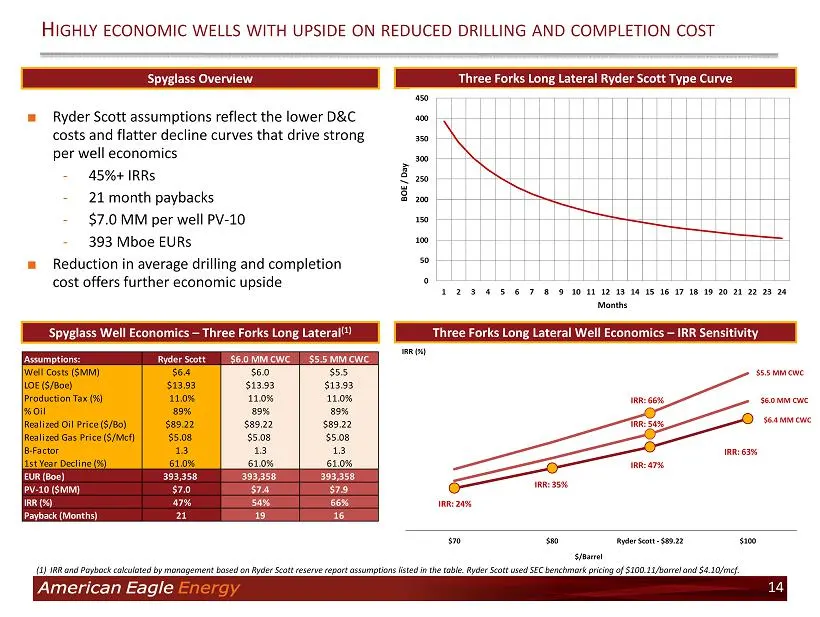
$70 $80 Ryder Scott - $89.22 $100 H IGHLY ECONOMIC WELLS WITH UPSIDE ON REDUCED DRILLING AND COMPLETION COST Spyglass Well Economics – Three Forks Long Lateral (1) Three Forks Long Lateral Well Economics – IRR Sensitivity ■ Ryder Scott assumptions reflect the lower D&C costs and flatter decline curv
Slide 15: Williston Basin Infrastructure and Takeaway Capacity Continues to Mature
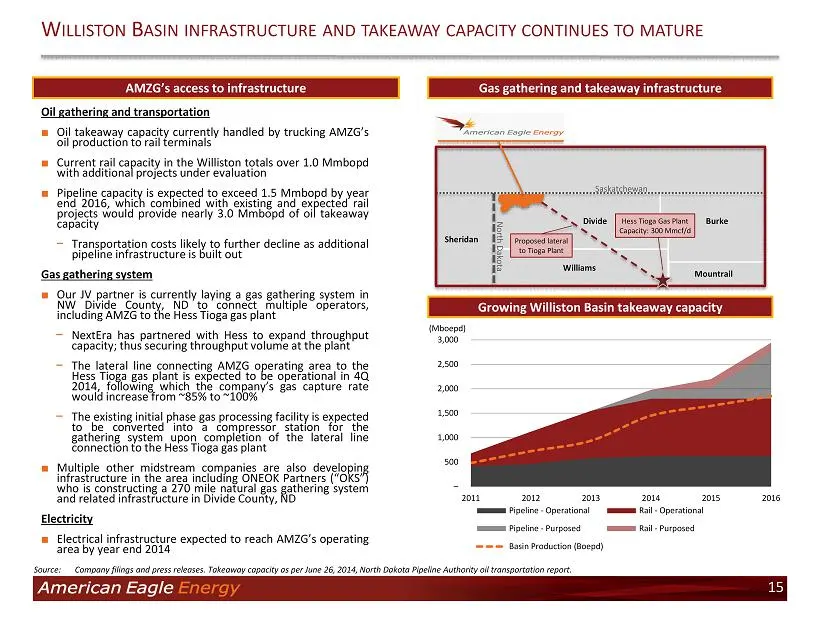
– 500 1,000 1,500 2,000 2,500 3,000 2011 2012 2013 2014 2015 2016 Pipeline - Operational Rail - Operational Pipeline - Purposed Rail - Purposed Basin Production (Boepd) 15 AMZG’s access to infrastructure Gas gathering and takeaway infrastructure W ILLISTON B ASIN INFRASTRUCTURE AND TAKEAWAY CAPACITY
Slide 16: Significant Well Control in Development Area with Large Low-Risk Inventory
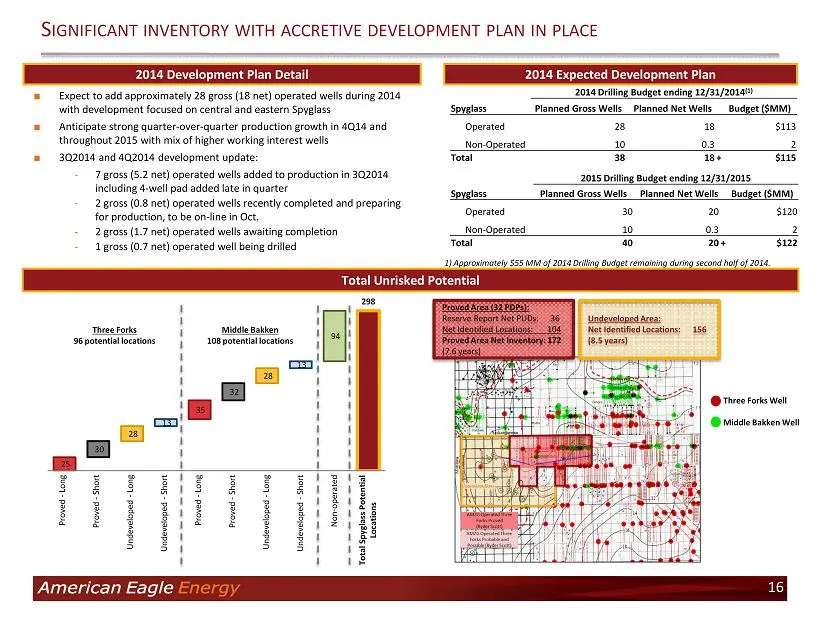
25 30 28 13 35 32 28 13 94 298 1 2 3 4 5 6 7 8 9 10 Proved - Long Proved - Long Proved - Short Proved - Short U ndeveloped - Long U ndeveloped - Long U ndeveloped - Short U ndeveloped - Short Non - operated Three Forks 96 potential locations Middle Bakken 108 potential locations Total Spyglass Poten
Slide 17: Significant Well Control in Development Area with Large Low-Risk Inventory
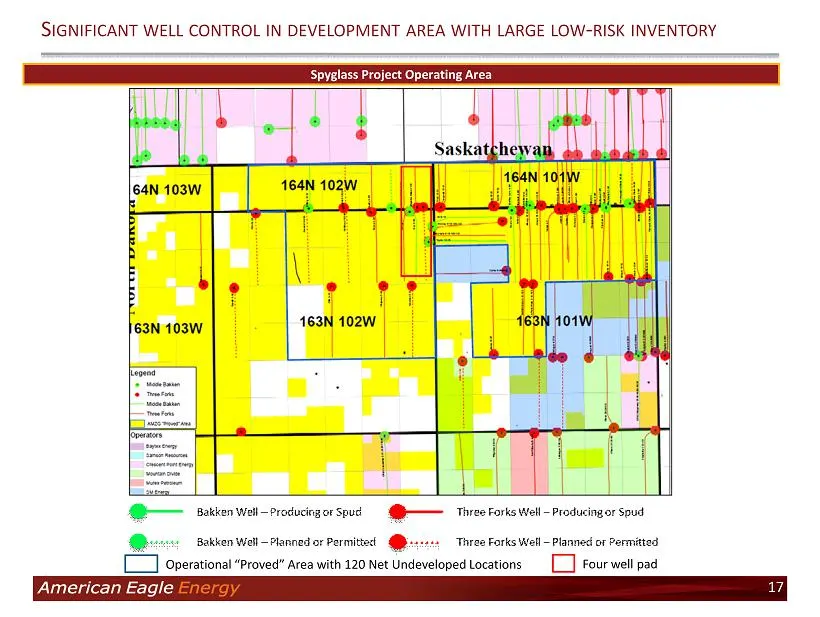
S IGNIFICANT WELL CONTROL IN DEVELOPMENT AREA WITH LARGE LOW - RISK I NVENTORY 17 Spyglass Project Operating Area Operational “Proved” Area with 120 Net Undeveloped Locations Four well pad
Slide 18: AMZG Stacks Up Well with Its Williston Basin Peers
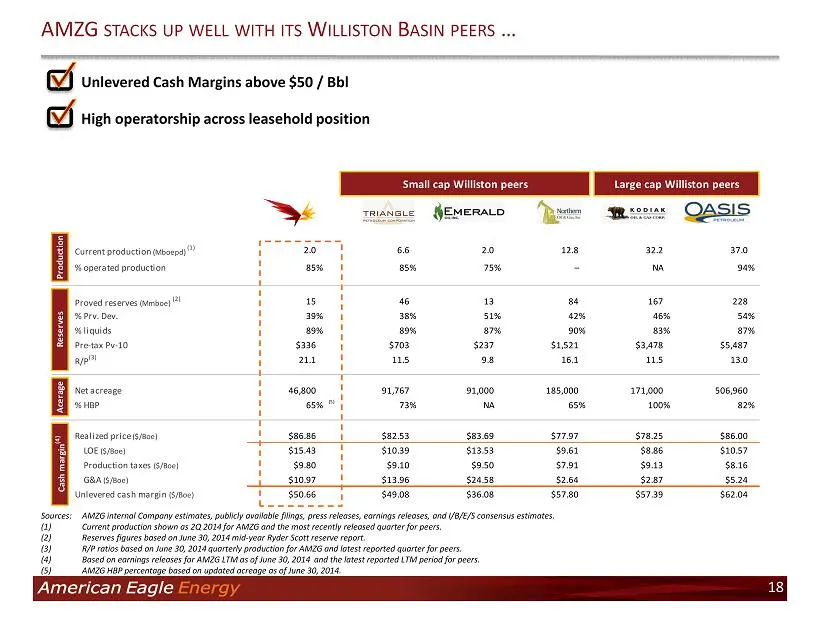
AMZG STACKS UP WELL WITH ITS W ILLISTON B ASIN PEERS … 18 Sources : AMZG internal Company estimates, publicly available filings, press releases, earnings releases, and I/B/E/S consensus estimates . ( 1 ) Current production shown as 2 Q 2014 for AMZG and the most recently released quarter for peers .
Slide 19: Peer valuation comparison
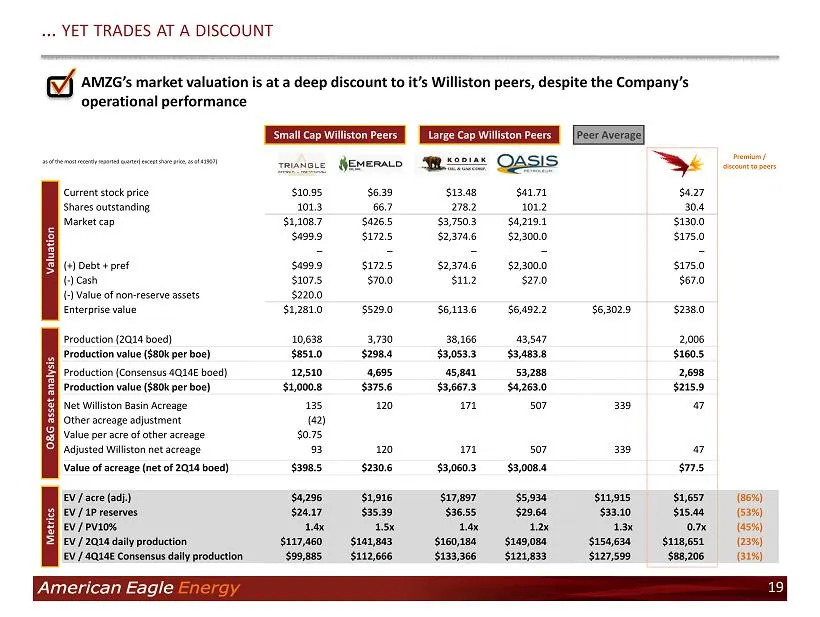
Small Cap Williston Peers Large Cap Williston Peers Peer Average as of the most recently reported quarter( except share price, as of 41907) Premium / discount to peers Current stock price $10.95 $6.39 $13.48 $41.71 $4.27 Shares outstanding 101.3 66.7 278.2 101.2 30.4 Market cap $1,108.7 $426.5 $3,75
Slide 20: Investment highlights
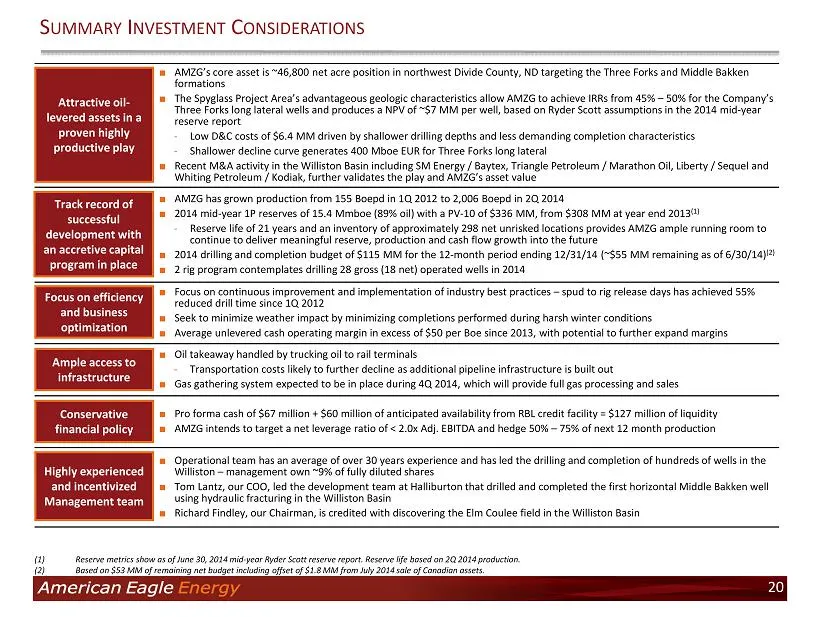
■ AMZG’s core asset is ~46,800 net acre position in northwest Divide County, ND targeting the Three Forks and Middle Bakken formations ■ The Spyglass Project Area’s advantageous geologic characteristics allow AMZG to achieve IRRs from 45% – 50% for the Company’s Three Forks long lateral wells and pr
Slide 21: Contact Information
21 C ONTACT I NFORMATION Marty Beskow, CFA Vice President of Capital Markets & Strategy American Eagle Energy Corporation 2549 West Main Street, Suite 202 Littleton, CO 80120 720 - 330 - 8378 [email protected]
Slide 22: Appendix
APPENDIX American Eagle
Slide 23: Highly Experienced and Incentivized Management Team
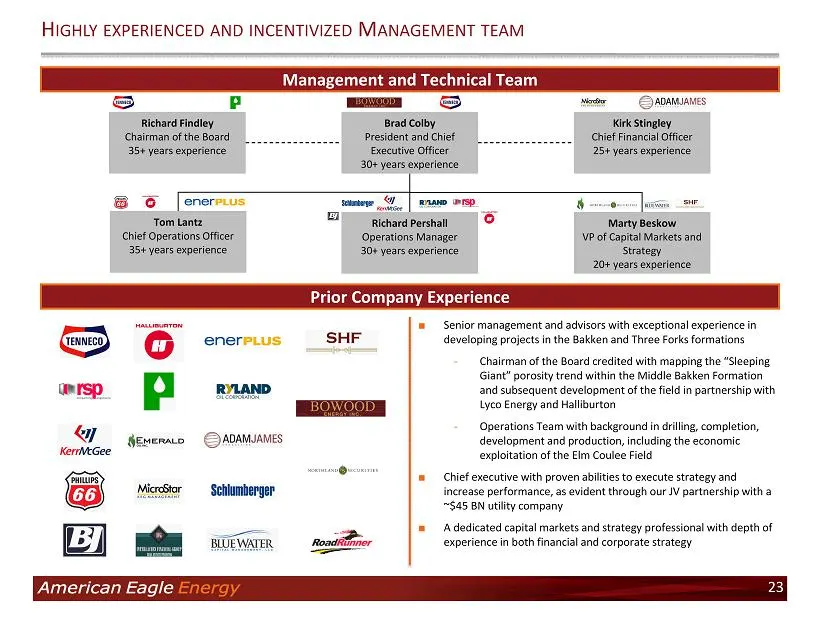
■ Senior management and advisors with exceptional experience in developing projects in the Bakken and Three Forks formations - Chairman of the Board credited with mapping the “Sleeping Giant” porosity trend within the Middle Bakken Formation and subsequent development of the field in partnership wit
Slide 24: Strategies, ability to execute and 2014 year-end goals
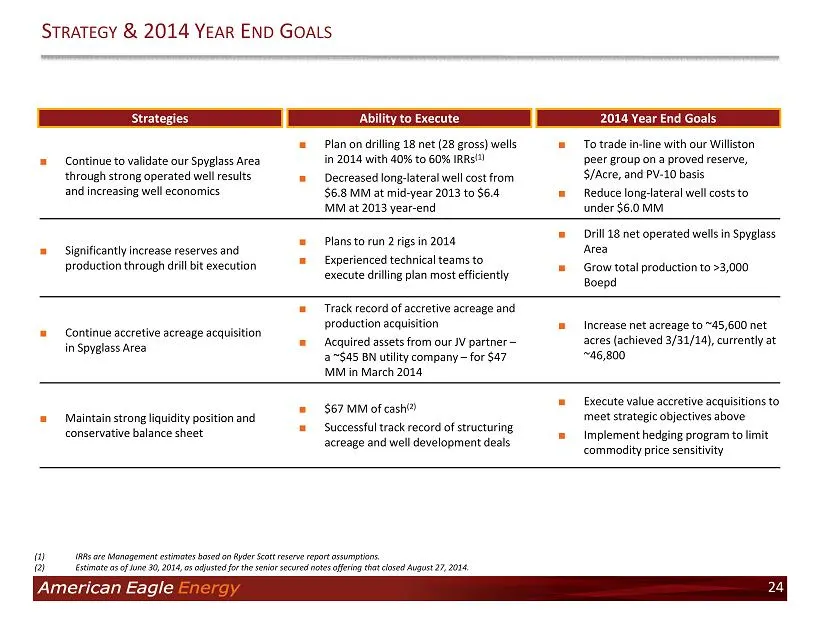
Strategies Ability to Execute 2014 Year End Goals ■ Continue to validate our Spyglass Area through strong operated well results and increasing well economics ■ Plan on drilling 18 net (28 gross) wells in 2014 with 40% to 60% IRRs (1) ■ Decreased long - lateral well cost from $6.8 MM at mid - year 20
Slide 25: Williston Basin – Stratigraphy
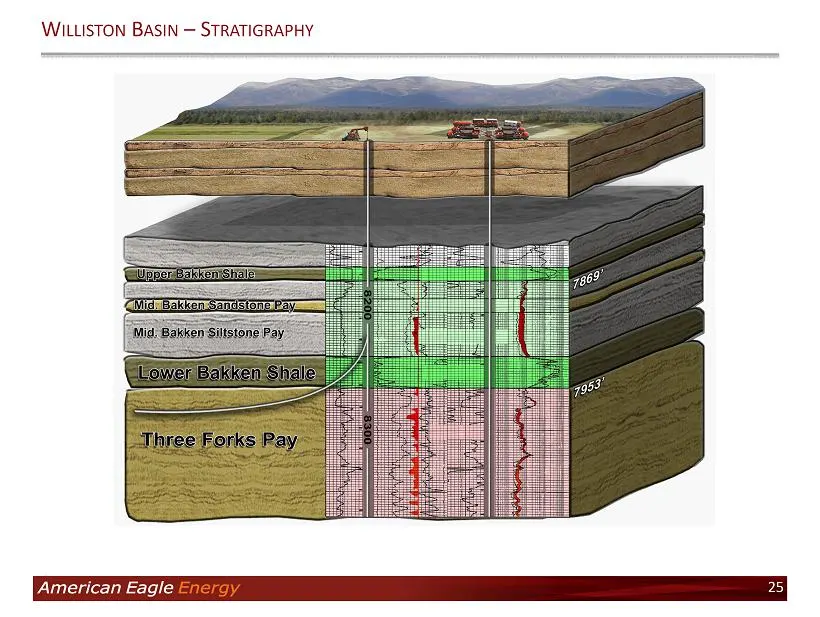
W ILLISTON B ASIN – S TRATIGRAPHY 25
Slide 26: AMZG Three Forks Operated Results vs. Ryder Scott Type Curve
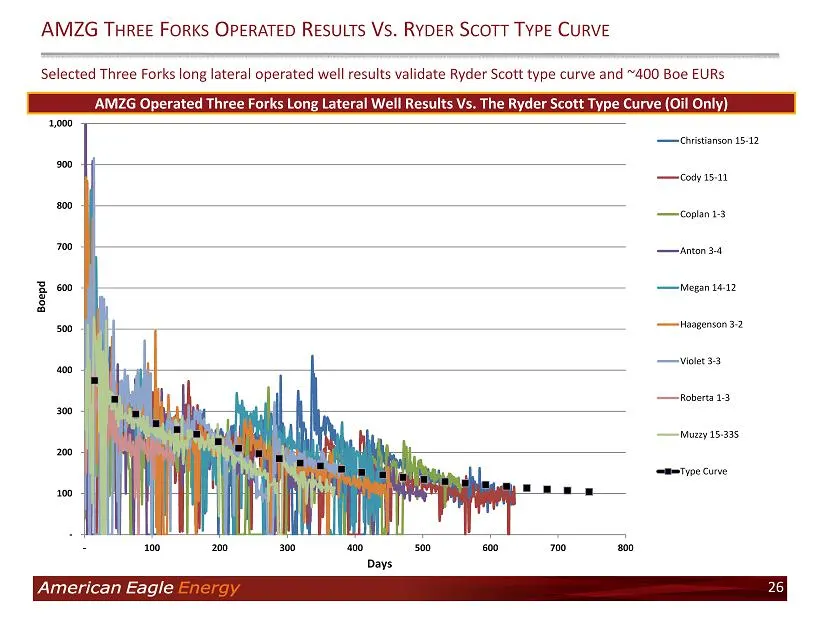
Selected Three Forks long lateral operated well results validate Ryder Scott type curve and ~400 B oe EURs AMZG T HREE F ORKS O PERATED R ESULTS V S . R YDER S COTT T YPE C URVE AMZG Operated Three Forks Long Lateral Well Results Vs. The Ryder Scott Type Curve (Oil Only) 26 - 100 200 300 400 500 600
Slide 27: Williston Basin – Acreage
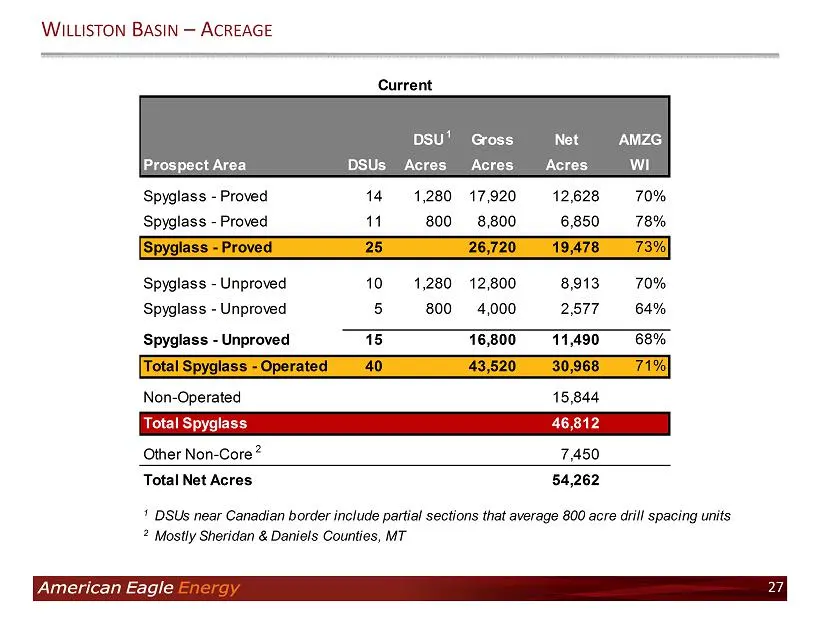
W ILLISTON B ASIN – A CREAGE 27 DSU 1 Gross Net AMZG Prospect Area DSUs Acres Acres Acres WI Spyglass - Proved 14 1,280 17,920 12,628 70% Spyglass - Proved 11 800 8,800 6,850 78% Spyglass - Proved 25 26,720 19,478 73% Spyglass - Unproved 10 1,280 12,800 8,913 70% Spyglass - Unproved 5 800 4,000 2,57
Slide 28: Adjusted EBITDA Reconciliation
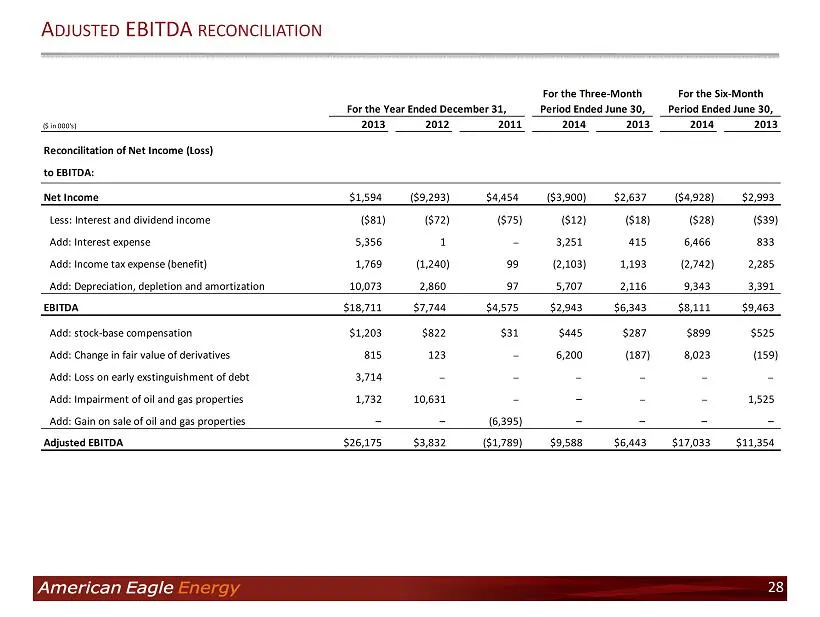
A DJUSTED EBITDA RECONCILIATION 28 ($ in 000's) 2013 2012 2011 2014 2013 2014 2013 Reconcilitation of Net Income (Loss) to EBITDA: Net Income $1,594 ($9,293) $4,454 ($3,900) $2,637 ($4,928) $2,993 Less: Interest and dividend income ($81) ($72) ($75) ($12) ($18) ($28) ($39) Add: Interest expense 5,35
Source: SEC EDGAR · 8-K filed Sep 29, 2014