Western Asset Mortgage Capital
Western Asset Mortgage Capital — Q2 2018 Earnings Presentation
25 slides from Western Asset Mortgage Capital's earnings presentation, Aug 6, 2018
Slide 1: Second Quarter 2018 Investor Presentation
Second Quarter 2018 Investor Presentation August 6, 2018
Slide 2: Safe Harbor Statement
Safe Harbor Statement We make forward-looking statements in this presentation that are subject to risks and uncertainties. These forward-looking statements include information about possible or assumed future results of our business, financial condition, liquidity, results of operations, plans and o
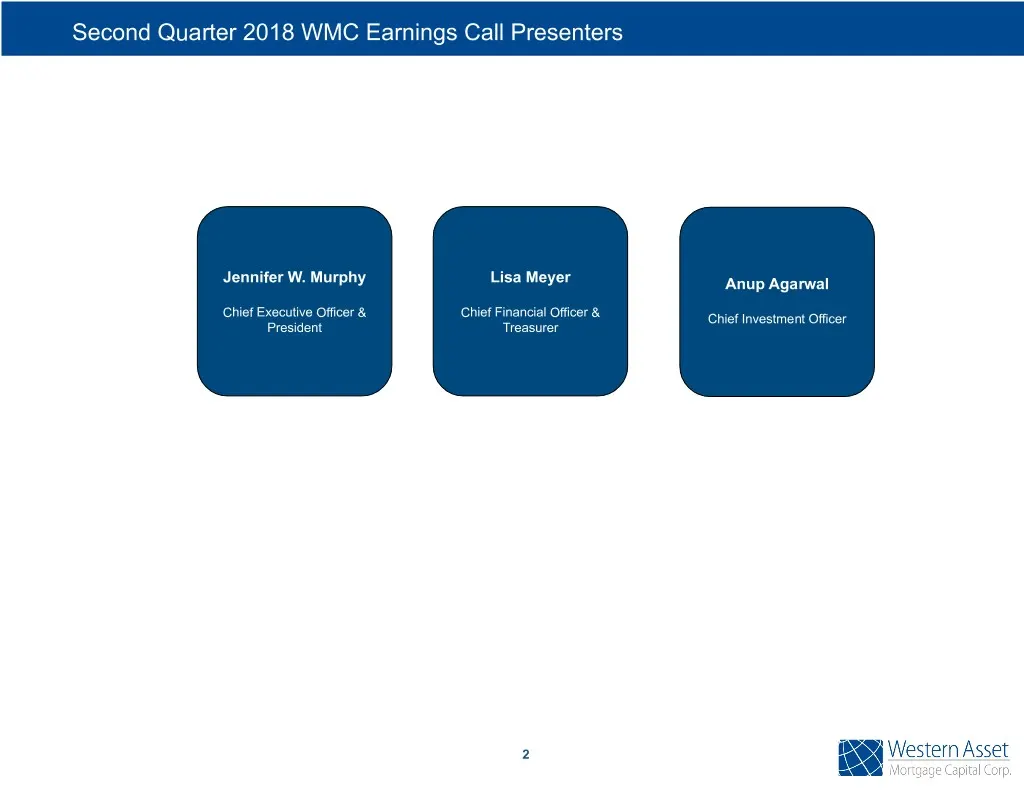
Slide 3: Second Quarter 2018 WMC Earnings Call Presenters
Second Quarter 2018 WMC Earnings Call Presenters Jennifer W. Murphy Lisa Meyer Anup Agarwal Chief Executive Officer & Chief Financial Officer & Chief Investment Officer President Treasurer 2
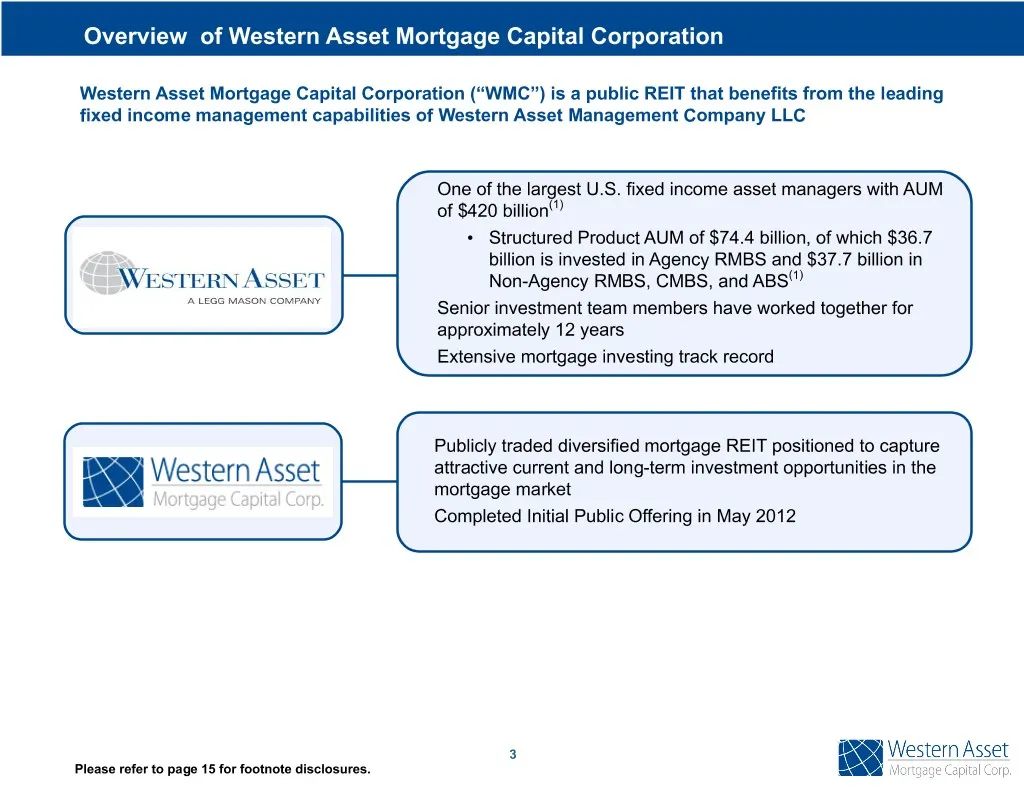
Slide 4: Overview of Western Asset Mortgage Capital Corporation
Overview of Western Asset Mortgage Capital Corporation Western Asset Mortgage Capital Corporation (“WMC”) is a public REIT that benefits from the leading fixed income management capabilities of Western Asset Management Company LLC One of the largest U.S. fixed income asset managers with AUM of $420
Slide 5: Corporate Overview
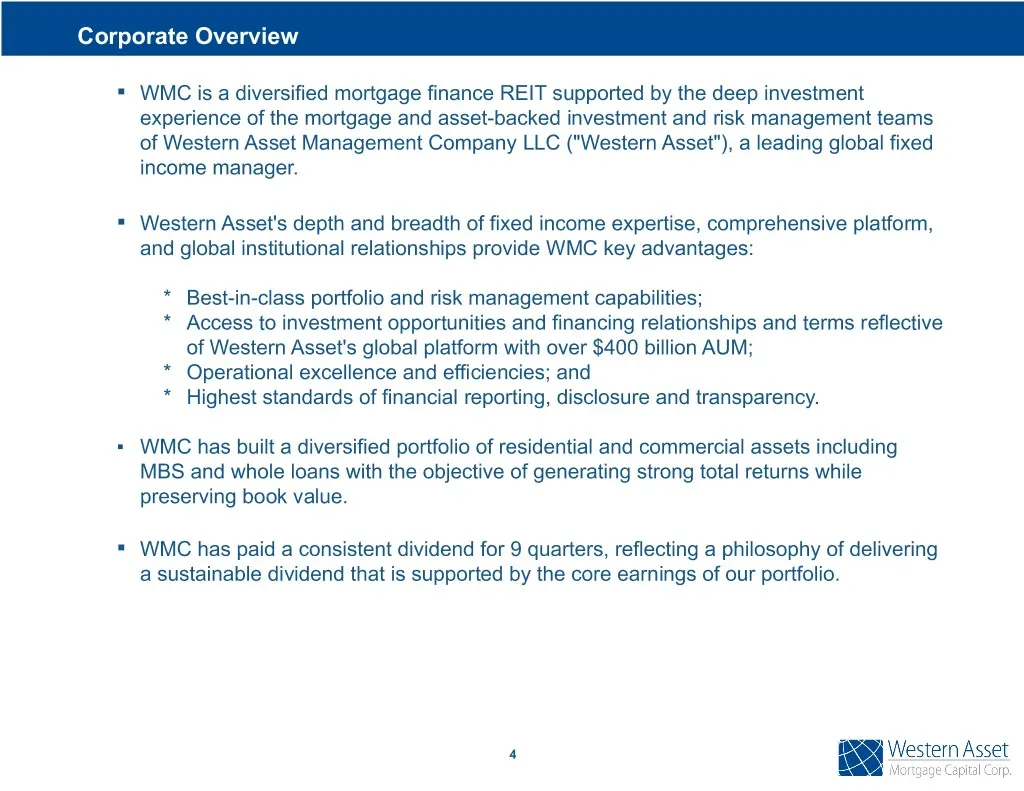
Corporate Overview ▪ WMC is a diversified mortgage finance REIT supported by the deep investment experience of the mortgage and asset-backed investment and risk management teams of Western Asset Management Company LLC ("Western Asset"), a leading global fixed income manager. ▪ Western Asset's depth
Slide 6: Second Quarter Financial Highlights
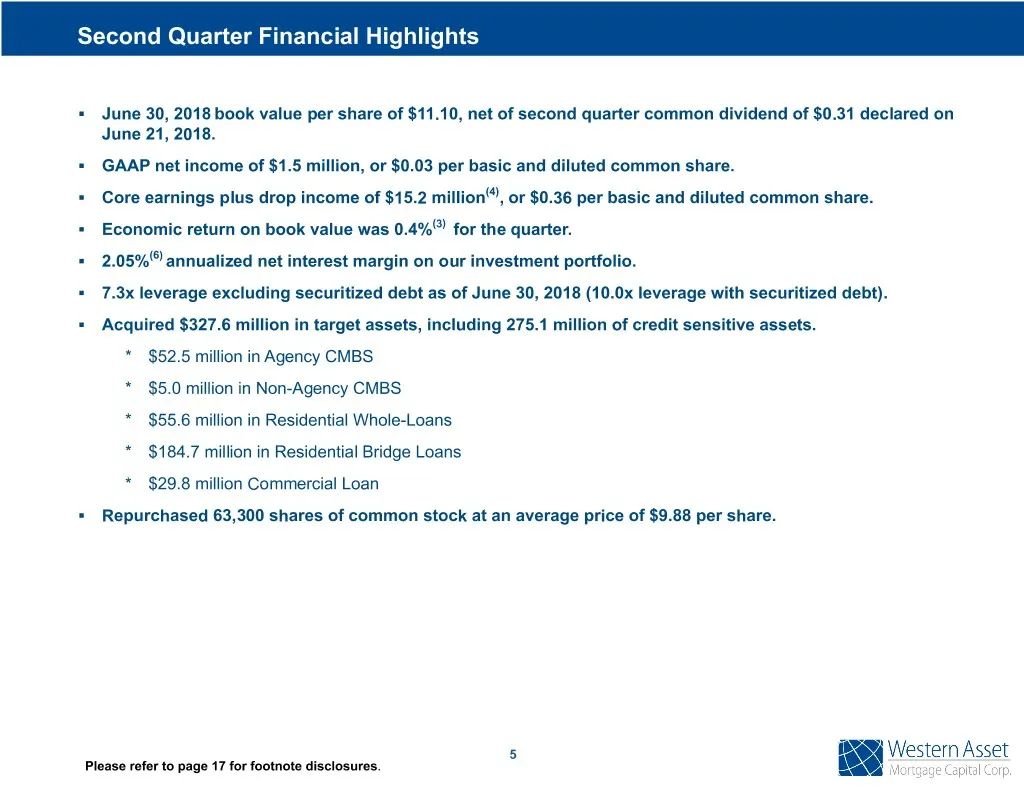
Second Quarter Financial Highlights ▪ June 30, 2018 book value per share of $11.10, net of second quarter common dividend of $0.31 declared on June 21, 2018. ▪ GAAP net income of $1.5 million, or $0.03 per basic and diluted common share. ▪ Core earnings plus drop income of $15.2 million(4), or $0.36
Slide 7: Recent Performance
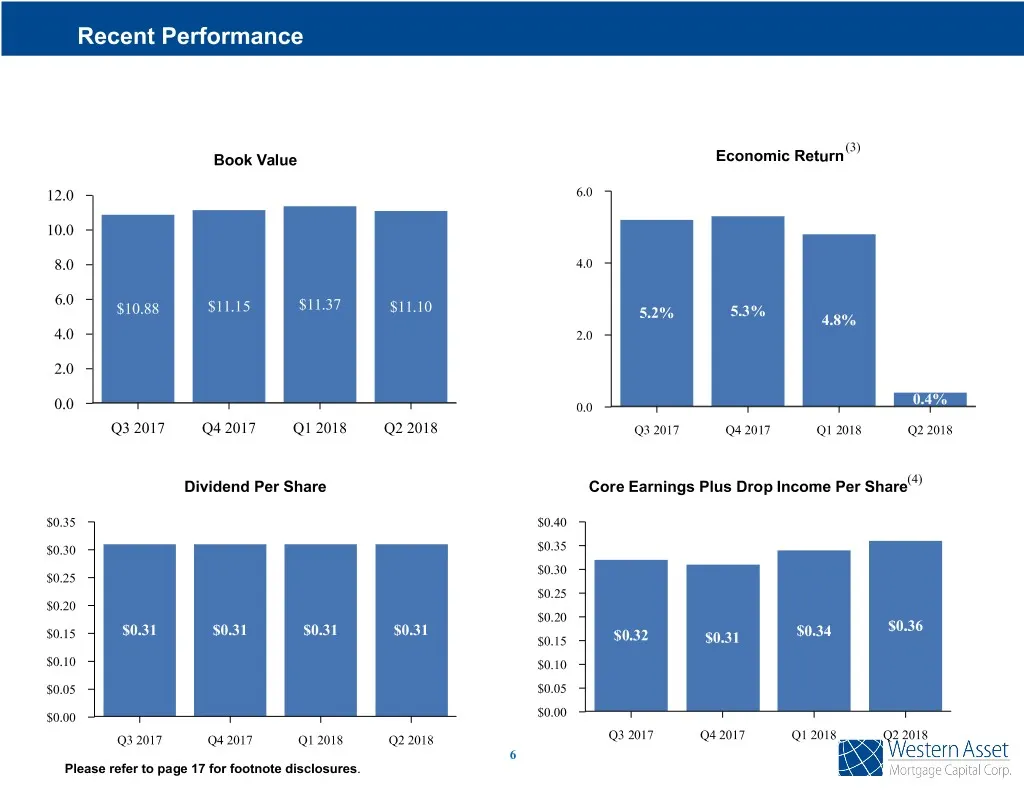
Recent Performance (3) Book Value Economic Return 12.0 6.0 10.0 8.0 4.0 6.0 $10.88 $11.15 $11.37 $11.10 5.3% 5.2% 4.8% 4.0 2.0 2.0 0.4% 0.0 0.0 Q3 2017 Q4 2017 Q1 2018 Q2 2018 Q3 2017 Q4 2017 Q1 2018 Q2 2018 (4) Dividend Per Share Core Earnings Plus Drop Income Per Share $0.35 $0.40 $0.30 $0.35 $0.3
Slide 8: Portfolio Composition
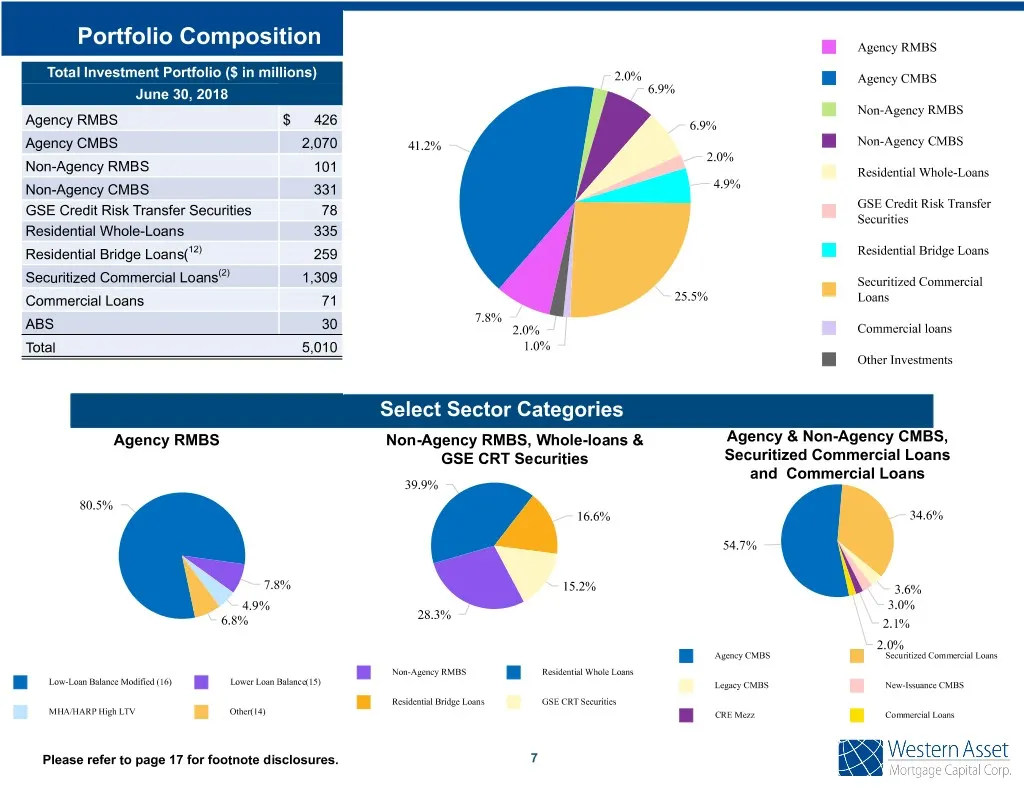
Portfolio Composition Agency RMBS Total Investment Portfolio ($ in millions) 2.0% Agency CMBS June 30, 2018 6.9% Non-Agency RMBS Agency RMBS $ 426 6.9% Agency CMBS 2,070 41.2% Non-Agency CMBS 2.0% Non-Agency RMBS 101 Residential Whole-Loans Non-Agency CMBS 331 4.9% GSE Credit Risk Transfer Securitie
Slide 9: Portfolio Income Attribution
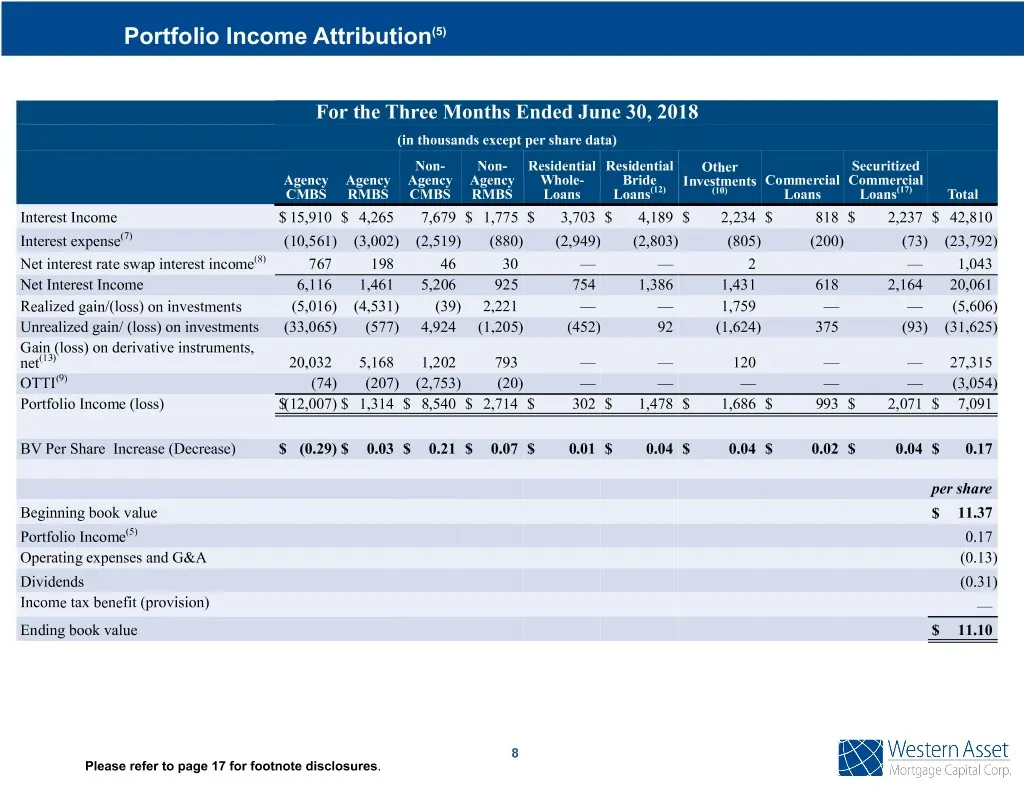
Portfolio Income Attribution(5) For the Three Months Ended June 30, 2018 (in thousands except per share data) Non- Non- Residential Residential Other Securitized Agency Agency Agency Agency Whole- Bride Investments Commercial Commercial CMBS RMBS CMBS RMBS Loans Loans(12) (10) Loans Loans(17) Total
Slide 10: Adjusted Portfolio Composition
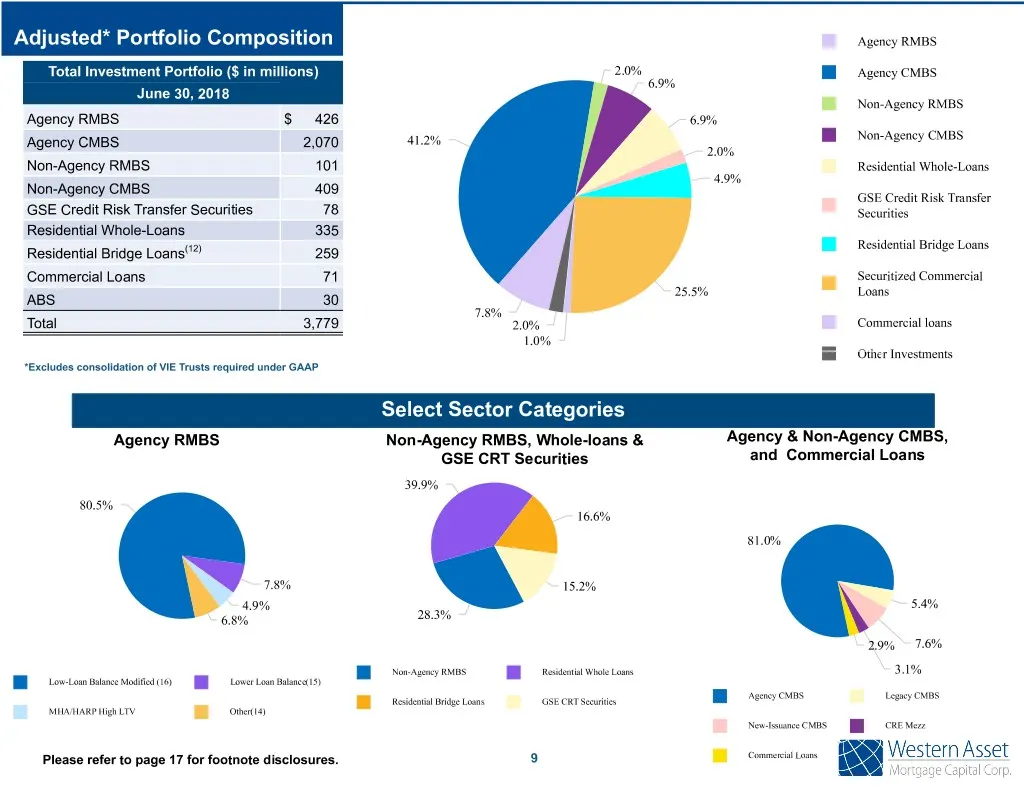
Adjusted* Portfolio Composition Agency RMBS Total Investment Portfolio ($ in millions) 2.0% Agency CMBS 6.9% June 30, 2018 Non-Agency RMBS Agency RMBS $ 426 6.9% Non-Agency CMBS Agency CMBS 2,070 41.2% 2.0% Non-Agency RMBS 101 Residential Whole-Loans 4.9% Non-Agency CMBS 409 GSE Credit Risk Transfer
Slide 11: Adjusted Portfolio Income Attribution
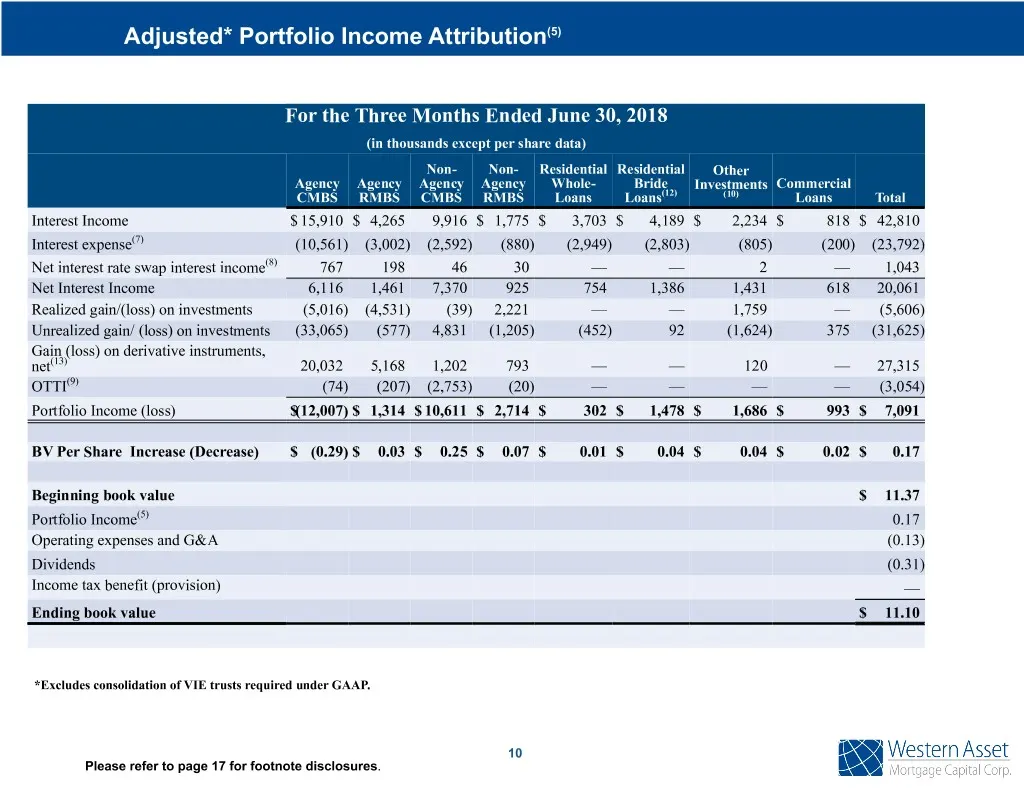
Adjusted* Portfolio Income Attribution(5) For the Three Months Ended June 30, 2018 (in thousands except per share data) Non- Non- Residential Residential Other Agency Agency Agency Agency Whole- Bride Investments Commercial CMBS RMBS CMBS RMBS Loans Loans(12) (10) Loans Total Interest Income $ 15,91
Slide 12: Financing Summary
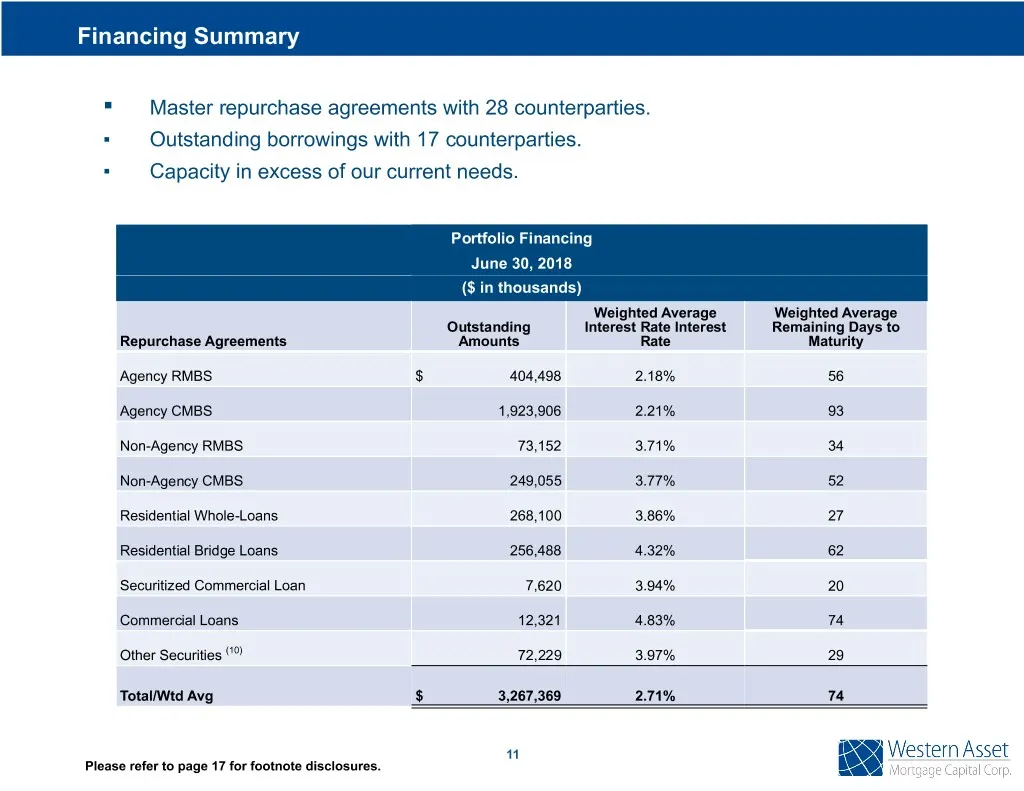
Financing Summary ▪ Master repurchase agreements with 28 counterparties. ▪ Outstanding borrowings with 17 counterparties. ▪ Capacity in excess of our current needs. Portfolio Financing June 30, 2018 ($ in thousands) Weighted Average Weighted Average Outstanding Interest Rate Interest Remaining Days
Slide 13: Hedging Summary
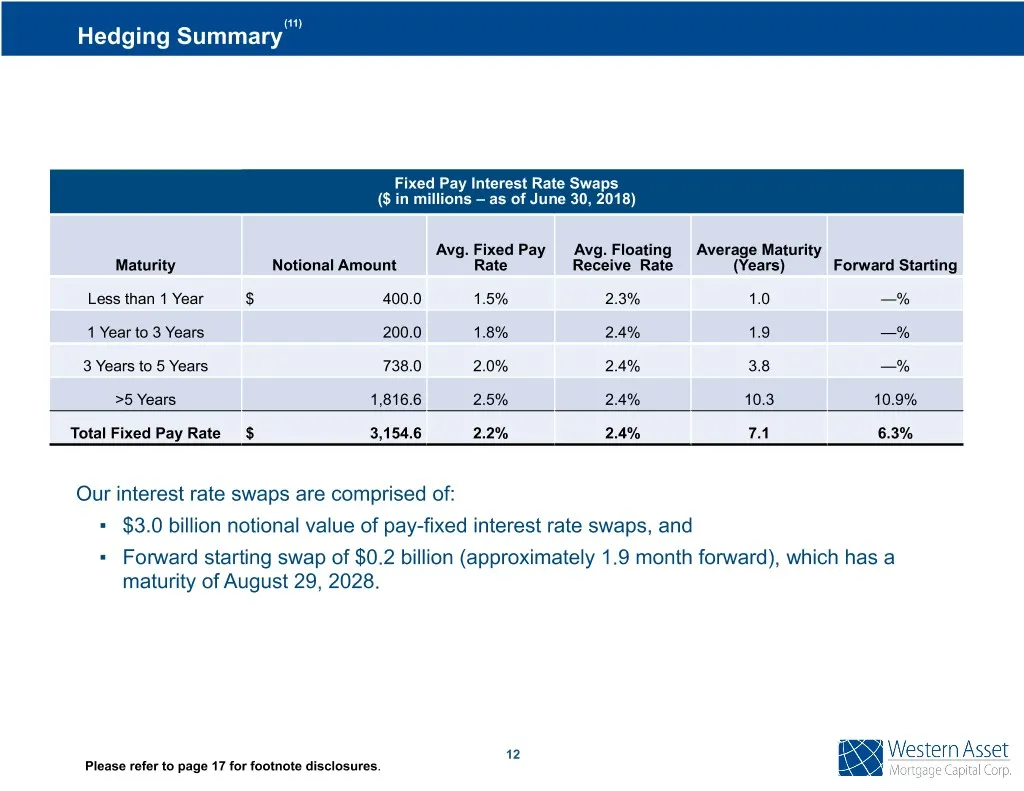
(11) Hedging Summary Fixed Pay Interest Rate Swaps ($ in millions – as of June 30, 2018) Avg. Fixed Pay Avg. Floating Average Maturity Maturity Notional Amount Rate Receive Rate (Years) Forward Starting Less than 1 Year $ 400.0 1.5% 2.3% 1.0 —% 1 Year to 3 Years 200.0 1.8% 2.4% 1.9 —% 3 Years to 5 Y
Slide 14: Duration and Key Rate Duration
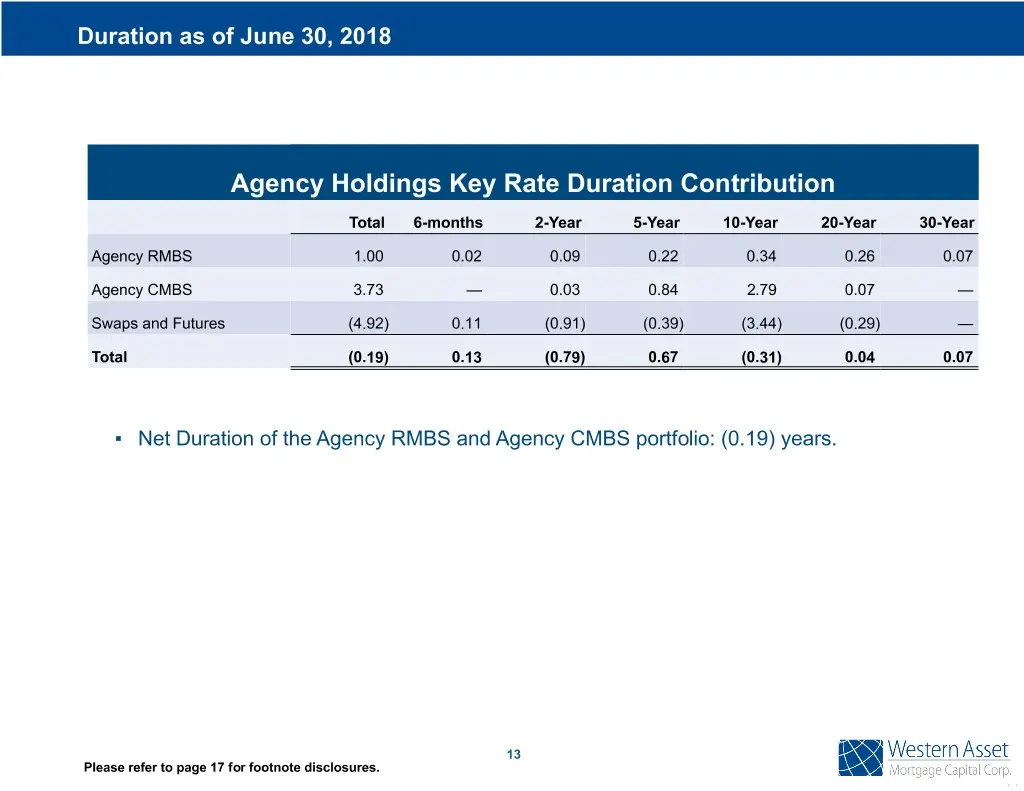
Duration as of June 30, 2018 Agency Holdings Key Rate Duration Contribution Total 6-months 2-Year 5-Year 10-Year 20-Year 30-Year Agency RMBS 1.00 0.02 0.09 0.22 0.34 0.26 0.07 Agency CMBS 3.73 — 0.03 0.84 2.79 0.07 — Swaps and Futures (4.92) 0.11 (0.91) (0.39) (3.44) (0.29) — Total (0.19) 0.13 (0.79
Slide 15: 2018 Macroeconomic Outlook
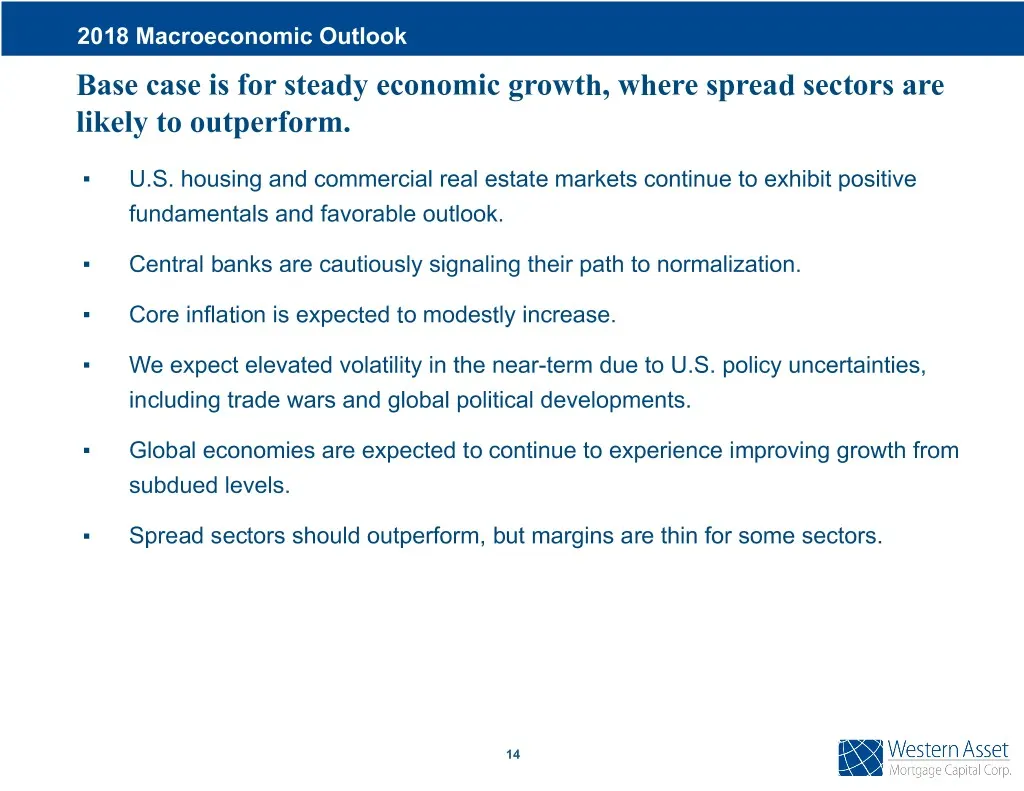
2018 Macroeconomic Outlook Base case is for steady economic growth, where spread sectors are likely to outperform. ▪ U.S. housing and commercial real estate markets continue to exhibit positive fundamentals and favorable outlook. ▪ Central banks are cautiously signaling their path to normalization.
Slide 16: Portfolio View
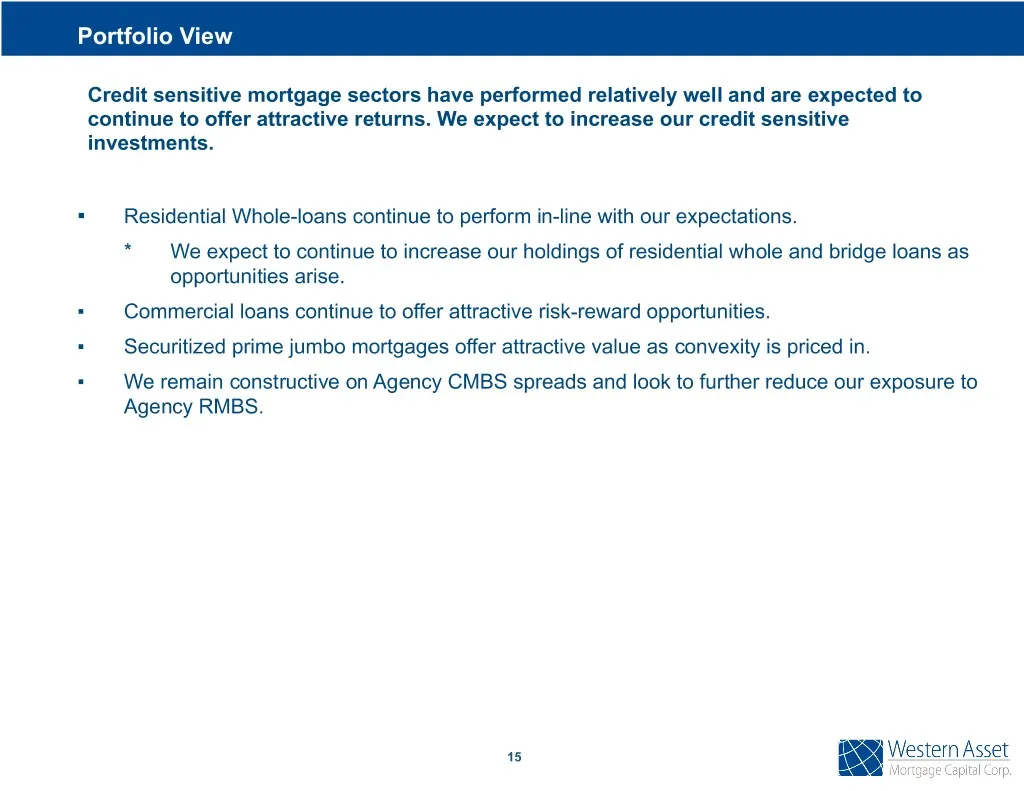
Portfolio View Credit sensitive mortgage sectors have performed relatively well and are expected to continue to offer attractive returns. We expect to increase our credit sensitive investments. ▪ Residential Whole-loans continue to perform in-line with our expectations. * We expect to continue to in
Slide 17: Target Investment Opportunities
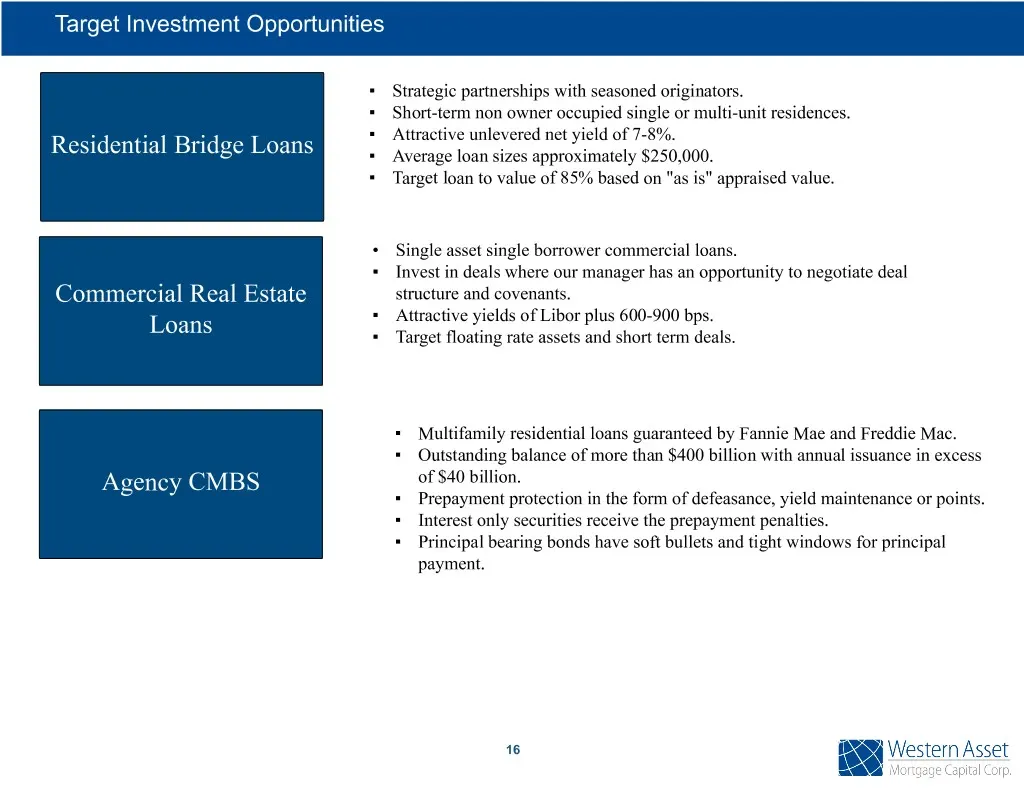
Target Investment Opportunities ▪ Strategic partnerships with seasoned originators. ▪ Short-term non owner occupied single or multi-unit residences. ▪ Attractive unlevered net yield of 7-8%. Residential Bridge Loans ▪ Average loan sizes approximately $250,000. ▪ Target loan to value of 85% based on
Slide 18: Footnotes
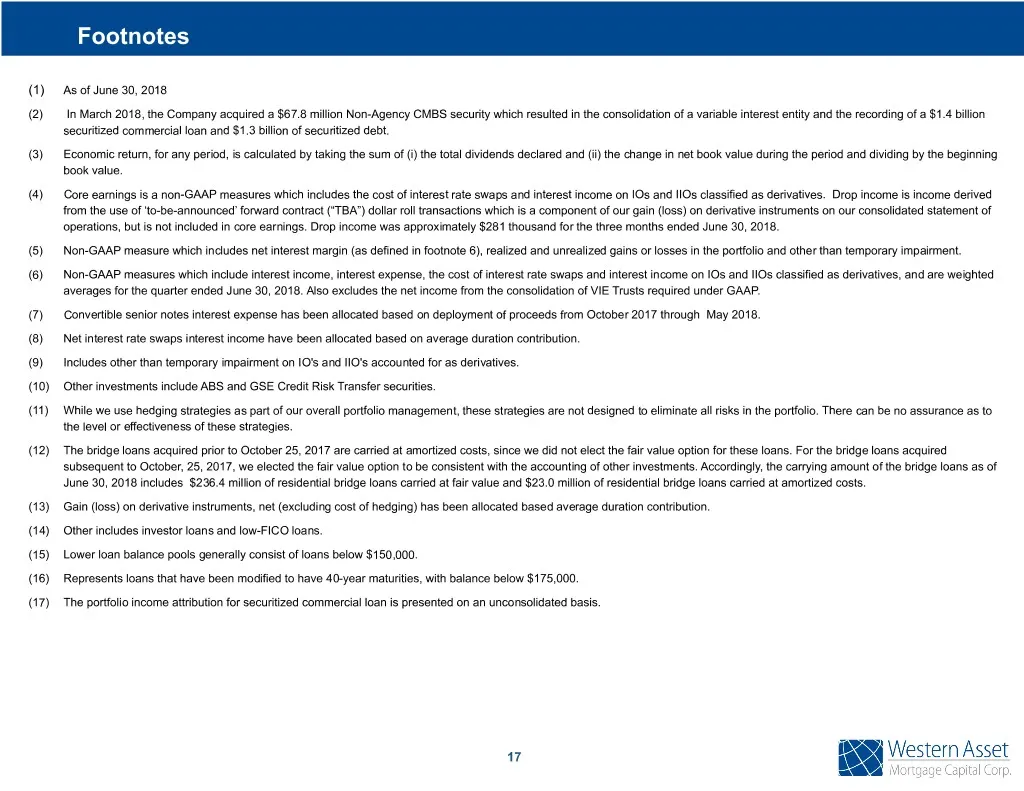
Footnotes (1) As of June 30, 2018 (2) In March 2018, the Company acquired a $67.8 million Non-Agency CMBS security which resulted in the consolidation of a variable interest entity and the recording of a $1.4 billion securitized commercial loan and $1.3 billion of securitized debt. (3) Economic retu
Slide 19: Supplemental Information
pplemental Informa Western Asset Comp.
Slide 20: Book Value Roll Forward
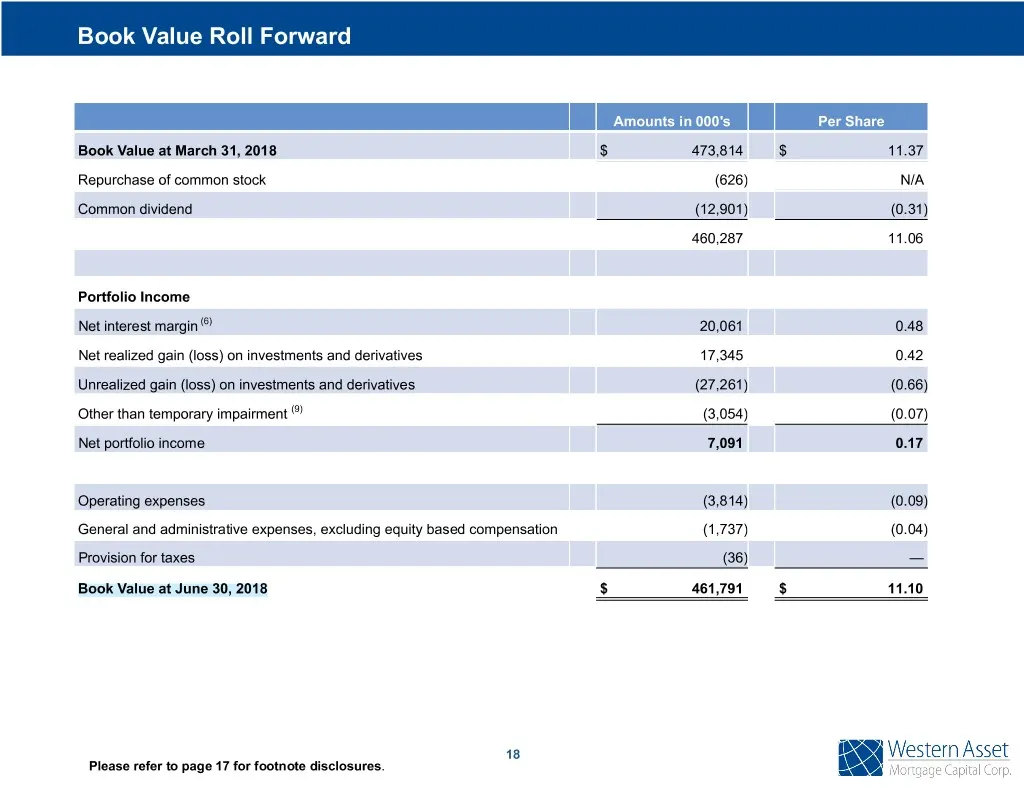
Book Value Roll Forward Amounts in 000's Per Share Book Value at March 31, 2018 $ 473,814 $ 11.37 Repurchase of common stock (626) N/A Common dividend (12,901) (0.31) 460,287 11.06 Portfolio Income Net interest margin (6) 20,061 0.48 Net realized gain (loss) on investments and derivatives 17,345 0.4
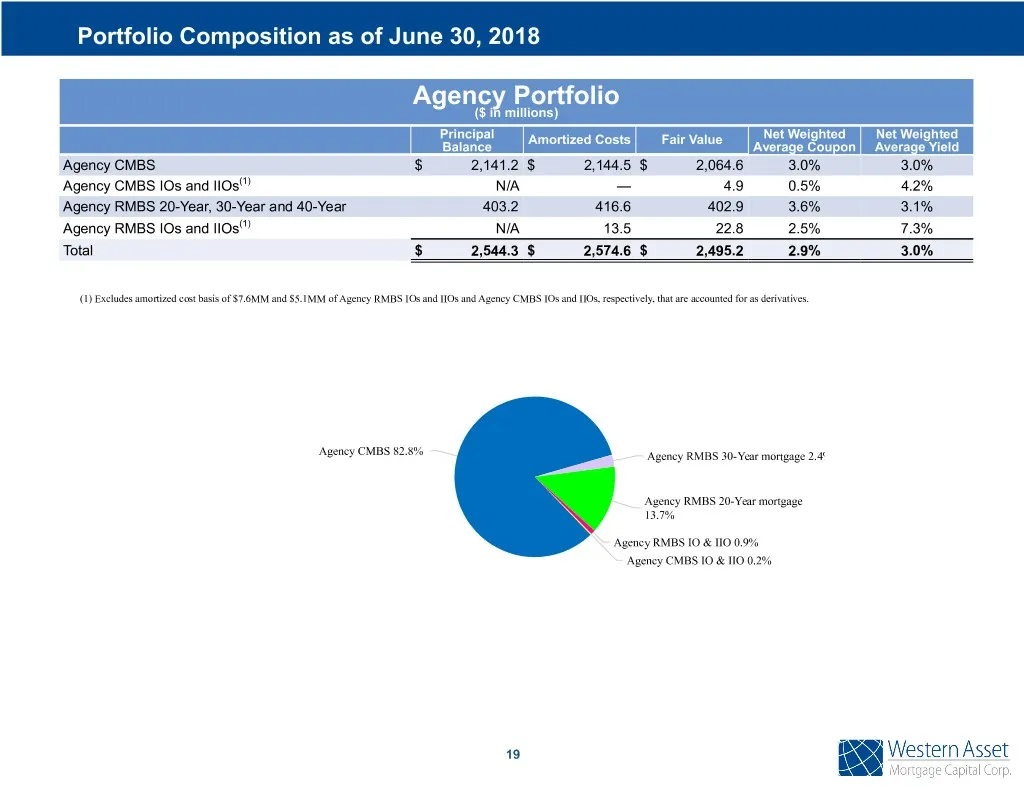
Slide 21: Portfolio Composition: Agency Portfolio
Portfolio Composition as of June 30, 2018 Agency Portfolio ($ in millions) Principal Amortized Costs Fair Value Net Weighted Net Weighted Balance Average Coupon Average Yield Agency CMBS $ 2,141.2 $ 2,144.5 $ 2,064.6 3.0% 3.0% Agency CMBS IOs and IIOs(1) N/A — 4.9 0.5% 4.2% Agency RMBS 20-Year, 30-Y
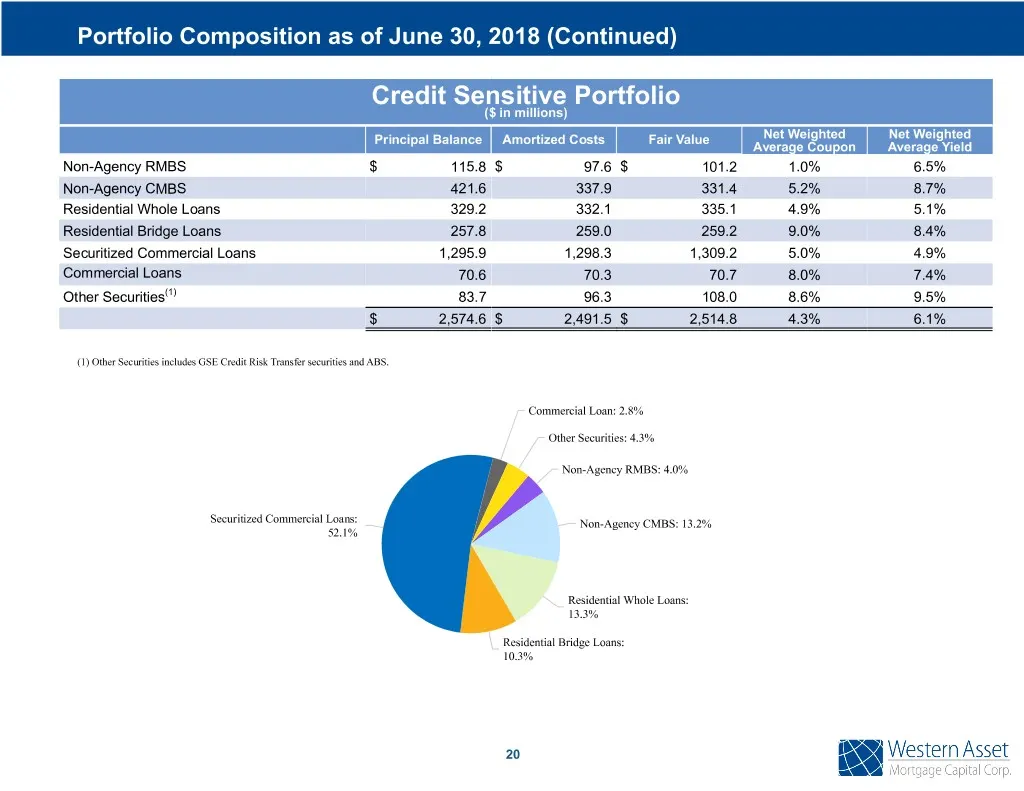
Slide 22: Portfolio Composition: Credit Sensitive Portfolio
Portfolio Composition as of June 30, 2018 (Continued) Credit Sensitive Portfolio ($ in millions) Principal Balance Amortized Costs Fair Value Net Weighted Net Weighted Average Coupon Average Yield Non-Agency RMBS $ 115.8 $ 97.6 $ 101.2 1.0% 6.5% Non-Agency CMBS 421.6 337.9 331.4 5.2% 8.7% Residentia
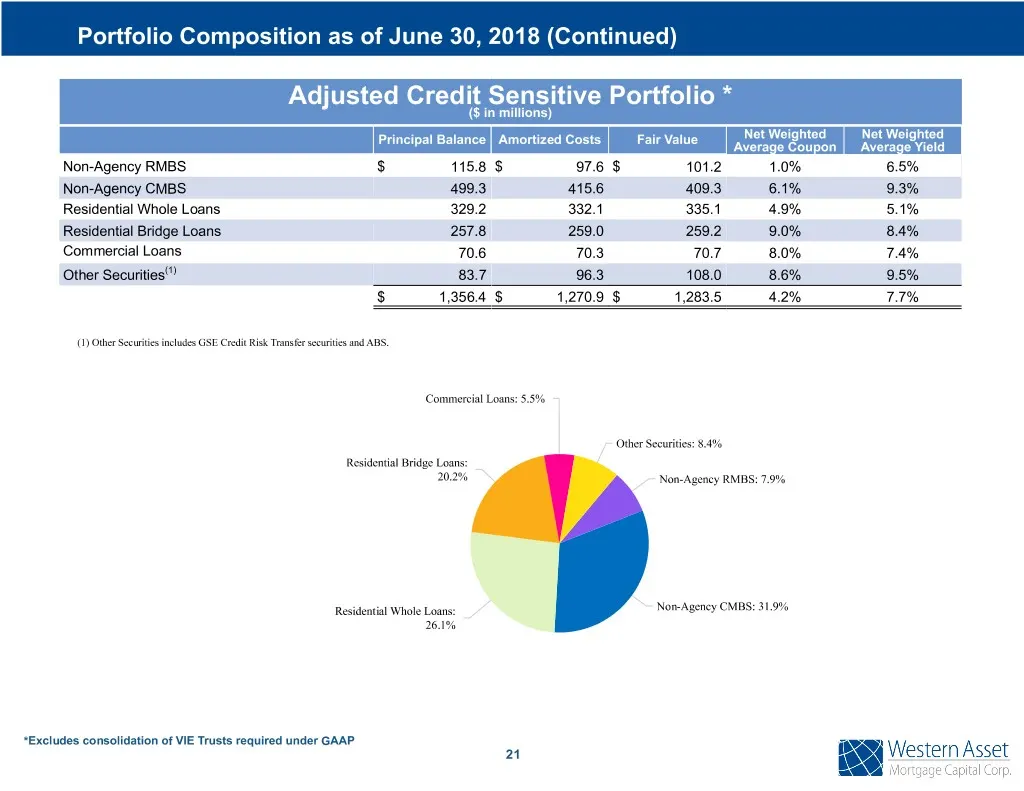
Slide 23: Adjusted Credit Sensitive Portfolio
Portfolio Composition as of June 30, 2018 (Continued) Adjusted Credit Sensitive Portfolio * ($ in millions) Principal Balance Amortized Costs Fair Value Net Weighted Net Weighted Average Coupon Average Yield Non-Agency RMBS $ 115.8 $ 97.6 $ 101.2 1.0% 6.5% Non-Agency CMBS 499.3 415.6 409.3 6.1% 9.3%
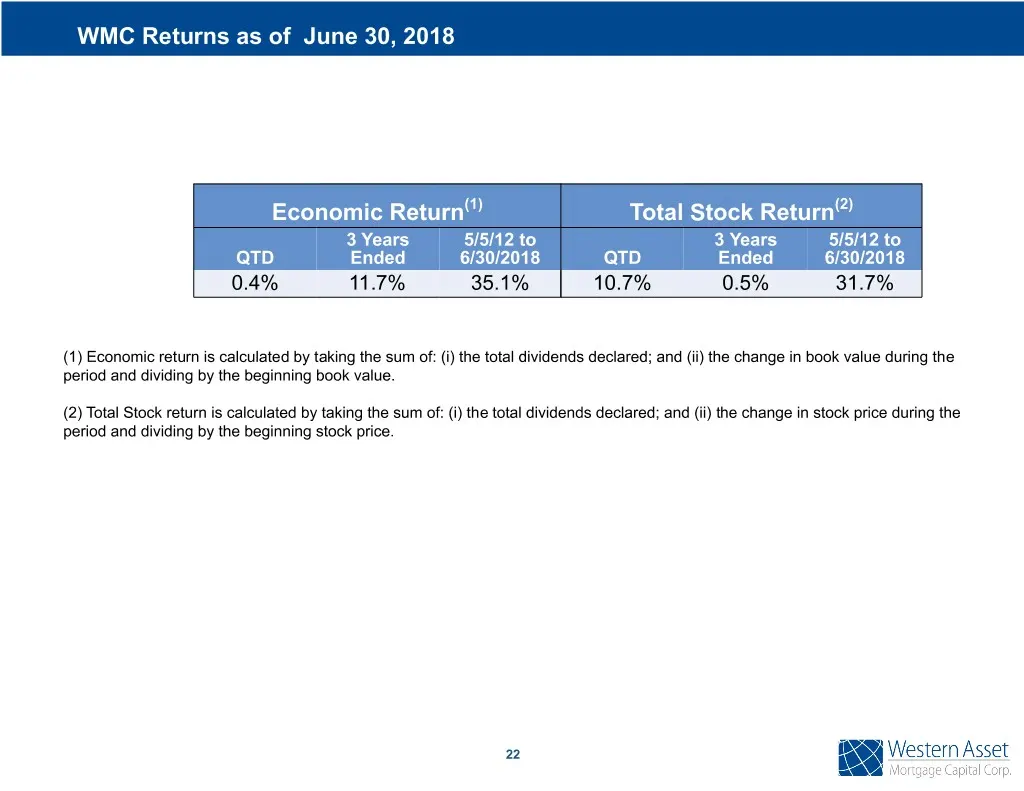
Slide 24: WMC Returns
WMC Returns as of June 30, 2018 Economic Return(1) Total Stock Return(2) 3 Years 5/5/12 to 3 Years 5/5/12 to QTD Ended 6/30/2018 QTD Ended 6/30/2018 0.4% 11.7% 35.1% 10.7% 0.5% 31.7% (1) Economic return is calculated by taking the sum of: (i) the total dividends declared; and (ii) the change in book
Slide 25: Contact Information
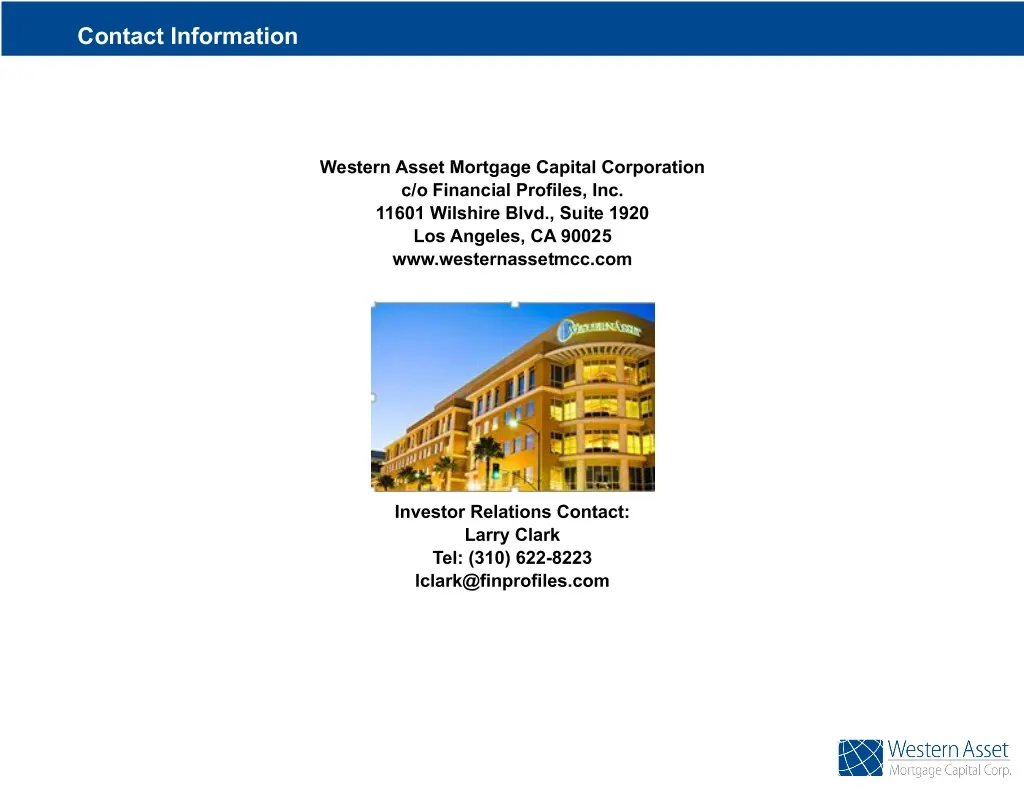
Contact Information Western Asset Mortgage Capital Corporation c/o Financial Profiles, Inc. 11601 Wilshire Blvd., Suite 1920 Los Angeles, CA 90025 www.westernassetmcc.com Investor Relations Contact: Larry Clark Tel: (310) 622-8223 [email protected]
Source: SEC EDGAR · 8-K filed Aug 6, 2018
More decks from Western Asset Mortgage Capital
 Merger or Acquisition (August 2023)9 slides · Aug 9, 2023
 Q2 2023 Earnings Presentation32 slides · Aug 8, 2023
 Merger or Acquisition (July 2023)9 slides · Jul 13, 2023
 Merger or Acquisition (June 2023)16 slides · Jun 28, 2023
 Q1 2023 Earnings Presentation33 slides · May 4, 2023
 Q4 2022 Earnings Presentation34 slides · Mar 2, 2023