MutualFirst Financial — Shareholder Meeting (April 2009)
58 slides from MutualFirst Financial's shareholder meeting presentation, Apr 28, 2009
Slide 1: MutualFirst Financial 119th Annual Meeting
MutualFirst Financial Symbol: MFSF 119th Annual Meeting April 22, 2009 ws MutualBank Goahead...live a better life!

Slide 2: Dave Heeter, President and CEO
Dave Heeter President and CEO ws MutualBank Goahead...live a better life!
Slide 3: Forward Looking Statement
Forward Looking Statement This presentation contains statements which constitute forward looking statements within the meaning of the Private Securities Litigation ReformAct of 1995. These statements may appear ina number of places in this presentation and include statements regarding the intent, be

Slide 4: MutualBank
MutualBank bankwithmutual.com ws MutualBank Goahead...live a better life!

Slide 5: The Good. The Bad. And The Future!
The Good. The Bad. And The Future!

Slide 6: The Good.
The Good.
Slide 7: MutualBank
MutualBank Goahead...live a better life!
Slide 8: MFB/MutualBank
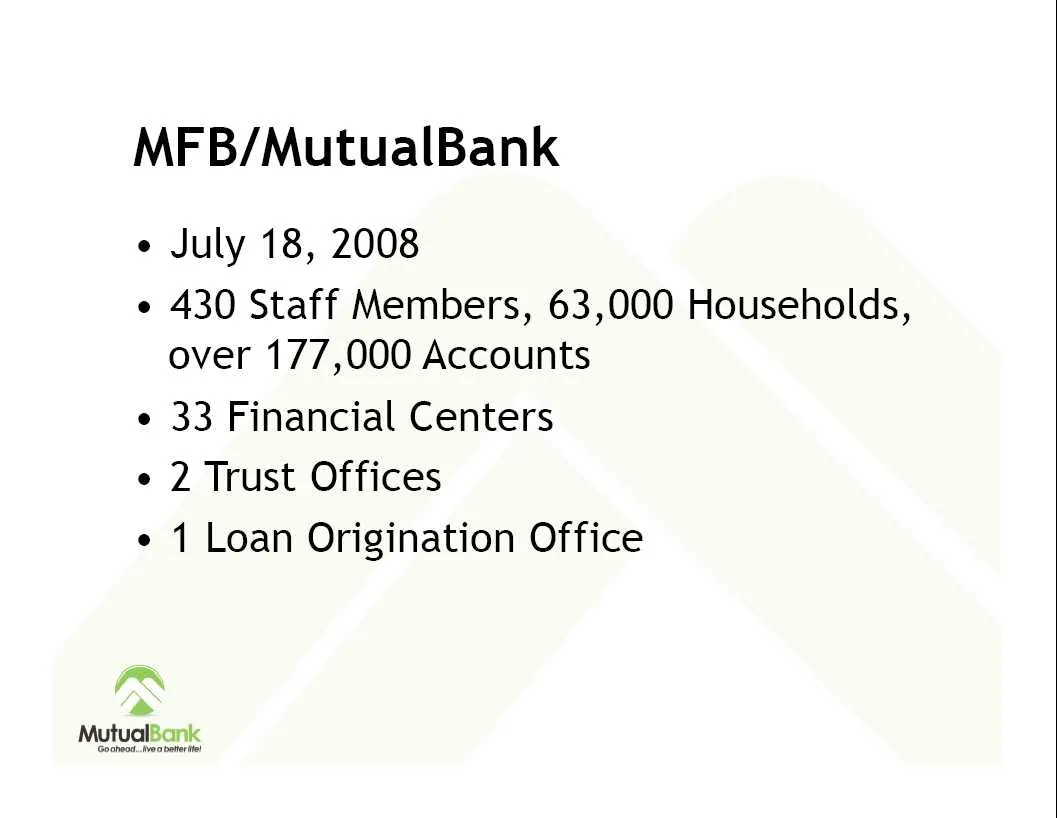
MFB/MutualBank ¢ July 18, 2008 e 430 Staff Members, 63,000 Households, over 177,000 Accounts e 33 Financial Centers e 2 Trust Offices ¢ 1 Loan Origination Office ~~ a MutucBanc
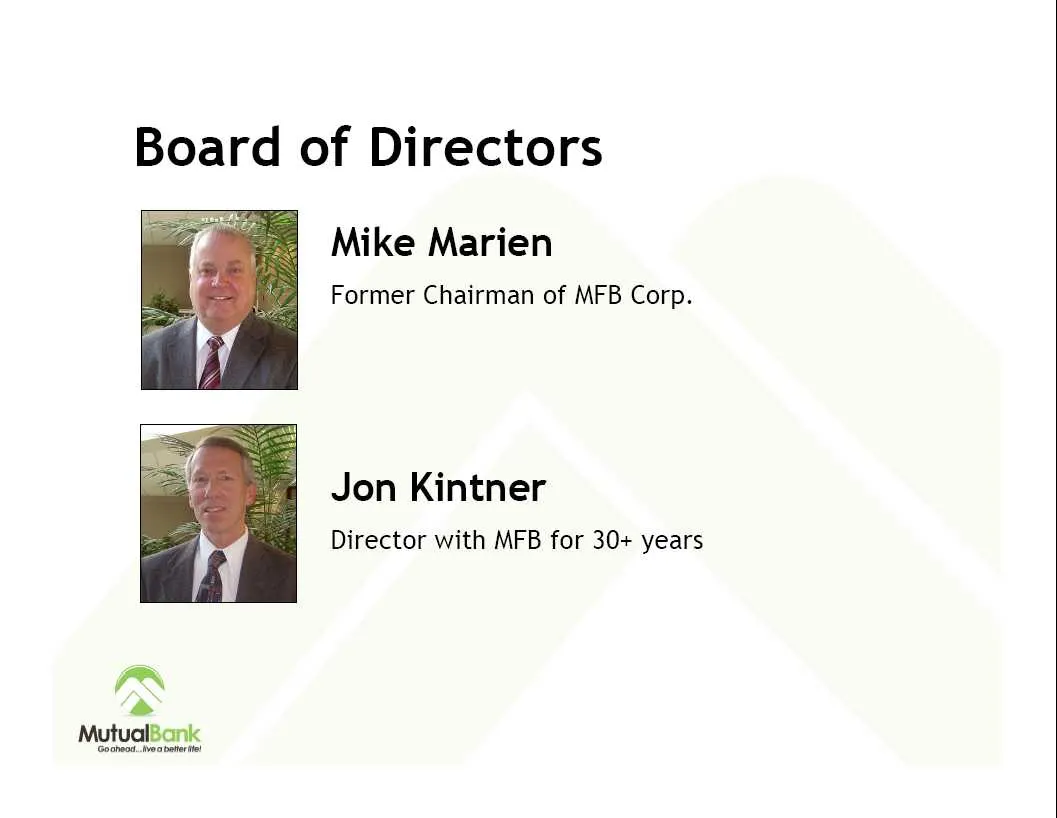
Slide 9: Board of Directors
Board of Directors Mike Marien Former Chairman of MFB Corp. Jon Kintner Director with MFB for 30+ years
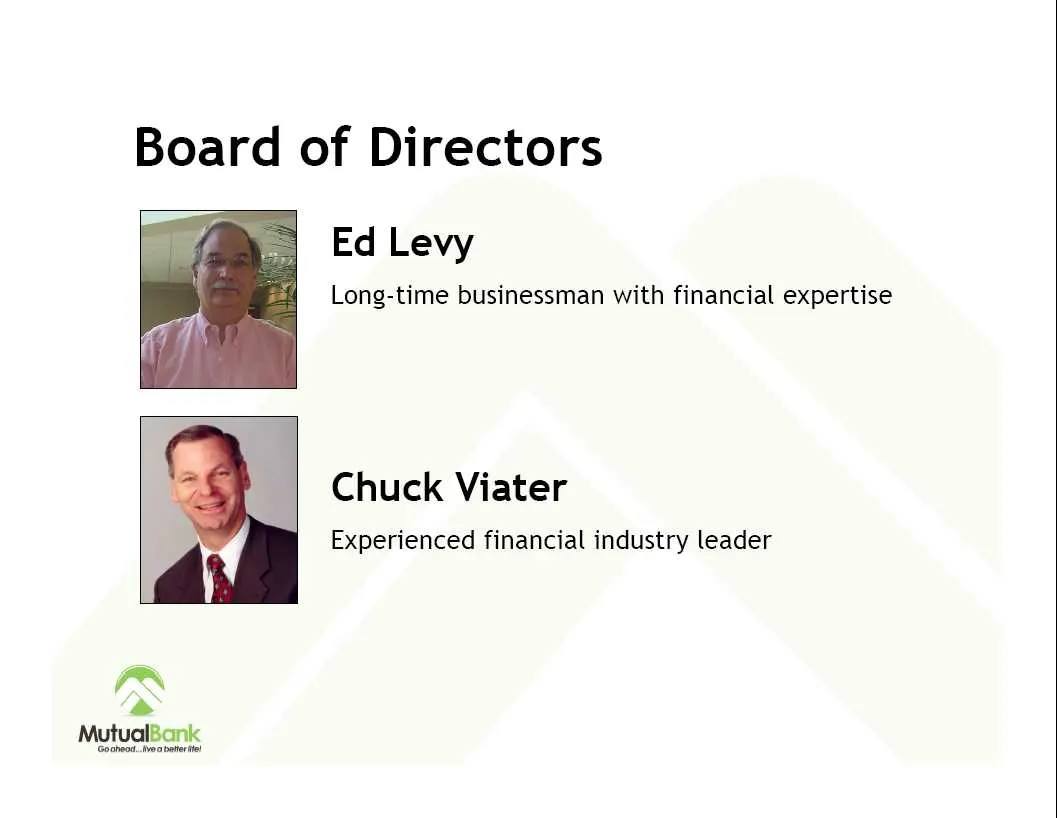
Slide 10: Board of Directors
Board of Directors Ed Levy Long-time businessman with financial expertise Chuck Viater Experienced financial industry leader
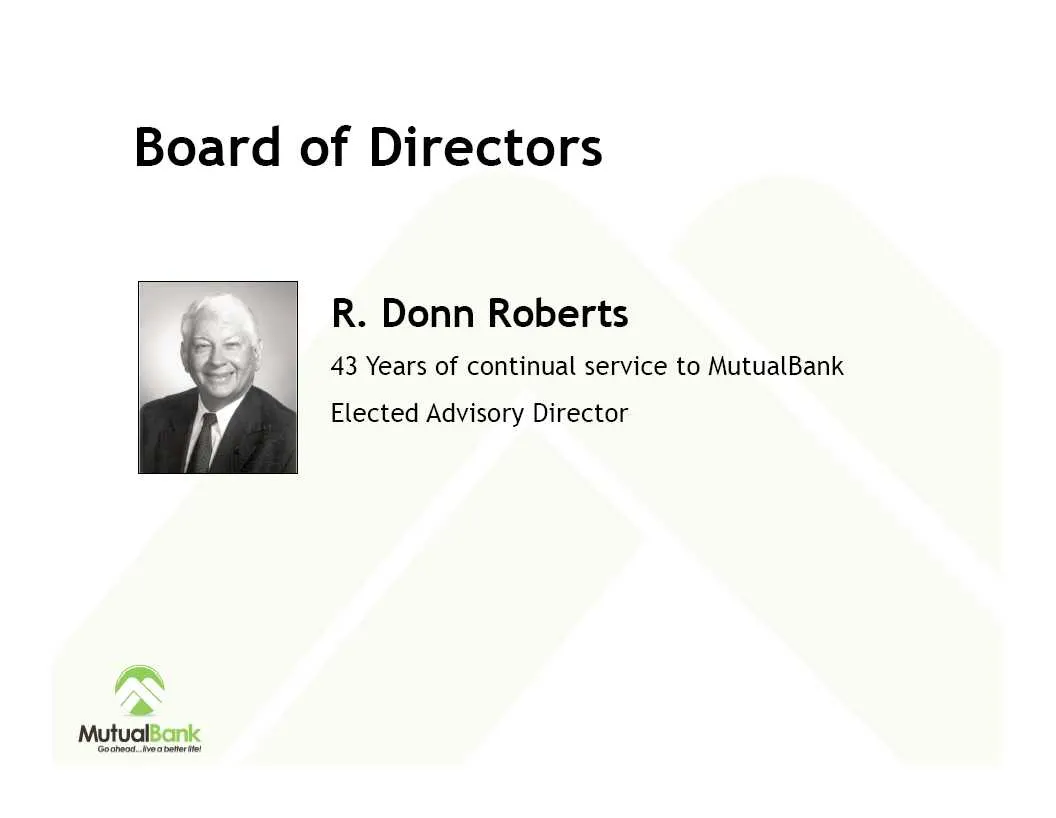
Slide 11: Board of Directors
Board of Directors R. Donn Roberts 43 Years of continual service to MutualBank Elected Advisory Director

Slide 12: MutualBank
MutualBank ws MutualBank Goahead...live a better life!
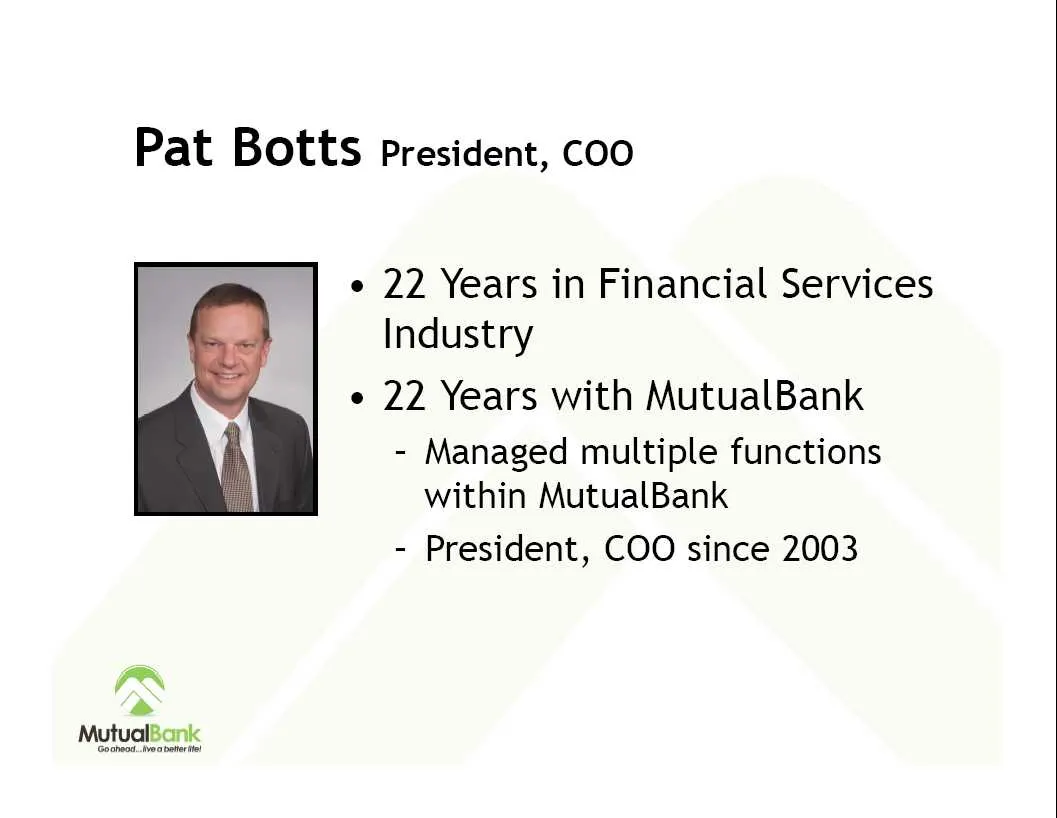
Slide 13: Pat Botts, President, COO
Pat Botts President, COO e 22 Years in Financial Services Industry e 22 Years with MutualBank - Managed multiple functions within MutualBank - President, COO since 2003
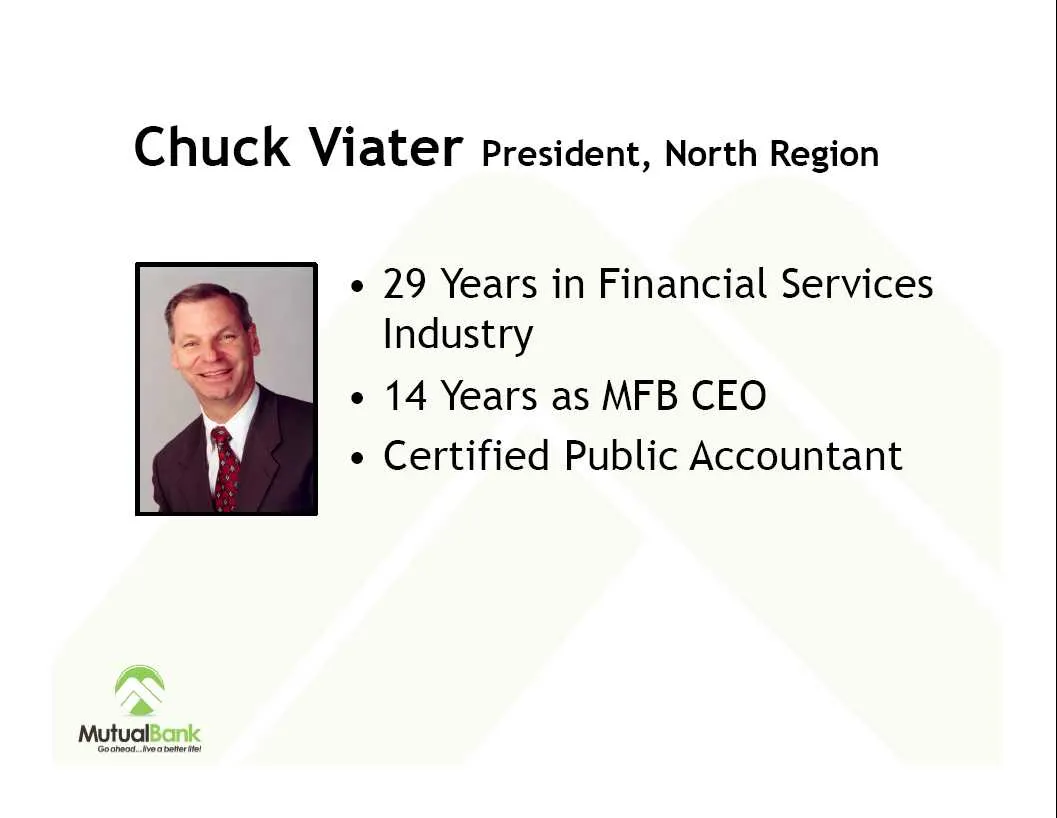
Slide 14: Chuck Viater, President, North Region
Chuck Viater President, North Region e 29 Years in Financial Services Industry e 14 Years as MFB CEO ¢ Certified Public Accountant r~ a Mulcnen
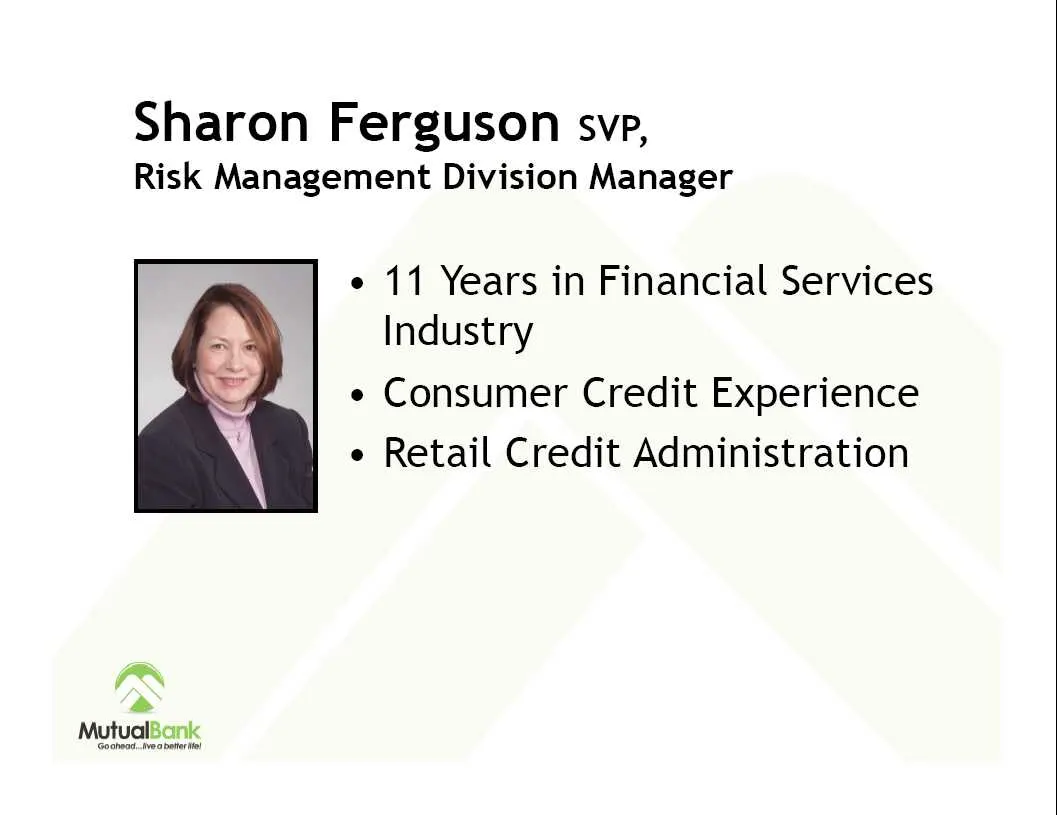
Slide 15: Sharon Ferguson, SVP
Sharon Ferguson svp, Risk Management Division Manager e 11 Years in Financial Services Industry ¢ Consumer Credit Experience e Retail Credit Administration w & MutualBank
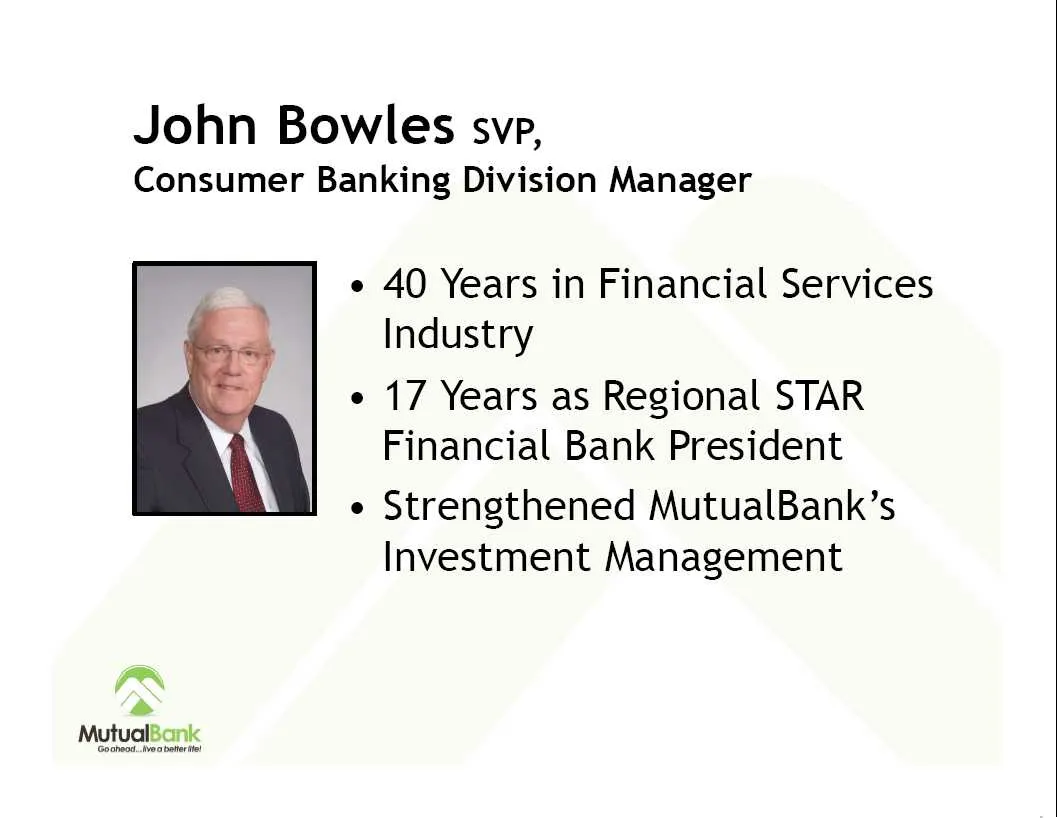
Slide 16: John Bowles, SVP
John Bowles svp, Consumer Banking Division Manager e 40 Years in Financial Services Industry e 17 Years as Regional STAR Financial Bank President e Strengthened MutualBank’s Investment Management MutucBanc
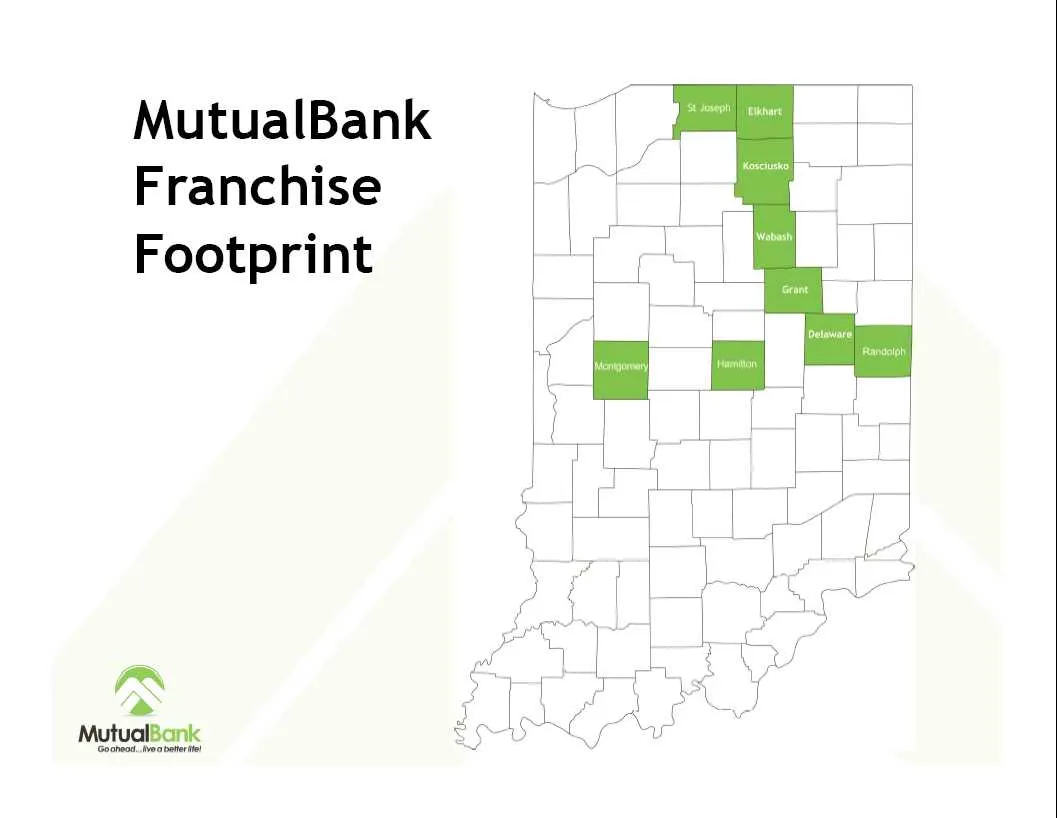
Slide 17: MutualBank Franchise Footprint
MutualBank Franchise Footprint

Slide 18: Trust, Investment, Retirement Plan Services
Trust Investment Retirement Plan Services es MutualWealth Management Group
Slide 19: Grant County Market
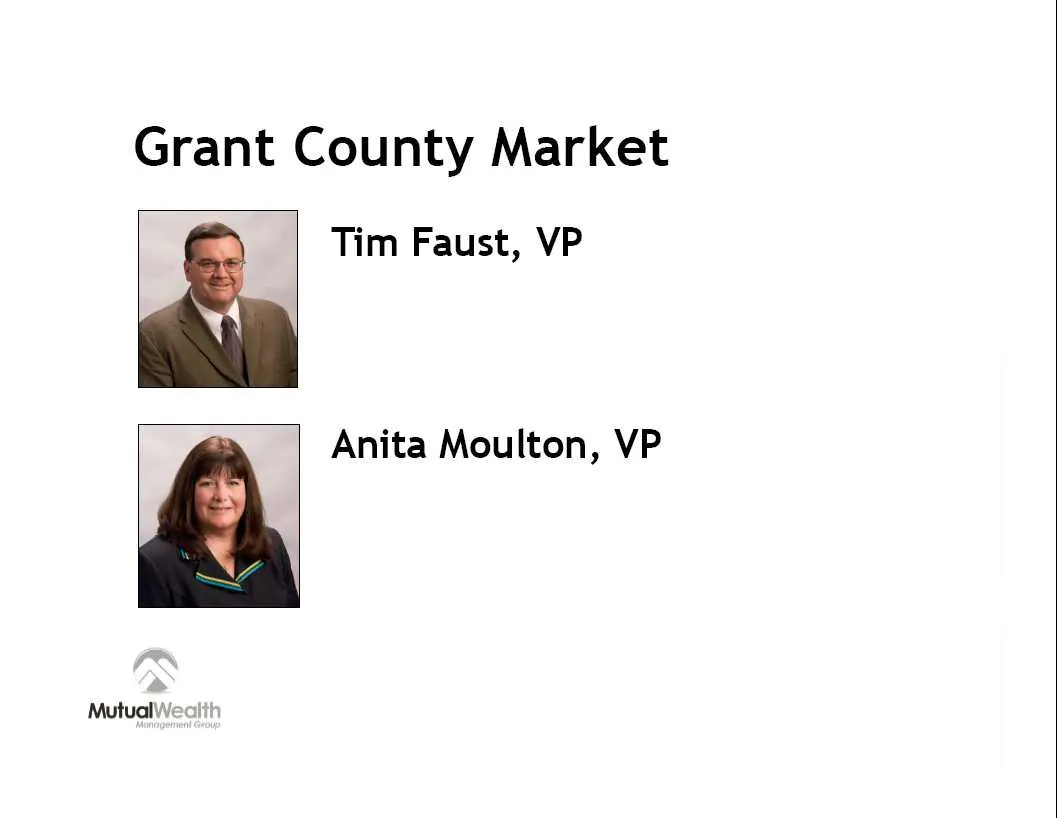
Grant County Market Tim Faust, VP Anita Moulton, VP Mutual)
Slide 20: Delaware County Market
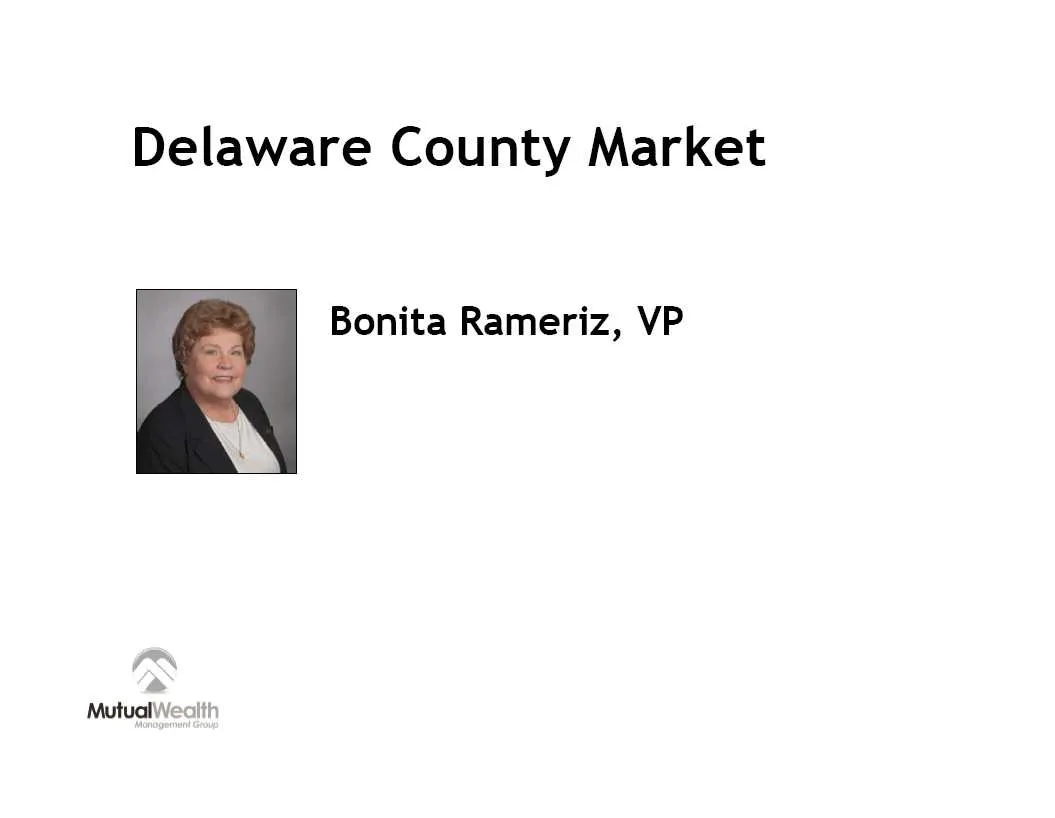
Delaware County Market Bonita Rameriz, VP MutualWeatt h

Slide 21: Retirement Plans
Retirement Plans Mutual Funds Annuities 529 Plans Stocks & Bonds 401k Rollovers es MutualFinancial Investment Services
Slide 22: 5200 Middlebury Street
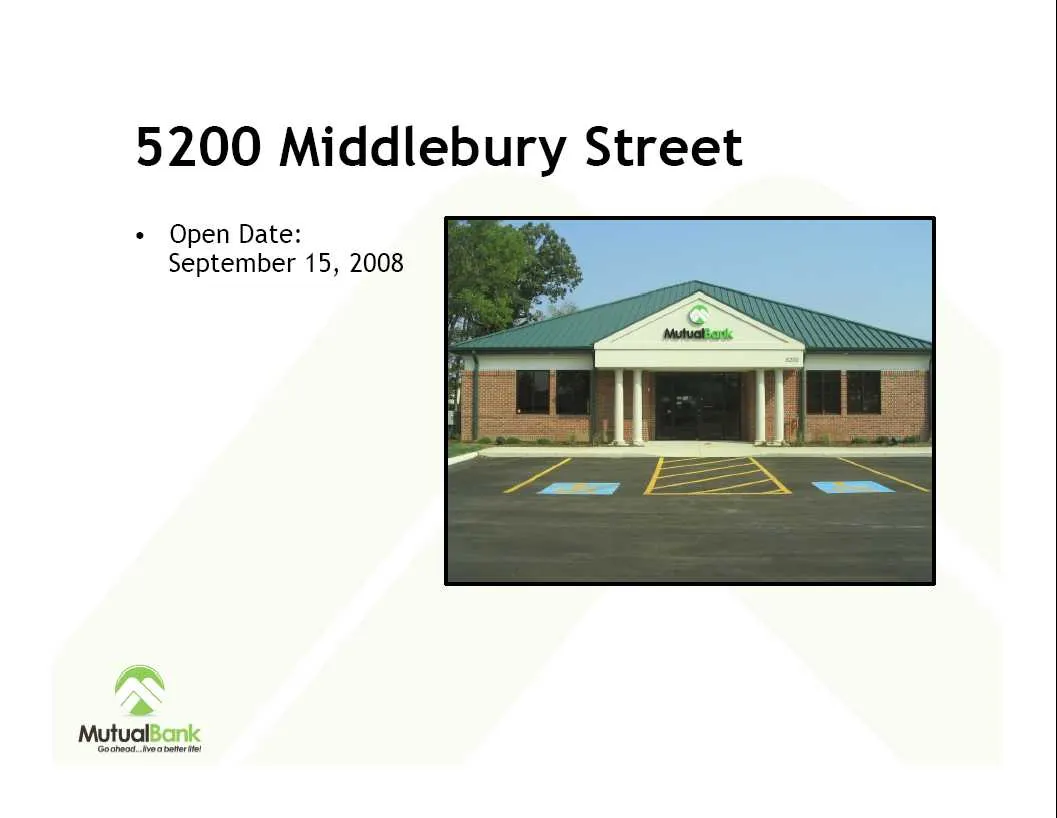
5200 Middlebury Street « Open Date: September 15, 2008

Slide 23: Mutual Federal Savings Bank is now MutualBank
We’re better than ever. Mutual Federal Savings Bank is now MutualBank. We’re turning heads with our new name and logo, but underneath all the groovy updates, you’ll find the same great bank you’ve always known and trusted. ws MutualBank Goahead...live a better life!

Slide 24: MutualBank
MutualBank bankwithmutual.com ws MutualBank Goahead...live a better life!
Slide 25: Financial Performance
Financial Performance ws MutualBank Goahead...live a better life!
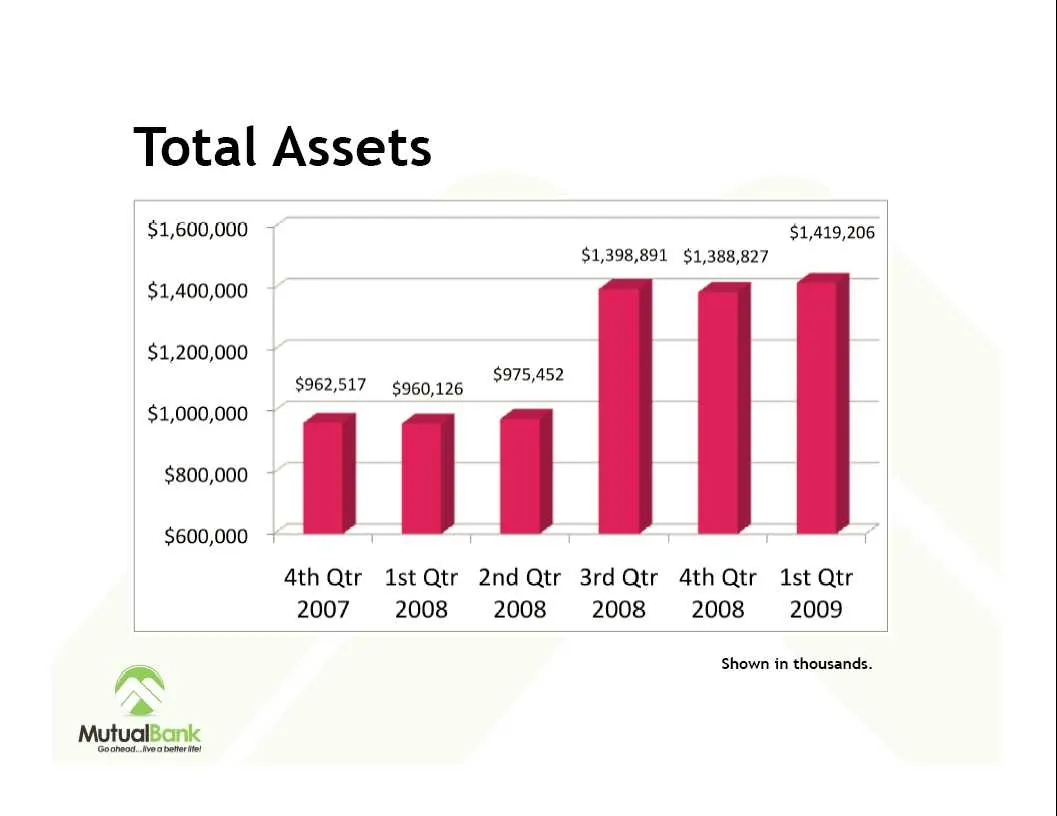
Slide 26: Total Assets
Total Assets $1,600,000 ~ $1,419,206 $1,398,891 $1,388,827 $1,400,000 ba $1,200,000 $962,517 $960,126 997945? $1,000,000 ~ $800,000 | | | $600,000 ~ = = | 4th Qtr 1st Qtr 2ndQtr 3rdQtr 4th Qtr 1st Qtr 2007. 2008 2008 2008 2008 2009 ae Shown in thousands.
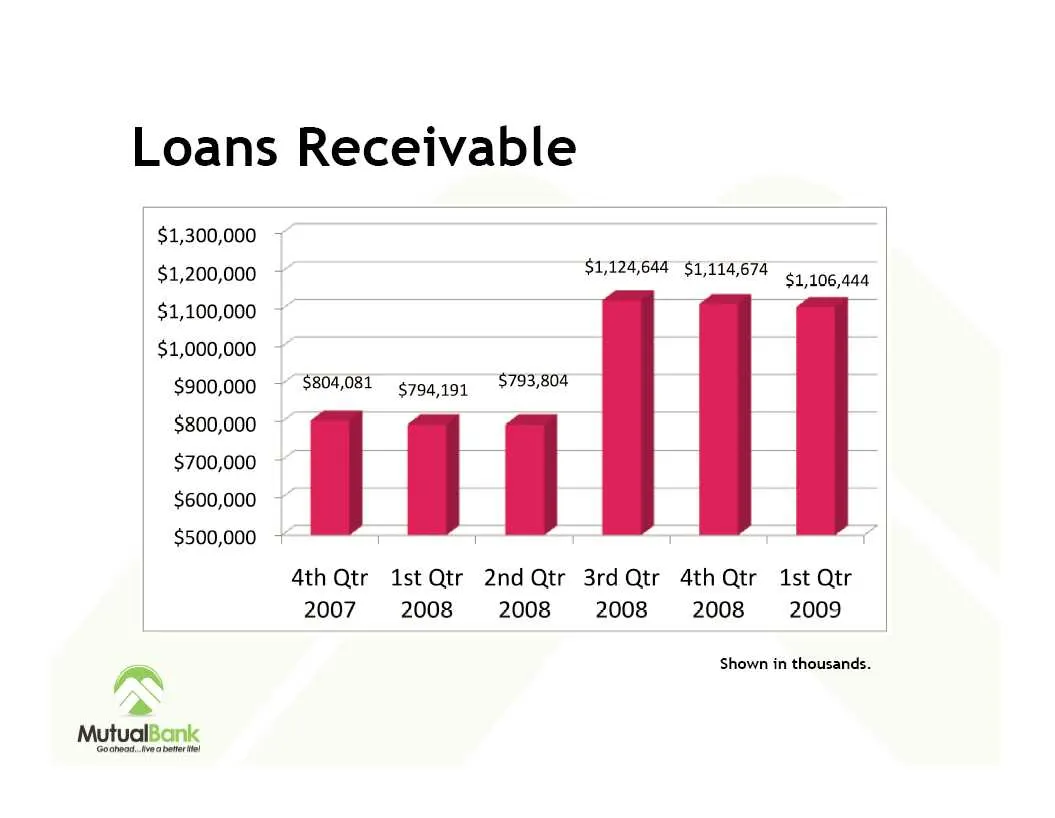
Slide 27: Loans Receivable
Loans Receivable $1,300,000 ~ $1,200,000 ~ $1,124,644 $1,114,674 $1,106,444 $1,100,000 ~ $1,000,000 $900,000 ~~ $804,081 ¢794 49; $793,804 $800,000 ~ $700,000 ] i $600,000 $500,000 ~ 4th Qtr 1stQtr 2nd Qtr 3rdQtr 4thQtr 1st Qtr 2007 2008 2008 2008 2008 2009 Shown in thousands.
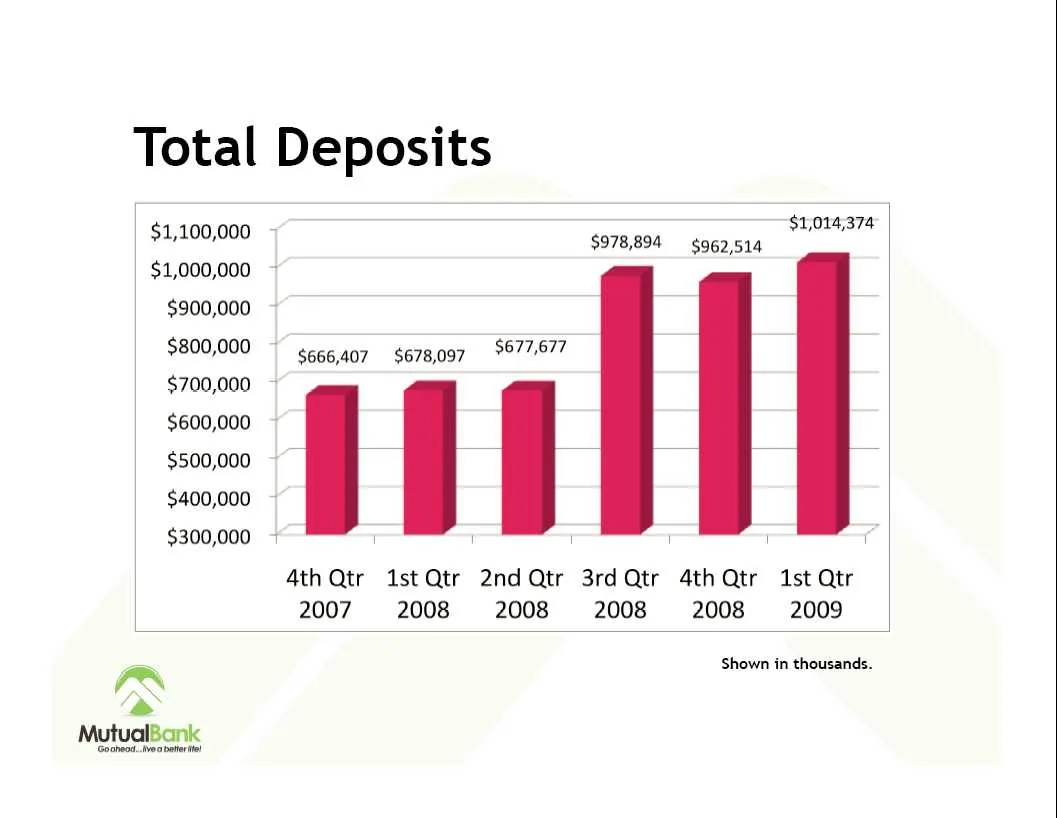
Slide 28: Total Deposits
Total Deposits 7 $1,014,374 $1,100,000 $978,894 $962,514 $1,000,000 ~ $900,000 ~ $800,000 ~ ¢666,407 $678,097 677,677 $700,000 $600,000 $500,000 i j i 1 ii $400,000 $300,000 ~ T T T T T 1 Ath Qtr 1st Qtr 2nd Qtr 3rdQtr 4th Qtr 1st Qtr 2007 2008 2008 2008 2008 2009 _ Shown in thousands. r~ a»
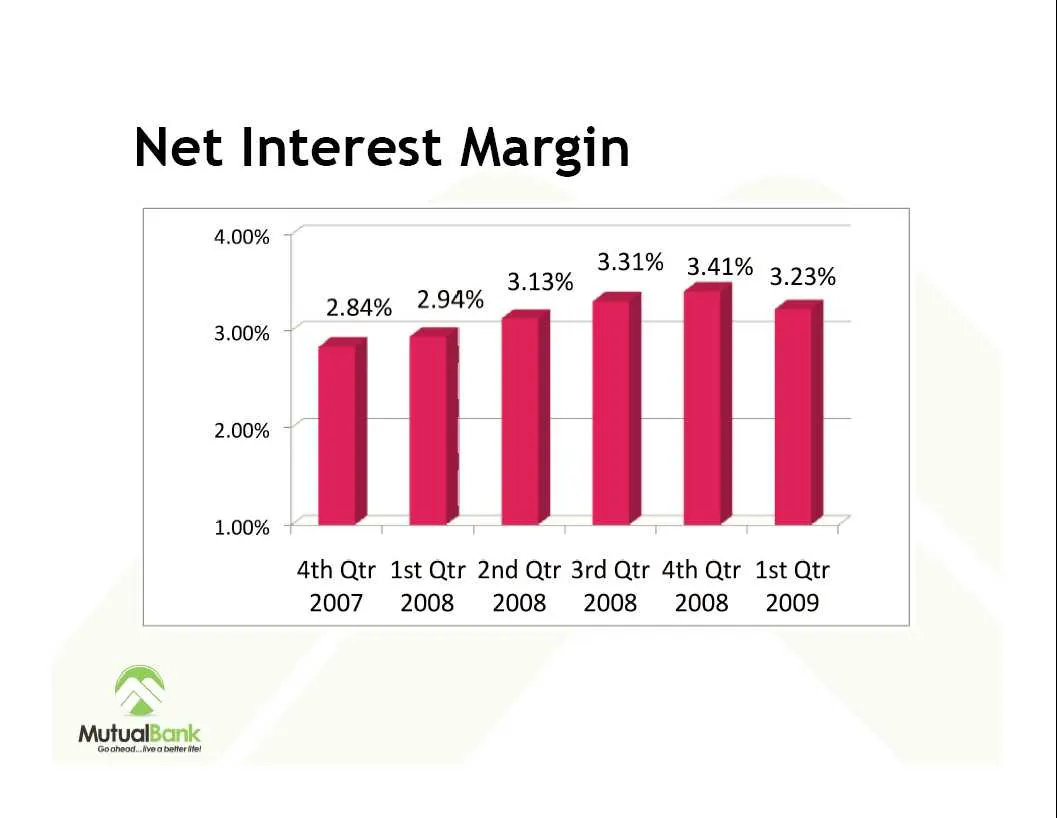
Slide 29: Net Interest Margin
Net Interest Margin 4.00% ~ 9 3.13% 331% 3.41% 3.3% 2.84% 2.94% 3.00% ~ 2.00% ~ ] | ] 1.00% ~ Ath Qtr 1st Qtr 2nd Qtr 3rd Qtr 4th Qtr 1st Qtr 2007 2008 2008 2008 2008 2009
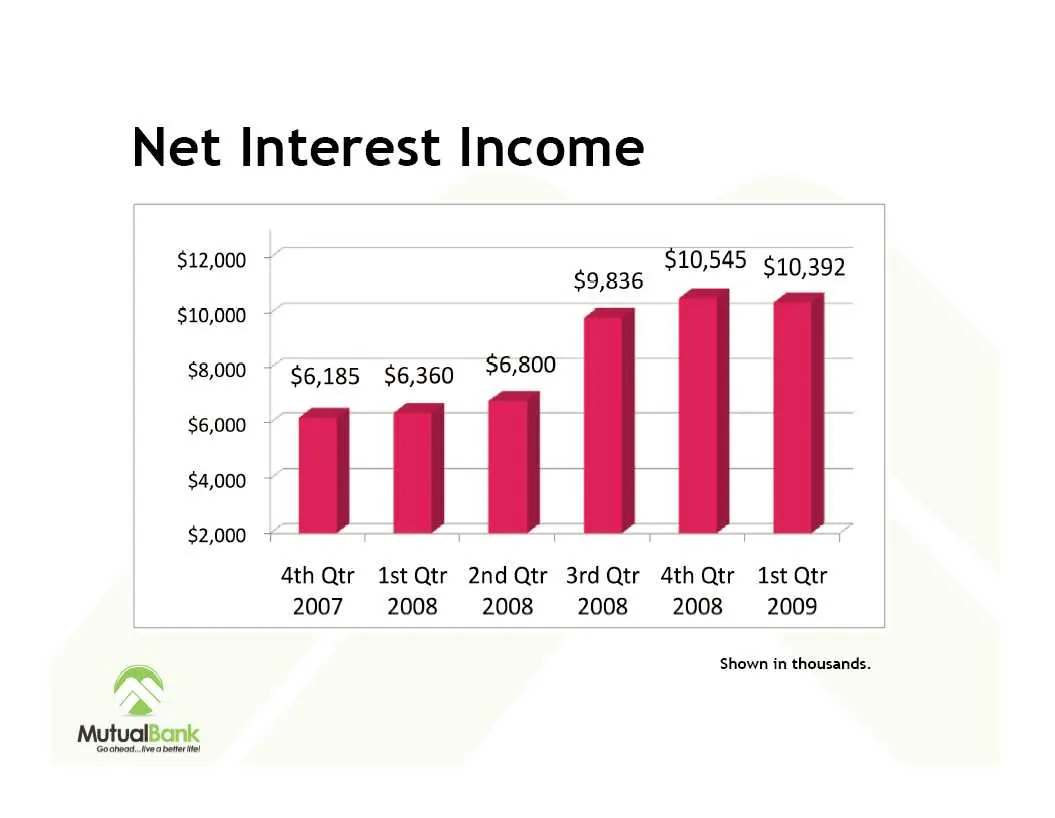
Slide 30: Net Interest Income
Net Interest Income $12,000 ~ $9,836 $10,545 $10,392 $10,000 - $8,000 ~ 6185 $6,360 6,800 $6,000 ~ $4,000 | | i $2,000 + ; 1 ; 4th Qtr 1stQtr 2ndQtr 3rd Qtr 4th Qtr 1st Qtr 2007 2008 2008 2008 2008 2009 a Shown in thousands.

Slide 31: The Bad.
The Bad.
Slide 32: General Economy
General Economy
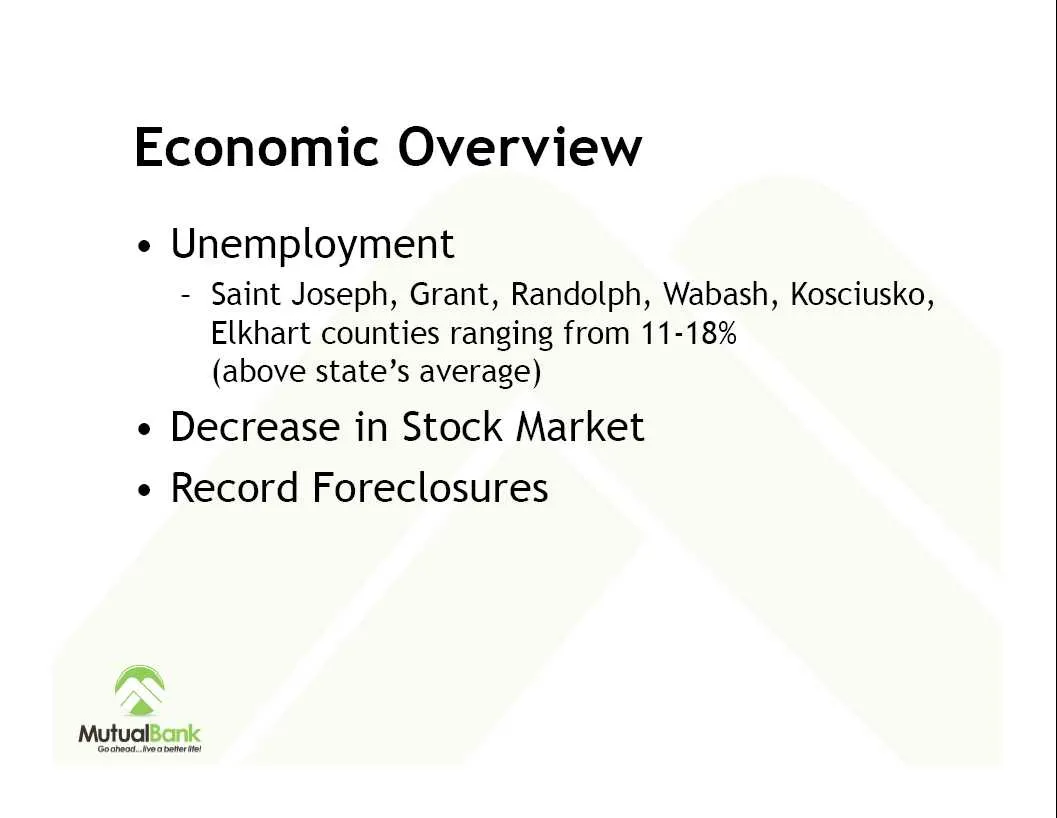
Slide 33: Economic Overview
Economic Overview e Unemployment - Saint Joseph, Grant, Randolph, Wabash, Kosciusko, Elkhart counties ranging from 11-18% (above state’s average) e Decrease in Stock Market e Record Foreclosures ~~ a MutualBank
Slide 34: Capital Purchase Plan
Capital Purchase Plan T.A.R.P.
Slide 35: Capital - Why so important?
Capital - Why so important? e Supports lending activity e Protects against loans becoming delinquent & producing loss ~~ a MutucBanc
Slide 36: Credit Quality
Credit Quality
Slide 37: Non Performing Assets / Total Assets
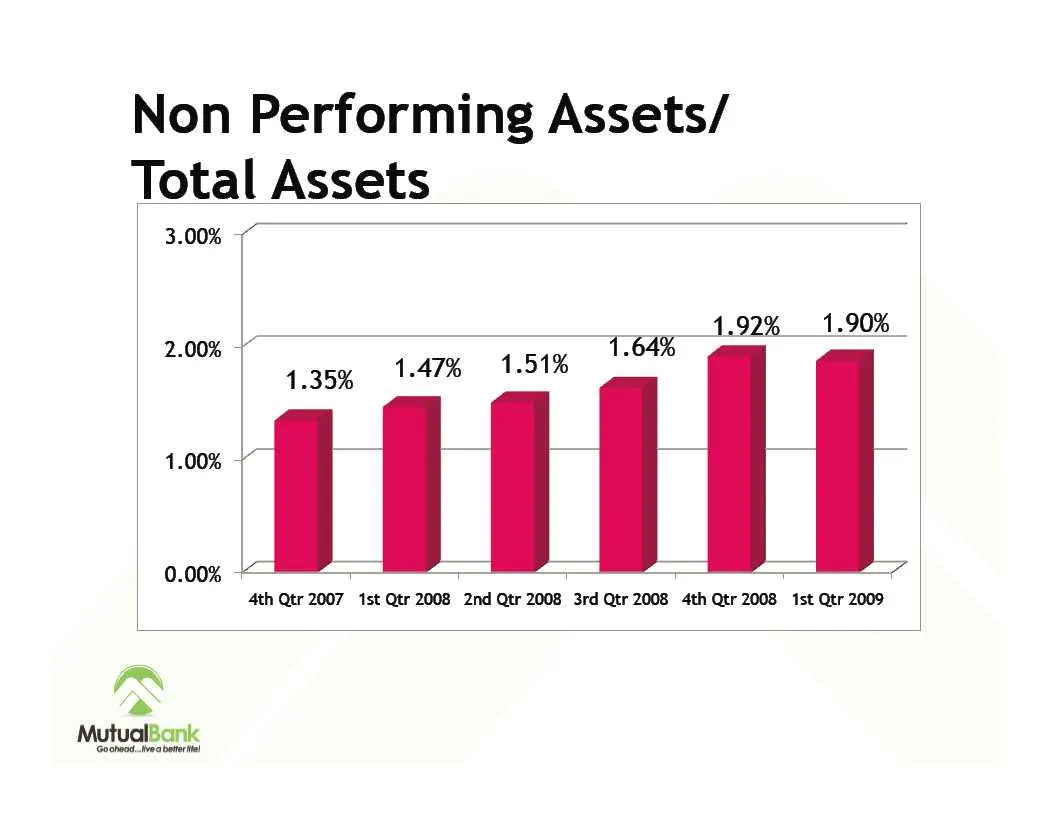
Non Performing Assets/ Total Assets 3.00% 0.00% 2.00% ~ 1.92% 1.90% 1.64% 4.35% 147% 1.51% 4th Qtr 2007 1st Qtr 2008 2nd Qtr 2008 3rd Qtr 2008 4th Qtr 2008 1st Qtr 2009
Slide 38: Non Performing Loans / Total Loans
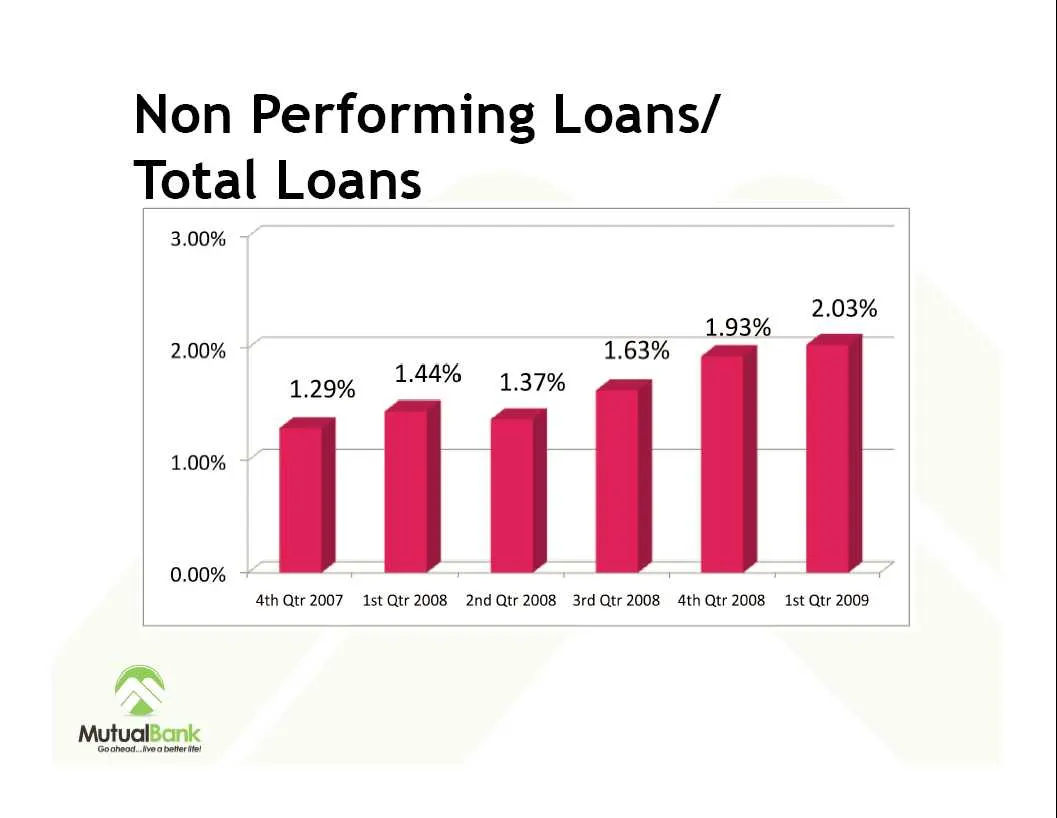
Non Performing Loans/ Total Loans 3.00% 1.93% pes 2.00% 5 1.63% 129% 144% 1.37% - J | | | 0.00% ~ * , Ath Qtr 2007 Ast Qtr 2008 2nd Qtr 2008 3rd Qtr 2008 4th Qtr 2008 1st Qtr 2009
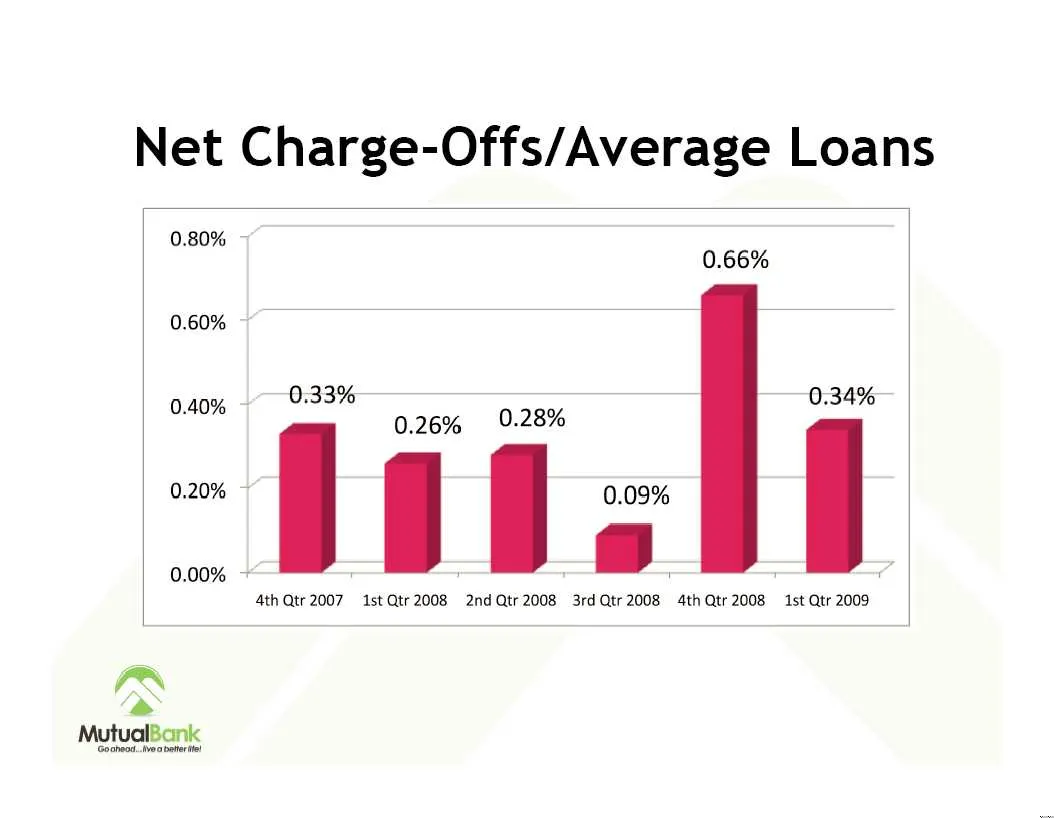
Slide 39: Net Charge-Offs / Average Loans
Net Charge-Offs/Average Loans 0.80% 0.60% 0.40% 0.20% 0.00% 0.66% 0.33% 0.34% 0.26% 9.28% Ath Qtr 2007 Ast Qtr 2008 2nd Qtr 2008 3rd Qtr 2008 4th Qtr 2008 1st Qtr 2009
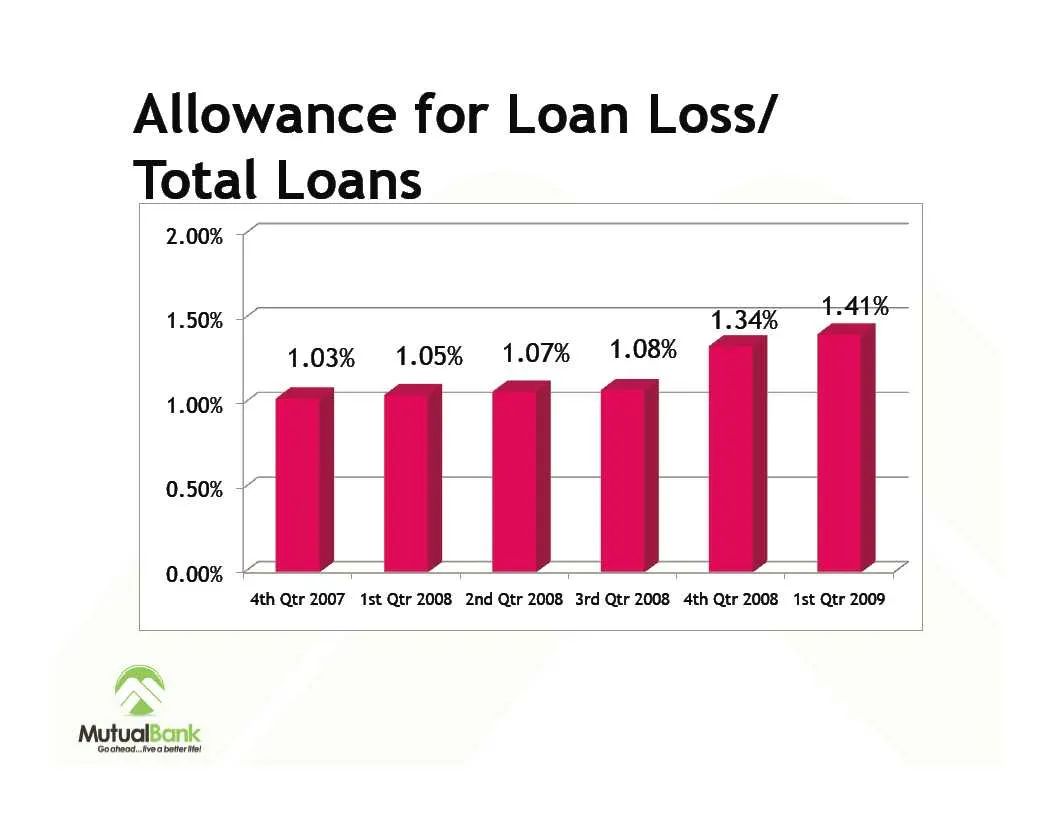
Slide 40: Allowance for Loan Loss / Total Loans
Allowance for Loan Loss/ Total Loans 2.00% 5 1.50% 1.00% 0.50% 1.34% 4.41% 1.03% 1.05% 1.07% 1.08% | | L 4th Qtr 2007 1st Qtr 2008 2nd Qtr 2008 3rd Qtr 2008 4th Qtr 2008 1st Qtr 2009
Slide 41: Impact of Accounting Rules
Impact of Accounting Rules
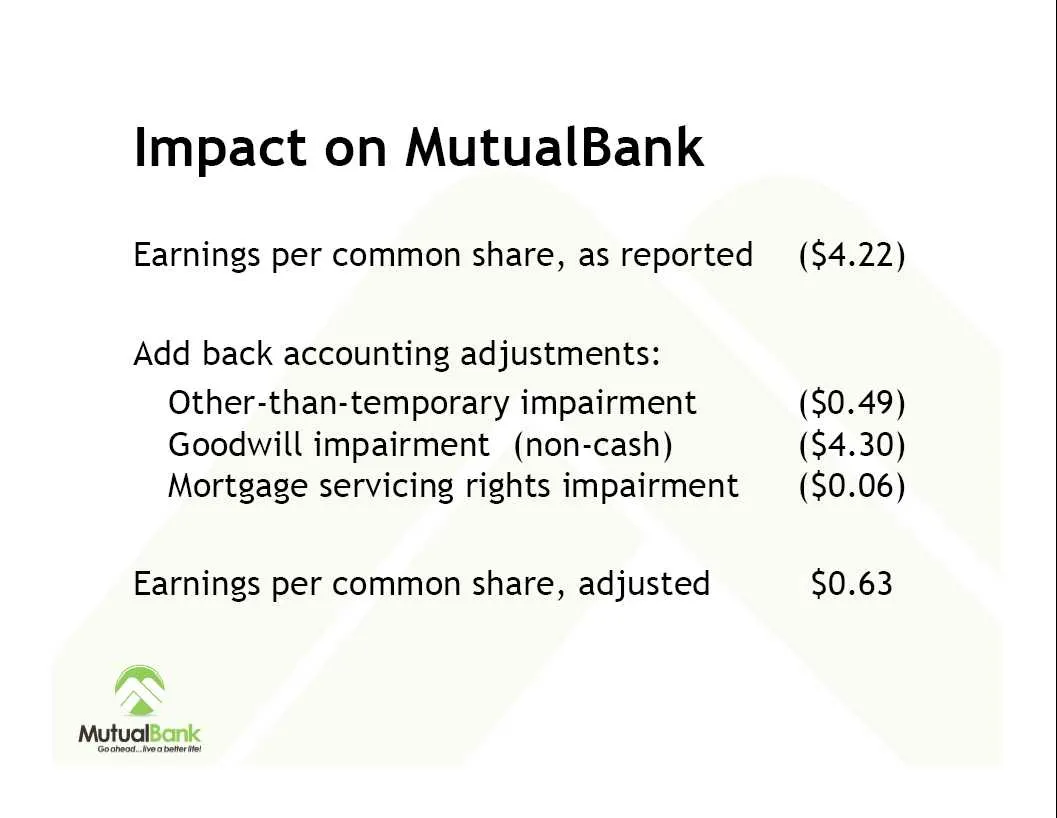
Slide 42: Impact on MutualBank
Impact on MutualBank Earnings per common share, as reported ($4.22) Add back accounting adjustments: Other-than-temporary impairment ($0.49) Goodwill impairment (non-cash) ($4.30) Mortgage servicing rights impairment ($0.06) Earnings per common share, adjusted $0.63 ~~ a MutualBank
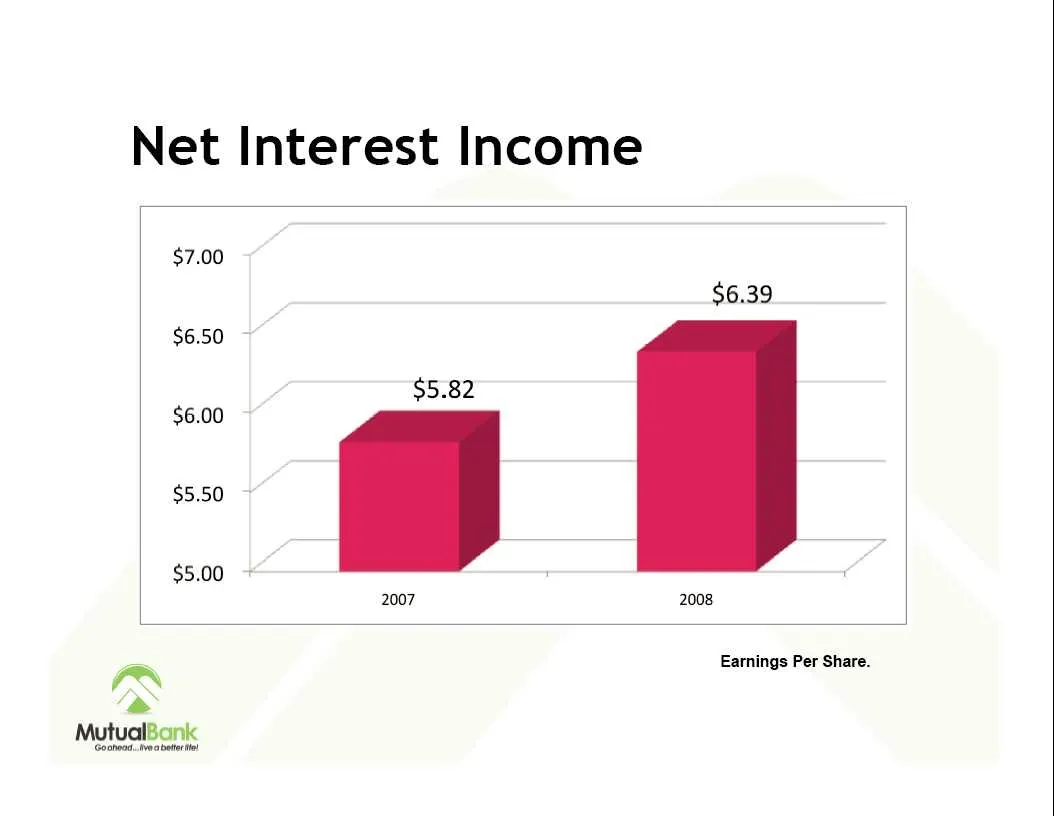
Slide 43: Net Interest Income
Net Interest Income $7.00 $6.39 $6.50 $6.00 $5.50 $5.00 2007 2008 Earnings Per Share.
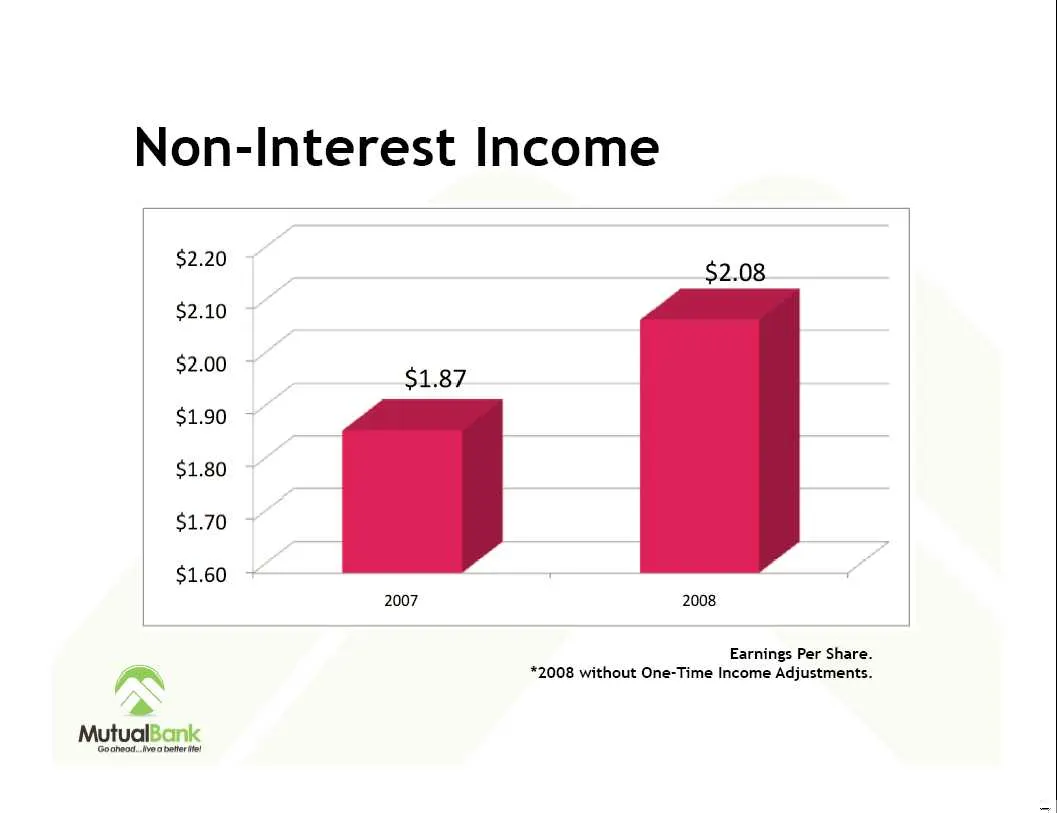
Slide 44: Non-Interest Income
Non-Interest Income 2007 2008 Earnings Per Share. rf *2008 without One-Time Income Adjustments. \
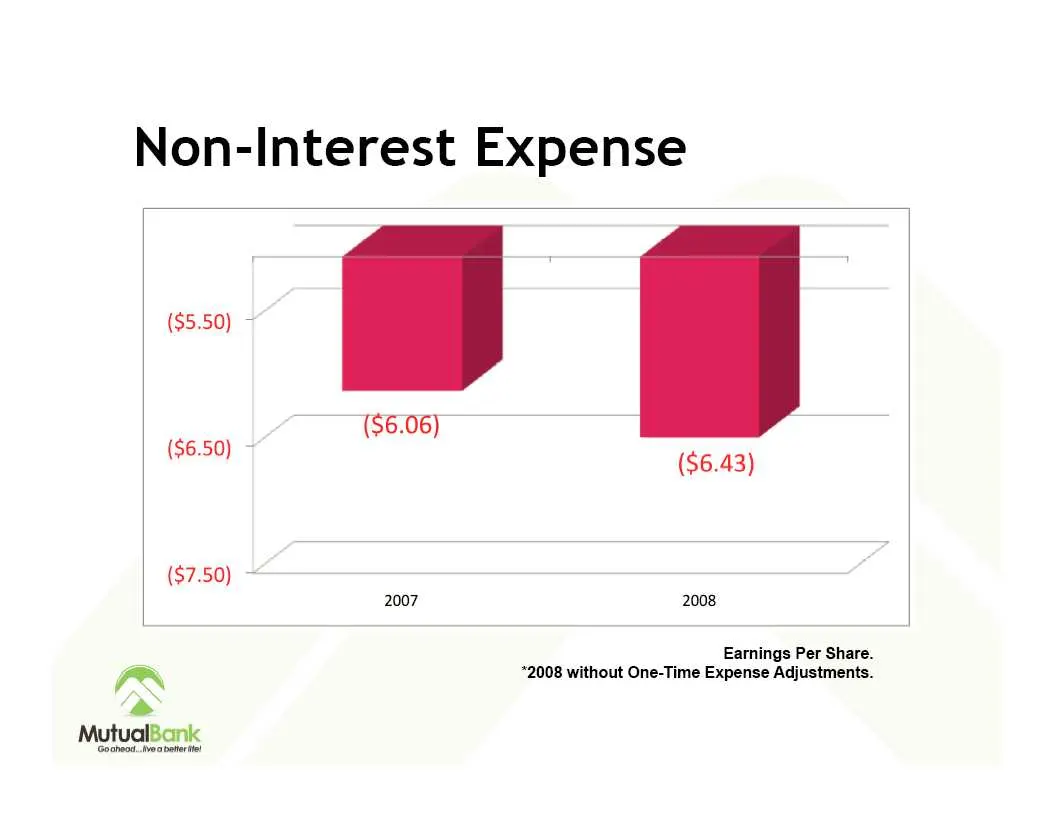
Slide 45: Non-Interest Expense
Non-Interest Expense ($5.50) > ($6.50) ~ ($7.50) ~ ($6.06) ($6.43) 2007 2008 Earnings Per Share. *2008 without One-Time Expense Adjustments.
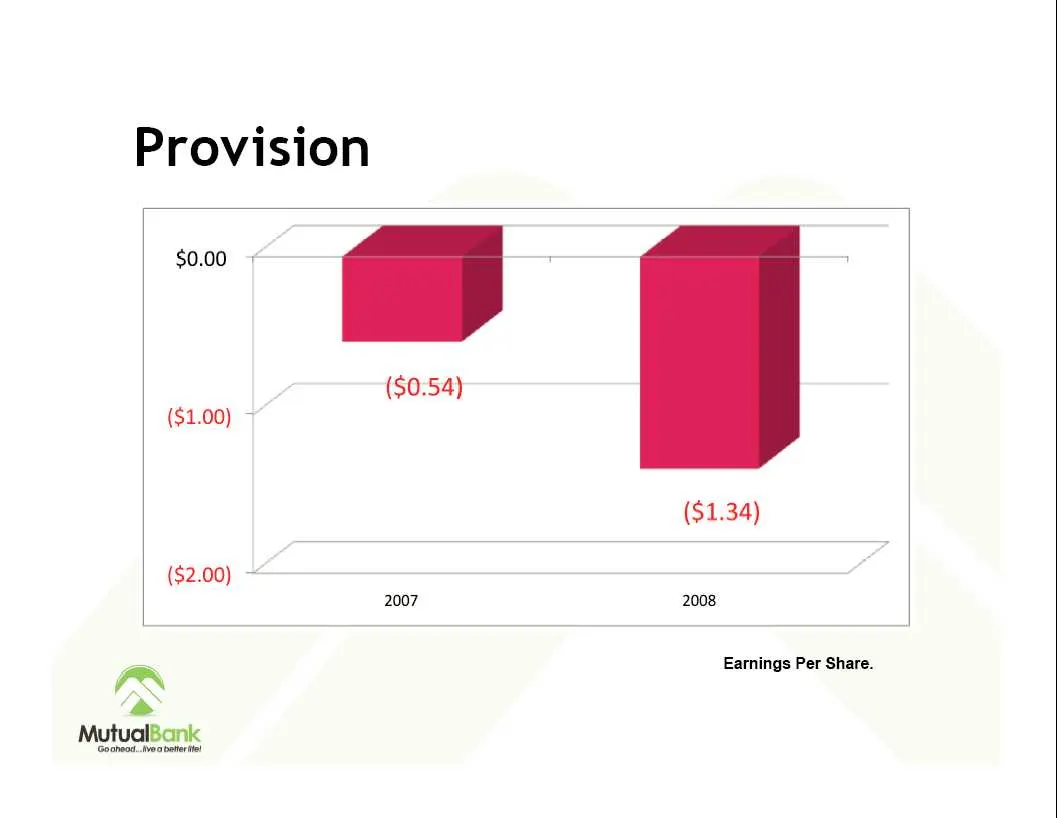
Slide 46: Provision
Provision $0.00 + ($0.54) ($1.00) ~ ($1.34) ($2.00) ~ 2007 2008 a Earnings Per Share. ,
Slide 47: Capital Purchase Plan
Capital Purchase Plan T.A.R.P.
Slide 48: Total Risk Based Capital
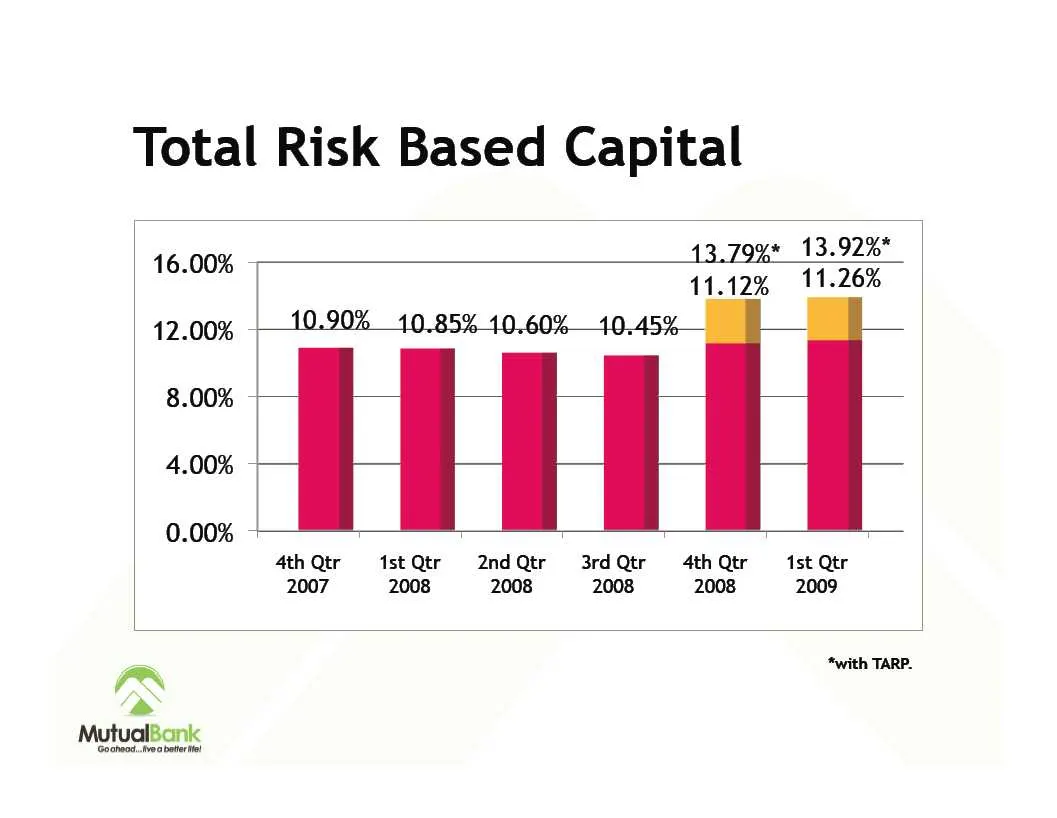
Total Risk Based Capital 16.00% 43.79%* 13.92% 11.12% 11.26% 8.00% 4.00% 0.00% ~ T T - : 4th Qtr 1st Qtr 2nd Qtr =. 3rd Qtr 4th Qtr 1st Qtr 2007 2008 2008 2008 2008 2009 a *with TARP. AN a

Slide 49: The Future.
The Future.
Slide 50: Total Stockholder's Equity
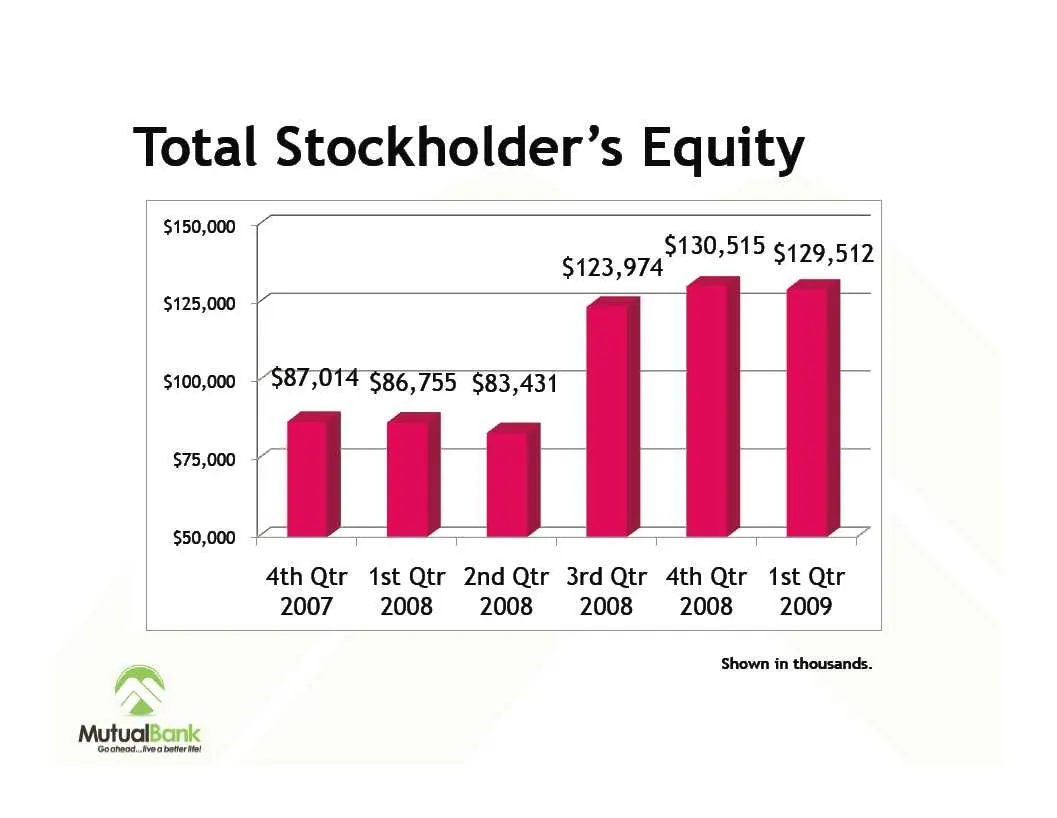
Total Stockholder’s Equity $150,000 $125,000 $100,000 $75,000 $50,000 $123,974 $130,515 $129,512 “$87,014 $86,755 $83,431 Ath Qtr 1st Qtr 2nd Qtr 3rd Qtr 4th Qtr 1st Qtr 2007 +2008 ~=2008 2008 2008 2009 Shown in thousands.
Slide 51: Net Income
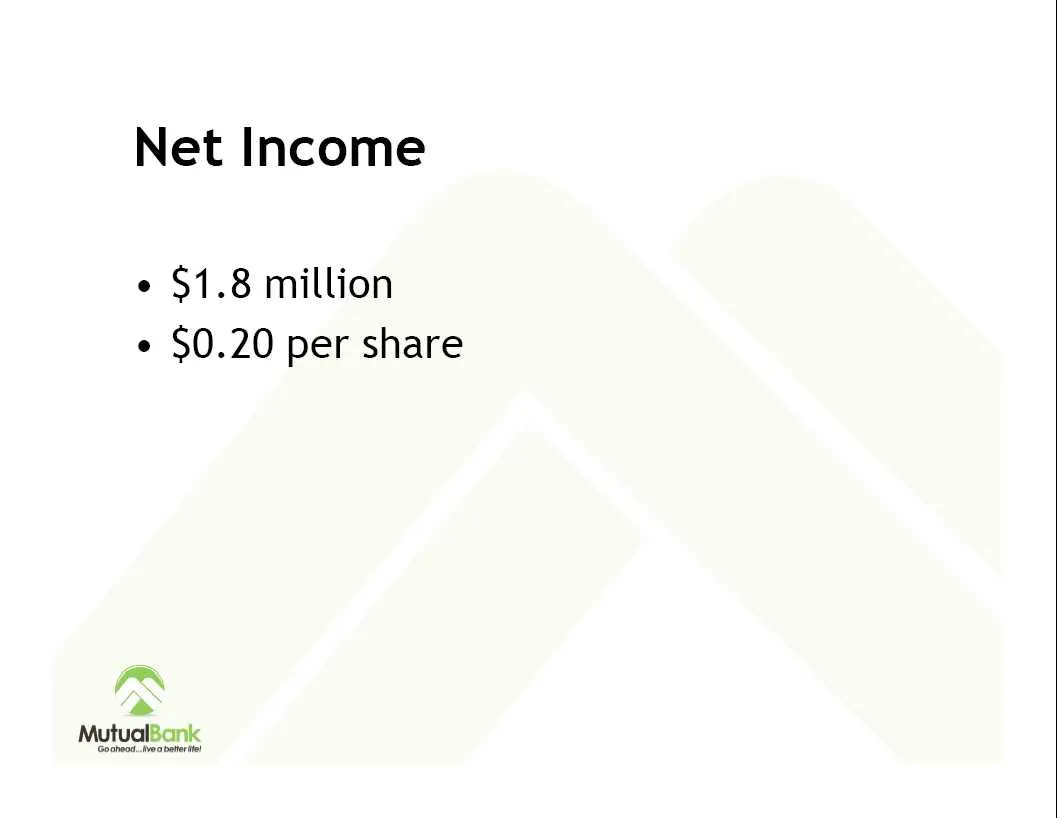
Net Income ¢ $1.8 million e $0.20 per share ~~ as Mauer
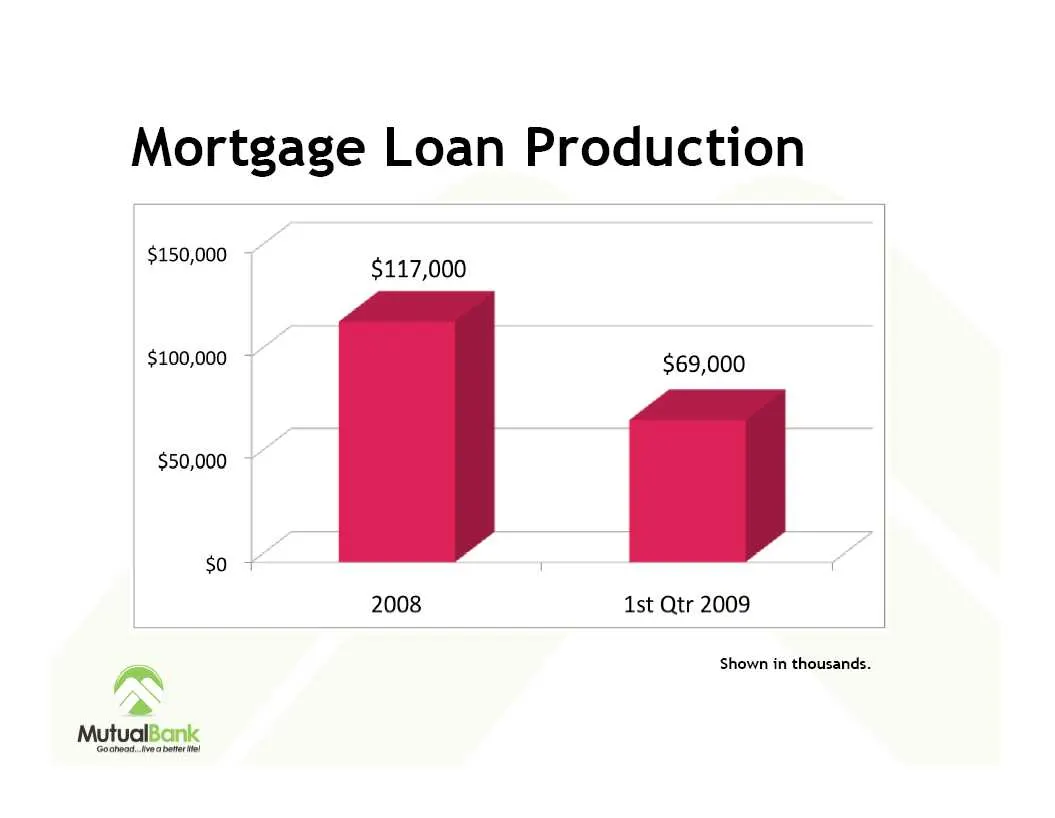
Slide 52: Mortgage Loan Production
Mortgage Loan Production $150,000 $117,000 2) $69,000 $50,000 “T $o 5 = a _s 2008 1st Qtr 2009 X Shown in thousands.
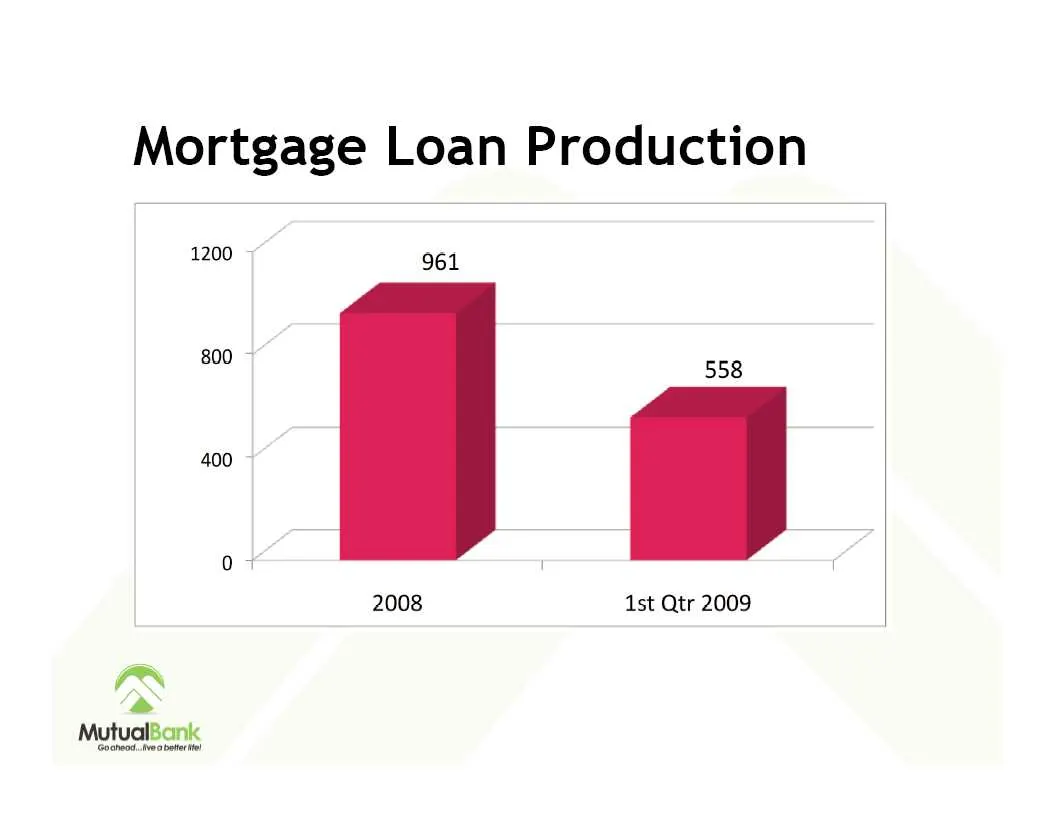
Slide 53: Mortgage Loan Production
Mortgage Loan Production 1200 5 961 800 ~ 558 400 2008 1st Qtr 2009
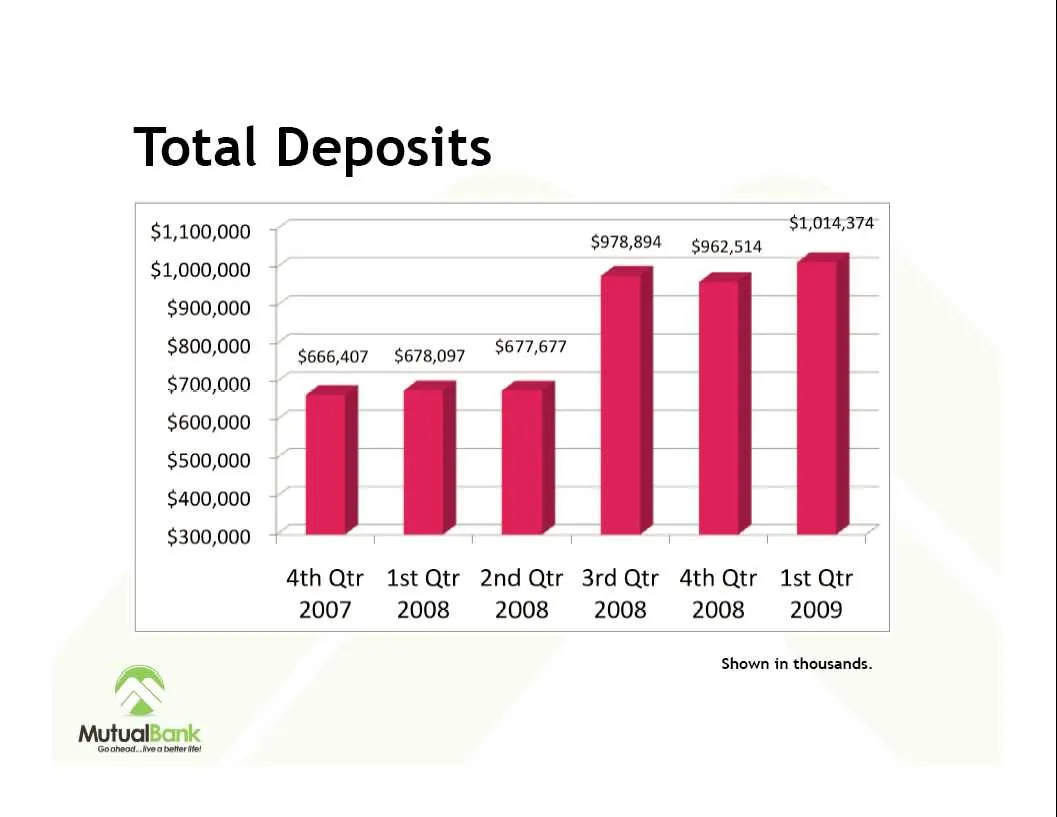
Slide 54: Total Deposits
Total Deposits 7 $1,014,374 $1,100,000 $978,894 $962,514 $1,000,000 ~ $900,000 ~ $800,000 ~ ¢666,407 $678,097 677,677 $700,000 $600,000 $500,000 i j i 1 ii $400,000 $300,000 ~ T T T T T 1 Ath Qtr 1st Qtr 2nd Qtr 3rdQtr 4th Qtr 1st Qtr 2007 2008 2008 2008 2008 2009 _ Shown in thousands. r~ a»
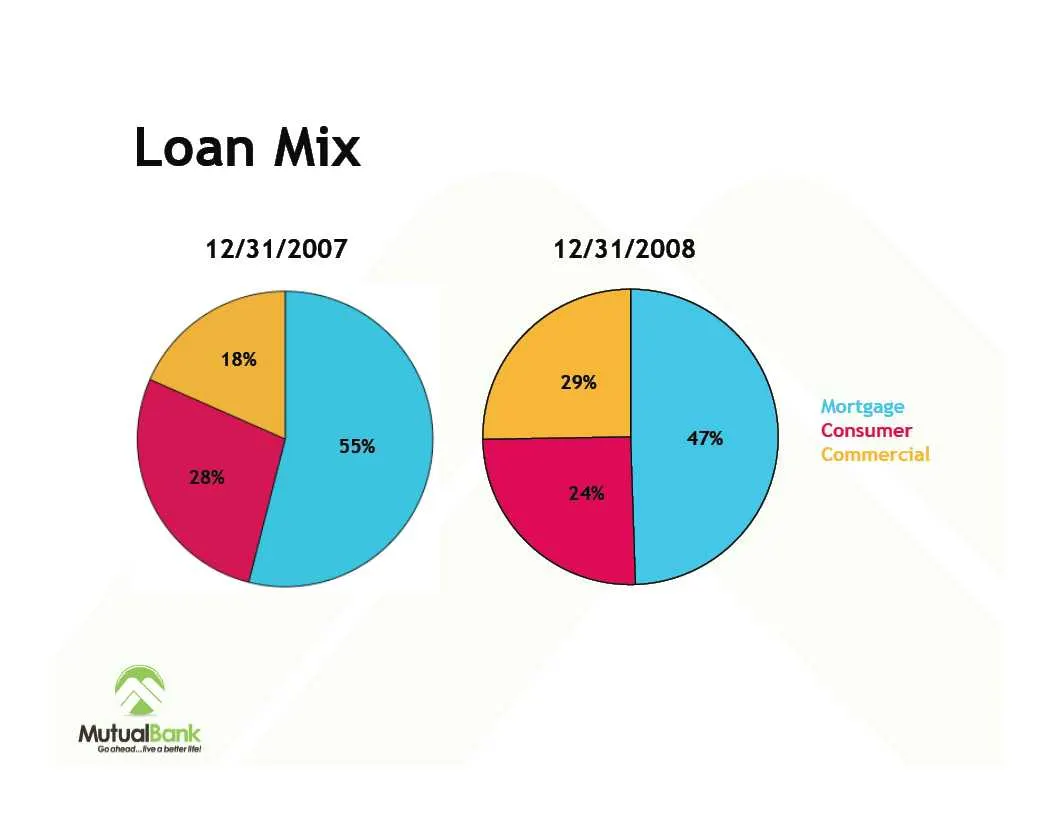
Slide 55: Loan Mix
Loan Mix 12/31/2007 12/31/2008 Mortgage Consumer Commercial
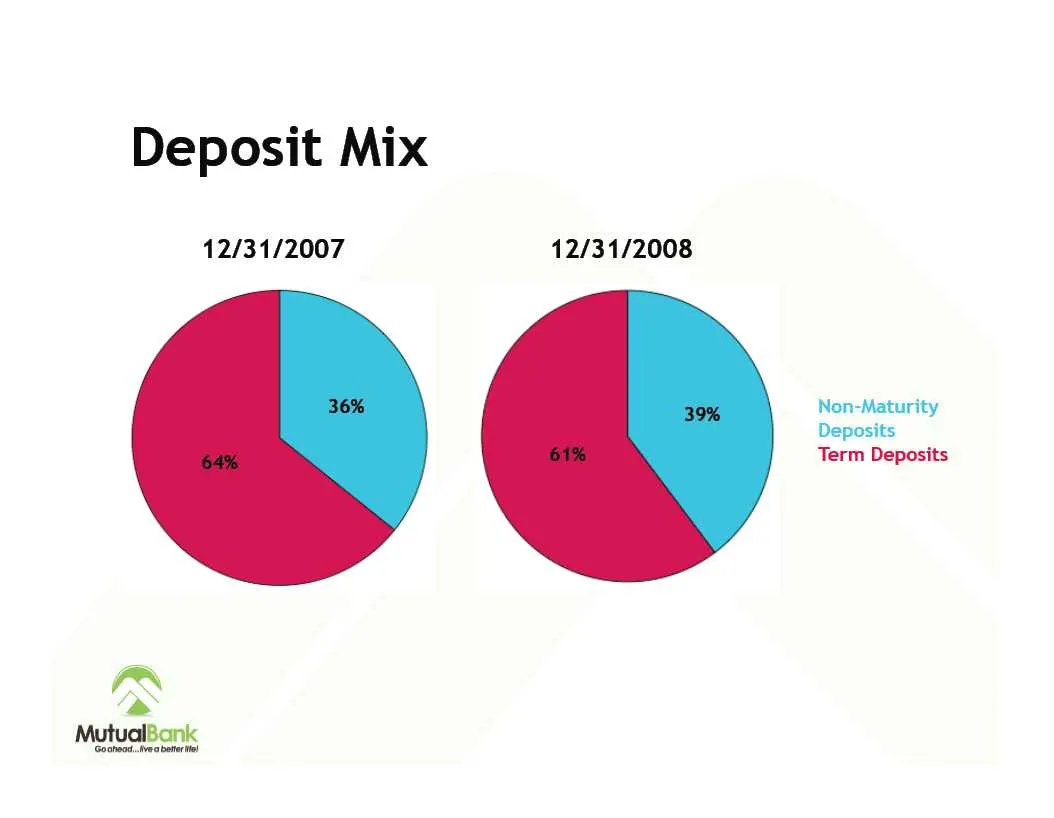
Slide 56: Deposit Mix
Deposit Mix 12/31/2007 12/31/2008 Non-Maturity Deposits Term Deposits

Slide 57: The Good. The Bad. And The Future!
The Good. The Bad. And The Future!

Slide 58: Thank You
Thank You a MutualBank Goahead...live a better life!
Source: SEC EDGAR · 8-K filed Apr 28, 2009
More decks from MutualFirst Financial Inc
 Merger or Acquisition (October 2019)14 slides · Oct 29, 2019
 Shareholder Meeting (May 2019)18 slides · May 3, 2019
 2018 KBW Community Bank Investor Conference27 slides · Aug 1, 2018
 Shareholder Meeting (May 2018)28 slides · May 7, 2018
 Merger or Acquisition (October 2017)12 slides · Oct 4, 2017
 KBW 2017 Community Bank Investor Conference34 slides · Aug 3, 2017