MutualFirst Financial — 2018 KBW Community Bank Investor Conference
27 slides from MutualFirst Financial's conference presentation, Aug 1, 2018

Slide 1: 2018 KBW Community Bank Investor Conference
2018 KBW Community Bank Investor Conference SYMBOL: MESF

Slide 2: Contacts
Contacts Dave Heeter Chris Cook, CPA, MBA CHIEF EXECUTIVE OFFICER CHIEF FINANCIAL OFFICER 765-747-2880 765-747-2945 [email protected] —[email protected]
Slide 3: Forward Looking Statement
Forward Looking Statement This presentation contains statements which constitute forward looking statements within the meaning of the Private Securities Litigation Reform Act of 1995. These statements may appear ina number of places in this presentation and include statements regarding the intent, b
Slide 4: MutualFirst Financial Today
MutualFirst Financial Today * “MFSF" Nasdaq Global Market * $330 Million Market Capitalization * Russell 2000 Index MutualBank Today * $2.0 Billion in Assets * $15 Billion in Gross Loans & Deposits ¢ 39 Full-Service Financial Centers ¢« 520 Employees

Slide 5: Vision & Values

Slide 6: Our Vision
Our Vision We exist to help people live better lives.

Slide 7: Our Values
Our Values | Character | Compassion | Competition | Class
Slide 8: Universal Bancorp/BloomBank Partnership
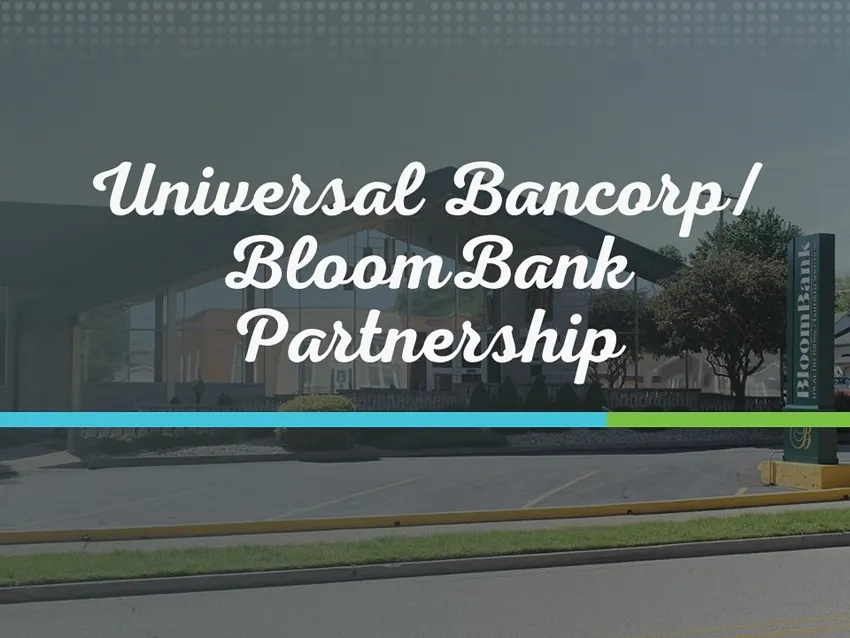
Universal Bancorp/ BloomBank Partnership
Slide 9: Partnership Timeline (2018)
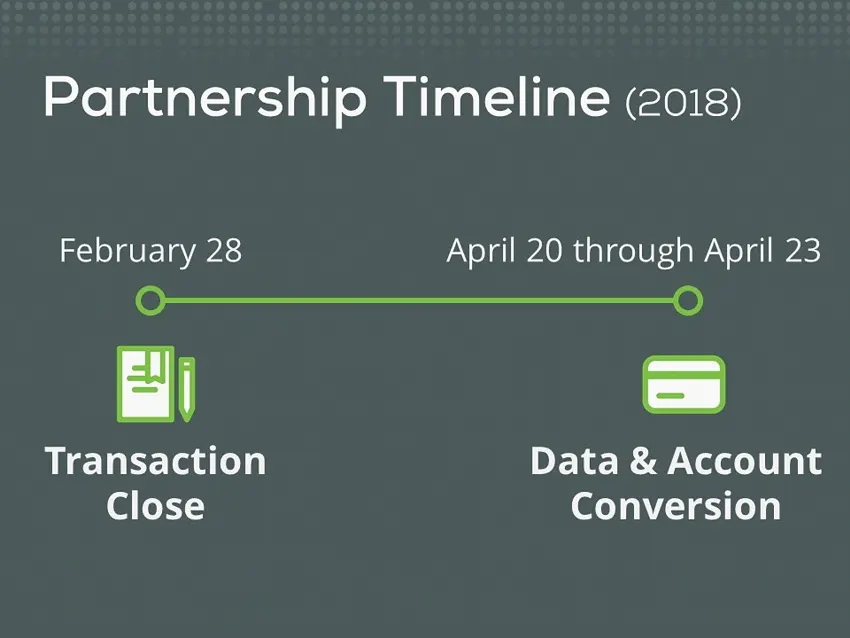
Partnership Timeline (201s) February 28 April 20 through April 23 Transaction Data & Account Close Conversion
Slide 10: Indy Metro Market
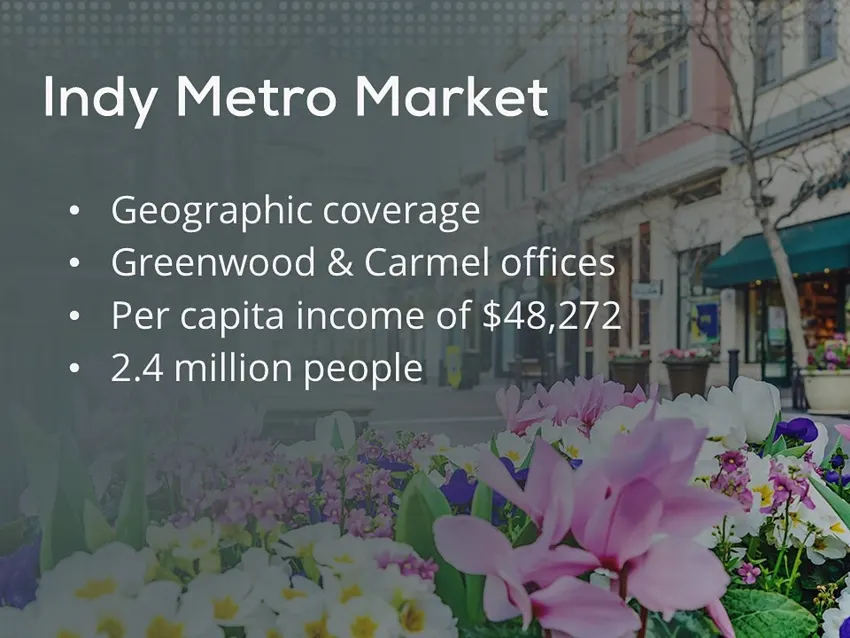
Indy Metro Market Geographic coverage Greenwood & Carmel offices Per capita income of $48,272 2.4 million people
Slide 11: Southern Region
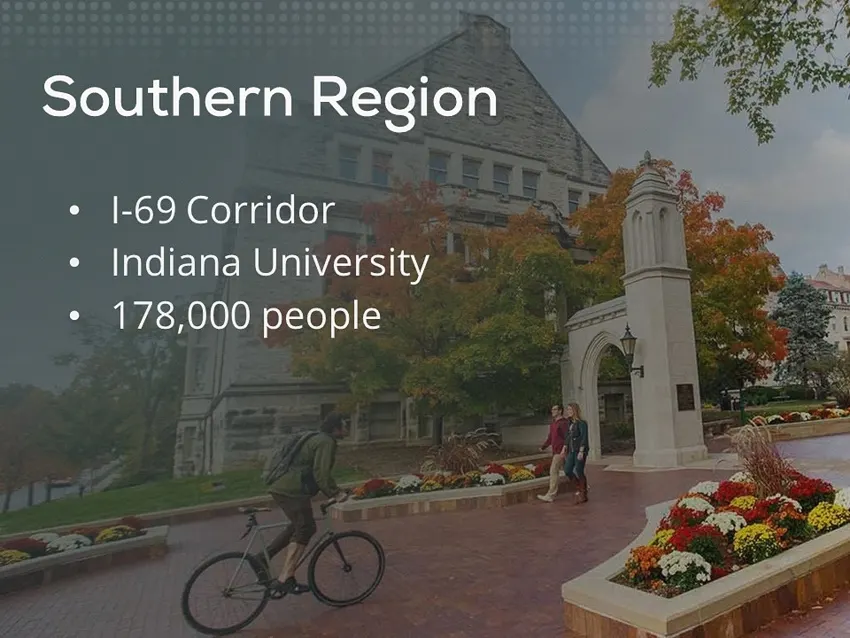
Ca neekasinene sane eo S0000ce0000 C000 Southern Region * 1-69 Corridor * Indiana University * 178,000 people
Slide 12: Footprint After Partnership
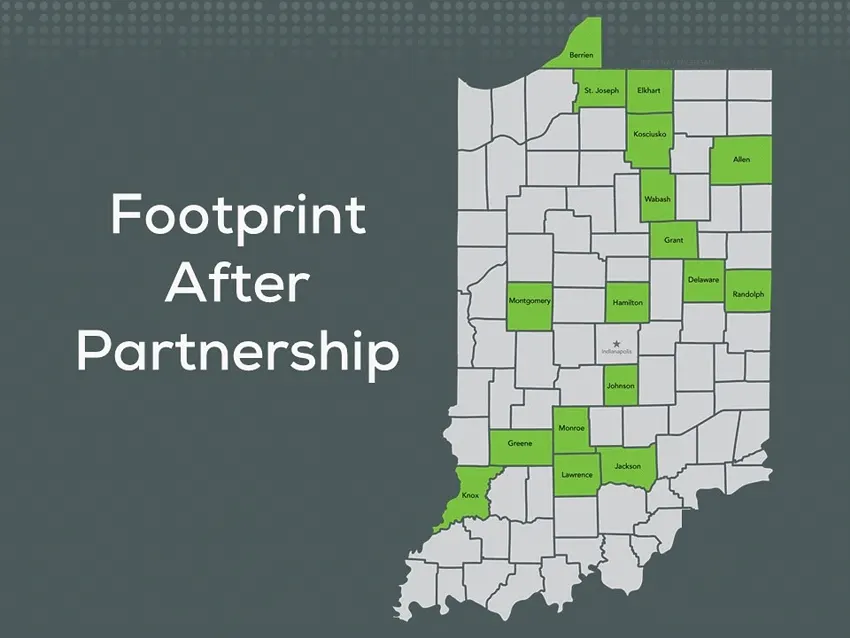
PHS iia ane . Footprint After Partnership

Slide 13: Financials
dinancials
Slide 14: Balance Sheet
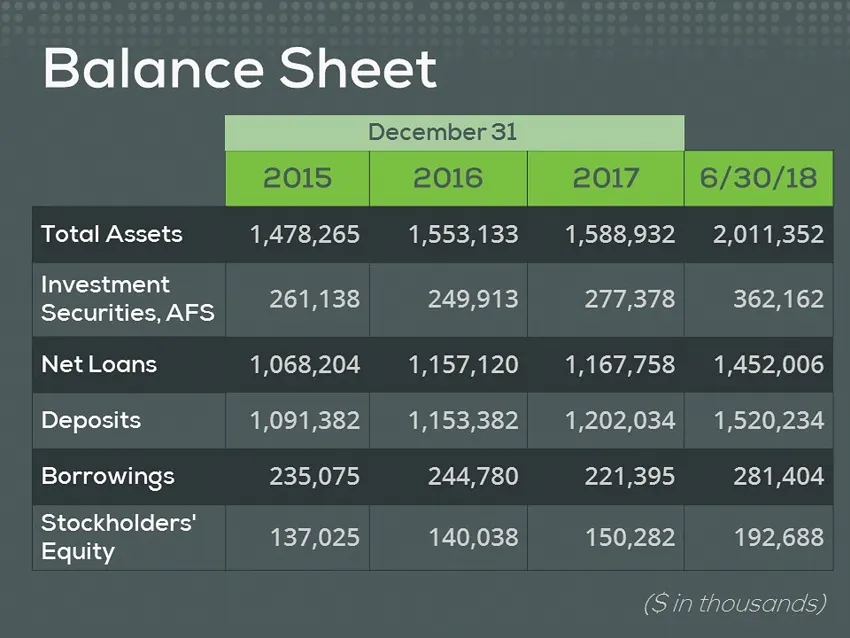
Balance Sheet 2015 Total Assets 1,478,265 Investment Securities, AFS Boilvileke Net Loans 1,068,204 Deposits 1,091,382 Borrowings 235,075 Stockholders’ 137,025 Equity December 31 2016 25S S> 249,913 1,157,120 1,153,382 244,780 140,033 2017 6/30/18 1 5S3,9352e 2 Ot SO2 277,378 362,162 1,167,758 1,452
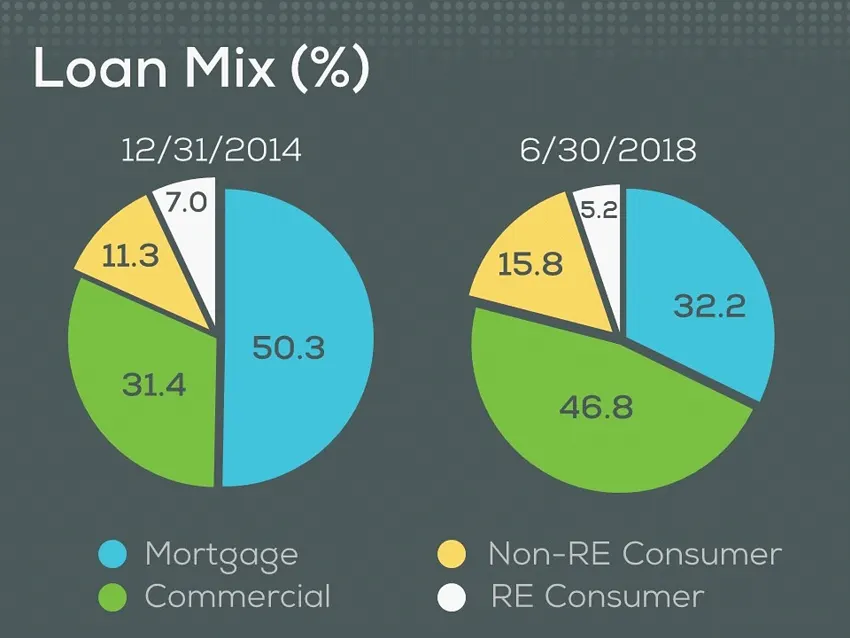
Slide 15: Loan Mix (%)
Loan Mix (%) 12/31/2014 6/30/2018 @ Mortgage @ Non-RE Consumer Commercial @ RE Consumer
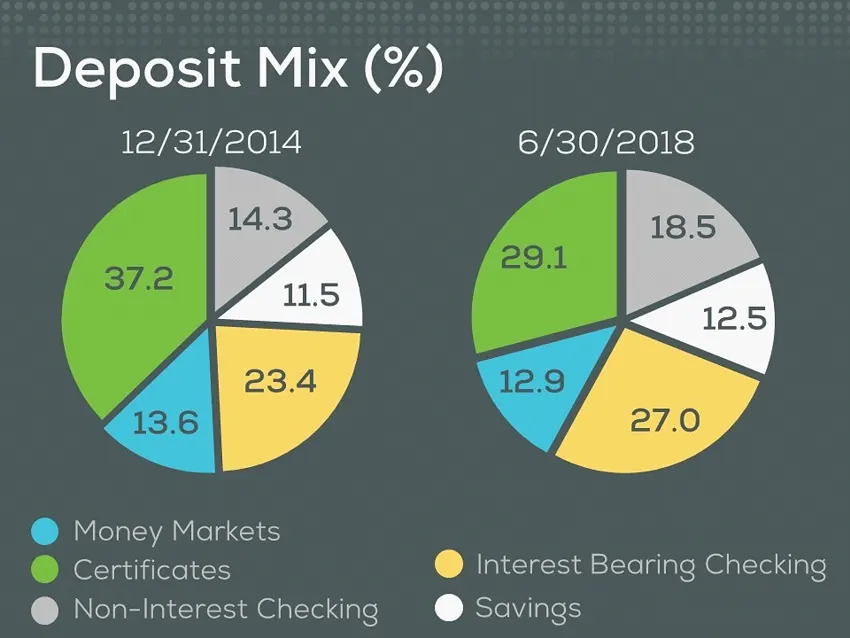
Slide 16: Deposit Mix (%)
Deposit Mix (%) 12/31/2014 6/30/2018 @ Money Markets Certificates @ Interest Bearing Checking @ Non-Interest Checking @ Savings
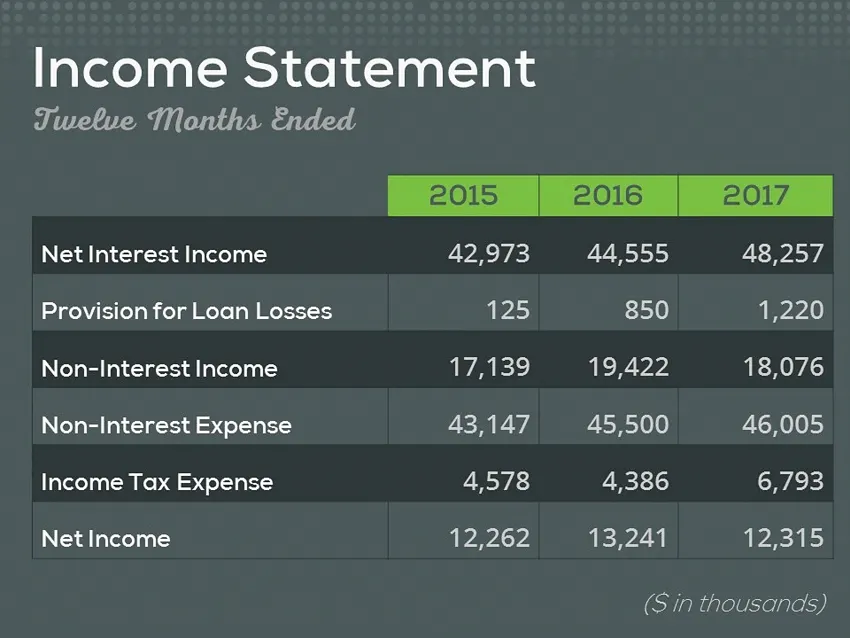
Slide 17: Income Statement
Income Statement Twelve Months Ended Net Interest Income 42,973 44,555 48,257 Provision for Loan Losses 125 850 1,220 Non-Interest Income WANES) 19,422 18,076 Non-Interest Expense 43,147 45,500 46,005 Income Tax Expense 4,578 4,386 6,793 Net Income 12,262 13,241 12-315 (S in thousands)
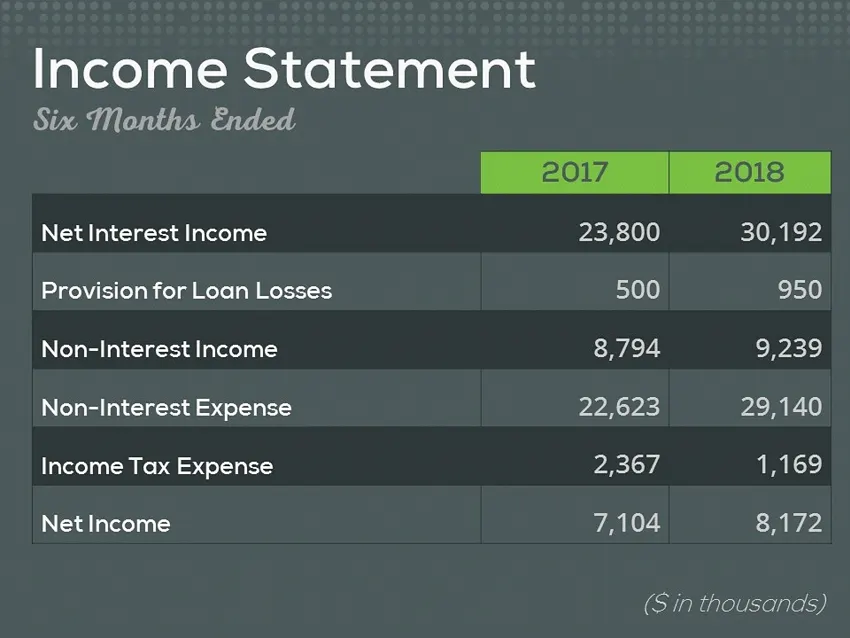
Slide 18: Income Statement
Income Statement Six Months Ended Net Interest Income Provision for Loan Losses Non-Interest Income Non-Interest Expense Income Tax Expense Net Income 23,800 30,192 500 950 8,794 9,239 22,623 29,140 2,367 1,169 7,104 8,172 (S in thousands)
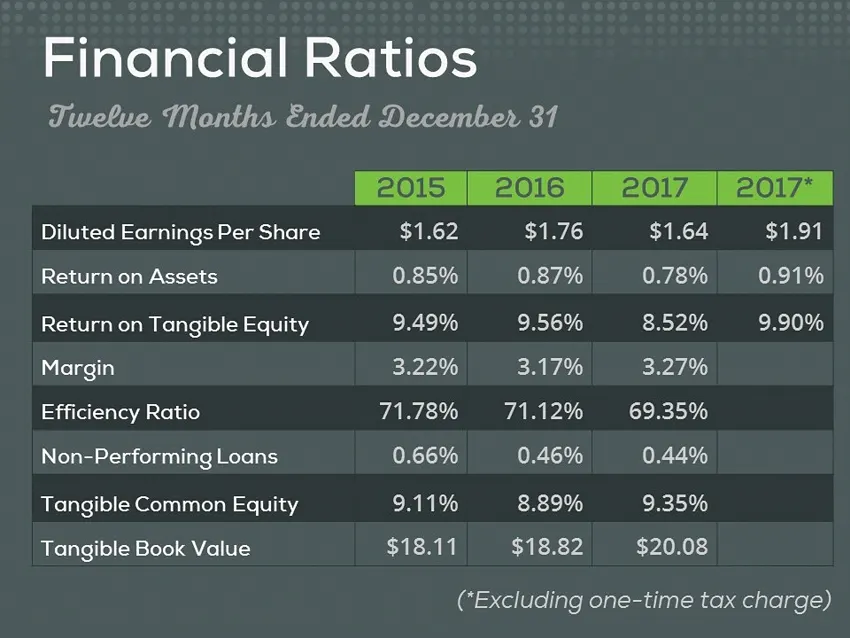
Slide 19: Financial Ratios
Financial Ratios Twelve Months Ended December 31 Diluted Earnings Per Share $1.62 Return on Assets 0.85% Return on Tangible Equity 9.49% Margin 3.22% Efficiency Ratio 71.78% Non-Performing Loans 0.66% Tangible Common Equity 9.11% Tangible Book Value $18.11 $1.76 $1.64 $1.91 0.87% 0.78% 0.91% 9.56% 8
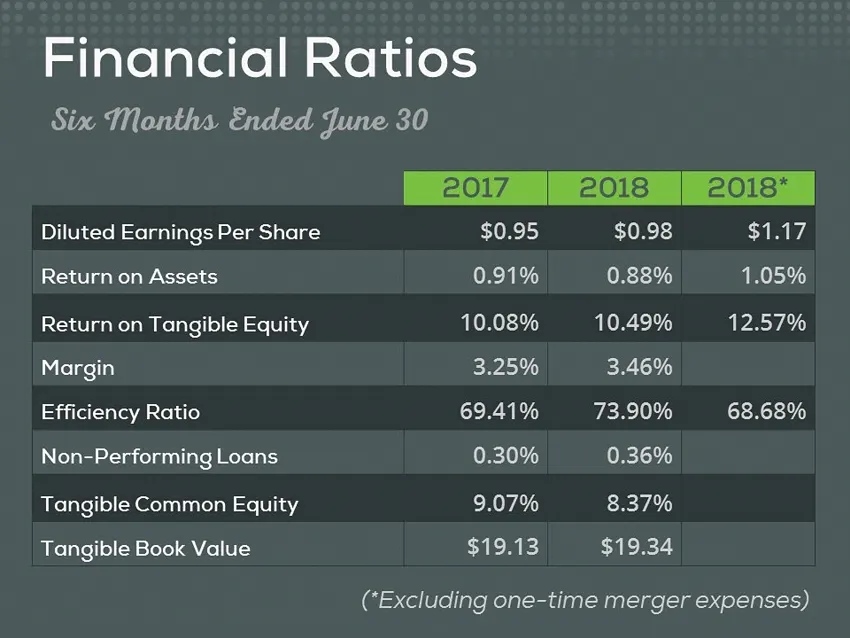
Slide 20: Financial Ratios
Financial Ratios Six Months Ended June 30 Diluted Earnings Per Share $0.95 $0.98 $1.17 Return on Assets 0.91% 0.88% 1.05% Return on Tangible Equity 10.08% 10.49% 12.57% Margin 3.25% 3.46% Efficiency Ratio 69.41% 73.90% 68.68% Non-Performing Loans 0.30% 0.36% Tangible Common Equity 9.07% 8.37% Tangib

Slide 21: Strategic Goals

Slide 22: Business & Commercial Banking Goals
Business & Commercial Banking Increase Outstanding Loan Balances

Slide 23: Personal Banking Goals
Personal Banking Goals Grow Consumer Loan Balances Grow Mortgage Market Share in Each of Our Markets Grow Active DDA Accounts Grow Annual Investment Income

Slide 24: Wealth Management Goals
Wealth Management Goals Increase Gross Revenue Maintain Operating Margin

Slide 25: Best Places to Work in Indiana
BEST PLACES TO WORKIN INDIANA —g—
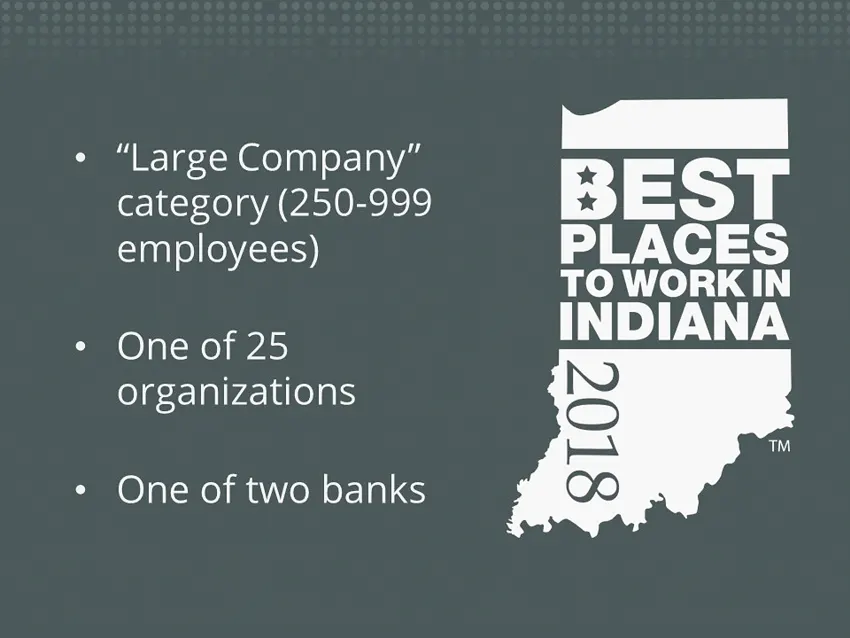
Slide 26: Best Places to Work in Indiana: Large Company category
¢ “Large Company” category (250-999 employees) * One of 25 organizations ¢ One of two banks To BEST PLACES TO WORKIN INDIANA

Slide 27: 2018 KBW Community Bank Investor Conference
2018 KBW Community Bank Investor Conference SYMBOL: MESF
Source: SEC EDGAR · 8-K filed Aug 1, 2018
More decks from MutualFirst Financial Inc
 Merger or Acquisition (October 2019)14 slides · Oct 29, 2019
 Shareholder Meeting (May 2019)18 slides · May 3, 2019
 Shareholder Meeting (May 2018)28 slides · May 7, 2018
 Merger or Acquisition (October 2017)12 slides · Oct 4, 2017
 KBW 2017 Community Bank Investor Conference34 slides · Aug 3, 2017
 Shareholder Meeting (May 2017)40 slides · May 5, 2017