Guaranty Bancorp — Piper Jaffray 2016 Financial Institutions Conference
25 slides from Guaranty Bancorp's conference presentation, May 4, 2016
Slide 1: Piper Jaffray 2016 Financial Institutions Conference
Piper Jaffray 2016 Financial Institutions Conference Orlando, FL May 4 – 6, 2016
Slide 2: Forward-looking statements
This presentation contains forward-looking statements, which are included in accordance with the “safe harbor” provisions of the Private Securities Litigation Reform Act of 1995. In some cases, you can identify forward-looking statements by terminology such as “may,” “will,” “should,” “could,” “expe
Slide 3: About Us – Guaranty Bancorp
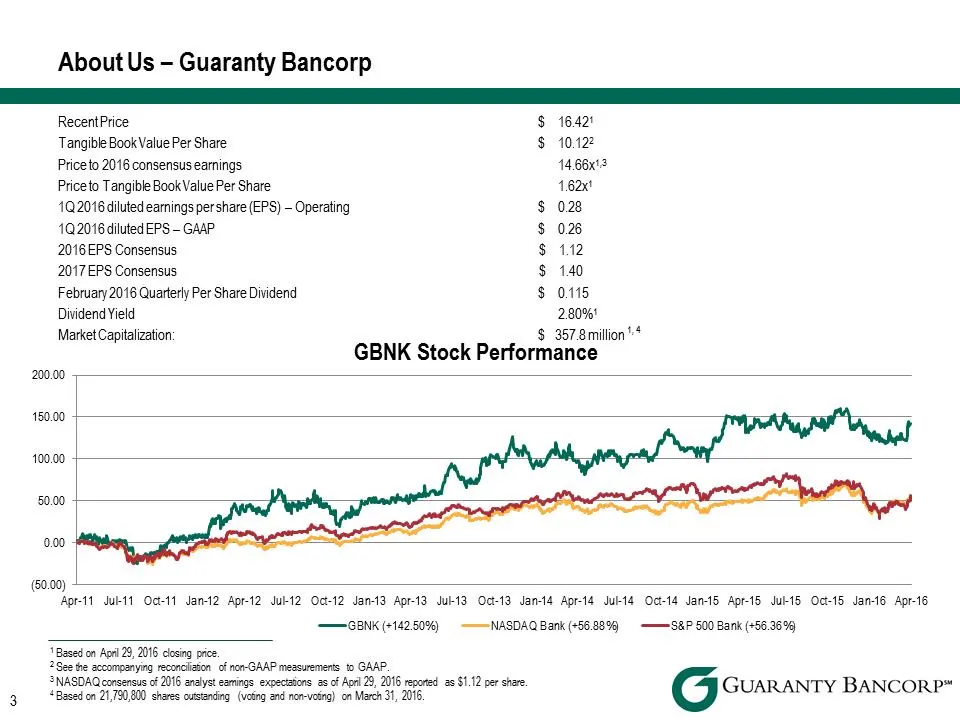
Recent Price $ 16.42 Tangible Book Value Per Share $ 10.12 Price to 2016 consensus earnings 14.66x1,3 Price to Tangible Book Value Per Share 1.62x1 1Q 2016 diluted earnings per share (EPS) – Operating $ 0.28 1Q 2016 diluted EPS – GAAP $ 0.26 2016 EPS Consensus $ 1.12 2017 EPS Consensus $ 1.40 Februa
Slide 4: Only Colorado bank in SNL's 2015 Top-Performing Community Banks
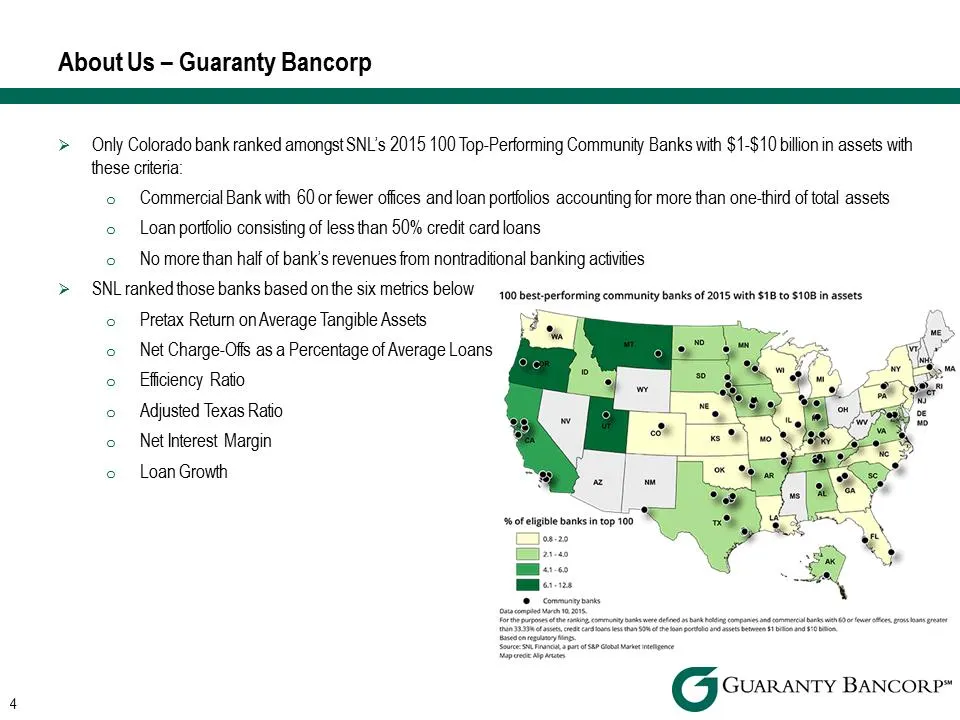
4 Only Colorado bank ranked amongst SNL’s 2015 100 Top-Performing Community Banks with $1-$10 billion in assets with these criteria: oCommercial Bank with 60 or fewer offices and loan portfolios accounting for more than one-third of total assets oLoan portfolio consisting of less than 50% credit car
Slide 5: Sandler O'Neill Sm-All Stars award
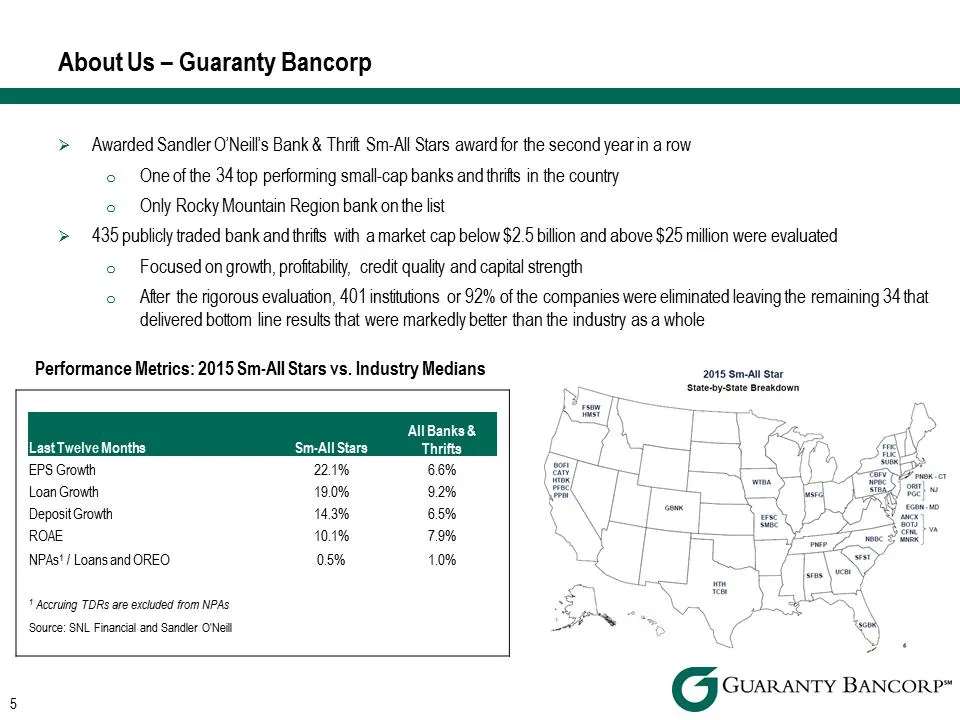
Awarded Sandler O’Neill’s Bank & Thrift Sm-All Stars award for the second year in a row oOne of the 34 top performing small-cap banks and thrifts in the country oOnly Rocky Mountain Region bank on the list .435 publicly traded bank and thrifts with a market cap below $2.5 billion and above $25 milli
Slide 6: About Us – Guaranty Bancorp: Colorado market position
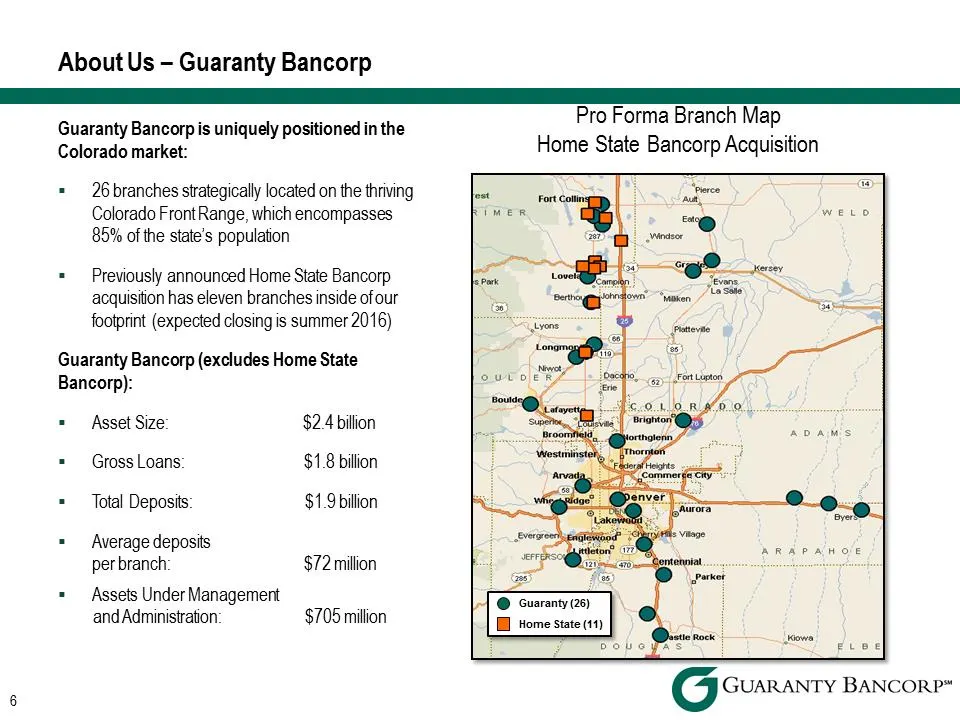
Guaranty Bancorp is uniquely positioned in the Colorado market: .26 branches strategically located on the thriving Colorado Front Range, which encompasses 85% of the state’s population .Previously announced Home State Bancorp acquisition has eleven branches inside of our footprint (expected closing
Slide 7: Home State Bancorp acquisition: Strategic Rationale
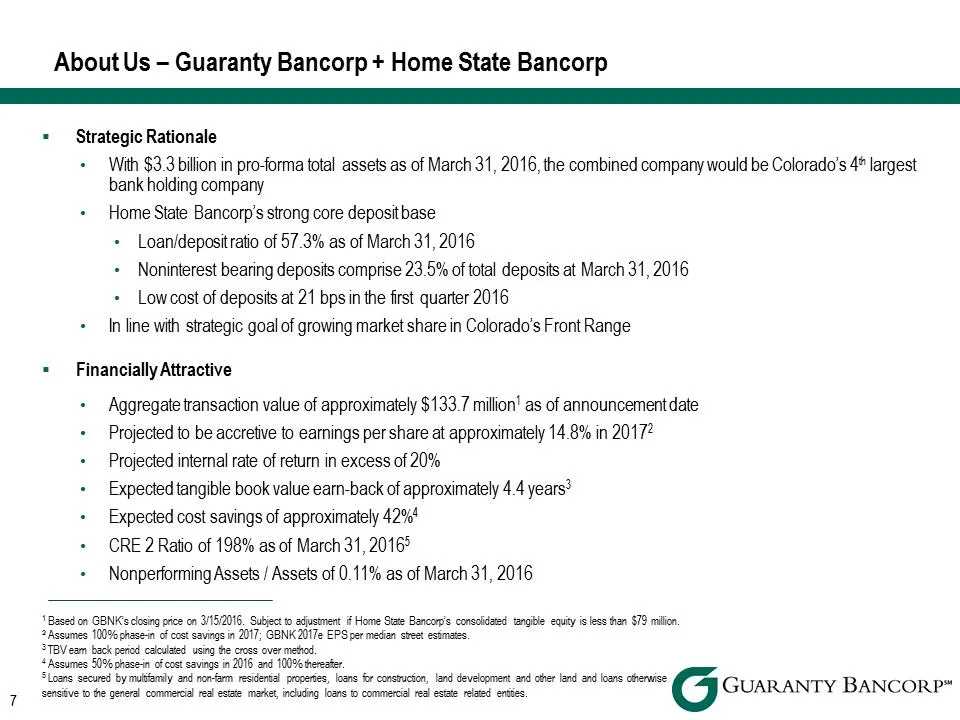
Strategic Rationale •With $3.3 billion in pro-forma total assets as of March 31, 2016, the combined company would be Colorado’s 4th largest bank holding company •Home State Bancorp’s strong core deposit base •Loan/deposit ratio of 57.3% as of March 31, 2016 •Noninterest bearing deposits comprise 23.
Slide 8: Investment Considerations: Key Financial Measures
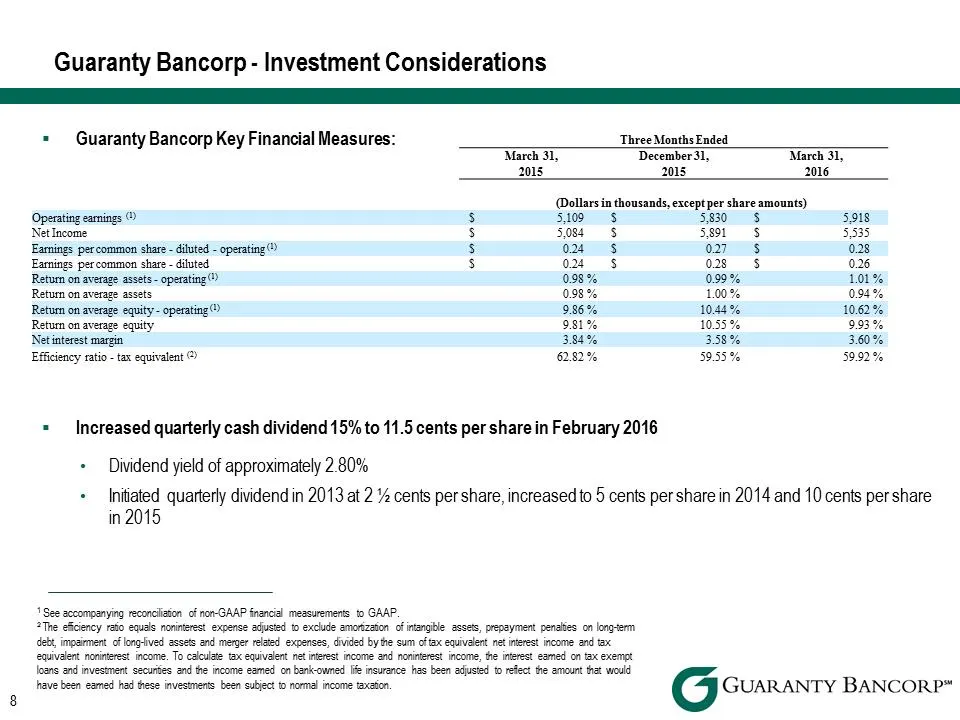
8 Guaranty Bancorp Key Financial Measures: .Increased quarterly cash dividend 15% to 11.5 cents per share in February 2016 •Dividend yield of approximately 2.80% •Initiated quarterly dividend in 2013 at 2 ½ cents per share, increased to 5 cents per share in 2014 and 10 cents per share in 2015 Guaran
Slide 9: Investment Considerations: loan growth and asset quality
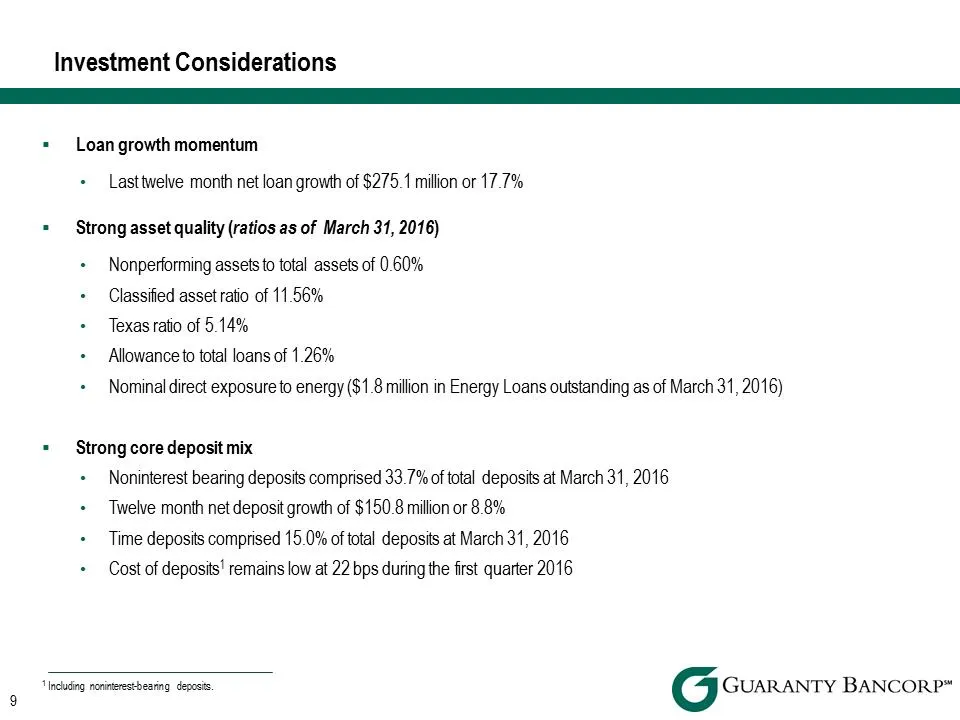
.Loan growth momentum•Last twelve month net loan growth of $275.1 million or 17.7% .Strong asset quality (ratios as of March 31, 2016) •Nonperforming assets to total assets of 0.60% •Classified asset ratio of 11.56% •Texas ratio of 5.14% •Allowance to total loans of 1.26% •Nominal direct exposure to
Slide 10: Investment Considerations: noninterest income growth
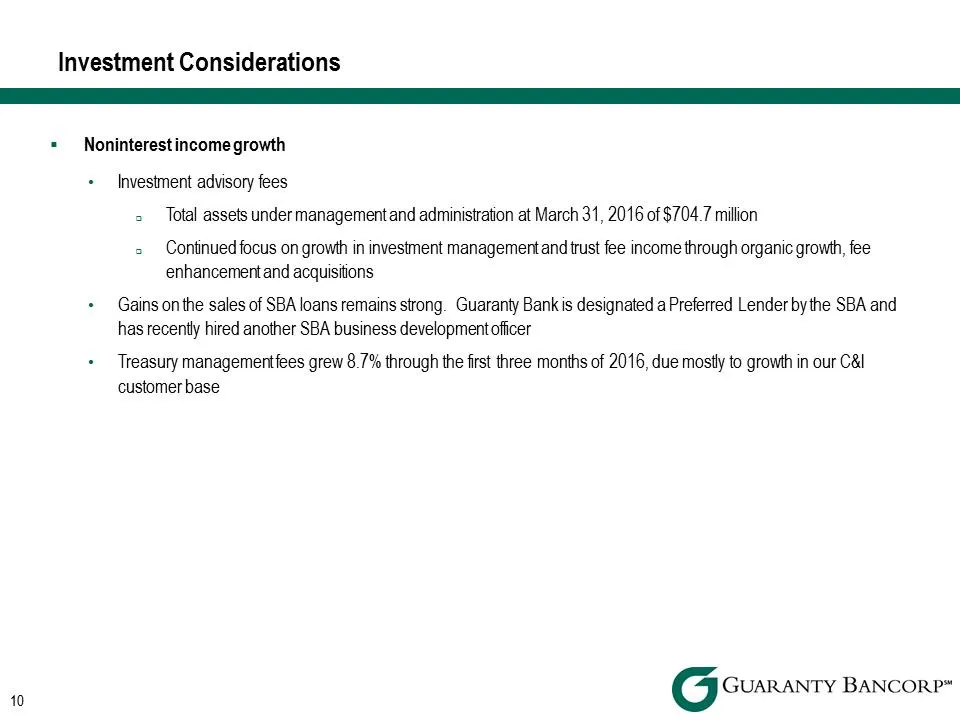
Noninterest income growth •Investment advisory fees .Total assets under management and administration at March 31, 2016 of $704.7 million .Continued focus on growth in investment management and trust fee income through organic growth, fee enhancement and acquisitions •Gains on the sales of SBA loans
Slide 11: Investment Considerations: capital structure and expenses
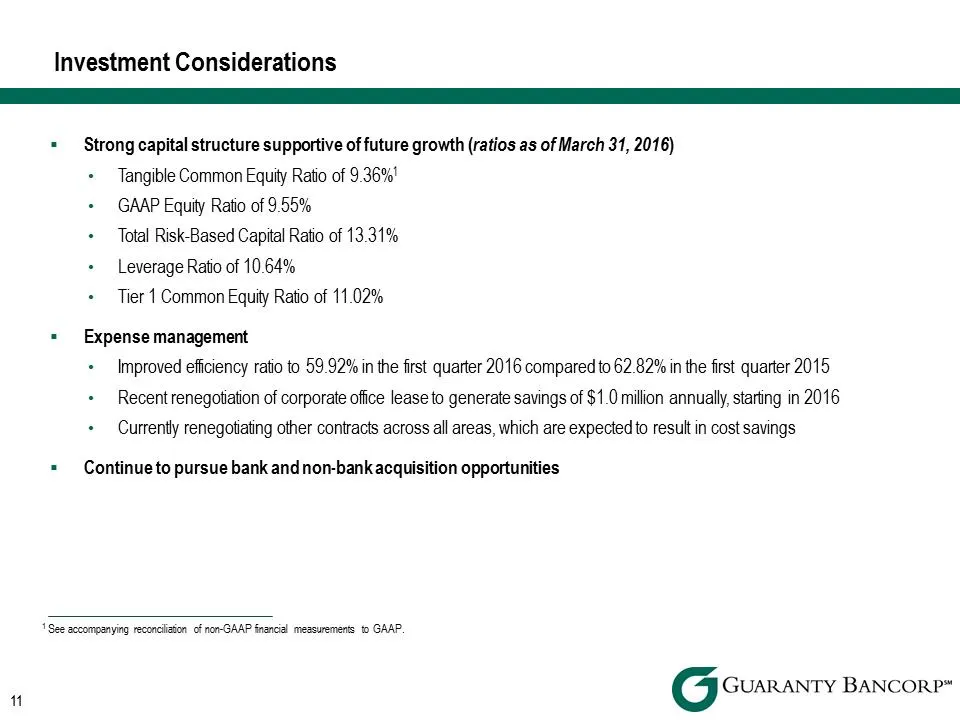
Strong capital structure supportive of future growth (ratios as of March 31, 2016) •Tangible Common Equity Ratio of 9.36%1 •GAAP Equity Ratio of 9.55% •Total Risk-Based Capital Ratio of 13.31% •Leverage Ratio of 10.64% •Tier 1 Common Equity Ratio of 11.02% .Expense management •Improved efficiency ra
Slide 12: Net Interest Income
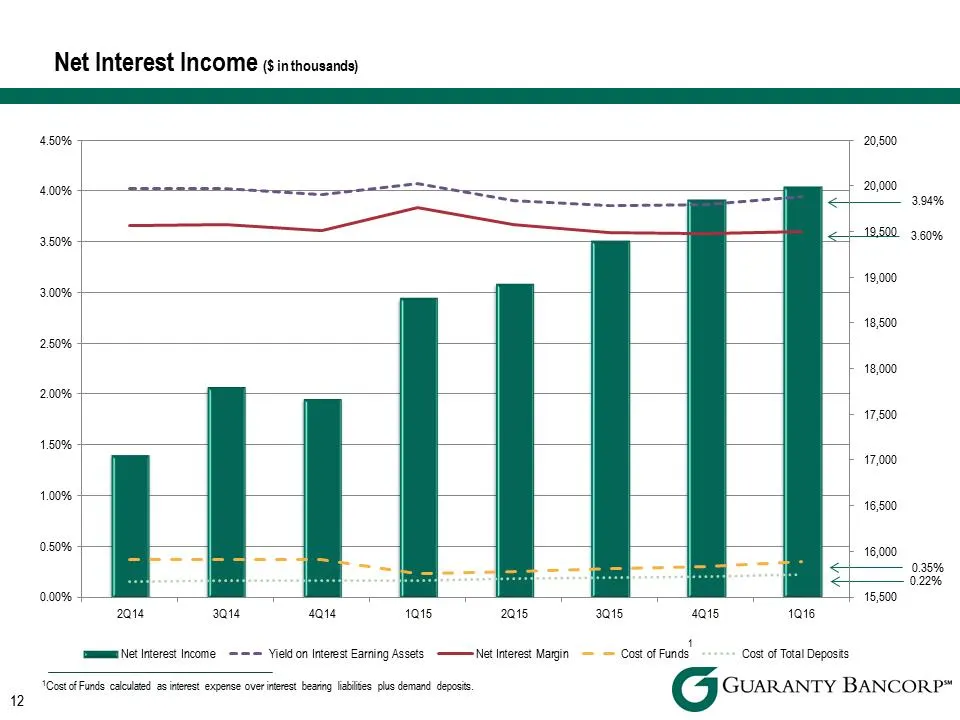
Net Interest Income ($ in thousands) 12 1Cost of Funds calculated as interest expense over interest bearing liabilities plus demand deposits. 3.94% 3.60% 0.22% 0.35% 1 15,500 16,000 16,500 17,000 17,500 18,000 18,500 19,000 19,500 20,000 20,500 0.00% 0.50% 1.00% 1.50% 2.00% 2.50% 3.00% 3.50% 4.00% 4
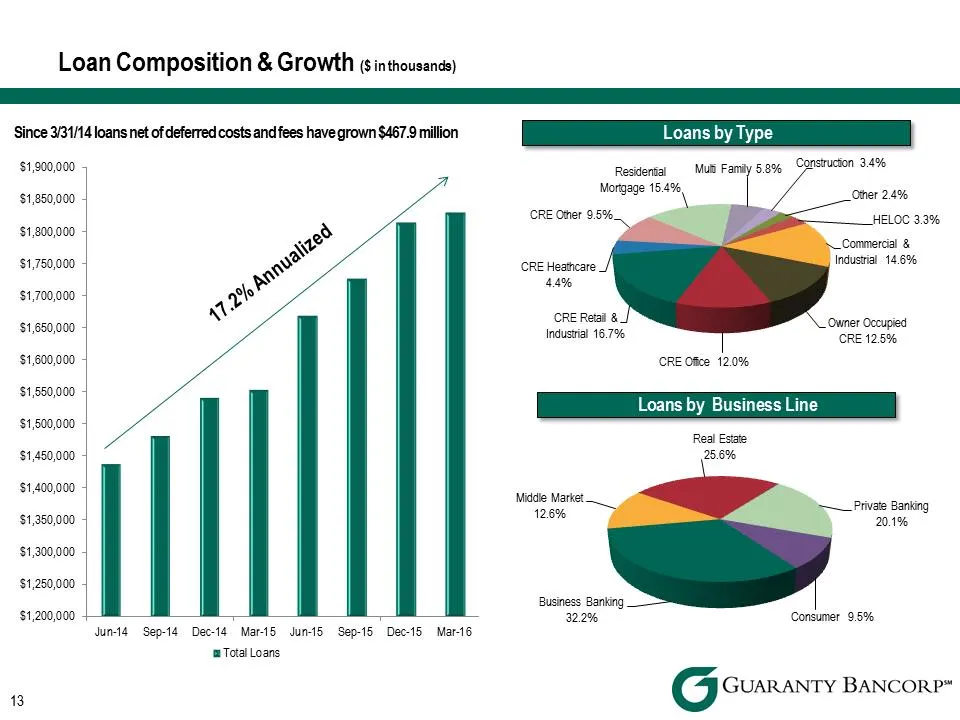
Slide 13: Loan Composition & Growth
$1,200,000 $1,250,000 $1,300,000 $1,350,000 $1,400,000 $1,450,000 $1,500,000 $1,550,000 $1,600,000 $1,650,000 $1,700,000 $1,750,000 $1,800,000 $1,850,000 $1,900,000 Jun-14 Sep-14 Dec-14 Mar-15 Jun-15 Sep-15 Dec-15 Mar-16 Total Loans Loan Composition & Growth ($ in thousands)13 Since 3/31/14 loans ne
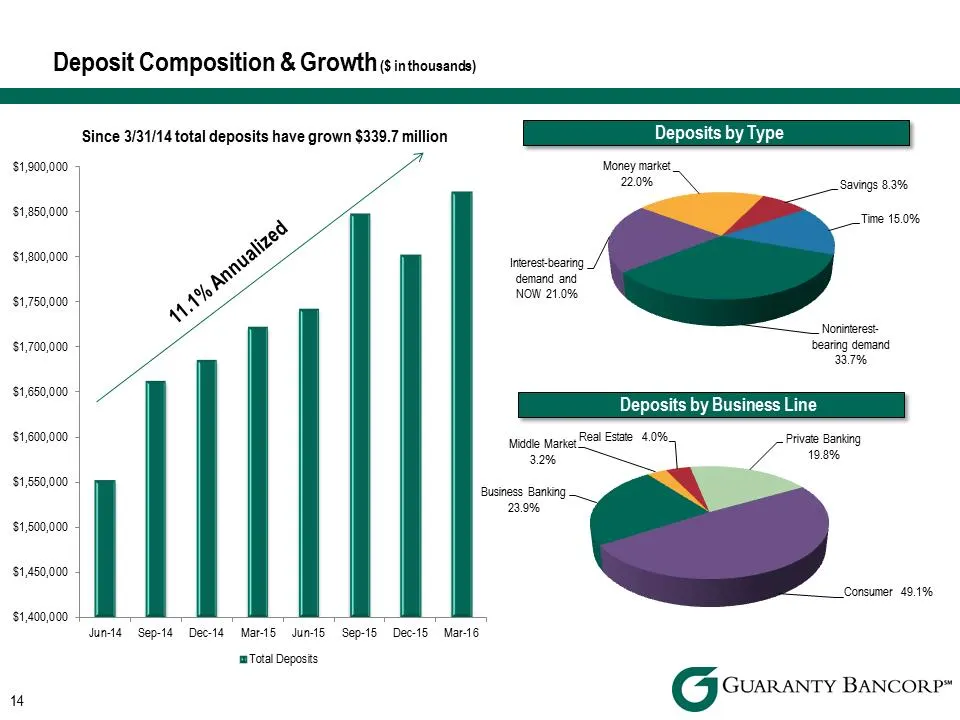
Slide 14: Deposit Composition & Growth
$1,400,000 $1,450,000 $1,500,000 $1,550,000 $1,600,000 $1,650,000 $1,700,000 $1,750,000 $1,800,000 $1,850,000 $1,900,000 Jun-14 Sep-14 Dec-14 Mar-15 Jun-15 Sep-15 Dec-15 Mar-16Total Deposits 11.1% Annualized Deposit Composition & Growth ($ in thousands) 14 Since 3/31/14 total deposits have grown $33
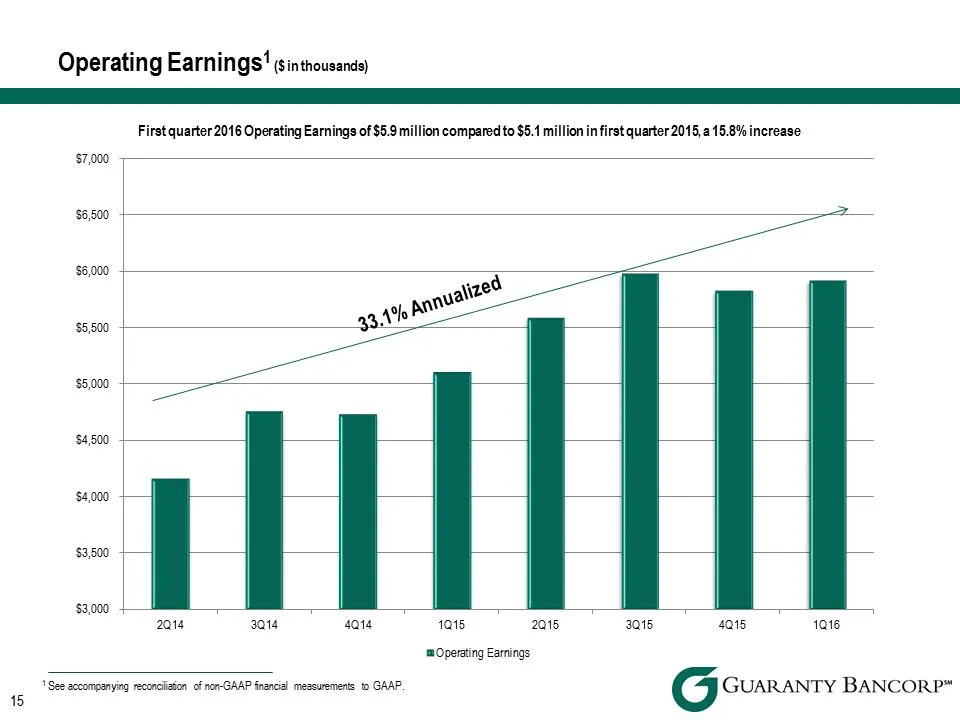
Slide 15: Operating Earnings
15 Operating Earnings1 ($ in thousands) 1 See accompanying reconciliation of non-GAAP financial measurements to GAAP. First quarter 2016 Operating Earnings of $5.9 million compared to $5.1 million in first quarter 2015, a 15.8% increase $3,000 $3,500 $4,000 $4,500 $5,000 $5,500 $6,000 $6,500 $7,000
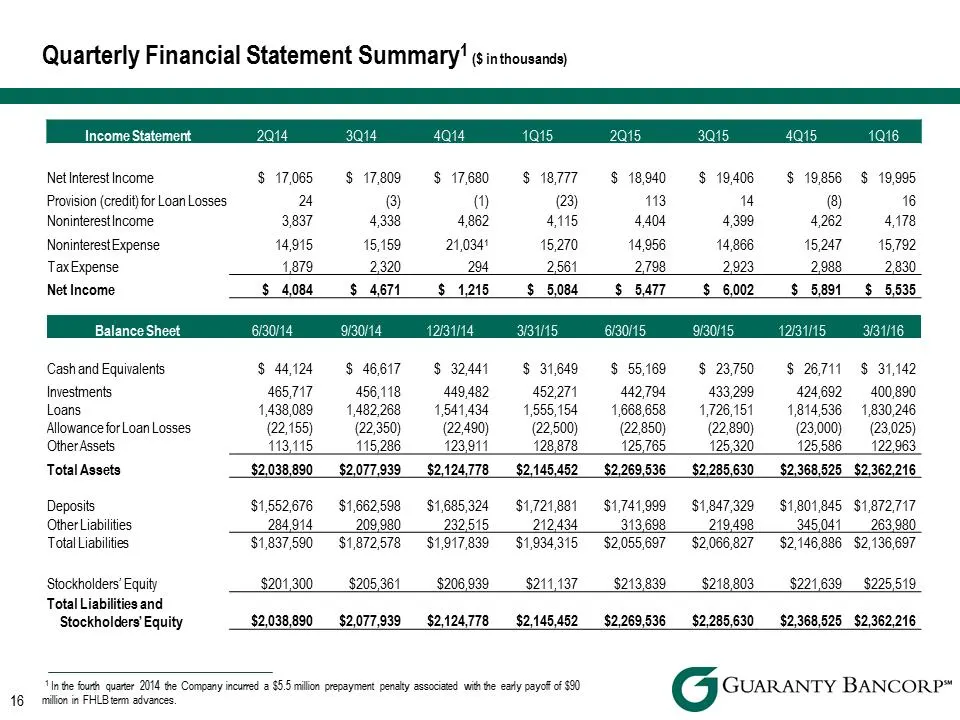
Slide 16: Income Statement and Balance Sheet
Income Statement 2Q14 3Q14 4Q14 1Q15 2Q15 3Q15 4Q15 1Q16 Net Interest Income $ 17,065 $ 17,809 $ 17,680 $ 18,777 $ 18,940 $ 19,406 $ 19,856 $ 19,995 Provision (credit) for Loan Losses 24 (3) (1) (23) 113 14 (8) 16 Noninterest Income 3,837 4,338 4,862 4,115 4,404 4,399 4,262 4,178 Noninterest Expense
Slide 17: Colorado Market
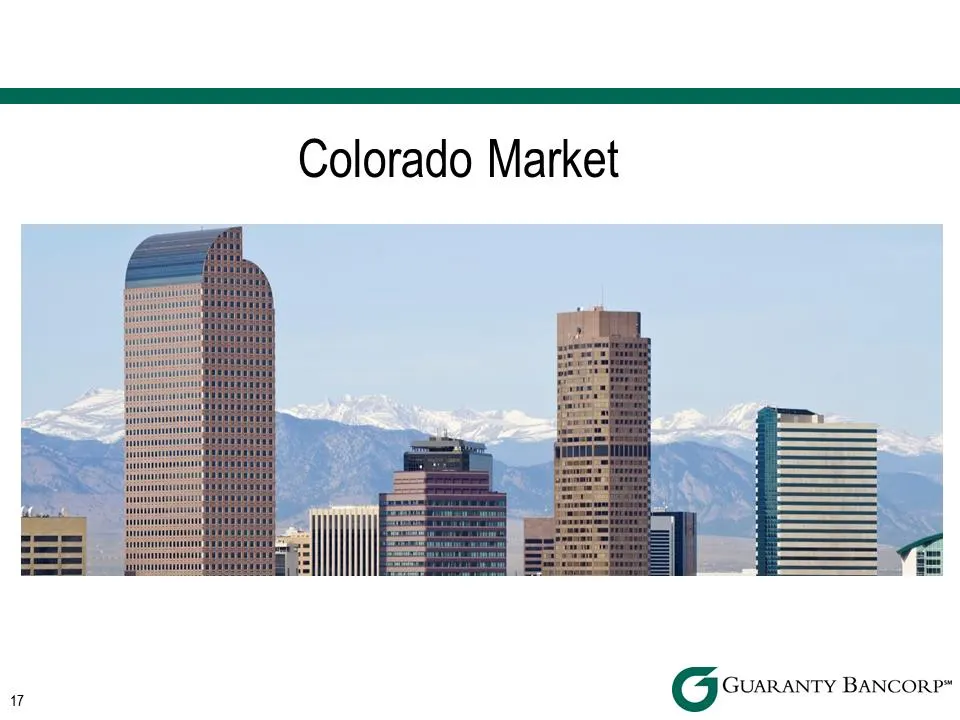
Colorado Market a G GUARANTY BANCORP”
Slide 18: Market Data: Demographics
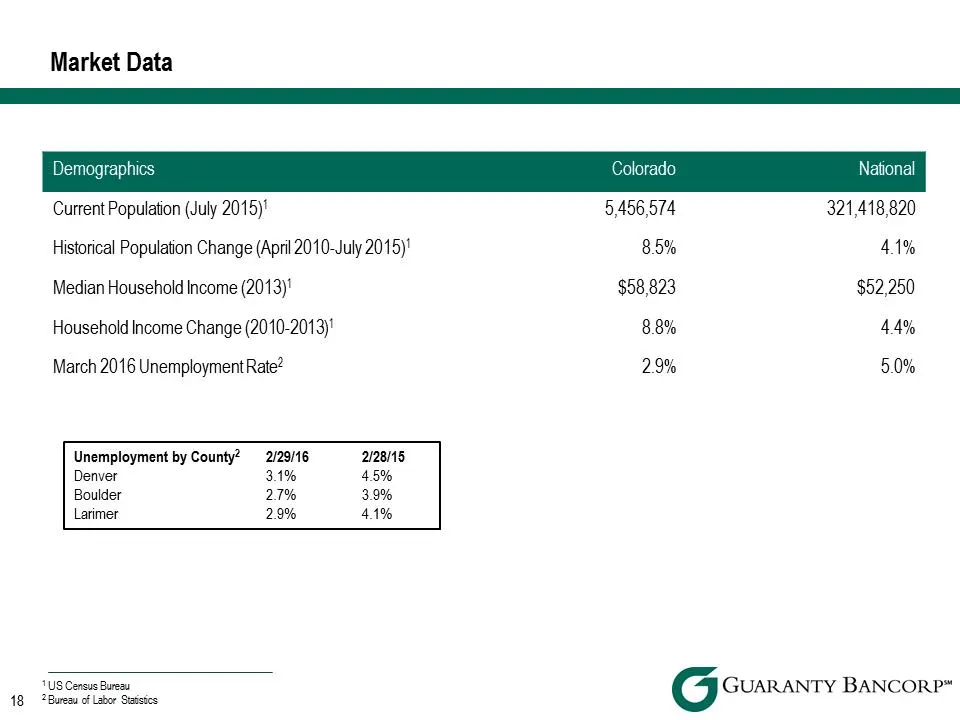
Demographics Colorado National Current Population (July 2015)1 5,456,574 321,418,820 Historical Population Change (April 2010-July 2015)1 8.5% 4.1% Median Household Income (2013)1 $58,823 $52,250 Household Income Change (2010-2013)1 8.8% 4.4% March 2016 Unemployment Rate2 2.9% 5.0% Market Data 18 1
Slide 19: Colorado Business Climate and Growth
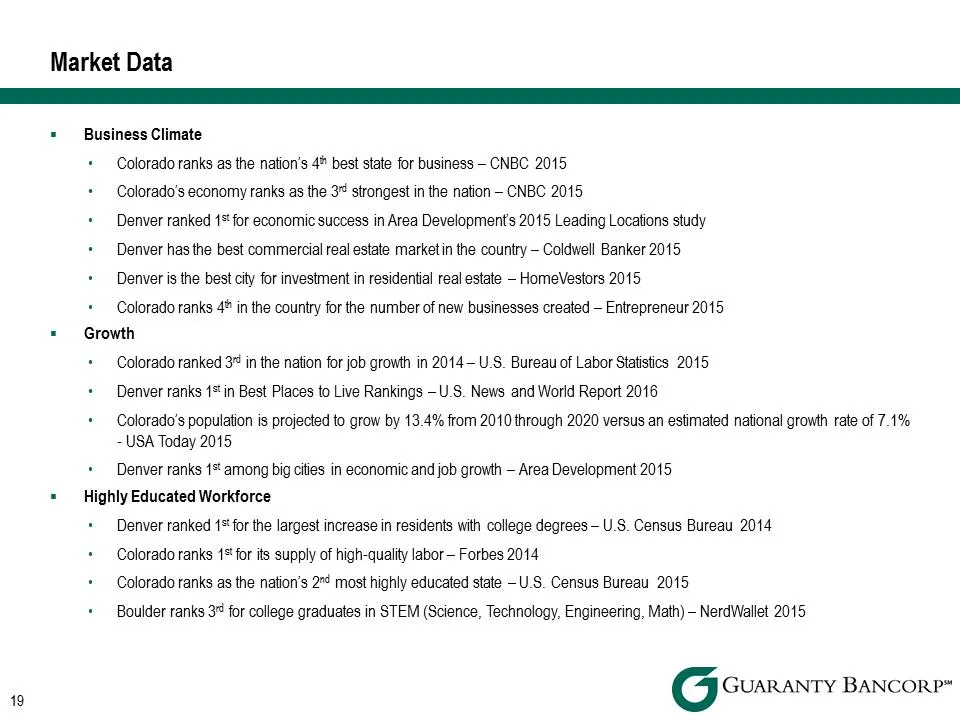
.Business Climate •Colorado ranks as the nation’s 4th best state for business – CNBC 2015 •Colorado’s economy ranks as the 3rd strongest in the nation – CNBC 2015 •Denver ranked 1st for economic success in Area Development’s 2015 Leading Locations study •Denver has the best commercial real estate ma
Slide 20: Market Data – Largest Metro Denver Employers
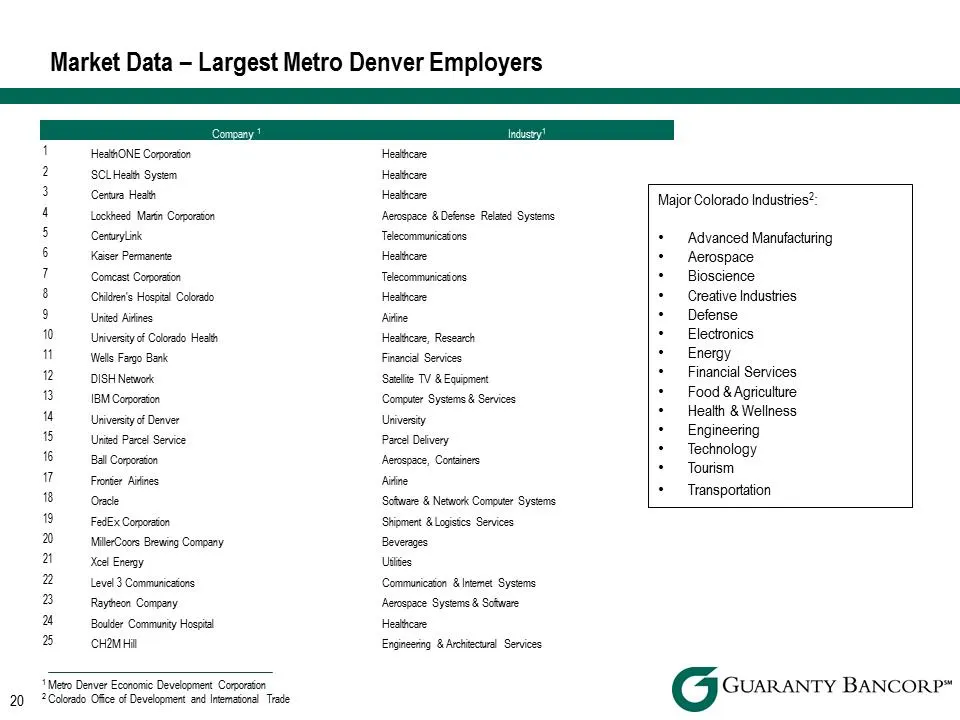
20 Market Data – Largest Metro Denver Employers Company 1 Industry1 1HealthONE Corporation Healthcare 2 SCL Health System Healthcare 3 Centura Health Healthcare 4 Lockheed Martin Corporation Aerospace & Defense Related Systems 5 CenturyLink Telecommunications 6 Kaiser Permanente Healthcare 7 Comcast
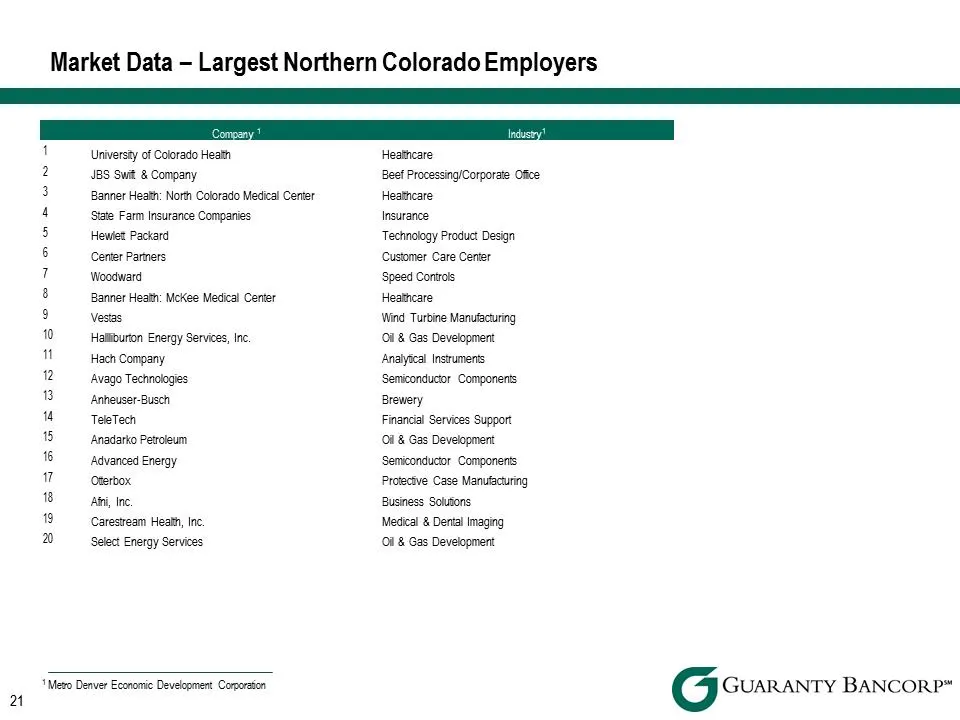
Slide 21: Market Data – Largest Northern Colorado Employers
21 Market Data – Largest Northern Colorado Employers Company 1 Industry1 1 University of Colorado Health Healthcare 2 JBS Swift & Company Beef Processing/Corporate Office 3 Banner Health: North Colorado Medical Center Healthcare 4 State Farm Insurance Companies Insurance 5 Hewlett Packard Technology
Slide 22: Reconciliation of Non-GAAP Financial Measures
Reconciliation of Non-GAAP Financial Measures 22
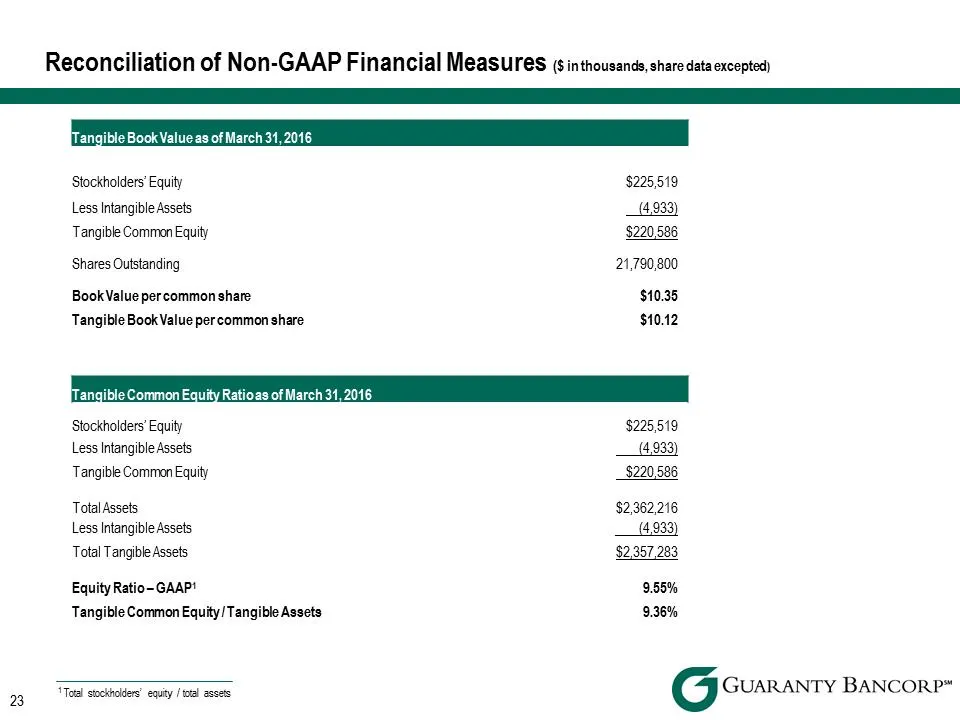
Slide 23: Tangible Book Value and Tangible Common Equity Ratio
Tangible Book Value as of March 31, 2016 Stockholders’ Equity $225,519 Less Intangible Assets (4,933) Tangible Common Equity $220,586 Shares Outstanding 21,790,800 Book Value per common share $10.35 Tangible Book Value per common share $10.12 Tangible Common Equity Ratio as of March 31, 2016 Stockho
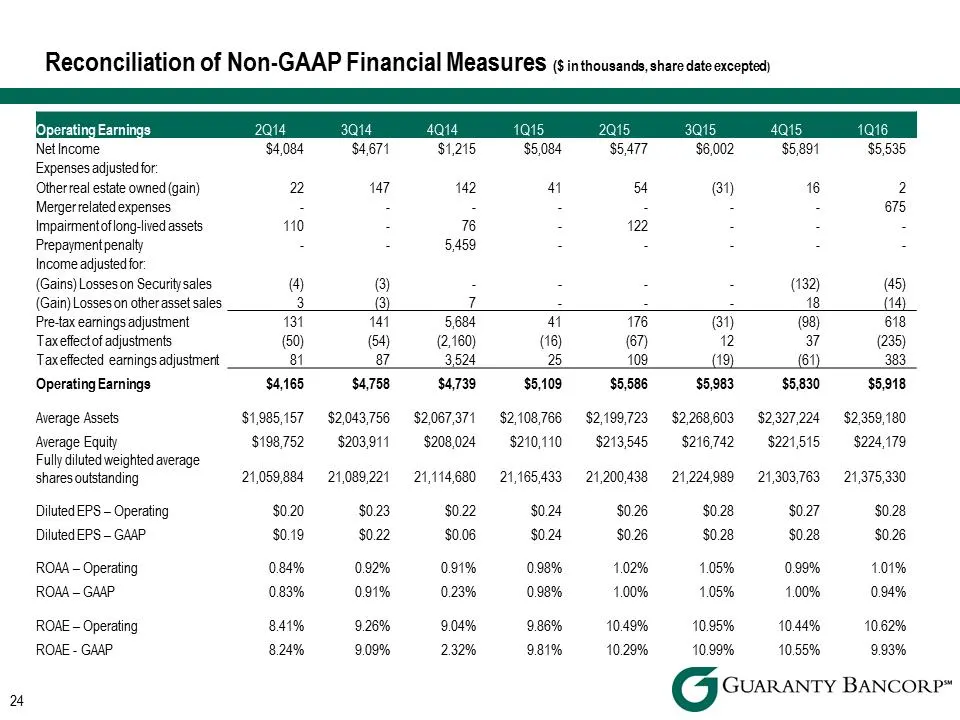
Slide 24: Operating Earnings reconciliation
Operating Earnings 2Q14 3Q14 4Q14 1Q15 2Q15 3Q15 4Q15 1Q16 Net Income $4,084 $4,671 $1,215 $5,084 $5,477 $6,002 $5,891 $5,535 Expenses adjusted for: Other real estate owned (gain) 22 147 142 41 54 (31) 16 2 Merger related expenses- - - 675 Impairment of long-lived assets 110 - 76 - 122 - - - Prepaym
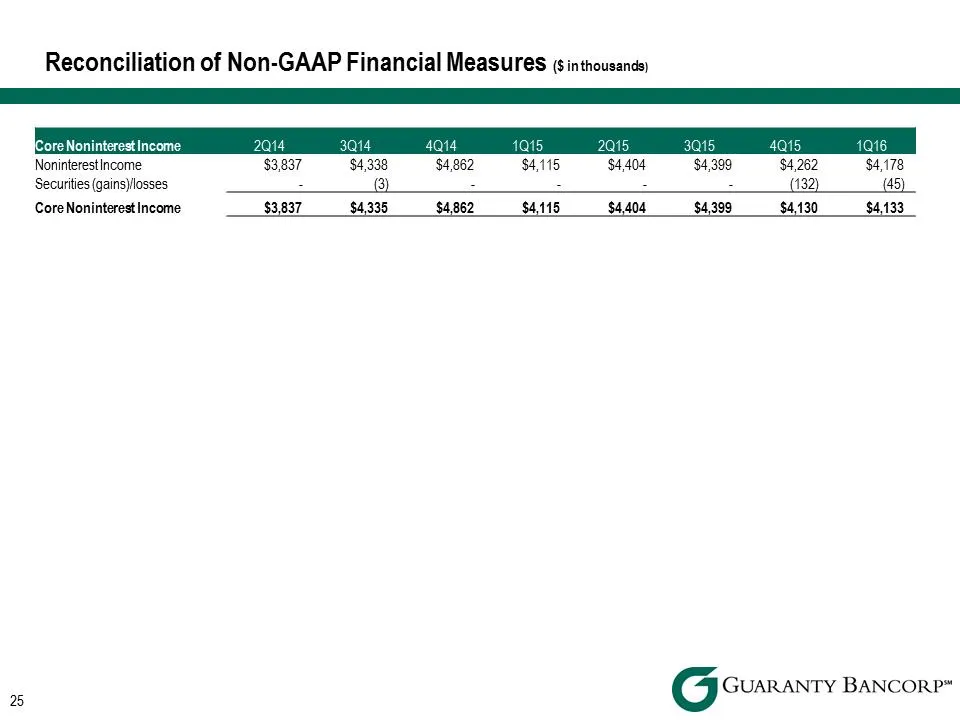
Slide 25: Core Noninterest Income reconciliation
25 Reconciliation of Non-GAAP Financial Measures ($ in thousands) Core Noninterest Income 2Q14 3Q14 4Q14 1Q15 2Q15 3Q15 4Q15 1Q16 Noninterest Income $3,837 $4,338 $4,862 $4,115 $4,404 $4,399 $4,262 $4,178 Securities (gains)/losses - (3) - - - - (132) (45) Core Noninterest Income $3,837 $4,335 $4,862
Source: SEC EDGAR · 8-K filed May 4, 2016
More decks from Guaranty Bancorp
 Merger or Acquisition (May 2018)19 slides · May 23, 2018
 Merger or Acquisition (July 2017)8 slides · Jul 19, 2017
 D.A. Davidson 19th Annual Financial Services Conference 201722 slides · May 9, 2017
 FIG Partners 8th Annual West Coast Bank CEO Forum 201727 slides · Jan 31, 2017
 2016 FBR 23rd Annual Investor Conference27 slides · Nov 28, 2016
 2016 KBW Community Bank Investor Conference26 slides · Aug 1, 2016