MutualFirst Financial — Shareholder Meeting (April 2011)
43 slides from MutualFirst Financial's shareholder meeting presentation, Apr 29, 2011
Slide 1: Annual Meeting
Annual Meeting MutualFirst Financial, Inc. April 27, 2011 Symbol: MFSF

Slide 2: David Heeter, President and CEO
David Heeter President and CEO MutualFirst Financial, Inc.

Slide 3: 121st Annual Meeting
1215t Annual Meeting MutualBank MutualFirst Financial, Inc.
Slide 4: Forward Looking Statement
Forward Looking Statement This presentation contains statements which constitute forward looking statements within the meaning of the Private Securities Litigation ReformAct of 1995. These statements may appear in a number of places in this presentation and include statements regarding the intent, b

Slide 5: David Heeter, President and CEO
David Heeter President and CEO MutualFirst Financial, Inc.
Slide 6: 2010 in Review
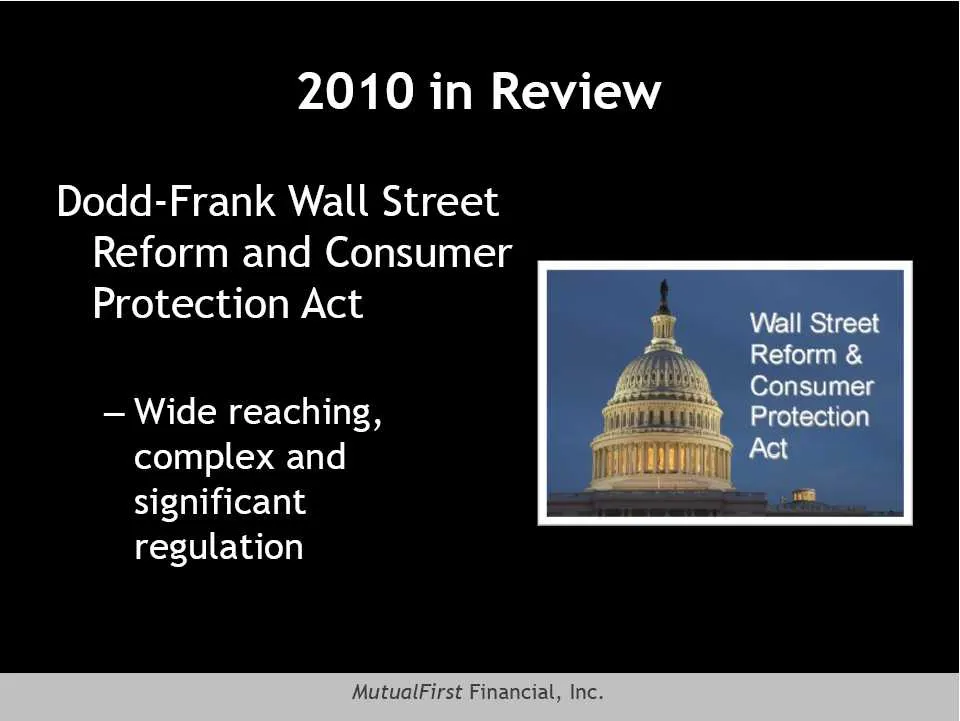
2010 in Review Dodd-Frank Wall Street Reform and Consumer Protection Act — Wide reaching, complex and significant regulation MutualFirst Financial, Inc.
Slide 7: MutualBank Markets
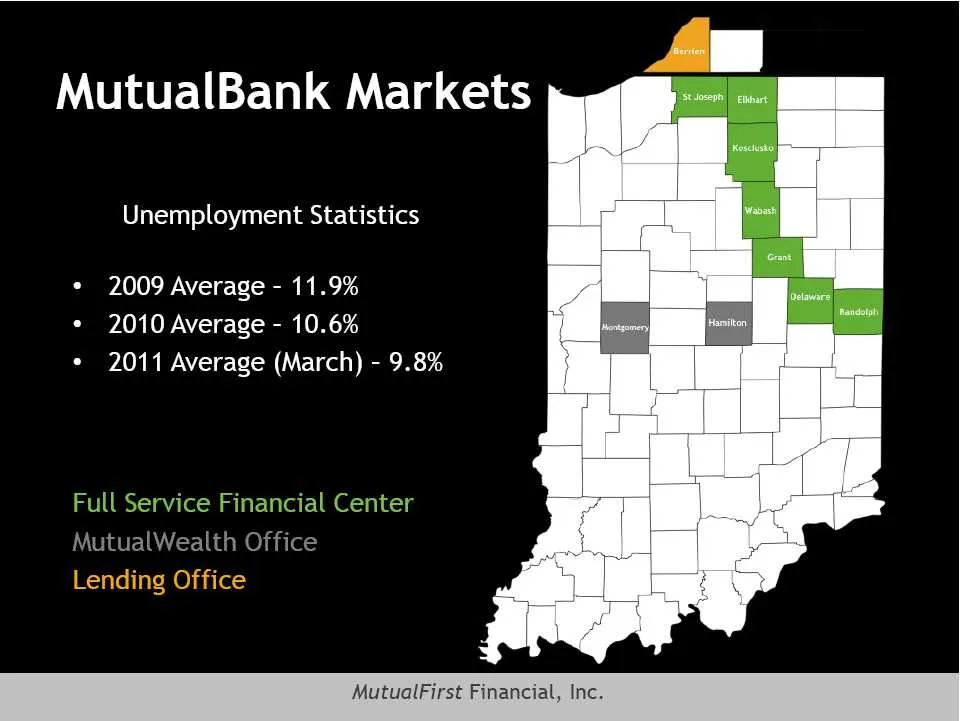
MutualBank Markets Unemployment Statistics * 2009 Average - 11.9% * 2010 Average - 10.6% * 2011 Average (March) - 9.8% ervice Financial Center MutualWealth Office MutualFirst Financ
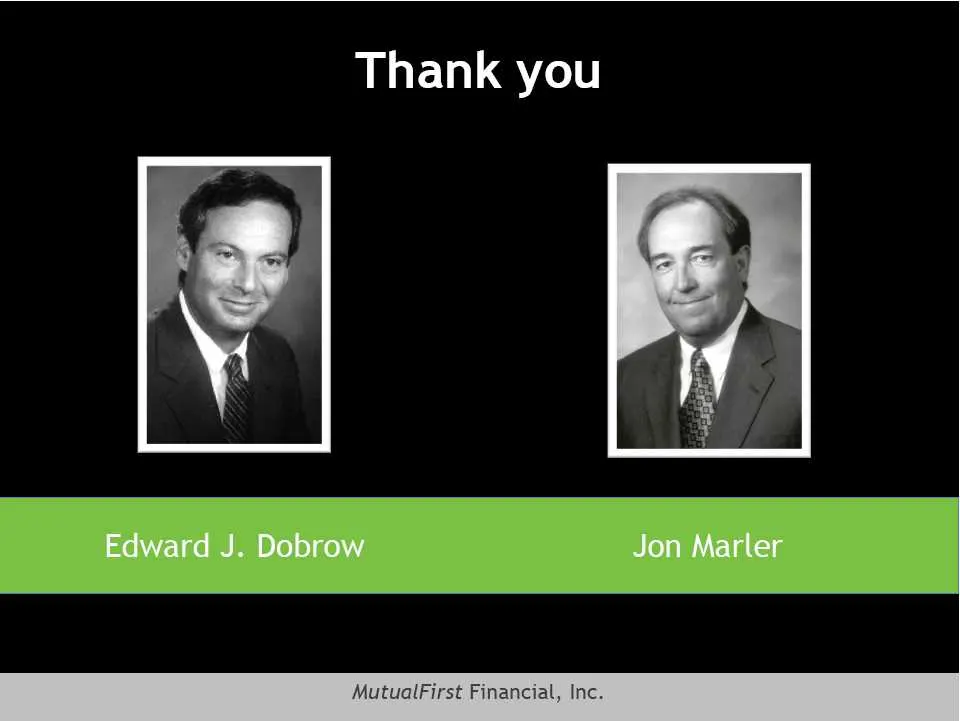
Slide 8: Thank you
Thank you Edward J. Dobrow Jon Marler MutualFirst Financial, Inc.
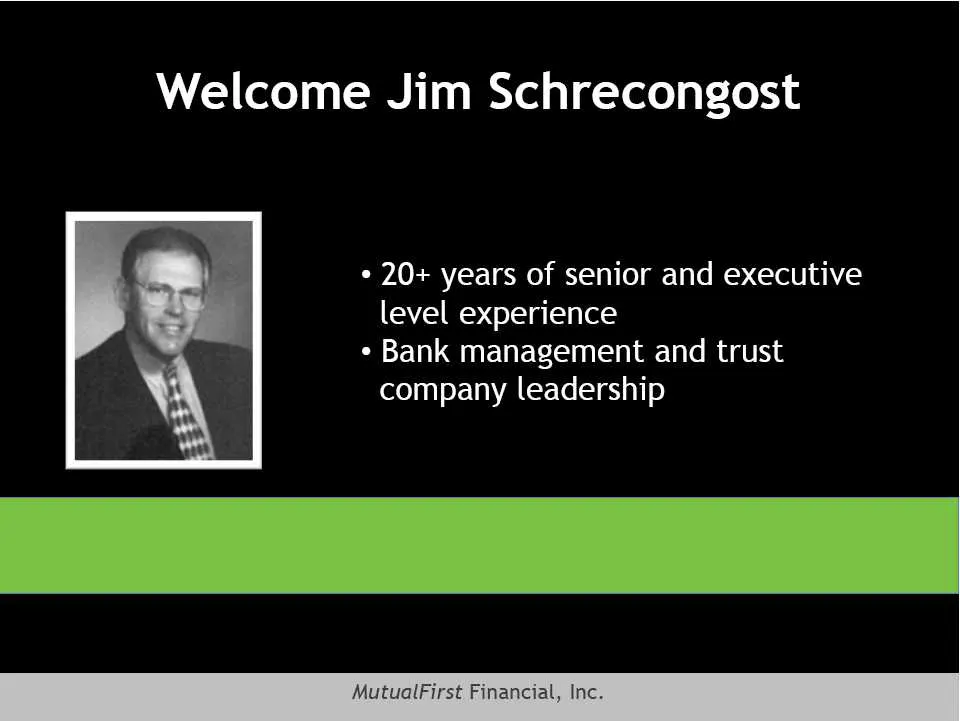
Slide 9: Welcome Jim Schrecongost
Welcome Jim Schrecongost * 20+ years of senior and executive level experience ¢ Bank management and trust company leadership MutualFirst Financial, Inc.
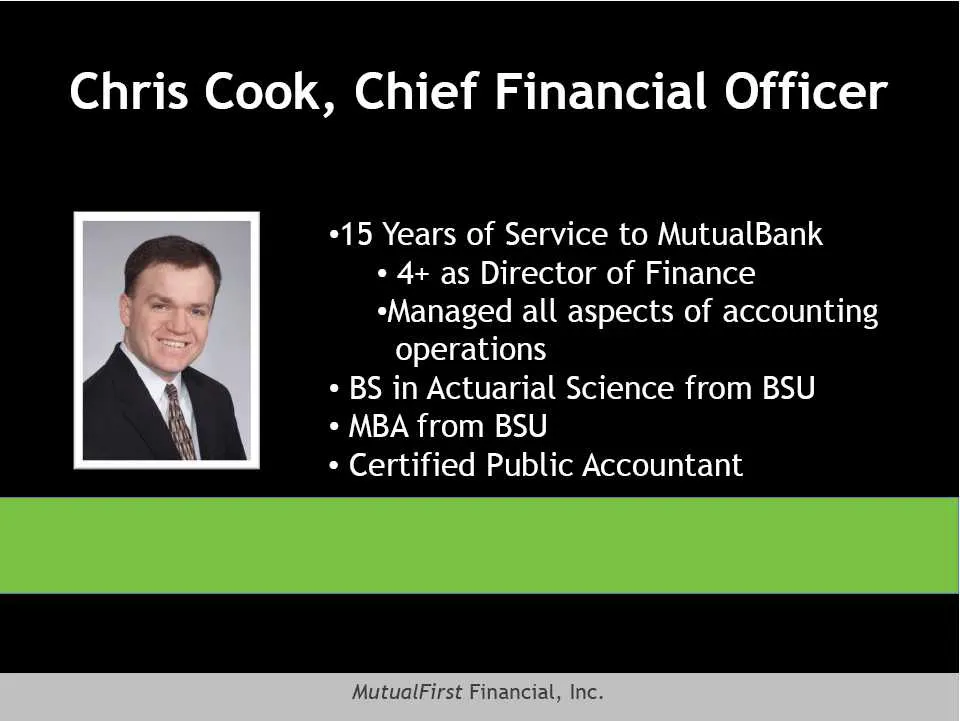
Slide 10: Chris Cook, Chief Financial Officer
Chris Cook, Chief Financial Officer °15 Years of Service to MutualBank ¢ 4+ as Director of Finance «Managed all aspects of accounting operations ¢ BS in Actuarial Science from BSU * MBA from BSU ¢ Certified Public Accountant MutualFirst Financial, Inc.
Slide 11: 2010 Operational Focus
2010 Operational Focus MutualFirst Financial, Inc.
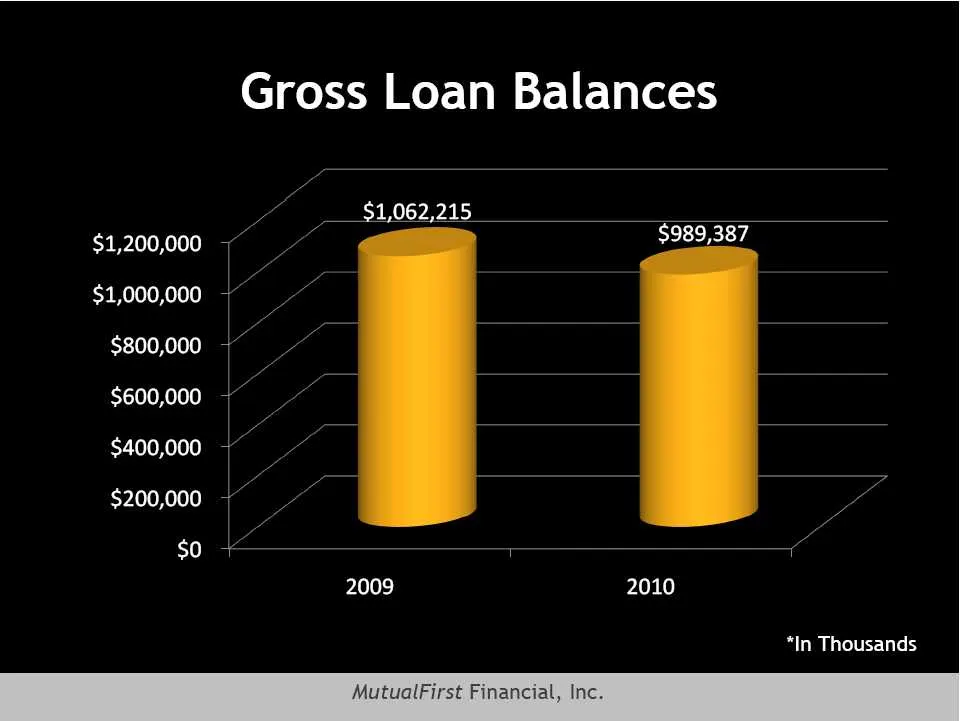
Slide 12: Gross Loan Balances
Gross Loan Balances $1,062,215 $989,387 $1,200,000 + $1,000,000 $800,000 $600,000 $400,000 $200,000 $0 az < / 2009 2010 *In Thousands
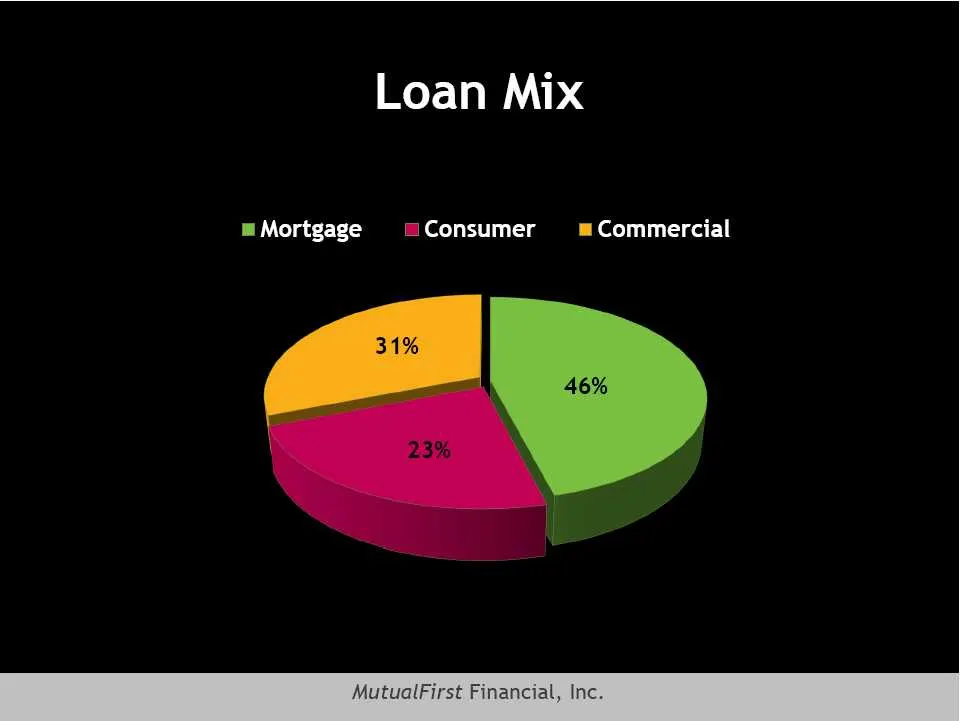
Slide 13: Loan Mix
Loan Mix mMortgage Consumer s Commercial
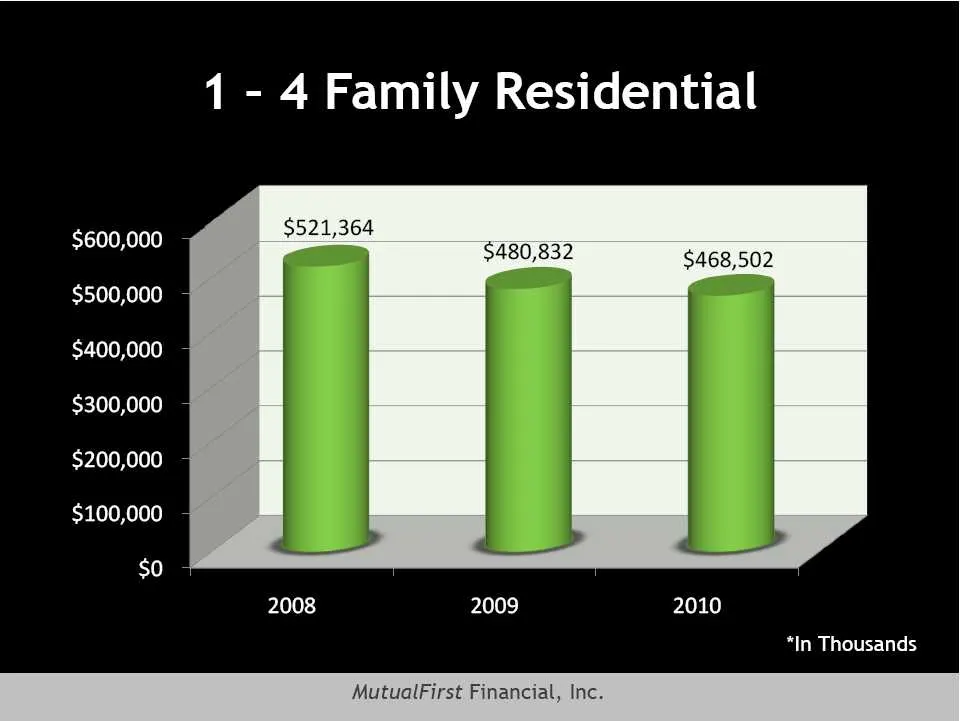
Slide 14: Family Residential Loans
1 - 4 Family Residential $521,364 $600,000 $500,000 $400,000 $300,000 $200,000 $100,000 | | | 2008 2009 2010 $o *In Thousands
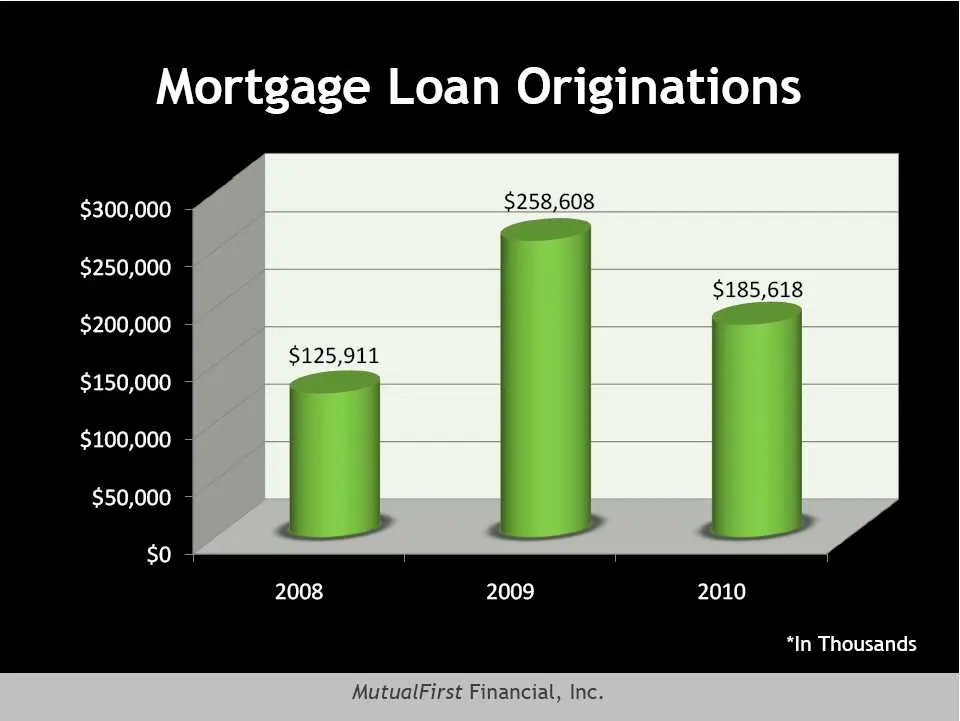
Slide 15: Mortgage Loan Originations
Mortgage Loan Originations $300,000 + $258,608 $250,000 $200,000 $125,911 $150,000 $100,000 $50,000 so + 2008 2009 $185,618 2010 *In Thousands
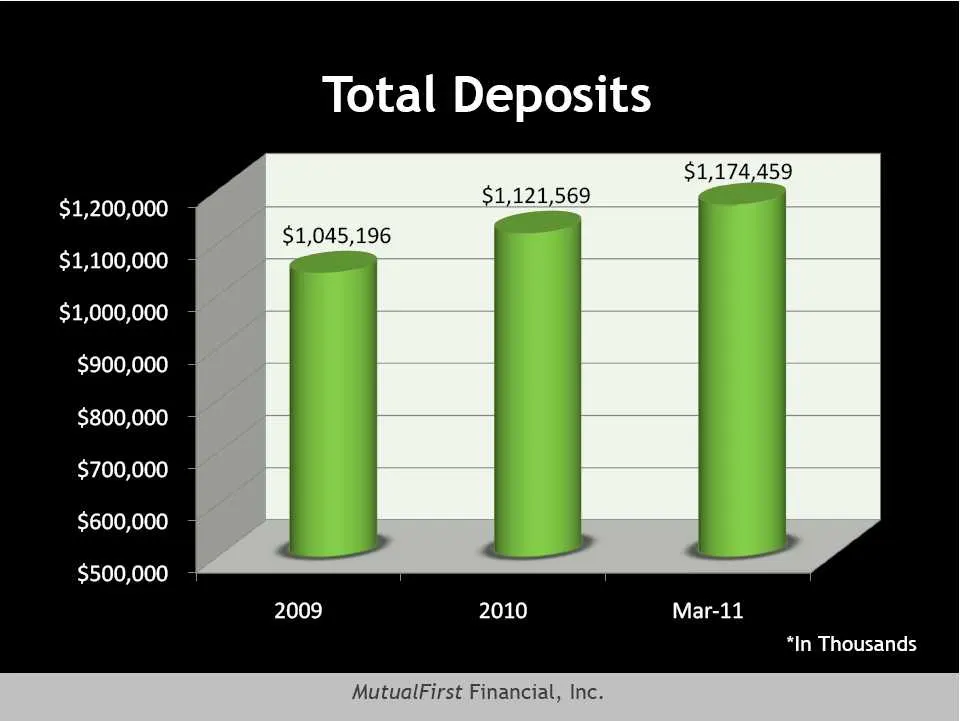
Slide 16: Total Deposits
Total Deposits $1,174,459 $1,200,000 $1,121,569 $1,045,196 $1,100,000 $1,000,000 + $900,000 - $800,000 $700,000 + $600,000 $500,000 ~ 2009 2010 Mar-11 *In Thousands MutualFirst
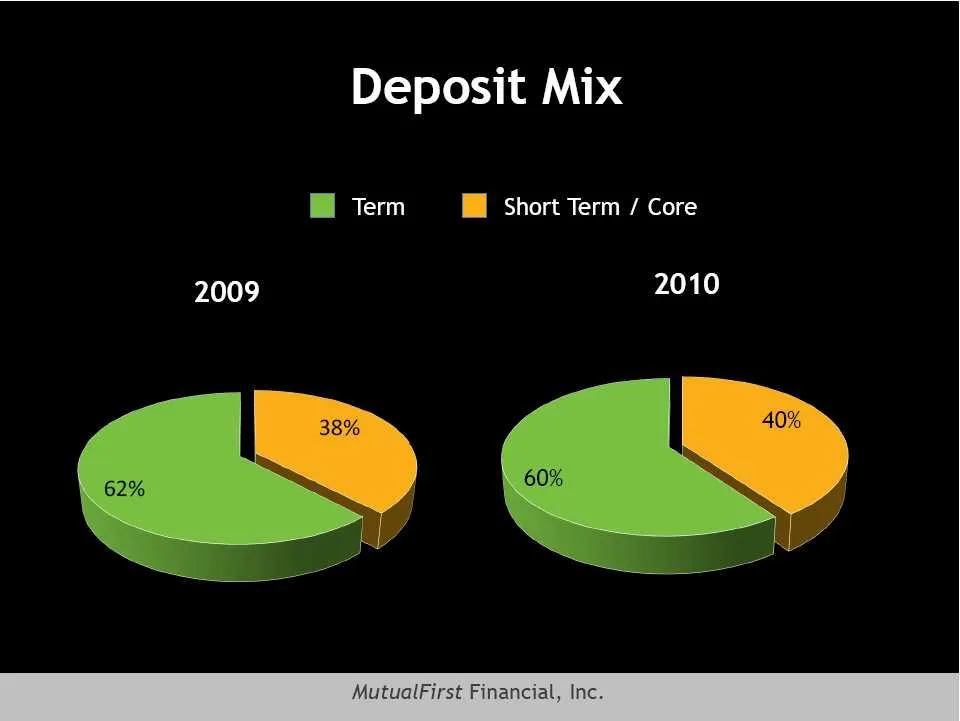
Slide 17: Deposit Mix
Deposit Mix @ Term Short Term / Core 2009 2010 MutualFirst Financial, Inc.

Slide 18: Trust
Trust Investment Retirement Plan Services we MutualWealth Management Group
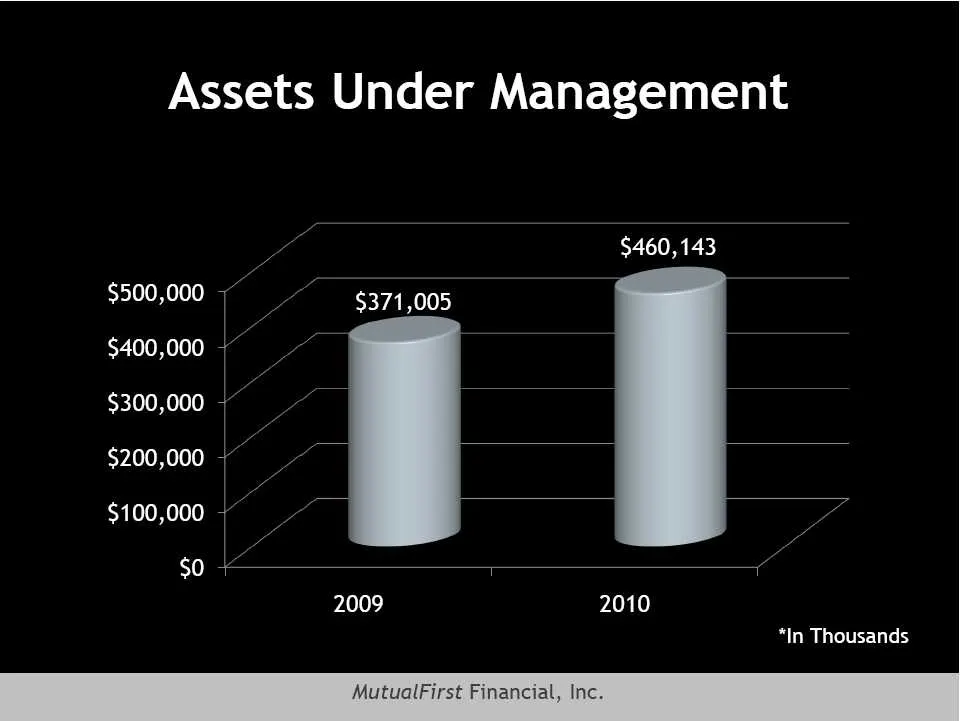
Slide 19: Assets Under Management
Assets Under Management L $460,143 $500,000 if ; $371,005 $400,000 |~ $300,000 [ of? fe a $200,000 / $100,000 | $0 + 2009 2010 *In Thousands
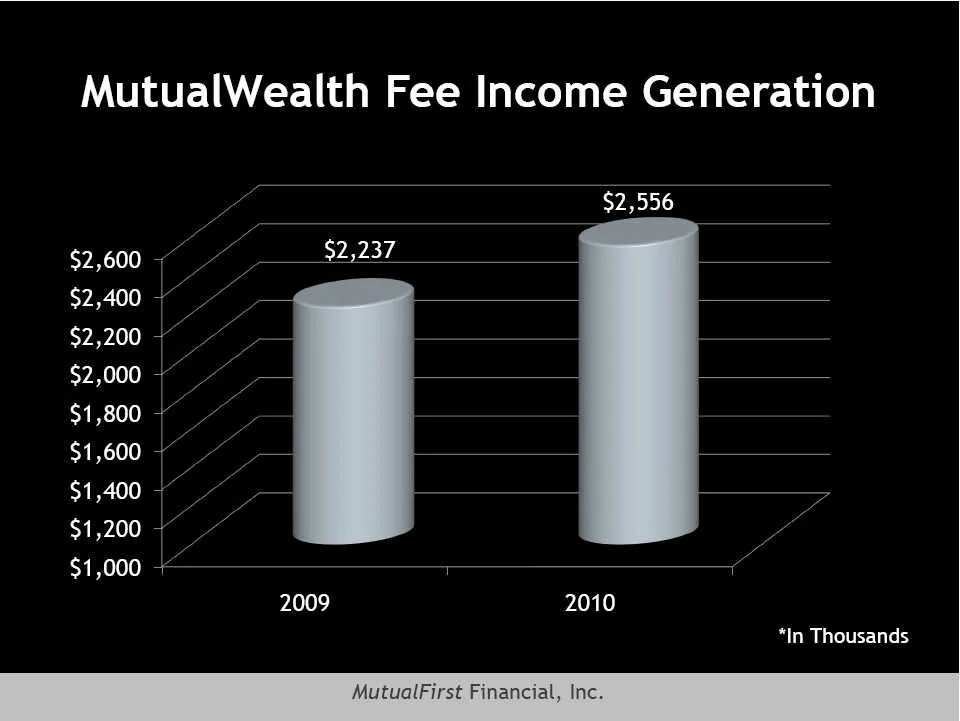
Slide 20: MutualWealth Fee Income Generation
MutualWealth Fee Income Generation $2,556 $2,600 + $2,237 $2,400 $2,200 ~ $2,000 -~— $1,800 $1,600 - $1,400 $1,200 “| $1,000 -— a 2009 2010 *In Thousands MutualFirst Financial, Inc

Slide 21: Retirement Plans
Retirement Plans Mutual Funds Annuities 529 Plans Stocks & Bonds 401k Rollovers eo MutualFinancial Investment Services
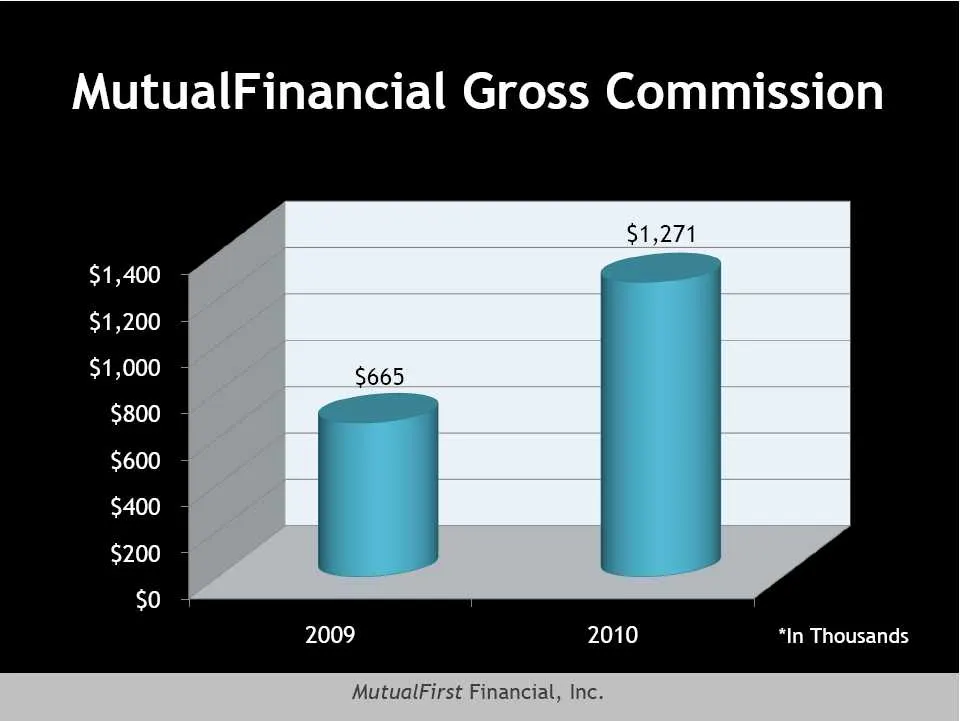
Slide 22: MutualFinancial Gross Commission
MutualFinancial Gross Commission $1,400 $1,200 - $1,000 - $800 - $600 - $400 - $200 - $0 2009 2010 *In Thousands MutualFirst Financial, Inc.
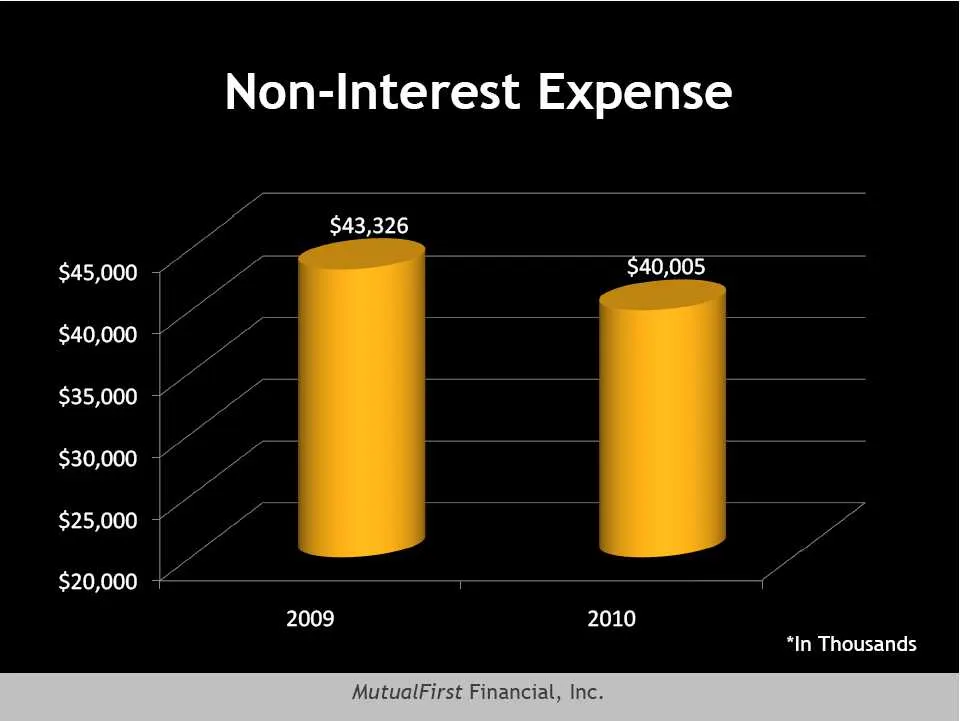
Slide 23: Non-Interest Expense
$45,000 + $40,000 $35,000 $30,000 $25,000 $20,000 + L . L Non-Interest Expense $43,326 ye $40,005 2009 2010 MutualFir *In Thousands

Slide 24: Financial Performance
Financial Performance MutualFirst Financial, Inc.
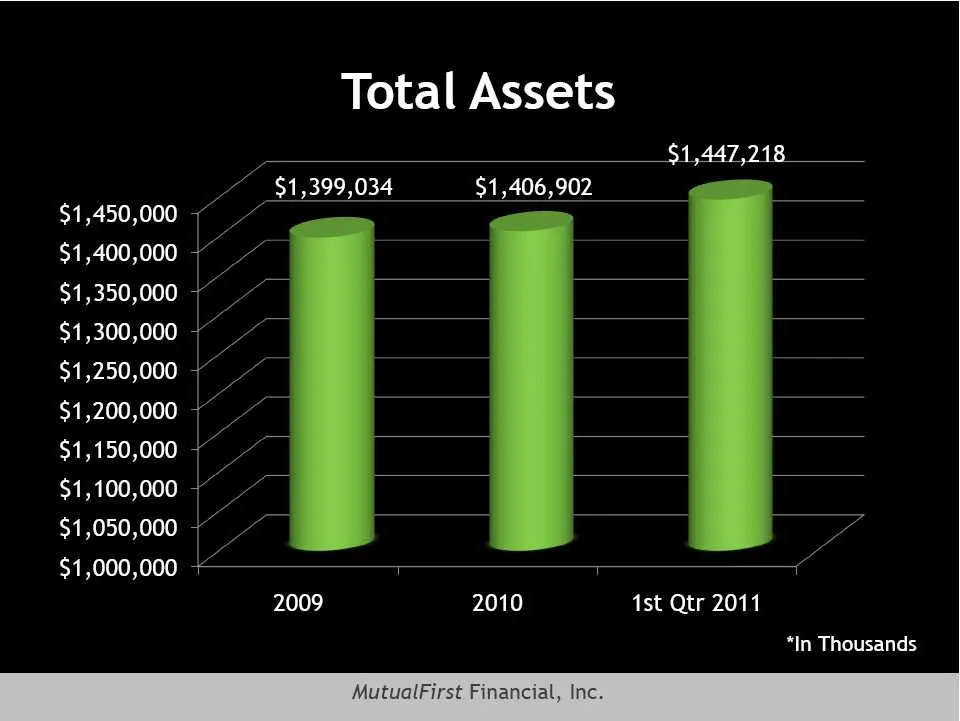
Slide 25: Total Assets
$1,450,000 $1,400,000 $1,350,000 $1,300,000 $1,250,000 $1,200,000 $1,150,000 $1,100,000 $1,050,000 $1,000,000 Total Assets “ $1,399,034 $1,406,902 [en + a 4 Yo | ~ 4 S “ iY | ~ 2009 2010 1st Qtr 2011 *In Thousands
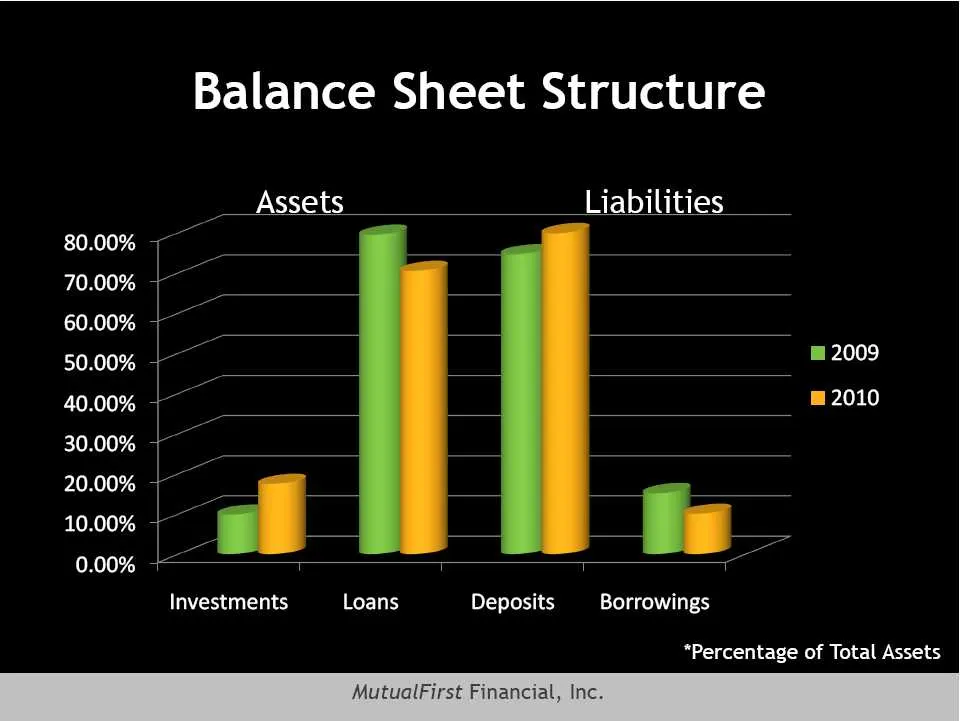
Slide 26: Balance Sheet Structure
80.00% + 70.00% 60.00% 50.00% 40.00% 30.00% 20.00% 10.00% 0.00% Balance Sheet Structure Assets Liabilities Investments Loans Deposits Borrowings “Percentage of Total Assets
Slide 27: Total Deposits
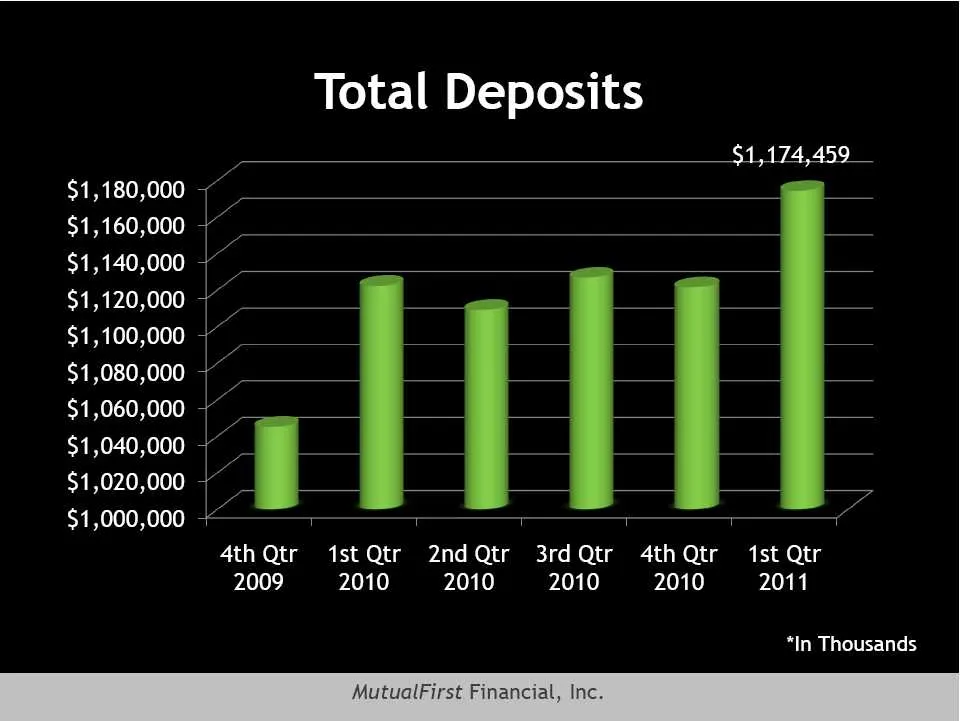
$1,180,000 $1,160,000 $1,140,000 $1,120,000 $1,100,000 $1,080,000 $1,060,000 $1,040,000 $1,020,000 $1,000,000 Total Deposits $1,174,459 iv Vv Y iY Z LF | T T T T T “ 4thQtr 1stQtr 2ndQtr 3rdQtr 4thQtr 1st Qtr 2009 2010 2010 2010 2010 2011 *In Thousands
Slide 28: Loans Receivable
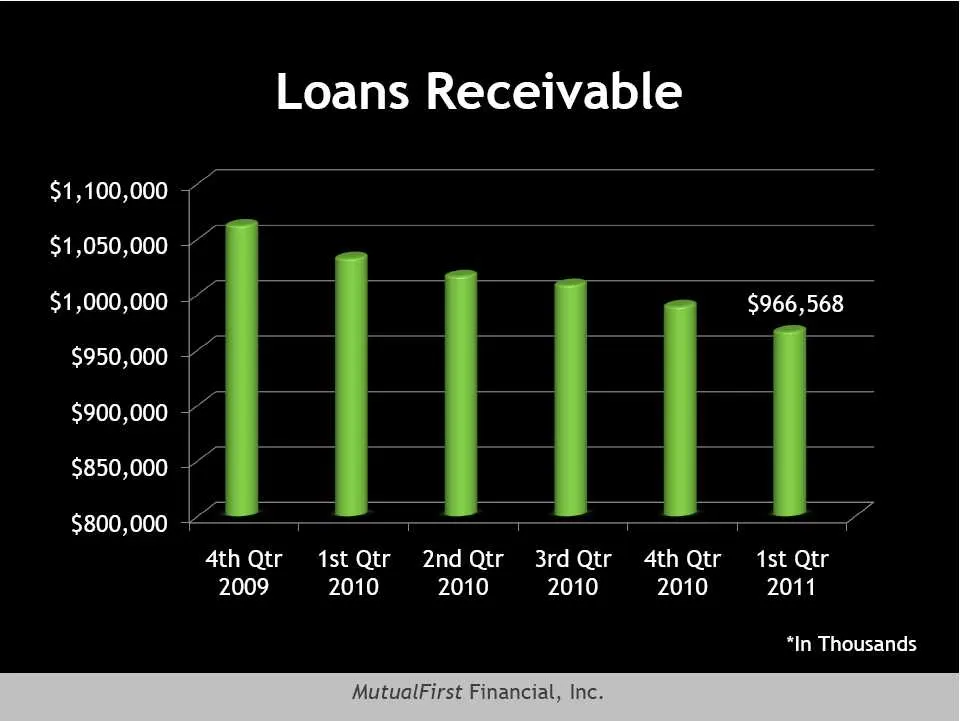
$1,100,000 $1,050,000 $1,000,000 $950,000 $900,000 $850,000 $800,000 Loans Receivable | | $966,568 T T T T T i 4thQtr 1stQtr 2ndQtr 3rdQtr 4thQtr 1st Qtr 2009 2010 2010 2010 2010 2011 *In Thousands
Slide 29: Net Interest Margin
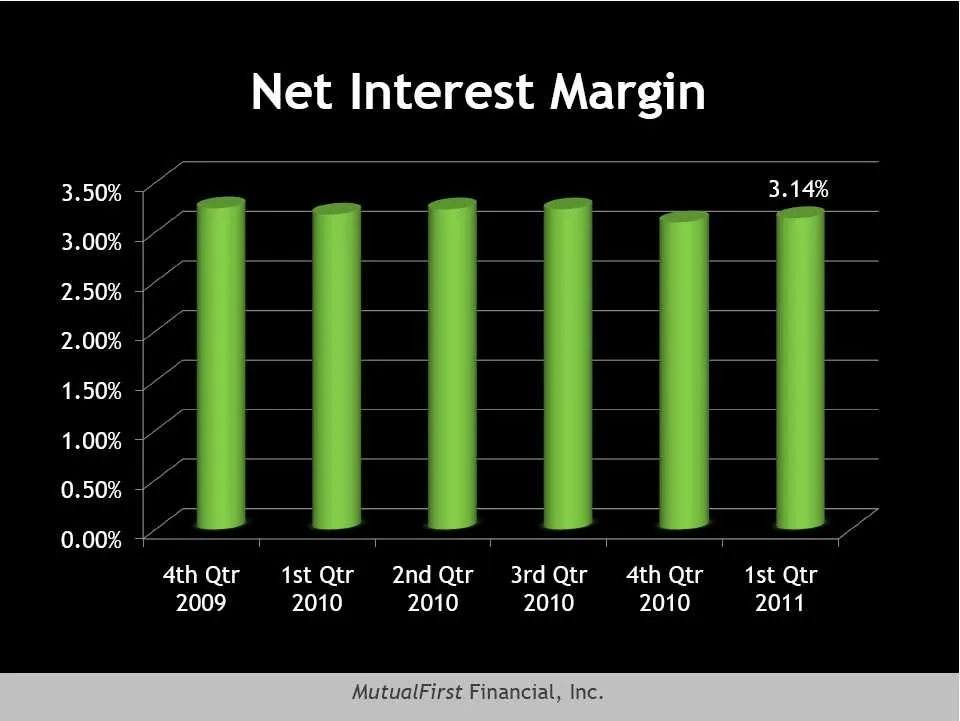
Net Interest Margin 3.50% 7 3.14% 3.00% L 2.50% 2.00% \ 1.50% 1.00% 0.50% i 0.00% 4thQtr 1stQtr 2ndQtr 3rdQtr 4thQtr 1st Qtr 2009 2010 2010 2010 2010 2011
Slide 30: Net Interest Income
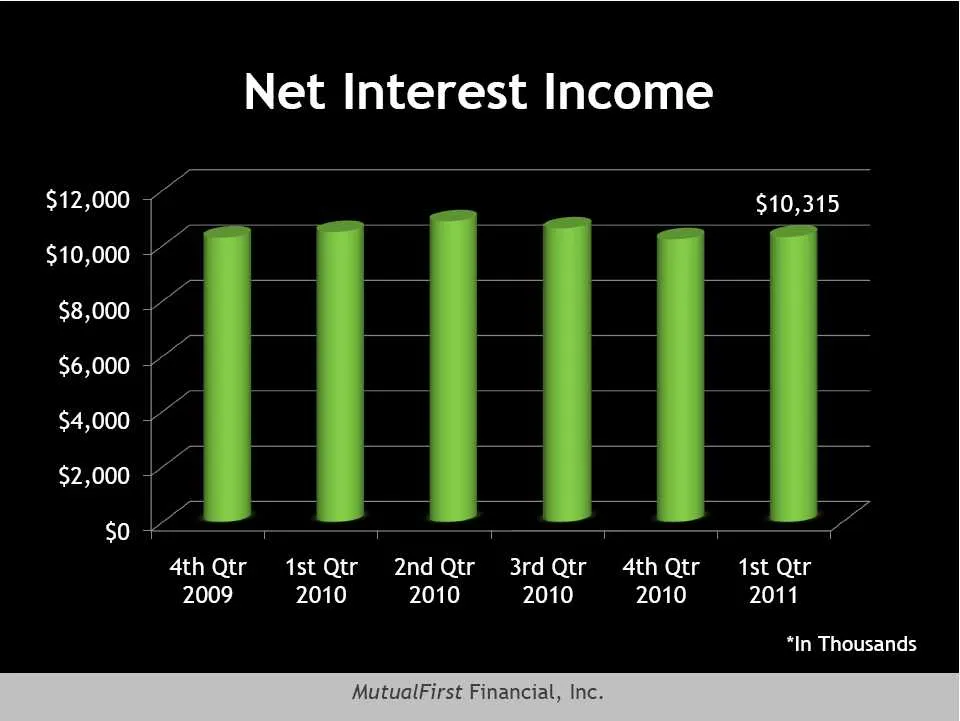
$12,000 + $10,000 - $8,000 - $6,000 ~ $4,000 ~ $2,000 ~ Net Interest Income $0 $10,315 a a T T T T T 1 4thQtr 1stQtr 2ndQtr 3rdQtr 4thQtr 1st Qtr 2009 2010 2010 2010 2010 2011 *In Thousands

Slide 31: Credit Quality
Credit Quality MutualFirst Financial, Inc.
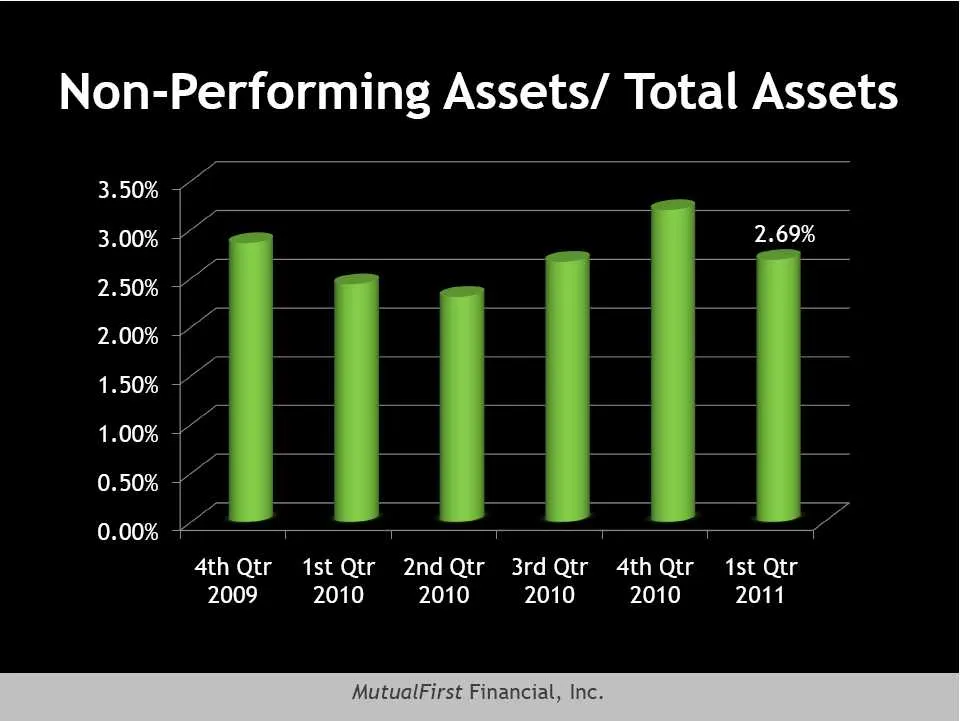
Slide 32: Non-Performing Assets/ Total Assets
Non-Performing Assets/ Total Assets 3.50% ~ 2.69% A4AthQtr 1stQtr 2ndQtr 3rdQtr 4thQtr 1st Qtr 2009 2010 2010 2010 2010 2011 3.00% 2.50% 2.00% 1.50% 1.00% 0.50% 0.00%
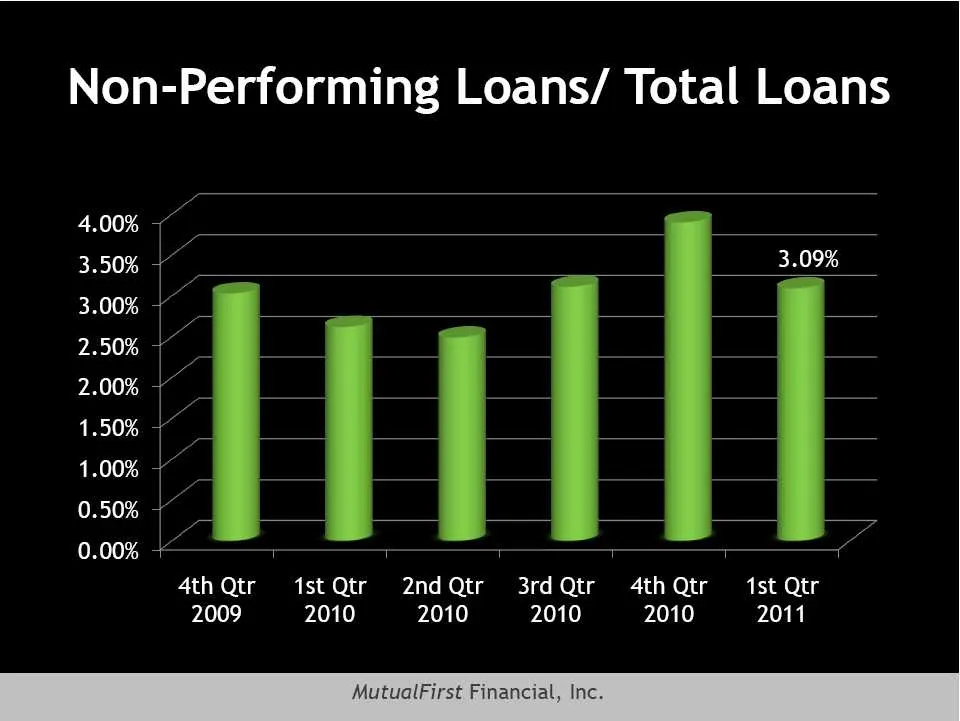
Slide 33: Non-Performing Loans/ Total Loans
Non-Performing Loans/ Total Loans 4.00% 3.50% 3.00% 2.50% 2.00% 1.50% 1.00% 0.50% 0.00% 3.09% lea ea + 4thQtr 1stQtr 2ndQtr 3rdQtr 4thQtr 1st Qtr 2009 2010 2010 2010 2010 2011
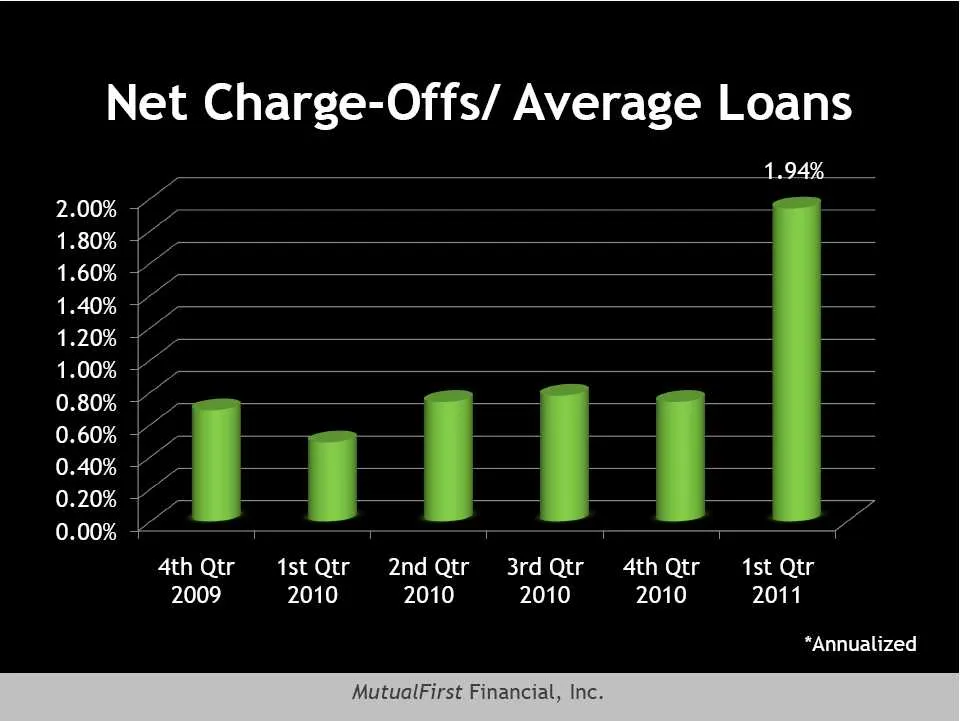
Slide 34: Net Charge-Offs/ Average Loans
Net Charge-Offs/ Average Loans 2.00% 1.80% 1.60% 1.40% 1.20% 1.00% 0.80% 0.60% 0.40% 0.20% 0.00% dsl ttl 4th Qtr 1stQtr 2ndQtr 3rdQtr 4th Qtr 1st Qtr 2009 2010 2010 2010 2010 2011 “Annualized
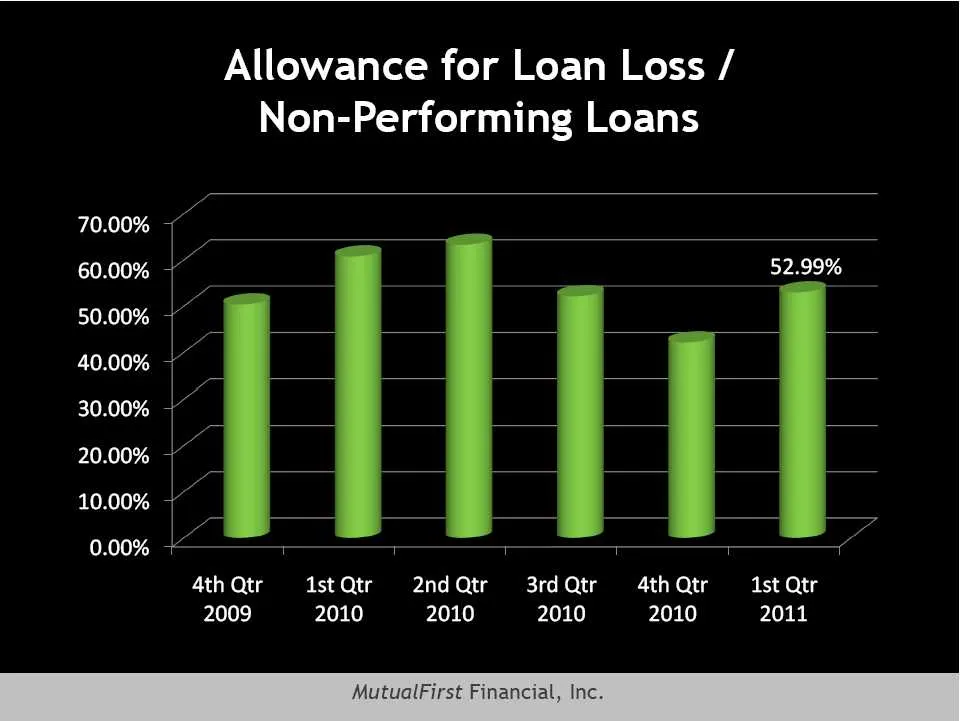
Slide 35: Allowance for Loan Loss / Non-Performing Loans
Allowance for Loan Loss / Non-Performing Loans 70.00% + 60.00% -— 52.99% 50.00% ~ 40.00% 30.00% 20.00% ~ 10.00% ~ 0.00% + 1 AthQtr i1stQtr 2ndQtr 3rdQtr 4thQtr 1st Qtr 2009 2010 2010 2010 2010 2011

Slide 36: Capital
Capital Capital Purchase Plan / T.A.R.P. MutualFirst Financial, Inc.
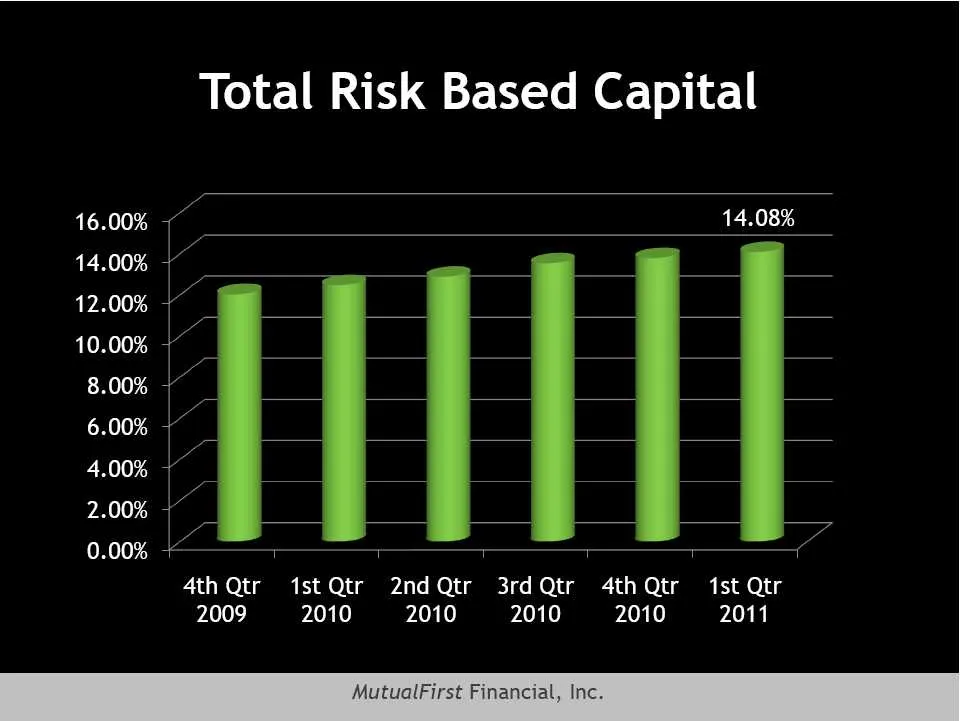
Slide 37: Total Risk Based Capital
Total Risk Based Capital 16.00% + 14.08% 14.00% ~ 12.00% ~ 10.00% ~ 8.00% a 6.00% ~ 4.00% + 2.00% i) 0.00% 1 1 T T 7 1 4thQtr 1stQtr 2ndQtr 3rdQtr 4thQtr 1st Qtr 2009 2010 2010 2010 2010 2011
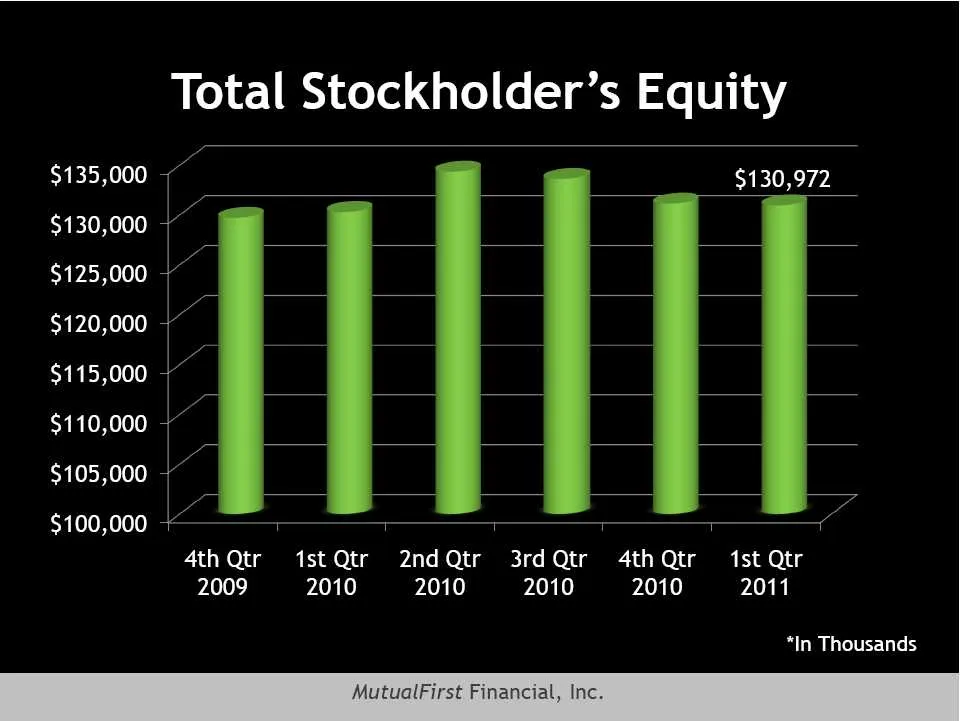
Slide 38: Total Stockholder's Equity
Total Stockholder’s Equity $135,000 + $130,972 4 T T T T T 1 4thQtr 1stQtr 2ndQtr 3rdQtr 4thQtr 1st Qtr 2009 2010 2010 2010 2010 2011 $130,000 $125,000 $120,000 $115,000 $110,000 $105,000 $100,000 - *In Thousands
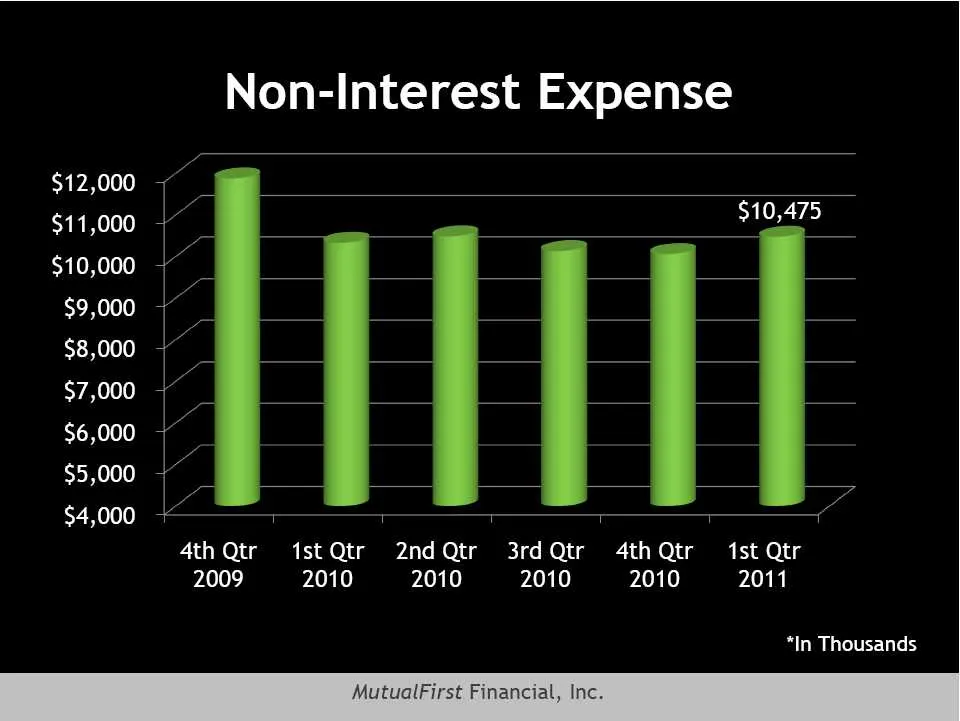
Slide 39: Non-Interest Expense
Non-Interest Expense $12,000 $11,000 $10,000 $9,000 $8,000 $7,000 $6,000 $5,000 $4,000 $10,475 1 1 1 1 7 f 4thQtr 1stQtr 2ndQtr 3rdQtr 4thQtr 1st Qtr 2009 2010 2010 2010 2010 2011 *In Thousands

Slide 40: 121st Annual Meeting
1215t Annual Meeting MutualBank MutualFirst Financial, Inc.

Slide 41: What does the future hold?
What does the future hold?

Slide 42: 121st Annual Meeting
1215t Annual Meeting MutualBank MutualFirst Financial, Inc.

Slide 43: Thank You
Thank You MutualFirst Financial, Inc.
Source: SEC EDGAR · 8-K filed Apr 29, 2011
More decks from MutualFirst Financial Inc
 Merger or Acquisition (October 2019)14 slides · Oct 29, 2019
 Shareholder Meeting (May 2019)18 slides · May 3, 2019
 2018 KBW Community Bank Investor Conference27 slides · Aug 1, 2018
 Shareholder Meeting (May 2018)28 slides · May 7, 2018
 Merger or Acquisition (October 2017)12 slides · Oct 4, 2017
 KBW 2017 Community Bank Investor Conference34 slides · Aug 3, 2017