Immunicon — Investor Presentation (November 2007)
29 slides from Immunicon's investor presentation, Nov 2, 2007
Slide 1: Cellular Information for Better Healthcare
Cellular Information for Better Healthcare Management Presentation November 2007
Slide 2: Forward Looking Statements
Forward Looking Statements This presentation may contain forward-looking statements that reflect management’s current views and opinions as to the status of the Company’s products, clinical trials, regulatory approval process, product development, research programs and other future events and operat
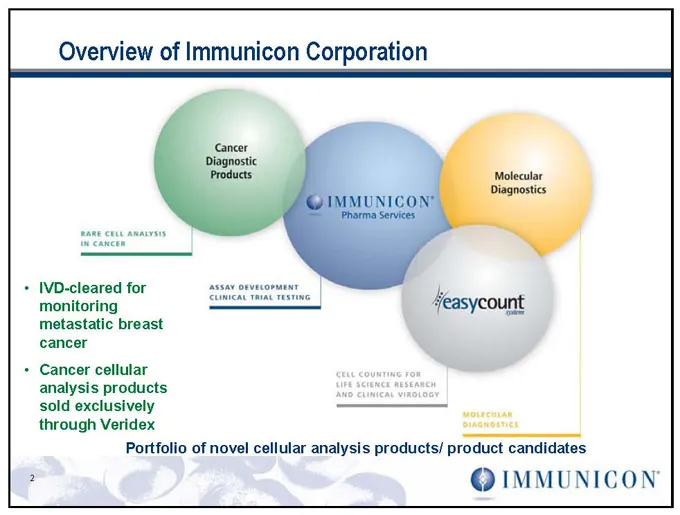
Slide 3: Overview of Immunicon Corporation
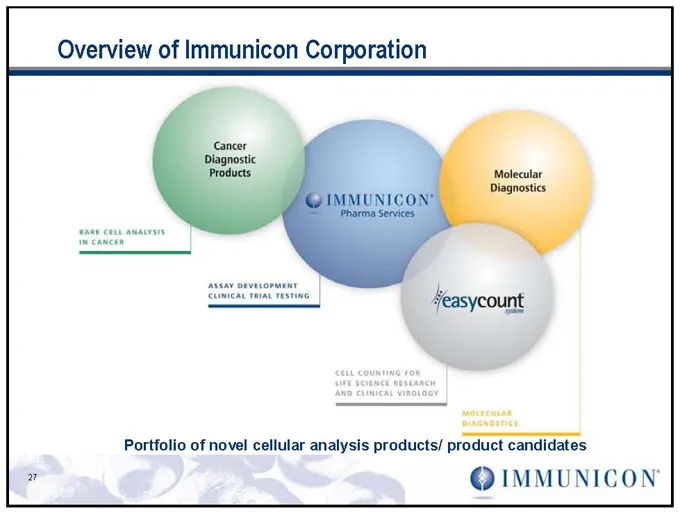
Overview of Immunicon Corporation IVD-cleared for monitoring metastatic breast cancer Cancer cellular analysis products sold exclusively through Veridex Portfolio of novel cellular analysis products/ product candidates
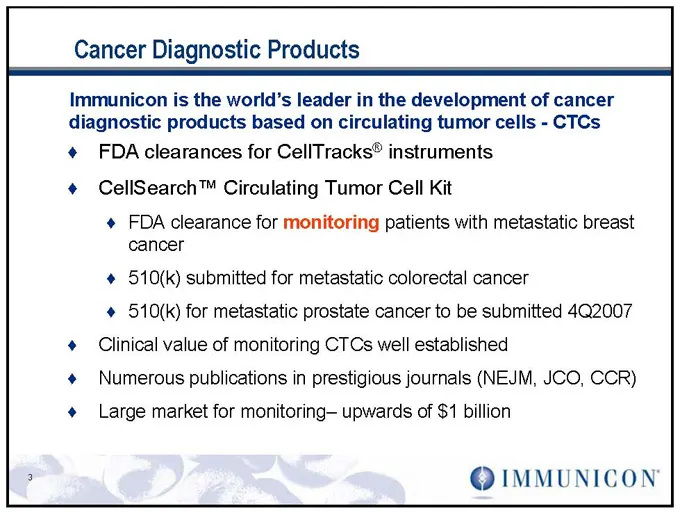
Slide 4: Cancer Diagnostic Products
Cancer Diagnostic Products Immunicon is the world’s leader in the development of cancer diagnostic products based on circulating tumor cells—CTCs FDA clearances for CellTracks® instruments CellSearch™ Circulating Tumor Cell Kit FDA clearance for monitoring patients with metastatic breast cancer 510(
Slide 5: CellTracks Products for Cellular Analysis
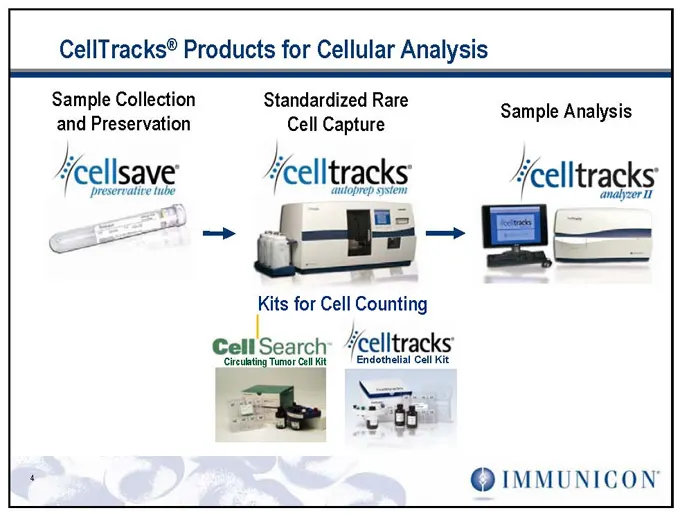
CellTracks® Products for Cellular Analysis Sample Collection Standardized Rare Sample Analysis and Preservation Cell Capture Kits for Cell Counting Circulating Tumor Cell Kit Endothelial Cell Kit
Slide 6: Estimated Billion Dollar Market in Metastatic Cancer
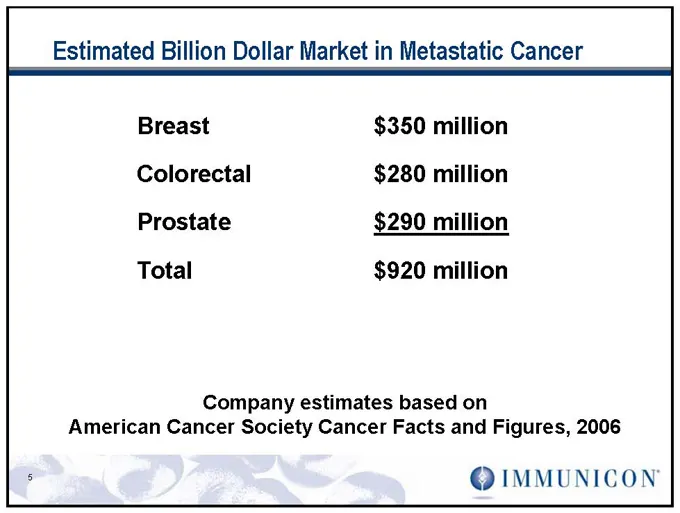
Estimated Billion Dollar Market in Metastatic Cancer Breast $350 million Colorectal $280 million Prostate $290 million Total $920 million Company estimates based on American Cancer Society Cancer Facts and Figures, 2006
Slide 7: CTCs as a "Real-Time Biopsy" Blood Test
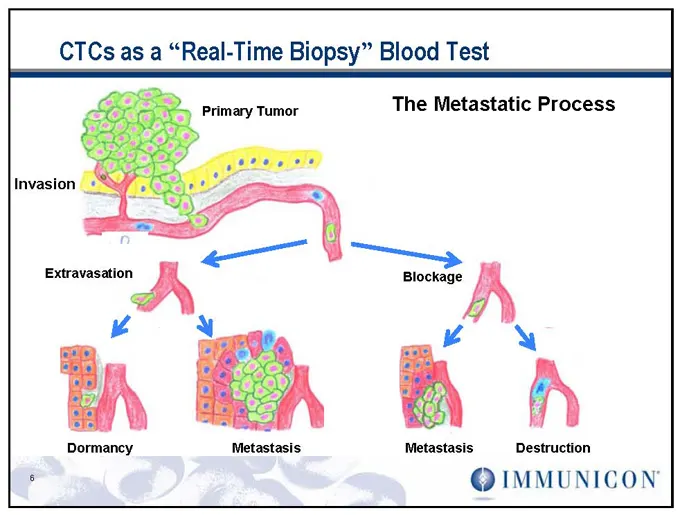
CTCs as a “Real-Time Biopsy” Blood Test Primary Tumor The Metastatic Process Invasion Extravasation Blockage Dormancy Metastasis Metastasis Destruction
Slide 8: Circulating Tumor Cells Predict Survival
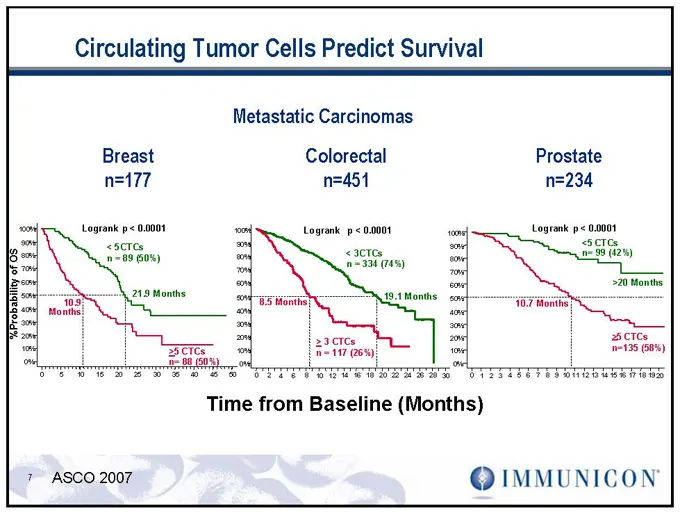
Circulating Tumor Cells Predict Survival Metastatic Carcinomas Breast Colorectal Prostate n=177 n=451 n=234 100% Logrank p < 0.0001 100% Logrank p < 0.0001 Logrank p < 0.0001 100% 90% 90% <5 CTCs < 5CTCs 90% 80% < 3CTCs n= 99 (42%) n = 89 (50%) 80% 80% n = 334 (74%) 70% 70% of OS 70% %Probability 60
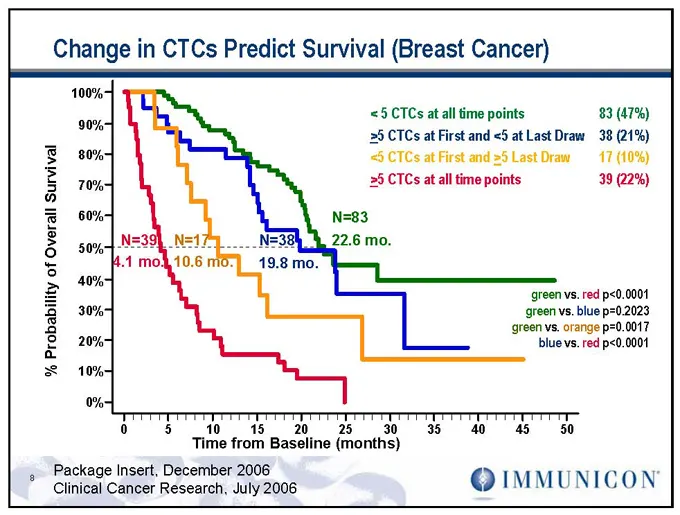
Slide 9: Change in CTCs Predict Survival (Breast Cancer)
Change in CTCs Predict Survival (Breast Cancer) 100% < 5 CTCs at all time points 83 (47%) 90% >5 CTCs at First and <5 at Last Draw 38 (21%) Survival 80% <5 CTCs at First and >5 Last Draw 17 (10%) 70% >5 CTCs at all time points 39 (22%) Overall 60% N=83 N=39 N=17 N=38 22.6 mo. 50% of 4.1 mo. 10.6 mo.
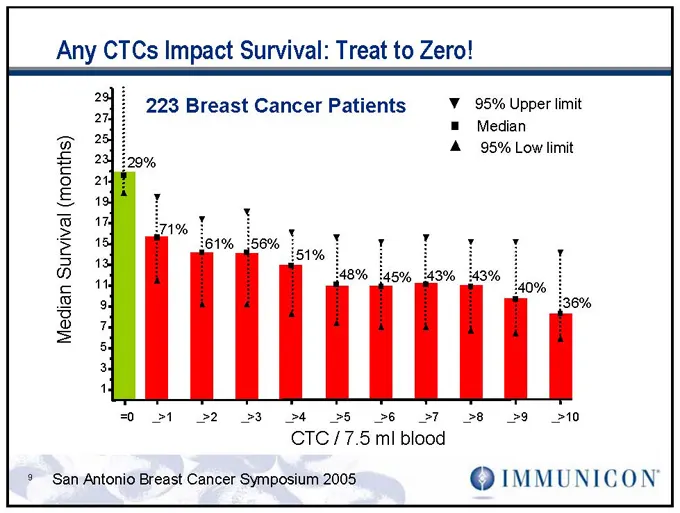
Slide 10: Any CTCs Impact Survival: Treat to Zero!
Any CTCs Impact Survival: Treat to Zero! 223 Breast Cancer Patients 95% Upper limit Median (months) 25 95% Low limit 23 29% 21 19 Survival 17 71% 15 61% 56% 51% 48% 45% 43% 43% 11 40% Median 9 36% 5 3 1 =0 >1 >2 >3 >4 >5 >6 >7 >8 >9 >10 CTC / 7.5 ml blood 9 San Antonio Breast Cancer Symposium 2005
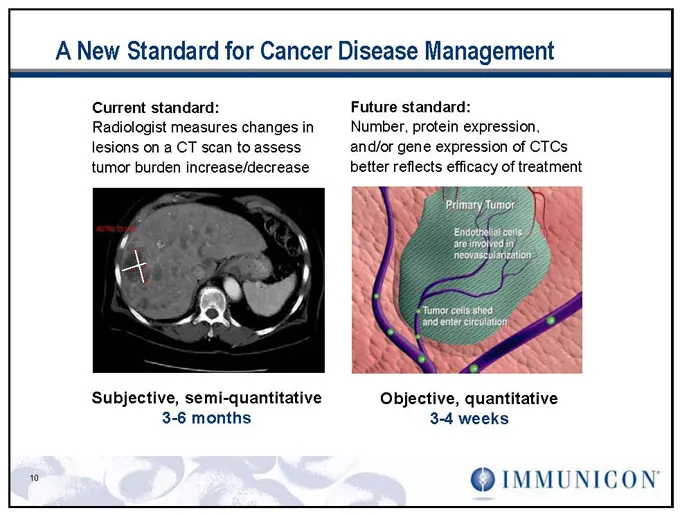
Slide 11: A New Standard for Cancer Disease Management
A New Standard for Cancer Disease Management Current standard: Future standard: Radiologist measures changes in Number, protein expression, lesions on a CT scan to assess and/or gene expression of CTCs tumor burden increase/decrease better reflects efficacy of treatment Subjective, semi-quantitative
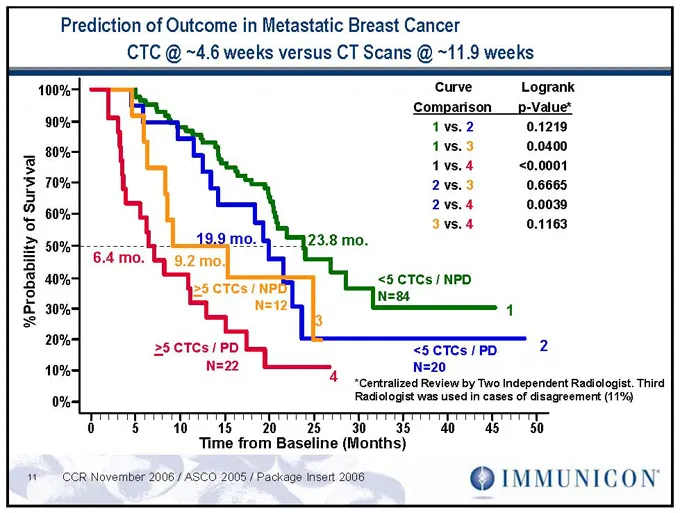
Slide 12: Prediction of Outcome in Metastatic Breast Cancer
Prediction of Outcome in Metastatic Breast Cancer CTC @ ~4.6 weeks versus CT Scans @ ~11.9 weeks 100% Curve Logrank Comparison p-Value* 90% 1 vs. 2 0.1219 1 vs. 3 0.0400 80% Survival 1 vs. 4 <0.0001 70% 2 vs. 3 0.6665 2 vs. 4 0.0039 60% of 3 vs. 4 0.1163 19.9 mo. 23.8 mo. %Probability 50% 6.4 mo. 9.
Slide 13: Significant Clinical Utility of Circulating Tumor Cells
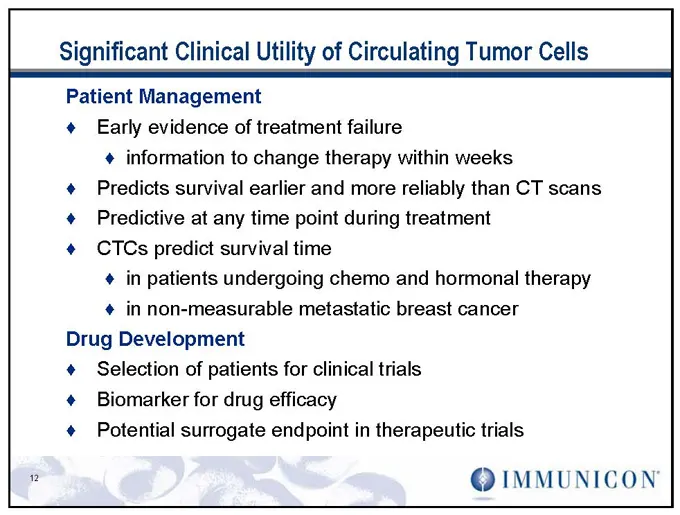
Significant Clinical Utility of Circulating Tumor Cells Patient Management Early evidence of treatment failure information to change therapy within weeks Predicts survival earlier and more reliably than CT scans Predictive at any time point during treatment CTCs predict survival time in patients und
Slide 14: Partial Pharma Client List
Partial Pharma Client List Immunicon Pharma Services is performing Assay Development and Clinical Trial Testing Services for: ArQule AstraZeneca Eisai Merck-Serono MolMed Novartis Pfizer Sanofi-Aventis
Slide 15: Immunicon Pharma Services: Assay Development
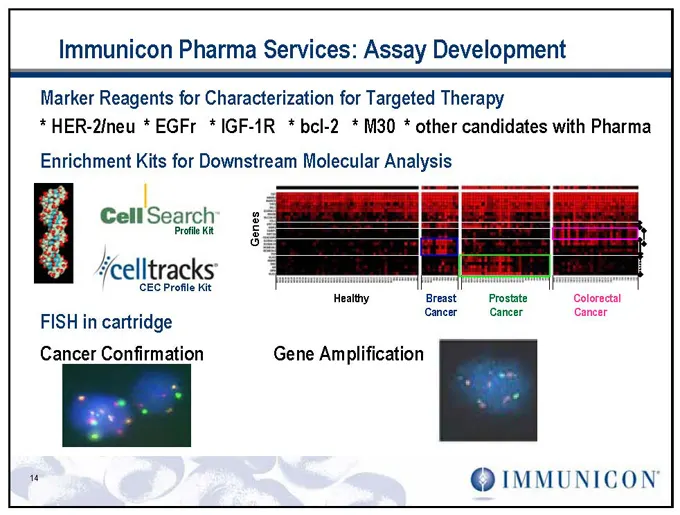
Immunicon Pharma Services: Assay Development Marker Reagents for Characterization for Targeted Therapy * HER-2/neu * EGFr * IGF-1R * bcl-2 * M30 * other candidates with Pharma Enrichment Kits for Downstream Molecular Analysis Profile Kit Genes CEC Profile Kit Healthy Breast Prostate Colorectal FISH
Slide 16: "Personalized Medicine"
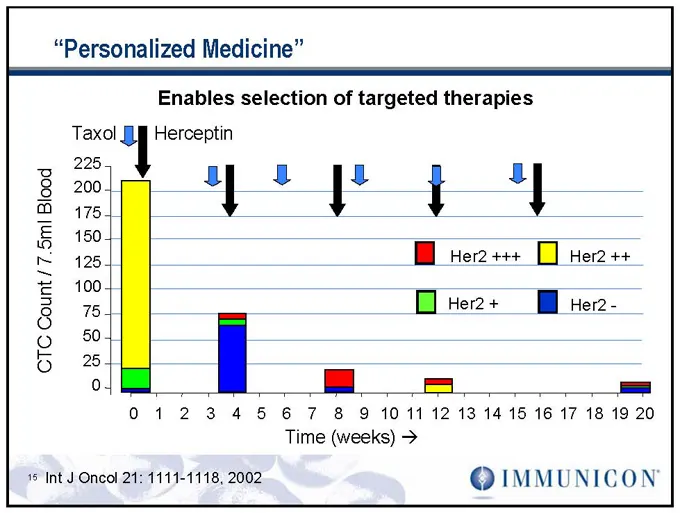
“Personalized Medicine” Enables selection of targeted therapies Taxol Herceptin 225 200 175 150 125 Her2 +++ Her2 ++ 100 Her2 + Her2 -75 50 CTC Count / 7.5ml Blood 25 0 0 1 2 3 4 5 6 7 8 9 10 11 12 13 14 15 16 17 18 19 20 Time (weeks) ? 15 Int J Oncol 21: 1111-1118, 2002
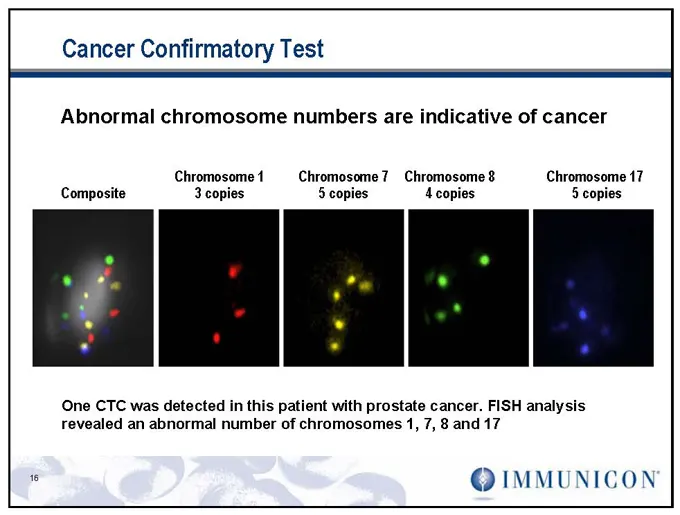
Slide 17: Cancer Confirmatory Test
Cancer Confirmatory Test Abnormal chromosome numbers are indicative of cancer Chromosome 1 Chromosome 7 Chromosome 8 Chromosome 17 Composite 3 copies 5 copies 4 copies 5 copies One CTC was detected in this patient with prostate cancer. FISH analysis revealed an abnormal number of chromosomes 1, 7, 8
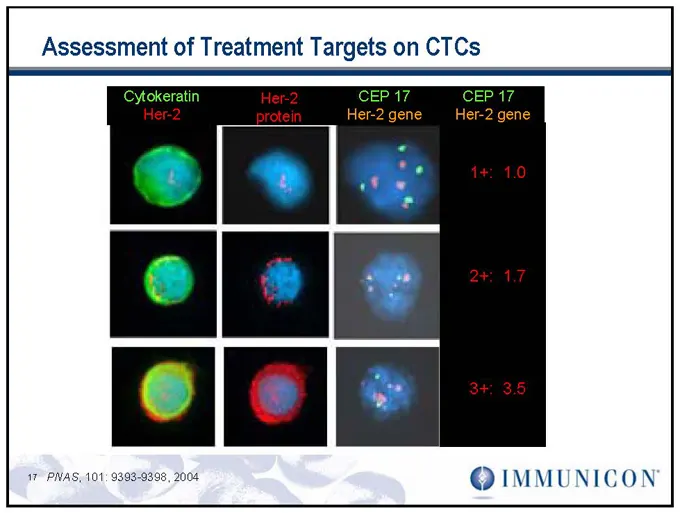
Slide 18: Assessment of Treatment Targets on CTCs
Assessment of Treatment Targets on CTCs Cytokeratin Her-2 CEP 17 CEP 17 / Her-2 protein Her-2 gene Her-2 gene 1+: 1.0 2+: 1.7 3+: 3.5 17 PNAS, 101: 9393-9398, 2004
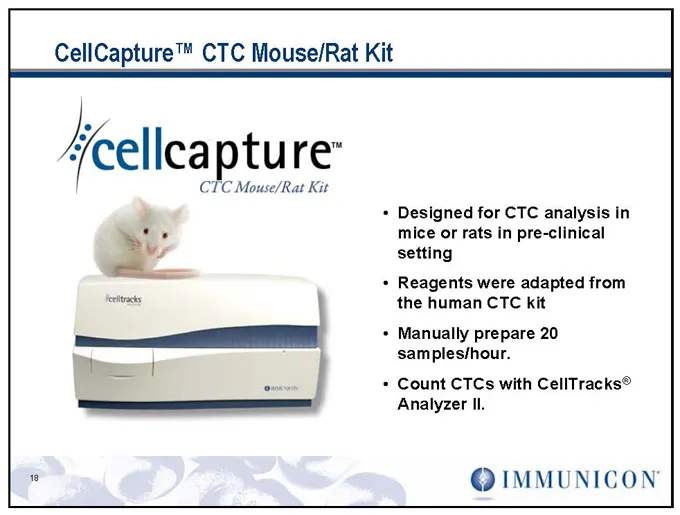
Slide 19: CellCapture CTC Mouse/Rat Kit
CellCapture™ CTC Mouse/Rat Kit Designed for CTC analysis in mice or rats in pre-clinical setting Reagents were adapted from the human CTC kit Manually prepare 20 samples/hour. Count CTCs with CellTracks® Analyzer II.
Slide 20: Research and Clinical Development Programs
Research and Clinical Development Programs Colorectal cancer – data submitted to FDA on 481 patient study Prostate cancer– 4Q07 FDA submission on 200+ patient study Research studies CTCs in early stage breast cancer and colorectal cancer Impact on survival of changing therapy based on CTCs (SWOG) De
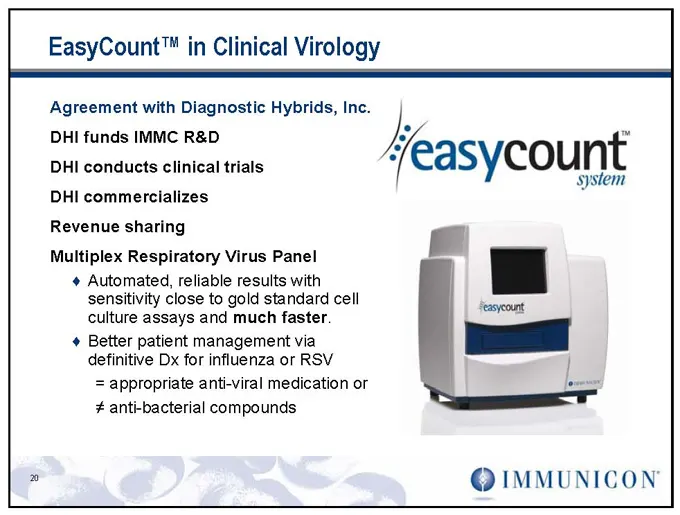
Slide 21: EasyCount in Clinical Virology
EasyCount™ in Clinical Virology Agreement with Diagnostic Hybrids, Inc. DHI funds IMMC R&D DHI conducts clinical trials DHI commercializes Revenue sharing Multiplex Respiratory Virus Panel Automated, reliable results with sensitivity close to gold standard cell culture assays and much faster. Better
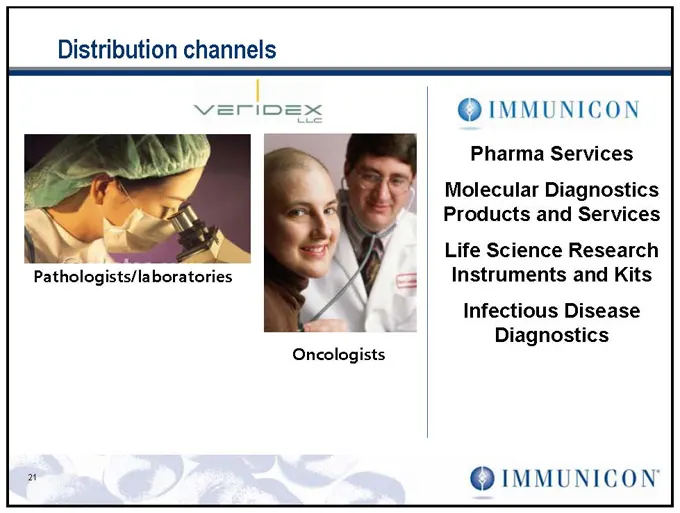
Slide 22: Distribution channels
Distribution channels Pharma Services Molecular Diagnostics Products and Services Life Science Research Pathologists/laboratories Instruments and Kits Infectious Disease Diagnostics Oncologists
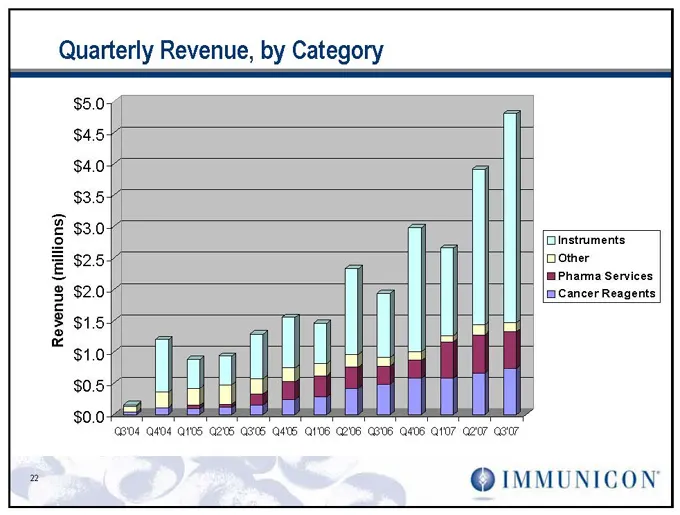
Slide 23: Quarterly Revenue, by Category
Quarterly Revenue, by Category $5.0 $4.5 $4.0 $3.5 (millions) $3.0 Instruments $2.5 Other Pharma Services Revenue $2.0 Cancer Reagents $1.5 $1.0 $0.5 $0.0 Q3’04 Q4’04 Q1’05 Q2’05 Q3’05 Q4’05 Q1’06 Q2’06 Q3’06 Q4’06 Q1’07 Q2’07 Q3’07
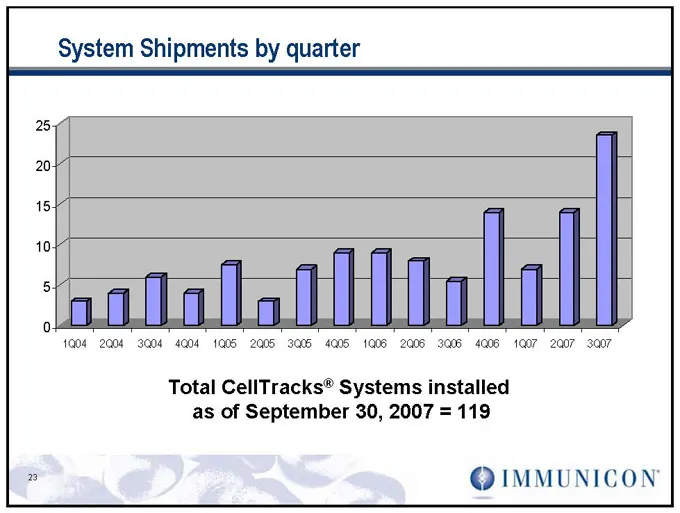
Slide 24: System Shipments by quarter
System Shipments by quarter 25 20 15 10 5 1Q04 2Q04 3Q04 4Q04 1Q05 2Q05 3Q05 4Q05 1Q06 2Q06 3Q06 4Q06 1Q07 2Q07 3Q07 Total CellTracks® Systems installed as of September 30, 2007 = 119
Slide 25: System Placements, by Customer/Geography
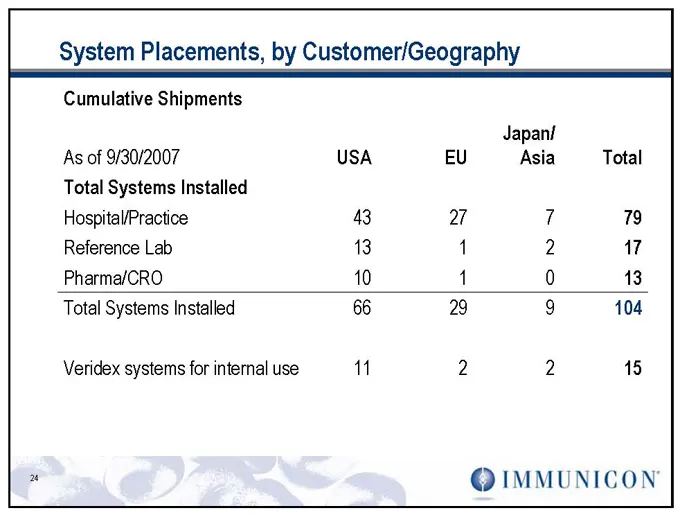
System Placements, by Customer/Geography Cumulative Shipments Japan/ As of 9/30/2007 USA EU Asia Total Total Systems Installed Hospital/Practice 43 27 7 79 Reference Lab 13 1 2 17 Pharma/CRO 10 1 0 13 Total Systems Installed 66 29 9 104 Veridex systems for internal use 11 2 2 15
Slide 26: Summary of Instrument Shipments and Sales
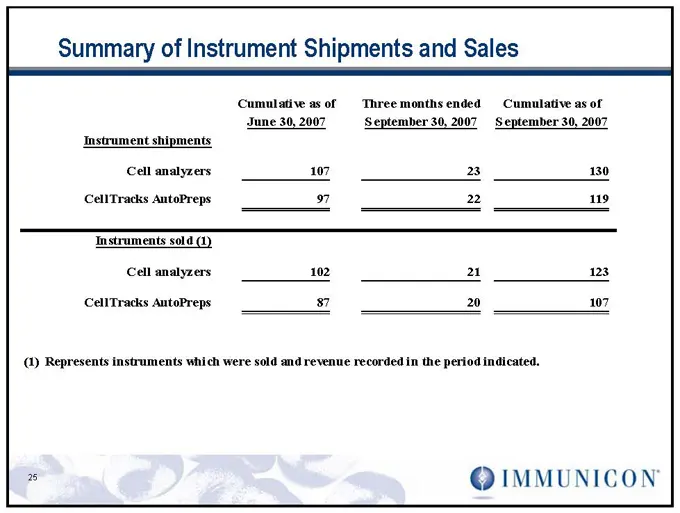
Summary of Instrument Shipments and Sales Cumulative as of Three months ended Cumulative as of June 30, 2007 September 30, 2007 September 30, 2007 Instrument shipments Cell analyzers 107 23 130 CellTracks AutoPreps 97 22 119 Instruments sold (1) Cell analyzers 102 21 123 CellTracks AutoPreps 87 20 1
Slide 27: Summary Financial Information
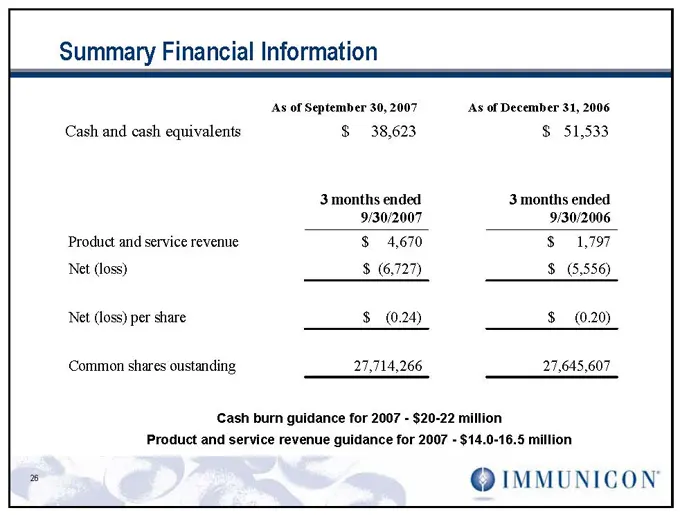
Summary Financial Information As of September 30, 2007 As of December 31, 2006 Cash and cash equivalents $ 38,623 $ 51,533 months ended 3 months ended 9/30/2007 9/30/2006 Product and service revenue $ 4,670 $ 1,797 Net (loss) $ (6,727) $ (5,556) Net (loss) per share $ (0.24) $ (0.20) Common shares o
Slide 28: Overview of Immunicon Corporation
Overview of Immunicon Corporation Portfolio of novel cellular analysis products/ product candidates
Slide 29: Contact Information
Contact Information 0 IMMUNICON‘« fies wb
Source: SEC EDGAR · 8-K filed Nov 2, 2007
More decks from Immunicon Corp
 Investor Presentation (May 2007)29 slides · May 2, 2007
 Investor Presentation (November 2006)26 slides · Nov 2, 2006
 Investor Presentation (September 2006)26 slides · Sep 26, 2006
 Investor Presentation (August 2006)25 slides · Aug 14, 2006
 Investor Presentation (June 2006)27 slides · Jun 2, 2006
 Investor Presentation (March 2006)27 slides · Mar 9, 2006