Immunicon — Investor Presentation (June 2006)
27 slides from Immunicon's investor presentation, Jun 2, 2006

Slide 1: Management Presentation
Management Presentation Cellular Information for Better Healthcare June 2006 Exhibit 99.1

Slide 2: Forward Looking Statements
Forward Looking Statements This presentation may contain forward-looking statements that reflect management ’ s current views and opinions as to the status of the Company ’ s products, clinical trials, regulatory approval process, product development, research programs and other future events and op

Slide 3: Immunicon Value Proposition
Immunicon Value Proposition Our products aim to improve cancer disease management Cellular analysis products/technologies address multiple disease states Strategic marketing partnership in cancer with J&J (Veridex) FDA-cleared cancer products are on the market – Compelling clinical data across multi
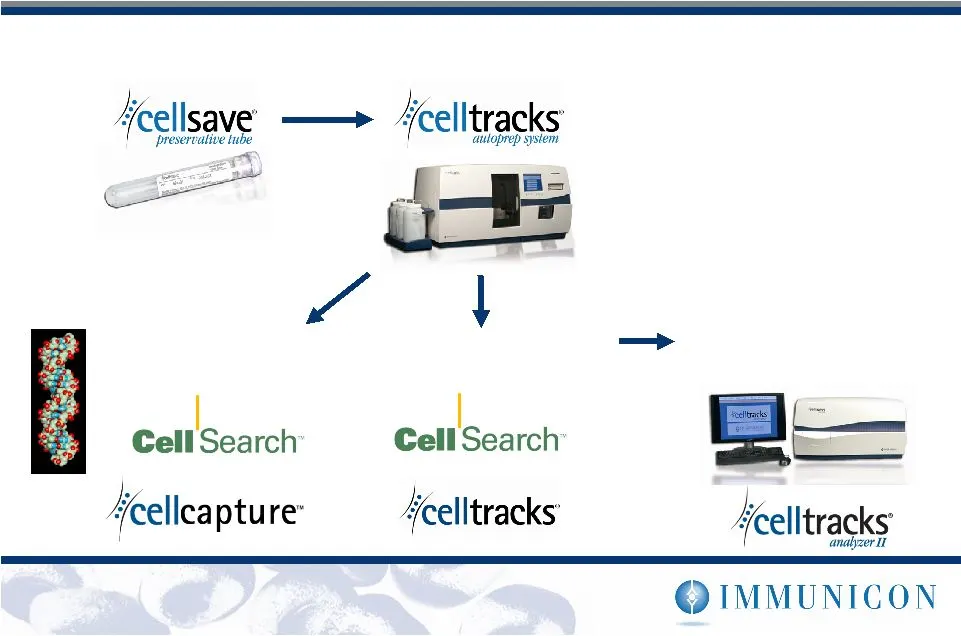
Slide 4: CellTracks Technology and Kits
CEC Kit Profile Kit CellTracks ® Technology Circulating Tumor Cell Kit Sample Collection and Preservation Standardized Rare Cell Capture Kits and Marker Reagents for Cell Analysis Endothelial Cell Kit Enrichment Kits for Molecular Analysis Count and Characterize Rare Cells
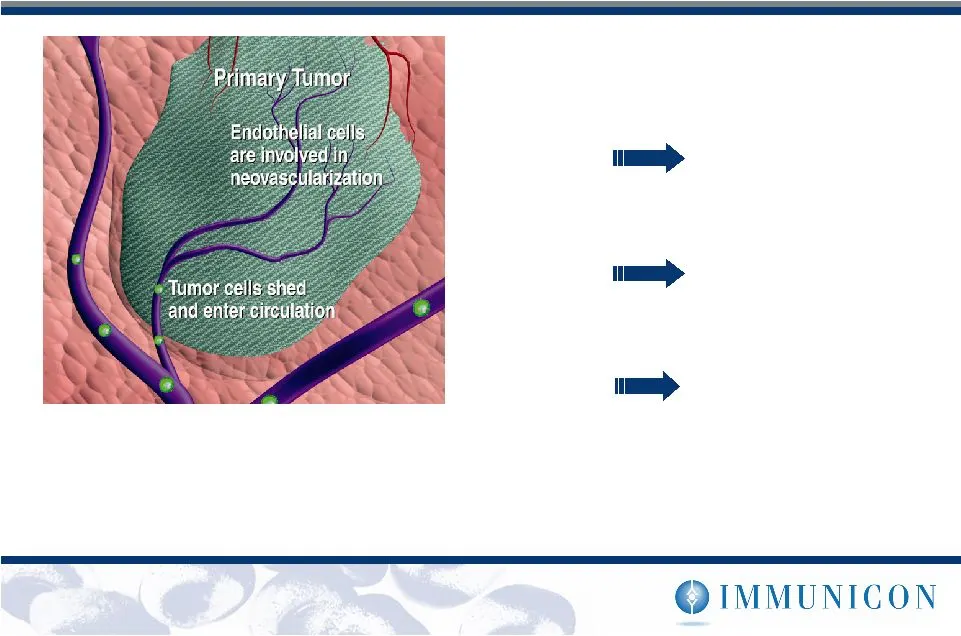
Slide 5: Circulating Tumor Cells as a Real-Time Biopsy
Circulating Tumor Cells as a “ Real-Time Biopsy ” Blood Test Most tumors are of epithelial cell origin: Isolation of epithelial cells may mean pan - carcinoma - capability Count Phenotype & Genotype Determine Presence Assess Prognosis Direct Therapy Monitor Disease Diagnose Specify Therapy Risk Asse
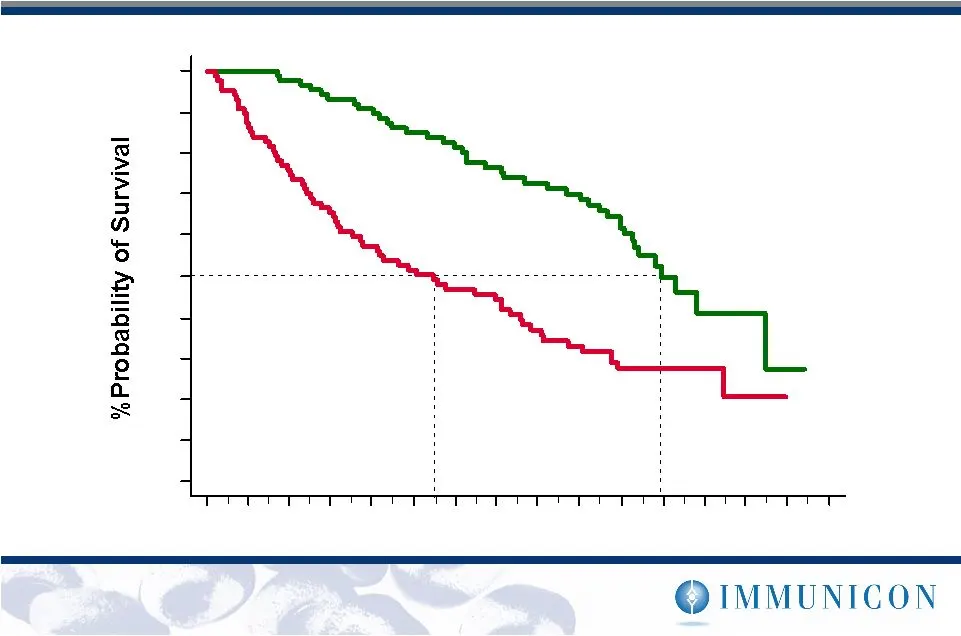
Slide 6: Circulating Tumor Cells Predict Survival
Circulating Tumor Cells Predict Survival Time from Baseline (Months) 0% 10% 20% 30% 40% 50% 60% 70% 80% 90% 100% Logrank p < 0.0001 21.9 Months 10.9 Months > 5 CTCs n=87 (49%) <5 CTCs n=90 (51%) NEJM 2004, ASCO 2004 / 2005 Before initiation of therapy
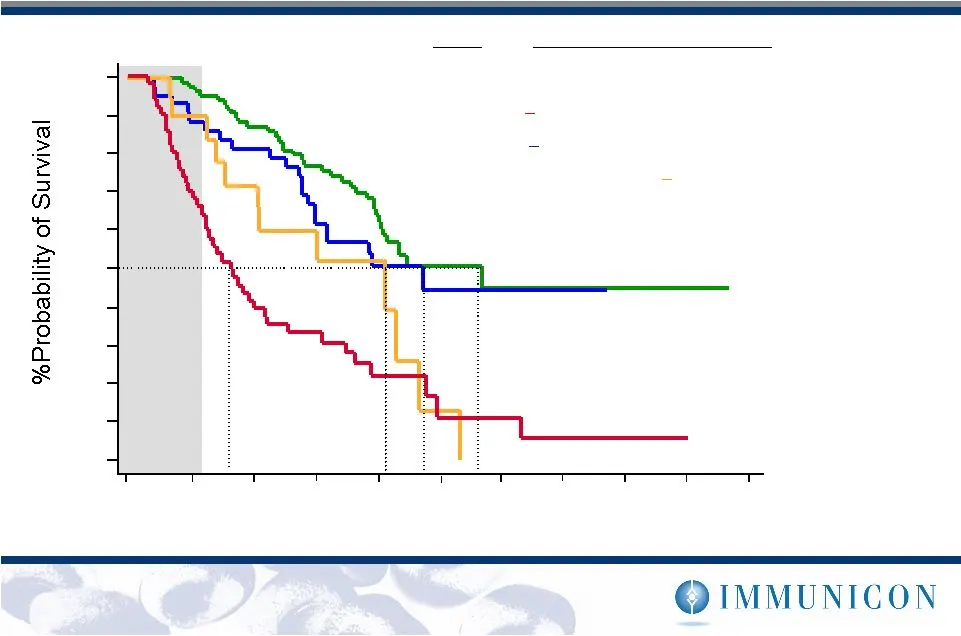
Slide 7: Change in CTCs and Its Relation to Survival
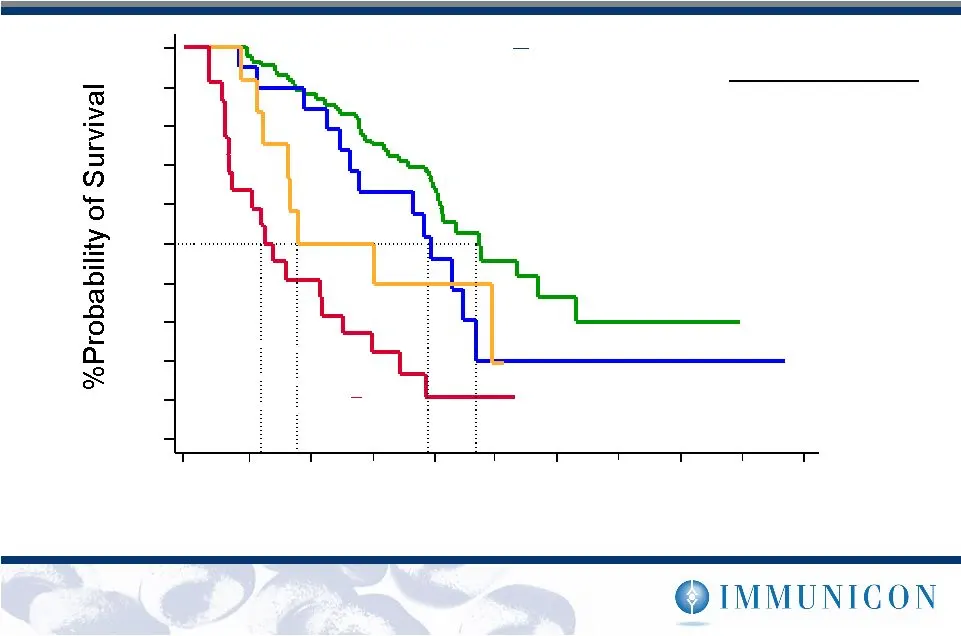
blue Change in CTCs and its Relation to Survival (Measurable and Non-Measurable Disease) green vs. orange p=0.0061 green vs. red p=0.0000 vs. red p=0.0002 Time from Baseline (Months) 10% 20% 30% 40% 50% 60% 70% 80% 90% 100% 28.6 Months 23.8 Months 20.8 Months 8.2 Months n=20 (10%) 28.6 Months 23.8 M
Slide 8: Cells at any time point are bad!
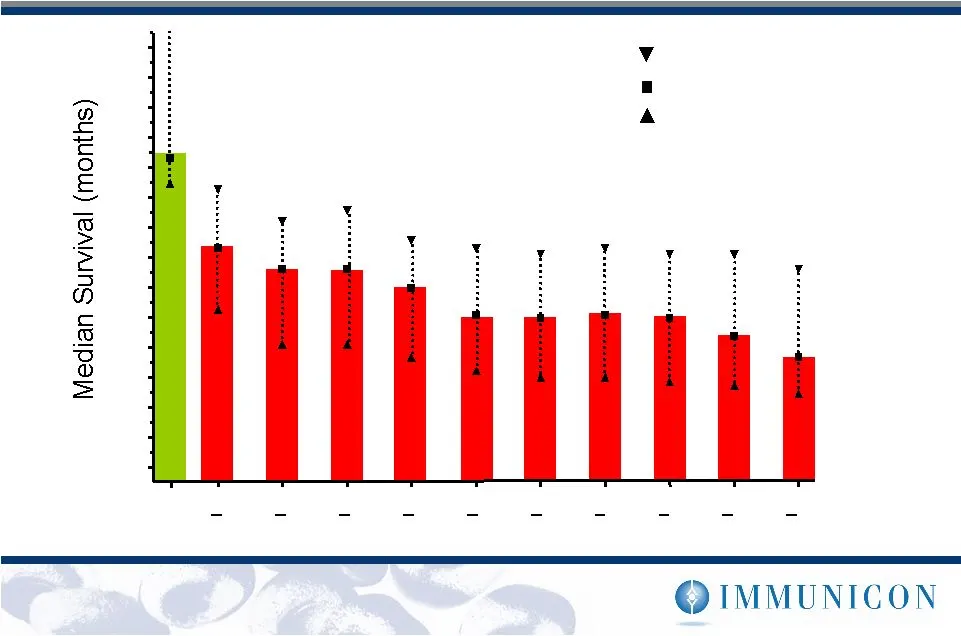
Cells at any time point are bad! CTC / 7.5 ml blood Median 95% Low limit 95% Upper limit 29% 71% 61% 56% 51% 48% 45% 43% 43% 40% 36% =0 >1 >2 >3 > > > > > > >10 Median 95% Low limit 95% Upper limit =0 > > > > > > > > > > 223 patients
Slide 9: A New Standard for Cancer Disease Management
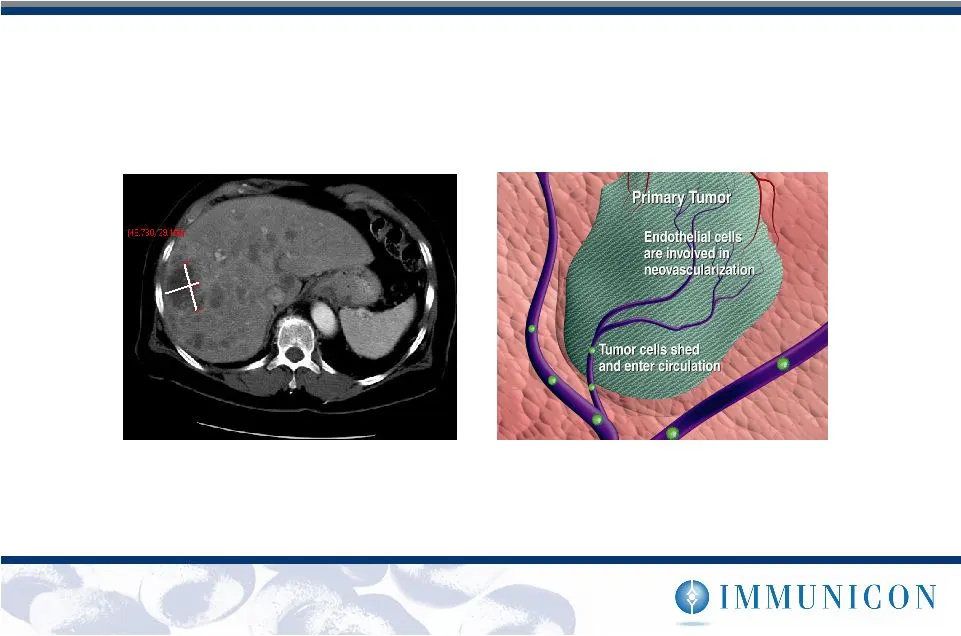
A New Standard for Cancer Disease Management Future standard: Number, protein expression, and/or gene expression of CTCs better reflects efficacy of treatment Current standard: Radiologist measures changes in lesions on a CT scan to assess tumor burden increase/decrease Objective, quantitative 3-4 w
Slide 10: Prediction of Outcome in Metastatic Breast Cancer: CTC versus CT Scans
CT Scans 11.9 +5.7 weeks *Centralized Review by Two Independent Radiologist. Third Radiologist was used in cases of disagreement (11%) Prediction of Outcome in Metastatic Breast Cancer CTC versus CT Scans ASCO 2005 T. Budd, MD. Cleveland Clinic 23.8 Months 6.4 Months S/PR & <5CTCs n=84 (61%) PD & <5

Slide 11: Significant Clinical Utility of Circulating Tumor Cells
Significant Clinical Utility of Circulating Tumor Cells Early evidence of treatment failure: gives the oncologist information to change therapy within weeks Predictive at any time point during treatment CTCs predict survival time in patients undergoing chemo & hormonal therapy CTCs predict survival
Slide 12: Real-Time Biopsy from a Blood Sample
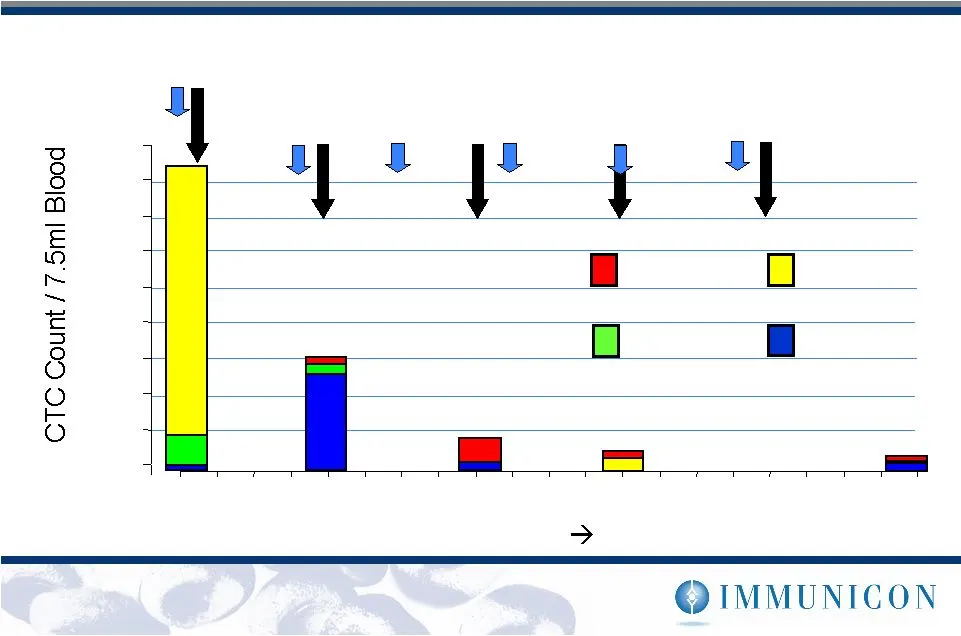
Her2 - Her2 + Her2 ++ Her2 +++ Time (weeks) Taxol Herceptin Int J Oncol 21: 1111-1118, 2002 “Real-Time Biopsy” from a Blood Sample Enables selection of targeted therapies
Slide 13: Gene Expression Profiling of Carcinomas
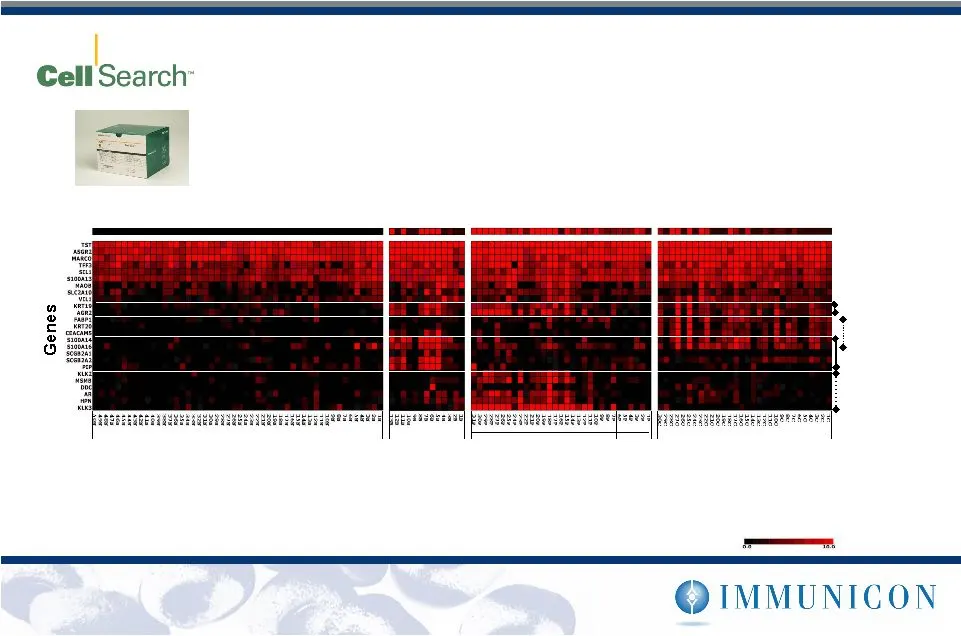
Priority Report, Cancer Research June 15, 2005 13 Breast Cancer Patients 31 Prostate Cancer Patients 30 Colon Cancer Patients 50 Normal Donors Prostate Cancer Breast Cancer Colon Cancer Pan Cancer Hormone refractory Hormone sensitive # CTCs Profile Kit “Real-Time Biopsy” from a Blood Sample Gene Exp
Slide 14: FISH on Rare Cells
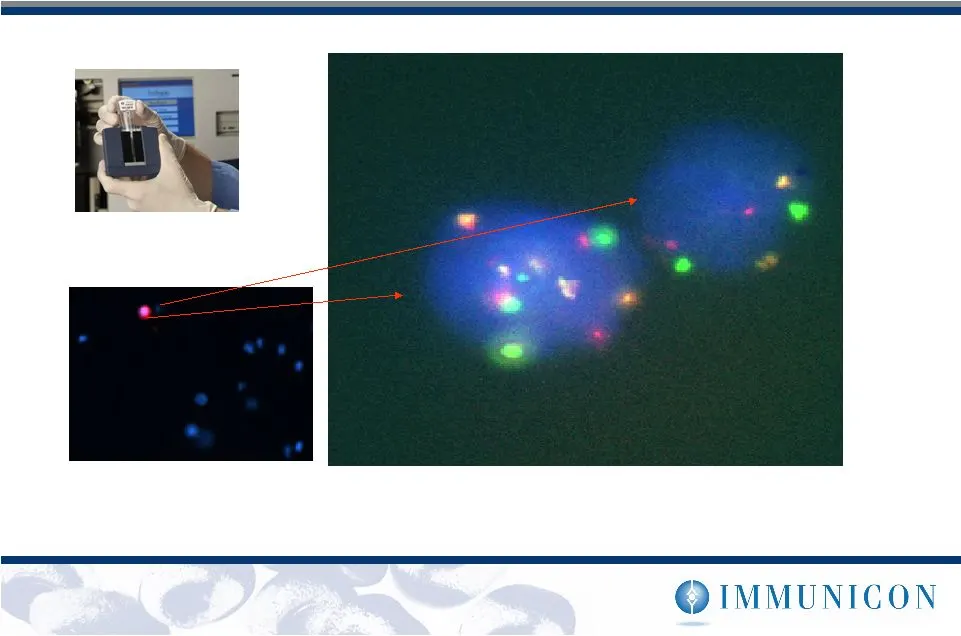
Leukocyte Tumor Cell FISH on Rare Cells Chromosome 1 Chromosome 7 Chromosome 8 2 x1, 2 x 7, 2 x 8 3 x1, 5 x 7, 4 x 8

Slide 15: Current Clinical R & D Program in Cancer
Current Clinical R & D Program in Cancer Colorectal Cancer – ~400 patient labeling study enrollment completed January 2006 – FDA submission year-end 2006 Prostate Cancer – ~200 patient labeling study enrollment completed January 2006 – FDA submission 2H 2007 Research studies – CTC research, drug tar

Slide 16: Many Product Opportunities
Many Product Opportunities Follow-on applications in cancer – Other settings in cancer (diagnosis, recurrence monitoring,…) – RNA/DNA/protein assays – Detection of tumor cells in bone marrow – Detection of endothelial cells (treatment toxicity, angiogenesis,…) Pharma Services: testing services and a

Slide 17: Significant Market Opportunity
Significant Market Opportunity Overall U.S. Market Cancer is the second leading killer – Prevalence: 9.8 million survivors – Incidence: 1.37 million new diagnoses p.a. – Mortality: 570,280 deaths p.a. ~86% of all cancers are carcinomas (solid tumors) – CellSearch ™ System is “ pan-carcinoma ” Cancer

Slide 18: Sales and Marketing Strategy
Sales and Marketing Strategy Oncologists * Pathologists/laboratories

Slide 19: Strategic Alliance in Cancer with Johnson & Johnson
Strategic Alliance in Cancer with Johnson & Johnson Key elements: Immunicon develops and manufactures J&J marketing, sales and distribution Revenue shared (~30% to IMMC on reagents) Reimbursement – J&J responsibility – Existing CPT codes for reimbursement exist now – Clinical data correlates with pa
Slide 20: Summary of instrument shipments and sales
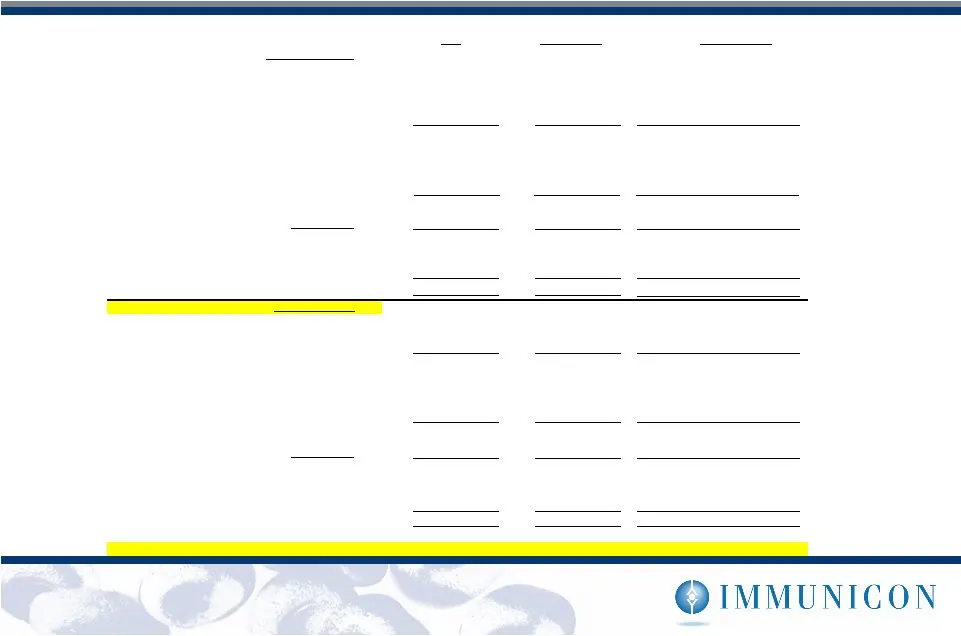
Summary of instrument shipments and sales Year ended Quarter ended Cumulative from launch March 31, 2006 to March 31, 2006 Instrument shipments CellTracks Analyzer II J&J affiliates - Customer upgrades from CellSpotter - Other customers Total CellTracks Analyzer II CellSpotter Analyzer J&J affiliate
Slide 21: System Placements, by Customer/Geography
System Placements, by Customer/Geography 8.5 6.5 Veridex internal use Pharma/CRO Reference Lab Hospital/Institute Total Shipments Total Japan/ Asia EU USA As of 3/31/06 Third party: 40 Total Placements: 48.5

Slide 22: Comparison of Estimated Key Economics to Lab & IMMC
~$380 Medicare reimbursement ~$200 Contribution to lab (before labor) ~$50 $175 CellSearch Test ~$127,000 $150,000 Instrumentation Immunicon Lab Comparison of Estimated Key Economics to Lab & IMMC

Slide 23: Financial condition
Financial condition Cash burn guidance for 2006 - $20 to $22 million Headcount at March 31, 2006 = 106 Borrowing capacity of $12.6 million @ 3/31/06 (Dollars in thousands) March 31, 2006 December 31, 2005 Cash and cash equivalents 39,243 $ 44,098 $ Long term debt, incl current portion 5,161 $ 5,884

Slide 24: Milestones Achieved
Milestones Achieved Publication in New England Journal of Medicine Q3/04 U.S. in vitro * diagnostic (IVD) launch Q3/04 New data -- 2005 AACR/ASCO/ Urology Q2/05 Launch CellTracks Analyzer II Q2/05 510(k) clearance of expanded data Q405 CellTracks AutoPrep Systems (49) + cell analyzers (54) 3/31/05 T
Slide 25: Upcoming Milestones/Presentations
Upcoming Milestones/Presentations Launch first CTC FISH assay (RUO launch) Colorectal cancer 510(k) Prostate cancer data/510(k) Upcoming Scientific meetings – ASCO June 2006 – San Antonio Breast Cancer Symposium Dec. 2006 Upcoming investor meetings – Pacific Growth Equities June 2006 – Jeffries Conf

Slide 26: Immunicon Value Proposition
Immunicon Value Proposition Our products aim to improve cancer disease management Cellular analysis products/technologies address multiple disease states Strategic marketing partnership in cancer with J&J (Veridex) FDA-cleared cancer products are on the market – Compelling clinical data across multi

Slide 27: Contact Information
Contact Information * 3401 Masons Mill Road, Suite * Huntingdon Valley, Pennsylvania * phone 215.830.0777 * fax 215.830.0751 * www.immunicon.com
Source: SEC EDGAR · 8-K filed Jun 2, 2006
More decks from Immunicon Corp
 Investor Presentation (November 2007)29 slides · Nov 2, 2007
 Investor Presentation (May 2007)29 slides · May 2, 2007
 Investor Presentation (November 2006)26 slides · Nov 2, 2006
 Investor Presentation (September 2006)26 slides · Sep 26, 2006
 Investor Presentation (August 2006)25 slides · Aug 14, 2006
 Investor Presentation (March 2006)27 slides · Mar 9, 2006