WestRock — Citi Investor Meetings February 2018
28 slides from WestRock's conference presentation, Feb 13, 2018
Slide 1: Citi Investor Meetings February 2018
Citi Investor Meetings February 2018
Slide 2: Forward Looking Statements
| 2 Forward Looking Statements OUTSTANDING EXECUTION & DELIVERY DISCIPLINED CAPITAL ALLOCATION BROAD PORTFOLIO OF DIFFERENTIATED SOLUTIONS This presentation contains forward - looking statements within the meaning of the Private Securities Litigation Reform Act of 1995 , including but not limited to
Slide 3: Additional Information
| 3 Additional Information OUTSTANDING EXECUTION & DELIVERY DISCIPLINED CAPITAL ALLOCATION BROAD PORTFOLIO OF DIFFERENTIATED SOLUTIONS Additional Information and Where to Find It This communication may be deemed to be solicitation material in respect of the proposed transaction among Whiskey Holdco,
Slide 4: Disclaimer; Non-GAAP Financial Measures
| 4 Disclaimer; Non - GAAP Financial Measures OUTSTANDING EXECUTION & DELIVERY DISCIPLINED CAPITAL ALLOCATION BROAD PORTFOLIO OF DIFFERENTIATED SOLUTIONS We may from time to time be in possession of certain information regarding WestRock that applicable law would not require us to disclose to the pu
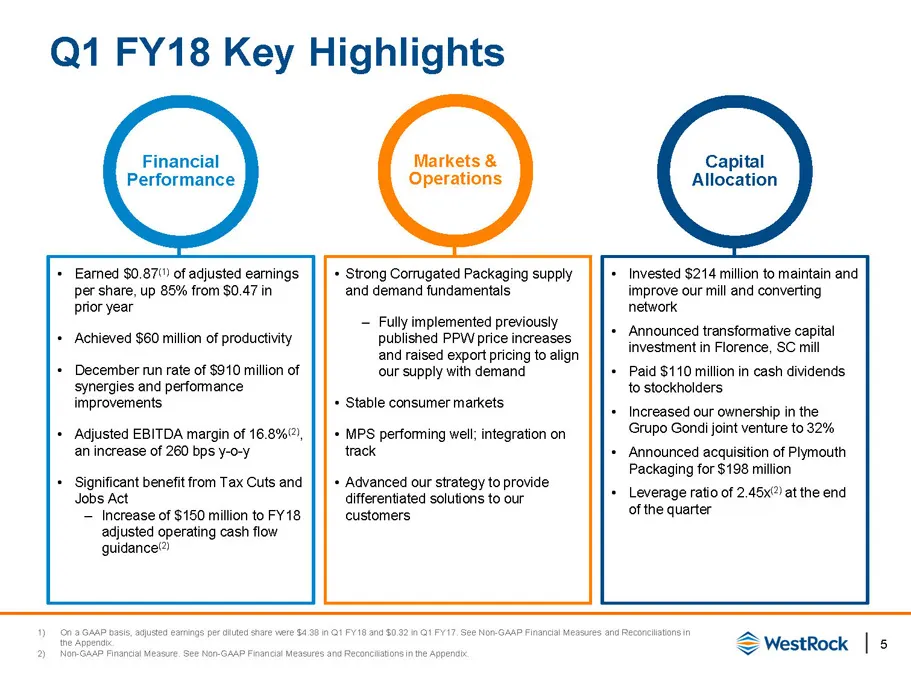
Slide 5: Q1 FY18 Key Highlights
| 5 Q1 FY18 Key Highlights 1) On a GAAP basis, adjusted earnings per diluted share were $4.38 in Q1 FY18 and $0.32 in Q1 FY17. See Non - GAAP Financial Measures and Reconciliations in the Appendix. 2) Non - GAAP Financial Measure. See Non - GAAP Financial Measures and Reconciliations in the Appendix
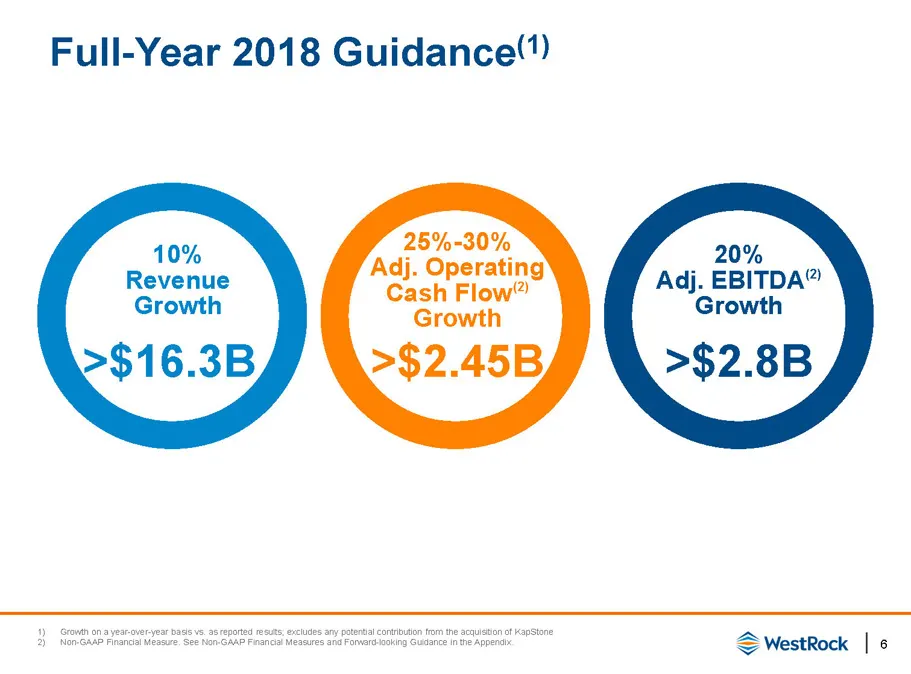
Slide 6: Full-Year 2018 Guidance
| 6 Full - Year 2018 Guidance (1) 10% Revenue Growth >$16.3B 20% Adj. EBITDA (2) Growth >$2.8B 25% - 30% Adj. Operating Cash Flow (2) Growth >$2.45B 1) Growth on a year - over - year basis vs. as reported results ; excludes any potential contribution from the acquisition of KapStone 2) Non - GAAP Fi
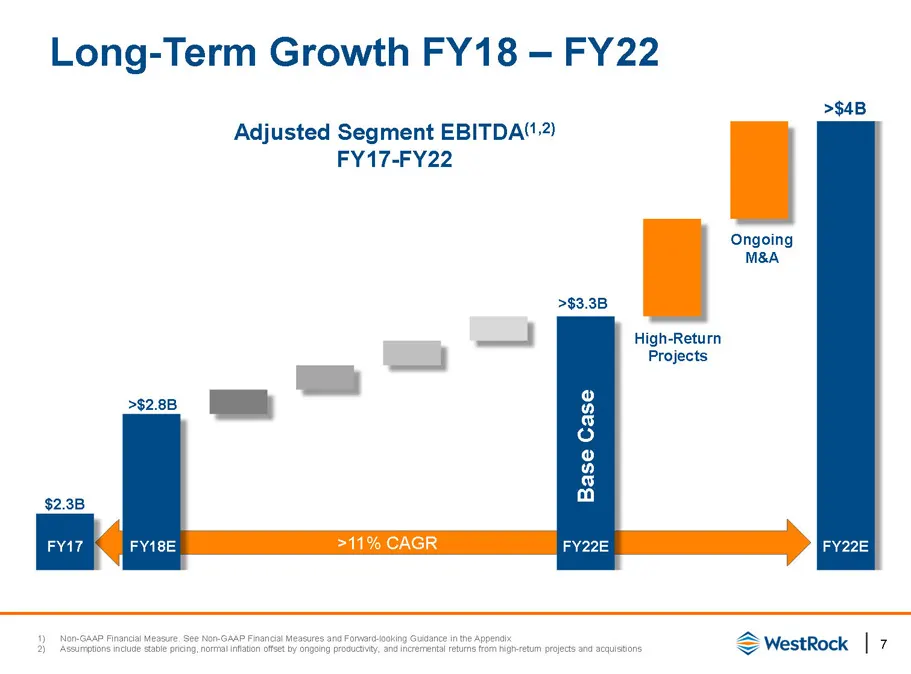
Slide 7: Long-Term Growth FY18–FY22
| 7 >11% CAGR Long - Term Growth FY18 – FY22 1) Non - GAAP Financial Measure. See Non - GAAP Financial Measures and Forward - looking Guidance in the Appendix 2) Assumptions include stable pricing, normal inflation offset by ongoing productivity, and incremental returns from high - return pr ojects
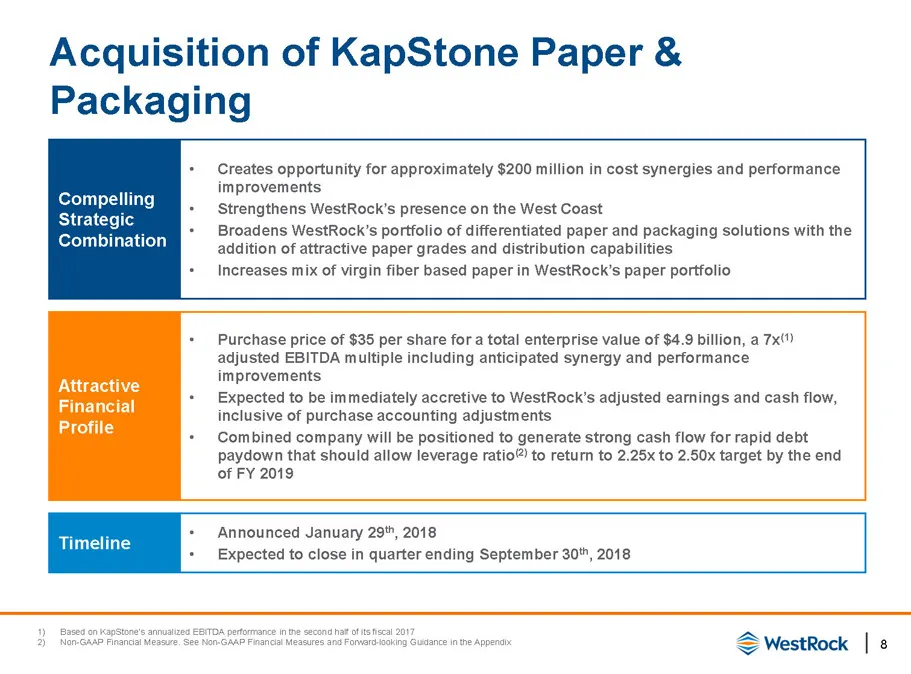
Slide 8: Acquisition of KapStone Paper & Packaging
| 8 Acquisition of KapStone Paper & Packaging 1) Based on KapStone’s annualized EBITDA performance in the second half of its fiscal 2017 2) Non - GAAP Financial Measure. See Non - GAAP Financial Measures and Forward - looking Guidance in the Appendix Compelling Strategic Combination • Creates opport
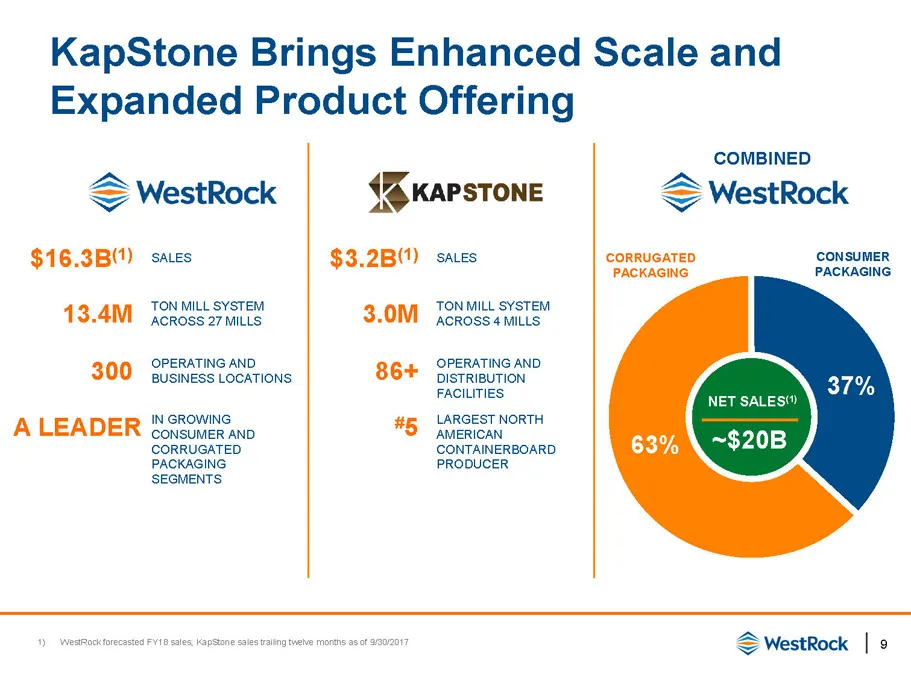
Slide 9: KapStone Brings Enhanced Scale and Expanded Product Offering
| 9 KapStone Brings Enhanced Scale and Expanded Product Offering 1) WestRock forecasted FY18 sales; KapStone sales trailing twelve months as of 9/30/2017 COMBINED $16.3B (1) SALES $3.2B (1) SALES 13.4M TON MILL SYSTEM ACROSS 27 MILLS 3.0M TON MILL SYSTEM ACROSS 4 MILLS 300 OPERATING AND BUSINESS LOC
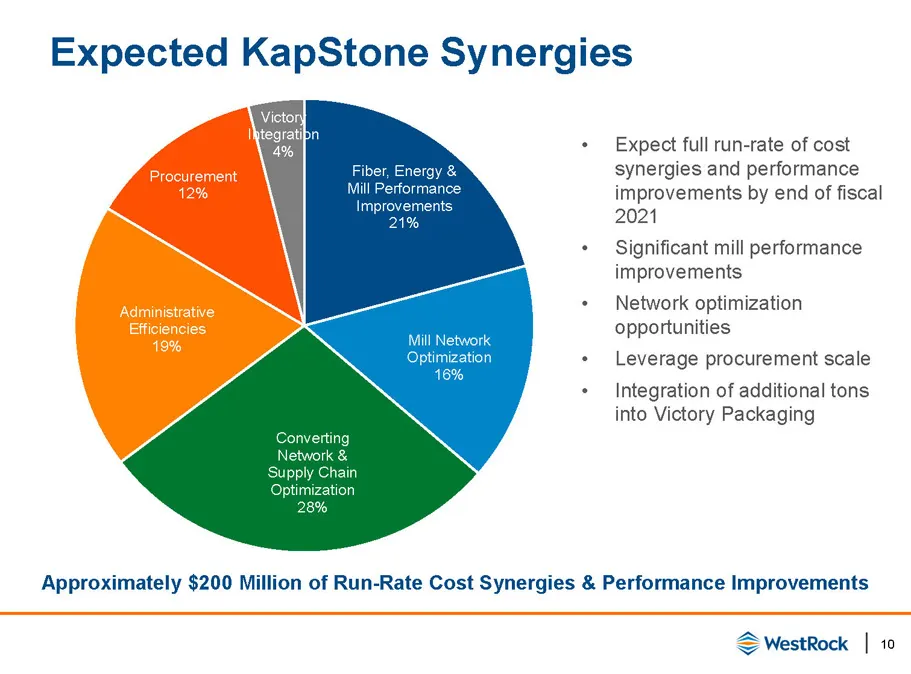
Slide 10: Expected KapStone Synergies
| 10 Expected KapStone Synergies Fiber, Energy & Mill Performance Improvements 21% Mill Network Optimization 16% Converting Network & Supply Chain Optimization 28% Administrative Efficiencies 19% Procurement 12% Victory Integration 4% • Expect full run - rate of cost synergies and performance improv
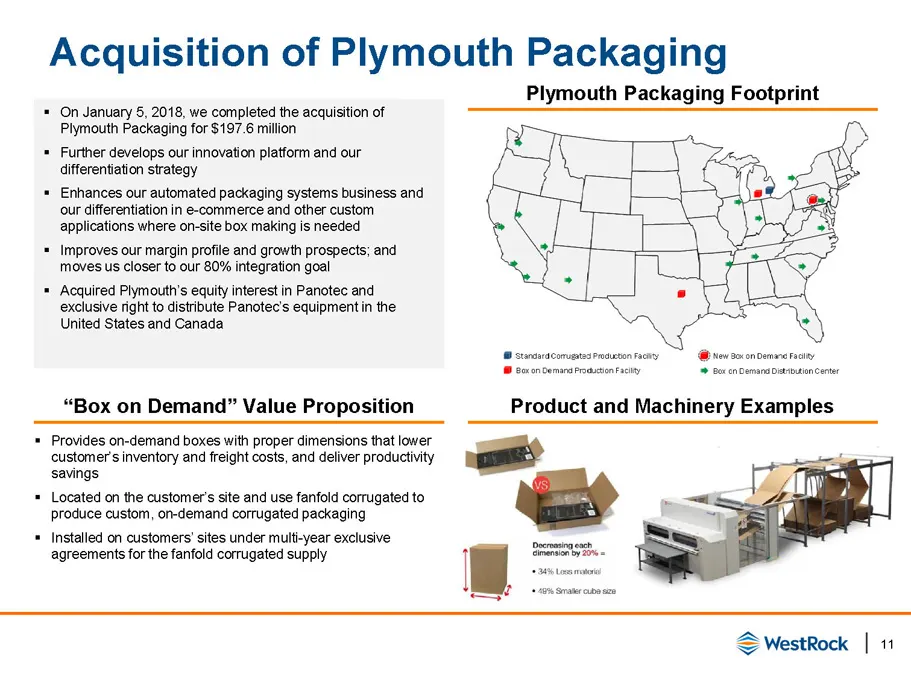
Slide 11: Acquisition of Plymouth Packaging
| 11 Acquisition of Plymouth Packaging OUTSTANDING EXECUTION & DELIVERY DISCIPLINED CAPITAL ALLOCATION BROAD PORTFOLIO OF DIFFERENTIATED SOLUTIONS ▪ On January 5, 2018, we completed the acquisition of Plymouth Packaging for $197.6 million ▪ Further develops our innovation platform and our differenti
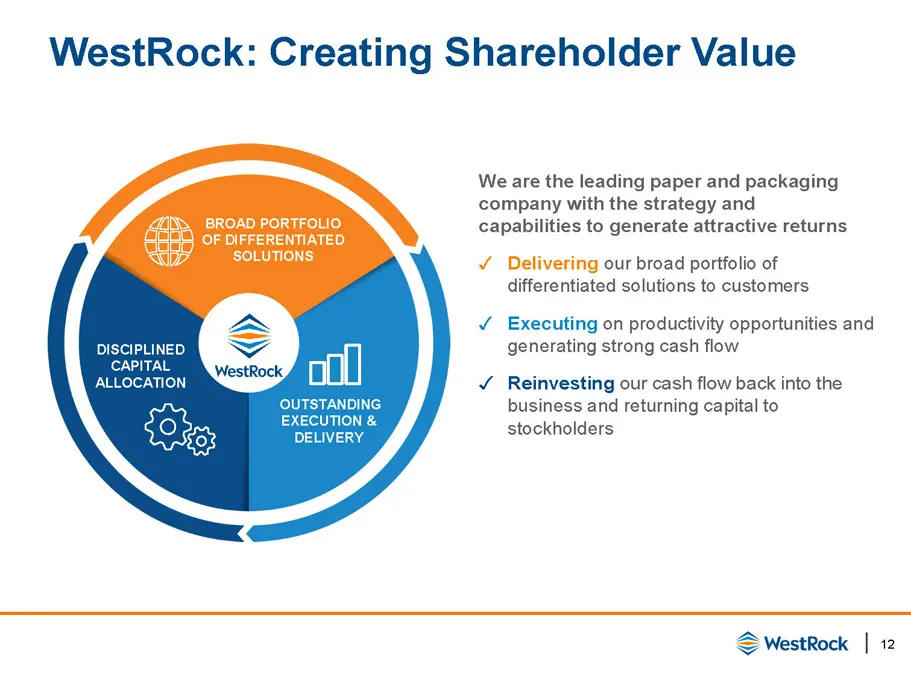
Slide 12: WestRock: Creating Shareholder Value
| 12 WestRock: Creating Shareholder Value OUTSTANDING EXECUTION & DELIVERY DISCIPLINED CAPITAL ALLOCATION BROAD PORTFOLIO OF DIFFERENTIATED SOLUTIONS We are the leading paper and packaging company with the strategy and capabilities to generate attractive returns ✓ Delivering our broad portfolio of d
Slide 13: Appendix
Appendix
Slide 14: Synergy and Performance Improvements
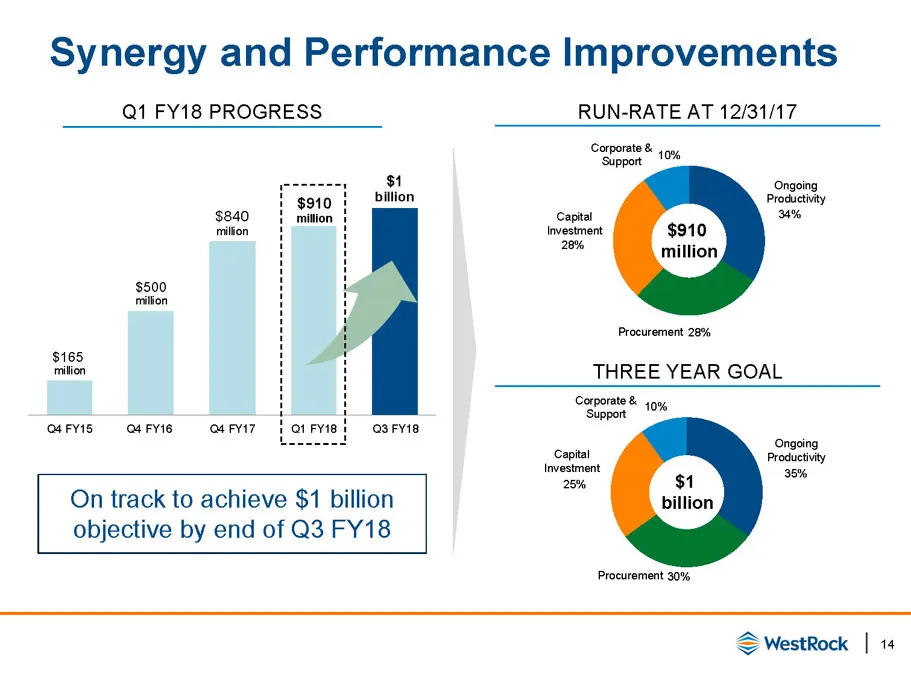
| 14 Synergy and Performance Improvements $165 million $840 million $910 million $1 billion $500 million Q4 FY15 Q4 FY16 Q4 FY17 Q1 FY18 Q3 FY18 On track to achieve $1 billion objective by end of Q3 FY18 Q1 FY18 PROGRESS (1) (1) 34% 28% 28% 10% Procurement Capital Investment Ongoing Productivity Cor
Slide 15: N.A. Corrugated End Market Mix / Examples
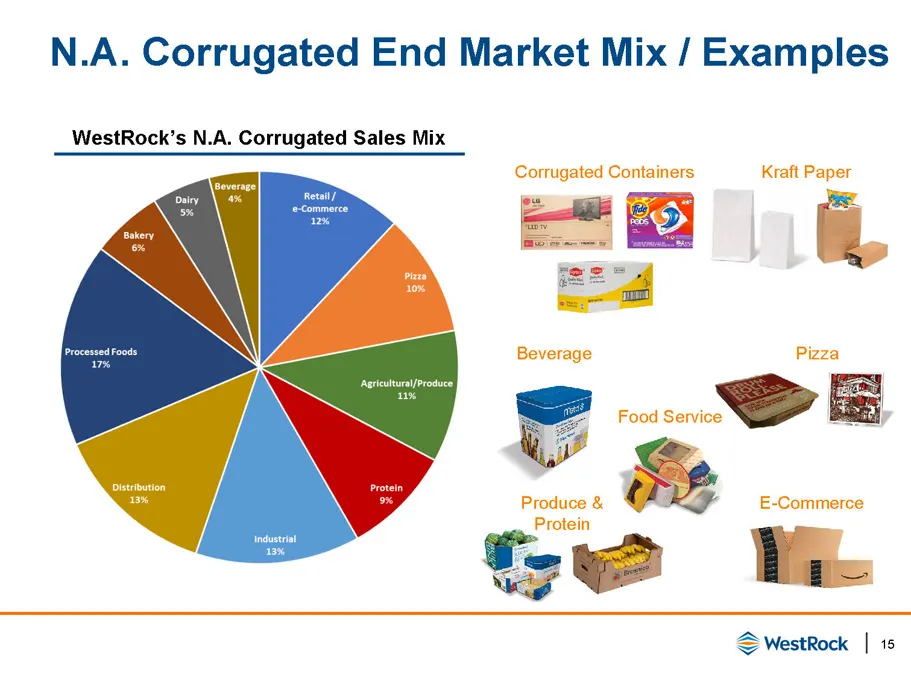
| 15 N.A. Corrugated End Market Mix / Examples WestRock’s N.A. Corrugated Sales Mix Corrugated Containers Kraft Paper Pizza Beverage Food Service E - Commerce Produce & Protein
Slide 16: Consumer End Market Mix / Examples
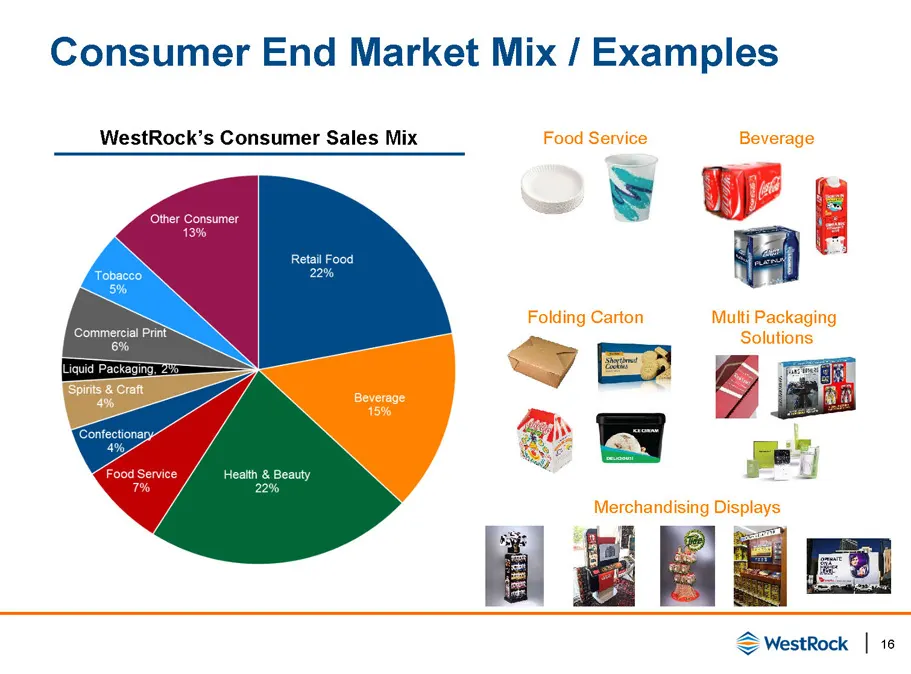
| 16 Consumer End Market Mix / Examples WestRock’s Consumer Sales Mix Food Service Beverage Folding Carton Merchandising Displays Multi Packaging Solutions
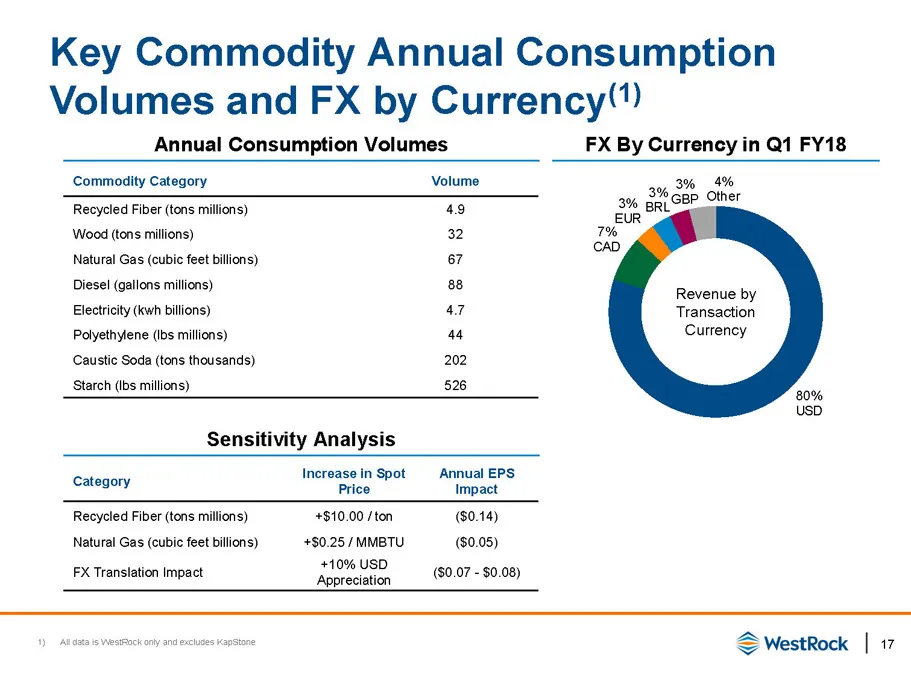
Slide 17: Key Commodity Annual Consumption Volumes and FX by Currency
| 17 Key Commodity Annual Consumption Volumes and FX by Currency (1) Commodity Category Volume Recycled Fiber (tons millions) 4.9 Wood (tons millions) 32 Natural Gas (cubic feet billions) 67 Diesel (gallons millions) 88 Electricity (kwh billions) 4.7 Polyethylene (lbs millions) 44 Caustic Soda (tons
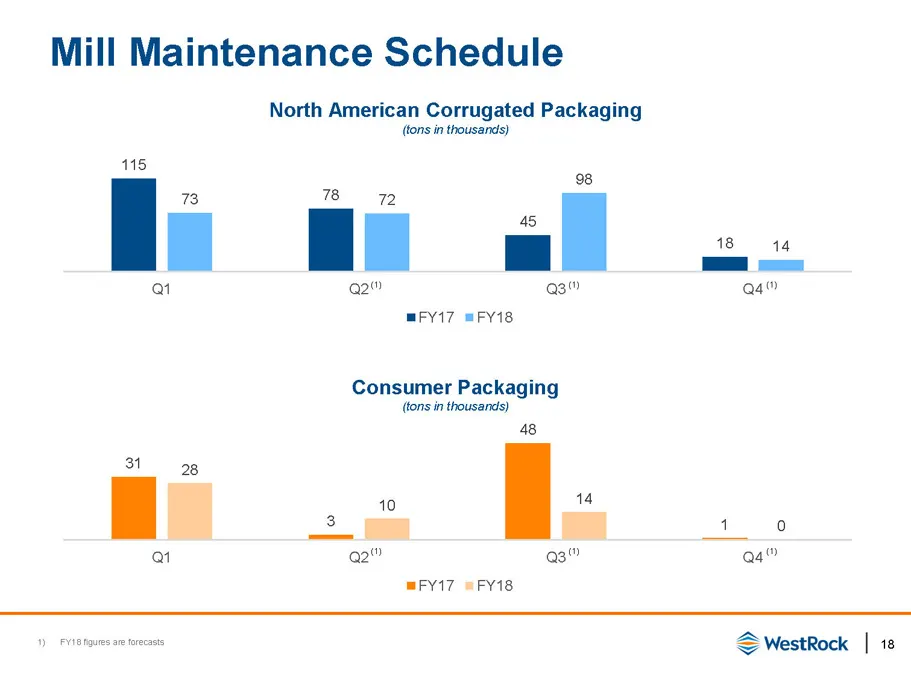
Slide 18: Mill Maintenance Schedule
| 18 Mill Maintenance Schedule 115 78 45 18 73 72 98 14 Q1 Q2 Q3 Q4 FY17 FY18 North American Corrugated Packaging (tons in thousands) Consumer Packaging (tons in thousands) 31 3 48 1 28 10 14 0 Q1 Q2 Q3 Q4 FY17 FY18 1) FY18 figures are forecasts (1) (1) (1) (1) (1) (1)
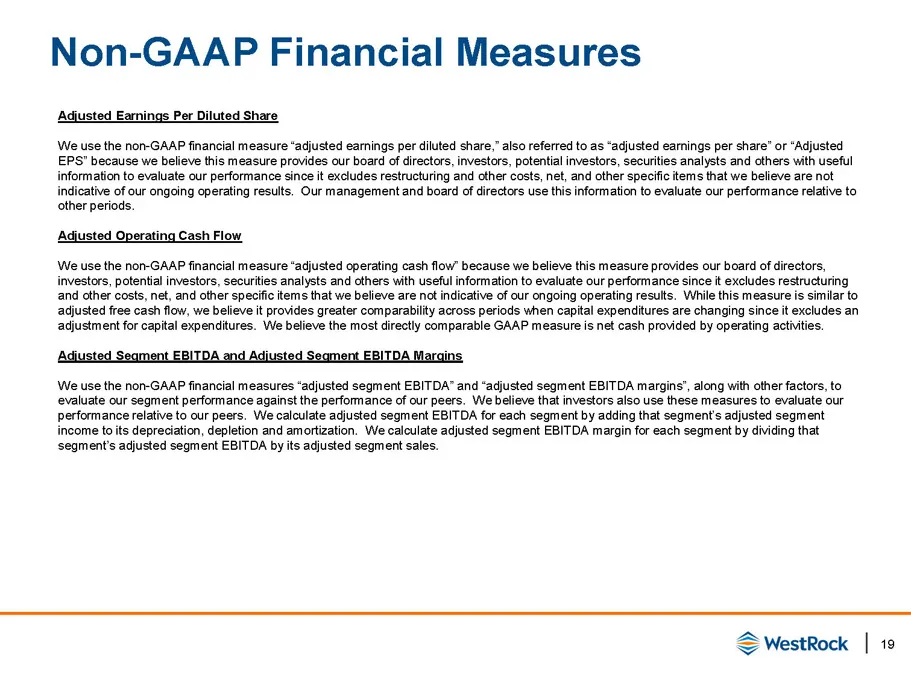
Slide 19: Non-GAAP Financial Measures
| 19 Non - GAAP Financial Measures Adjusted Earnings Per Diluted Share We use the non - GAAP financial measure “adjusted earnings per diluted share,” also referred to as “adjusted earnings per share” o r “Adjusted EPS” because we believe this measure provides our board of directors, investors, poten
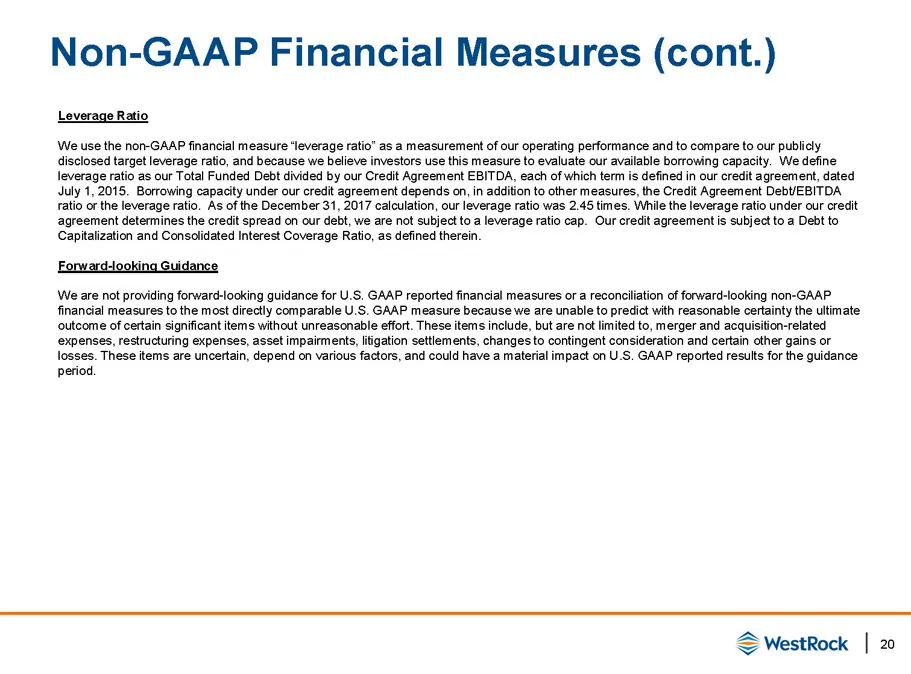
Slide 20: Non-GAAP Financial Measures (cont.)
| 20 Non - GAAP Financial Measures (cont.) Leverage Ratio We use the non - GAAP financial measure “leverage ratio” as a measurement of our operating performance and to compare to our publi cly disclosed target leverage ratio, and because we believe investors use this measure to evaluate our availabl
Slide 21: Adjusted Net Income Reconciliation
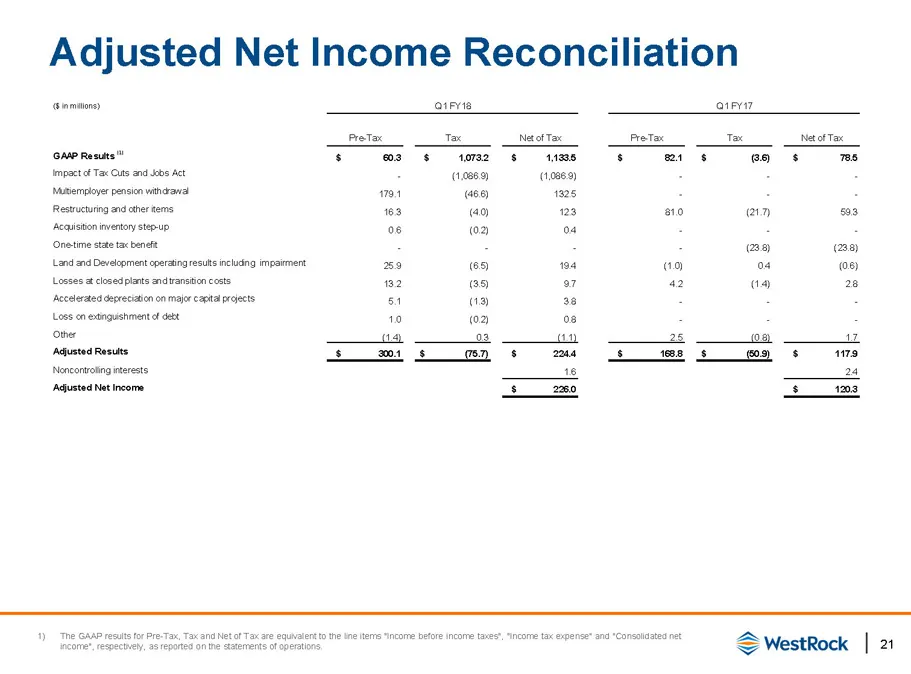
| 21 Adjusted Net Income Reconciliation ($ in millions) Q1 FY18 Q1 FY17 Pre-Tax Tax Net of Tax Pre-Tax Tax Net of Tax GAAP Results (1) $ 60.3 $ 1,073.2 $ 1,133.5 $ 82.1 $ (3.6) $ 78.5 Impact of Tax Cuts and Jobs Act - (1,086.9) (1,086.9) - - - Multiemployer pension withdrawal 179.1 (46.6) 132.5 - -
Slide 22: Adjusted Earnings Per Diluted Share Reconciliation
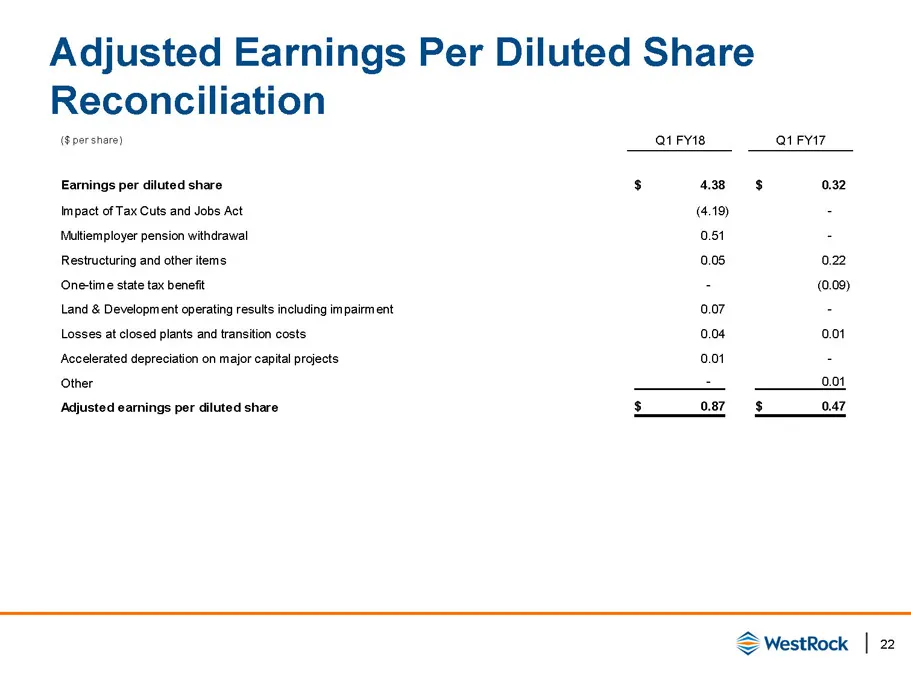
| 22 Adjusted Earnings Per Diluted Share Reconciliation ($ per share) Q1 FY18 Q1 FY17 Earnings per diluted share 4.38$ 0.32$ Impact of Tax Cuts and Jobs Act (4.19) - Multiemployer pension withdrawal 0.51 - Restructuring and other items 0.05 0.22 One-time state tax benefit - (0.09) Land & Development
Slide 23: Adjusted Segment EBITDA and Other Items Q1 FY18
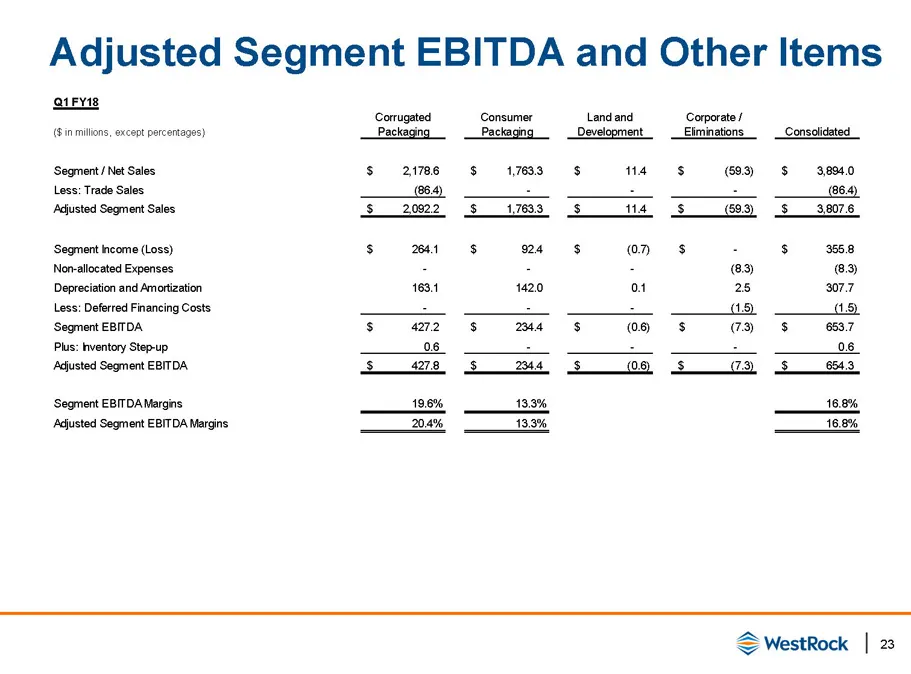
| 23 Adjusted Segment EBITDA and Other Items Q1 FY18 ($ in millions, except percentages) Corrugated Packaging Consumer Packaging Land and Development Corporate / Eliminations Consolidated Segment / Net Sales 2,178.6$ 1,763.3$ 11.4$ (59.3)$ 3,894.0$ Less: Trade Sales (86.4) - - - (86.4) Adjusted Segm
Slide 24: Adjusted Segment EBITDA and Other Items Q1 FY17
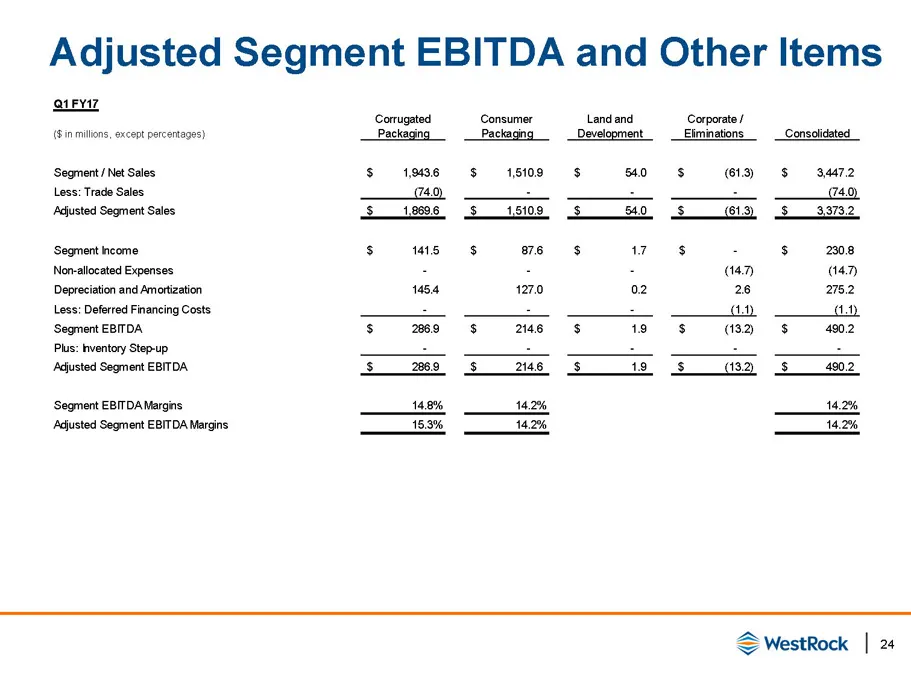
| 24 Adjusted Segment EBITDA and Other Items Q1 FY17 ($ in millions, except percentages) Corrugated Packaging Consumer Packaging Land and Development Corporate / Eliminations Consolidated Segment / Net Sales 1,943.6$ 1,510.9$ 54.0$ (61.3)$ 3,447.2$ Less: Trade Sales (74.0) - - - (74.0) Adjusted Segm
Slide 25: Adjusted Segment EBITDA and Other Items FY17
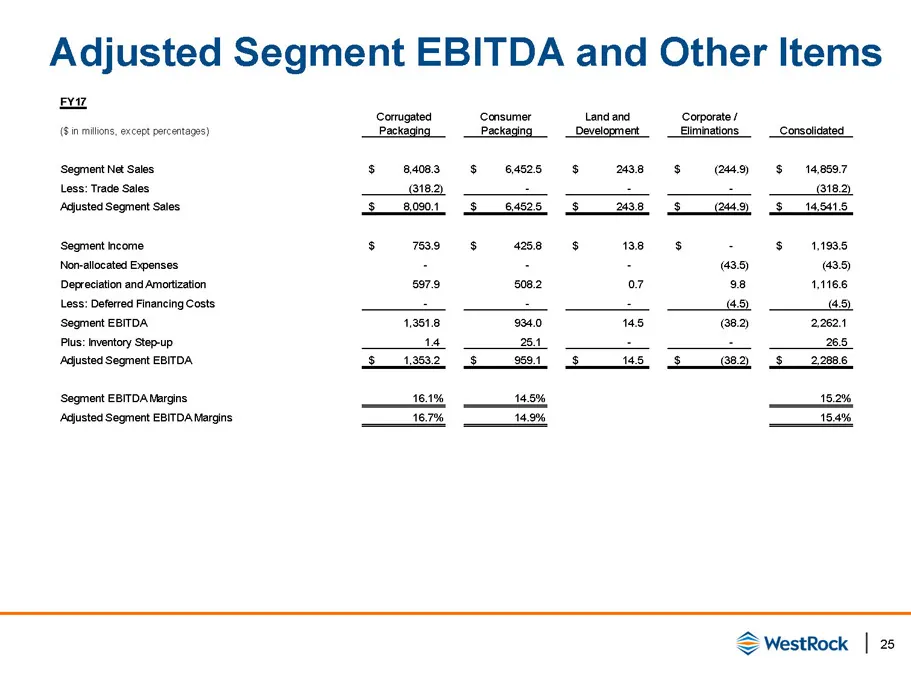
| 25 Adjusted Segment EBITDA and Other Items FY17 ($ in millions, except percentages) Corrugated Packaging Consumer Packaging Land and Development Corporate / Eliminations Consolidated Segment Net Sales 8,408.3$ 6,452.5$ 243.8$ (244.9)$ 14,859.7$ Less: Trade Sales (318.2) - - - (318.2) Adjusted Segm
Slide 26: LTM Credit Agreement EBITDA
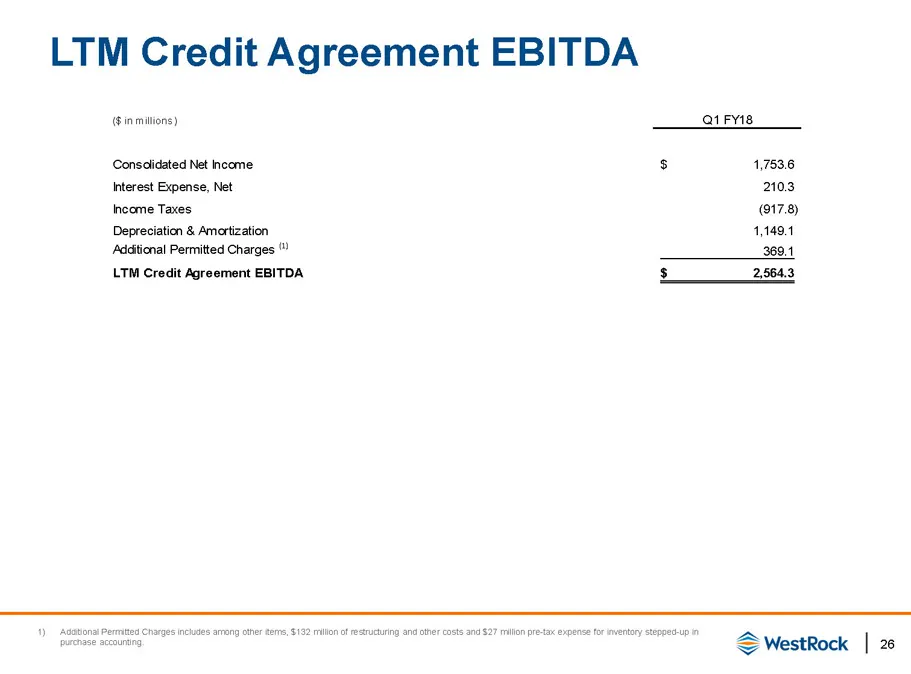
| 26 LTM Credit Agreement EBITDA ($ in millions) Q1 FY18 Consolidated Net Income 1,753.6$ Interest Expense, Net 210.3 Income Taxes (917.8) Depreciation & Amortization 1,149.1 Additional Permitted Charges (1) 369.1 LTM Credit Agreement EBITDA 2,564.3$ 1) Additional Permitted Charges includes among ot
Slide 27: Total Debt, Funded Debt and Leverage Ratio
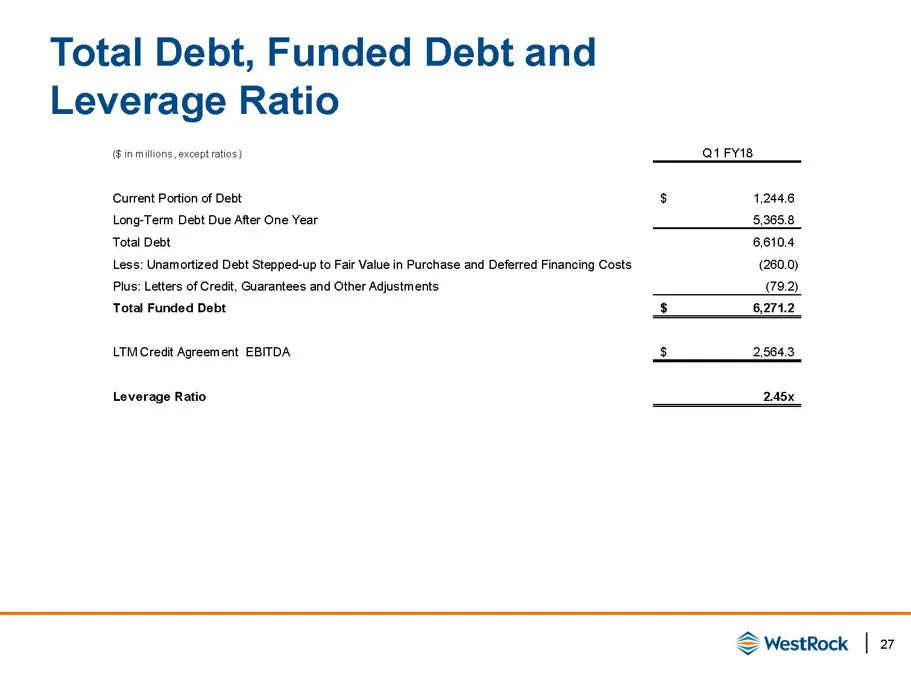
| 27 Total Debt, Funded Debt and Leverage Ratio ($ in millions, except ratios) Q1 FY18 Current Portion of Debt 1,244.6$ Long-Term Debt Due After One Year 5,365.8 Total Debt 6,610.4 Less: Unamortized Debt Stepped-up to Fair Value in Purchase and Deferred Financing Costs (260.0) Plus: Letters of Credi
Slide 28: WestRock
eN = WestRock
Source: SEC EDGAR · 8-K filed Feb 13, 2018
More decks from WestRock Co
 Q2 FY2024 Earnings Presentation24 slides · May 2, 2024
 Q1 2024 Earnings Presentation28 slides · Feb 1, 2024
 Q4 2023 Earnings Presentation28 slides · Nov 9, 2023
 Q3 FY2023 Earnings Presentation28 slides · Aug 3, 2023
 Q2 FY2023 Earnings Presentation29 slides · May 4, 2023
 Q1 FY23 Earnings Presentation21 slides · Mar 1, 2023