WestRock — Q1 2024 Earnings Presentation
28 slides from WestRock's earnings presentation, Feb 1, 2024
Slide 1: WestRock Q1 FY2024 Results
WestRock February 1, 2024 Q1 FY2024 Results 1 | © 2024 WestRock Company. All Rights Reserved.
Slide 2: Cautionary Language
Cautionary Language Forward Looking Statements: This presentation contains forward-looking statements within the meaning of the Private Securities Litigation Reform Act of 1995, including but not limited to the statements on the slides entitled “Key Highlights”, “Continuing to Deliver Portfolio Impr
Slide 3: Key Highlights
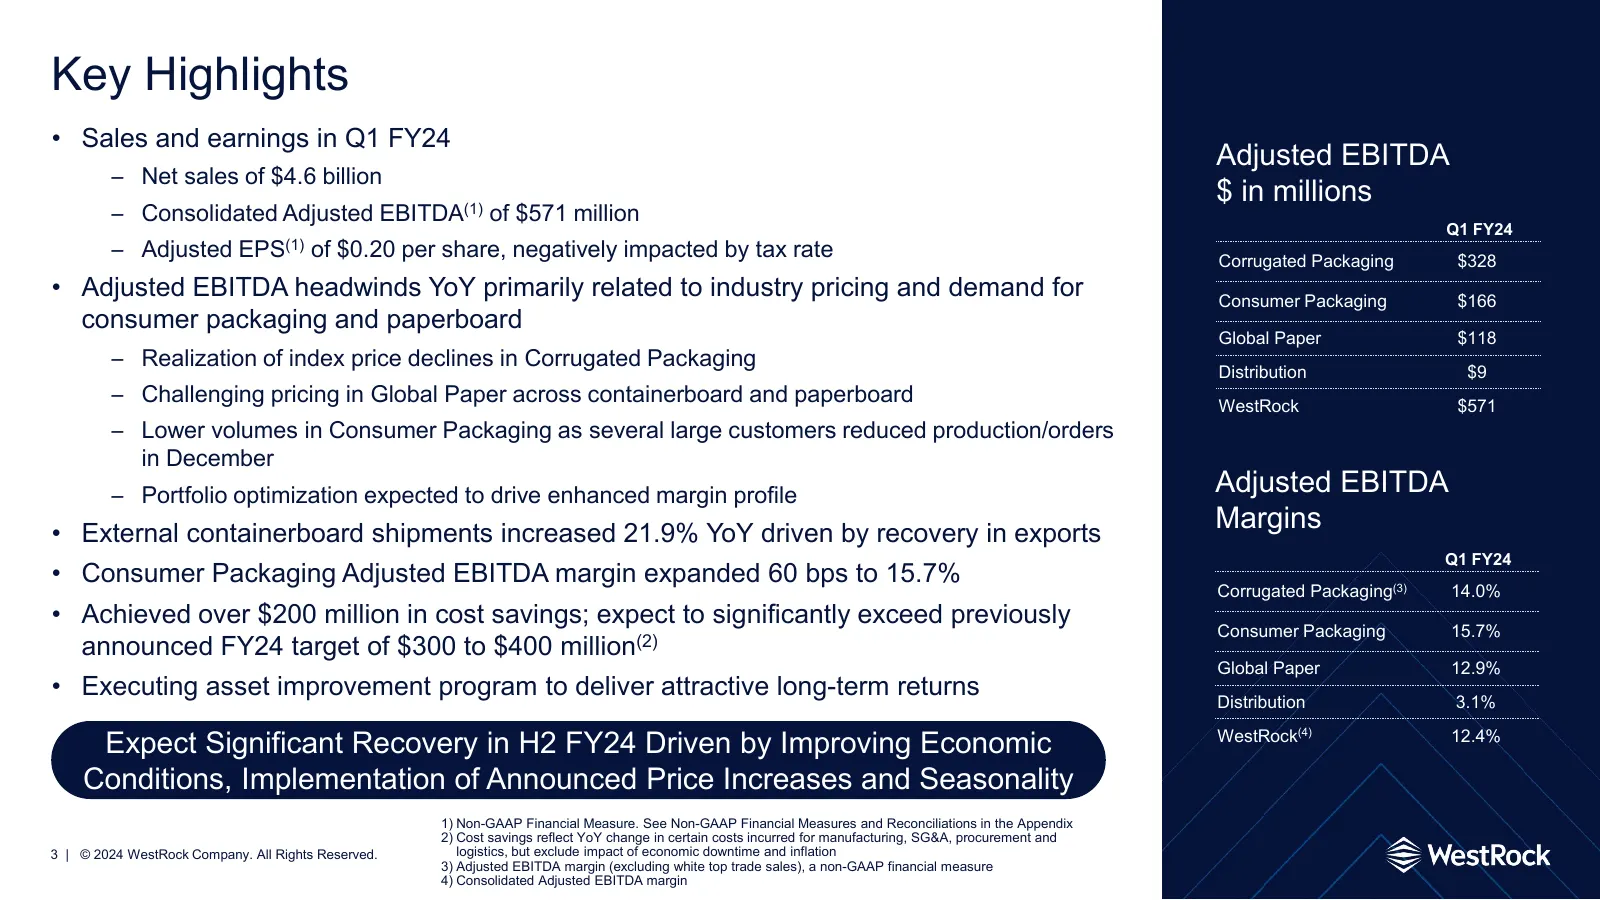
Key Highlights • Sales and earnings in Q1 FY24 Adjusted EBITDA – Net sales of $4.6 billion $ in millions – Consolidated Adjusted EBITDA(1) of $571 million Q1 FY24 – Adjusted EPS(1) of $0.20 per share, negatively impacted by tax rate Corrugated Packaging $328 • Adjusted EBITDA headwinds YoY primarily
Slide 4: Packaging Delivering More for Customers and Consumers
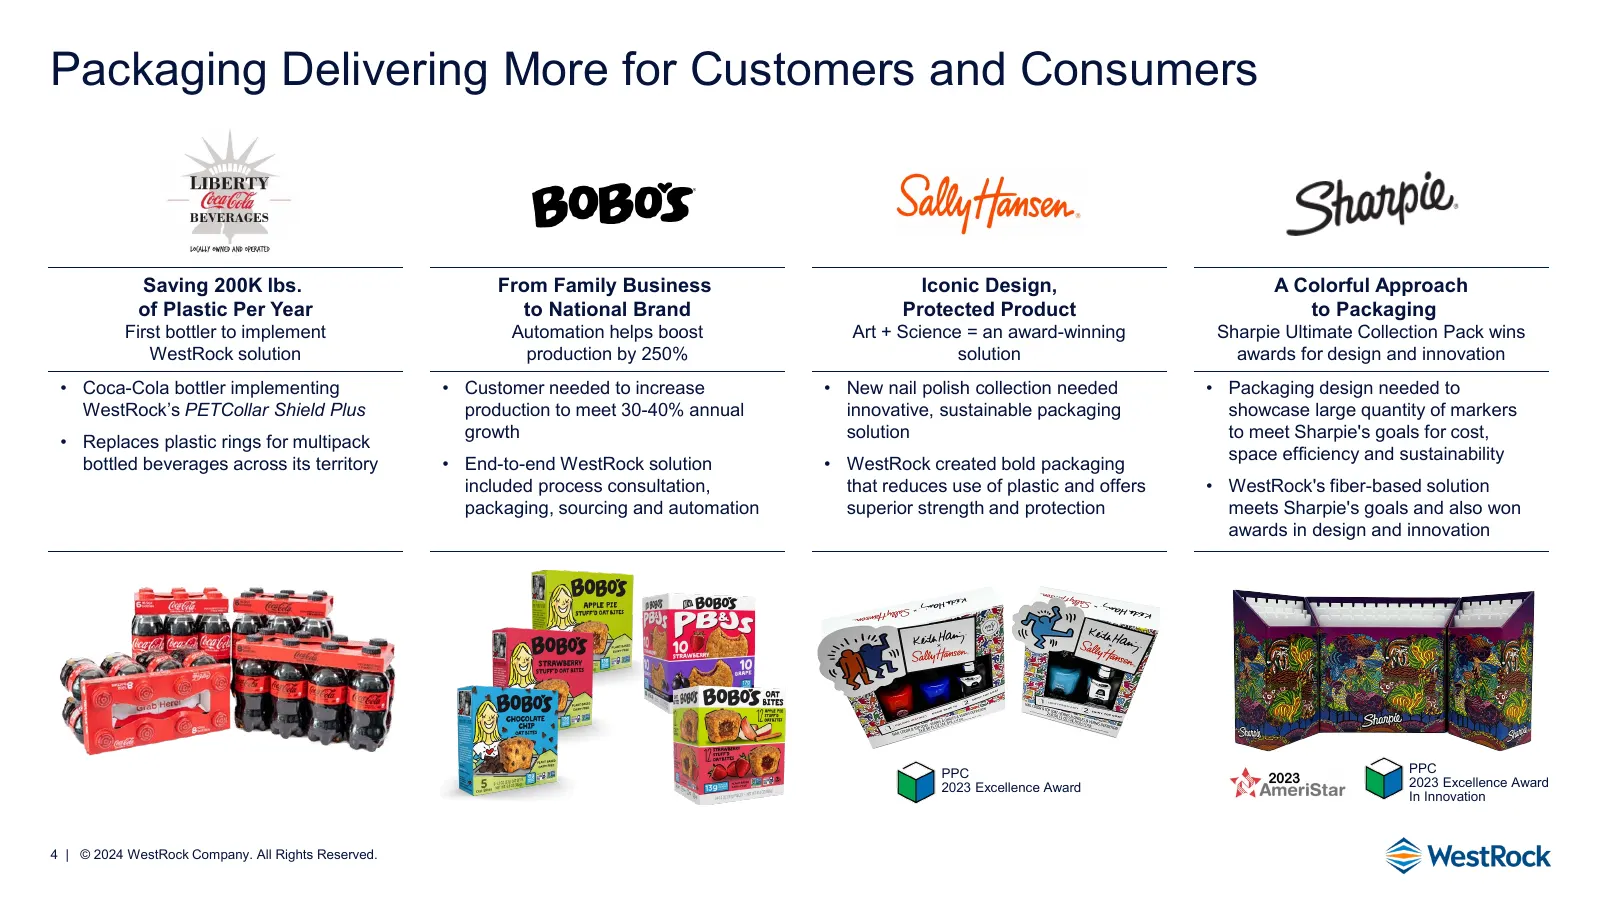
Packaging Delivering More for Customers and Consumers Saving 200K lbs. From Family Business Iconic Design, A Colorful Approach of Plastic Per Year to National Brand Protected Product to Packaging First bottler to implement Automation helps boost Art + Science = an award-winning Sharpie Ultimate Coll
Slide 5: Continuing to Deliver Portfolio Improvements
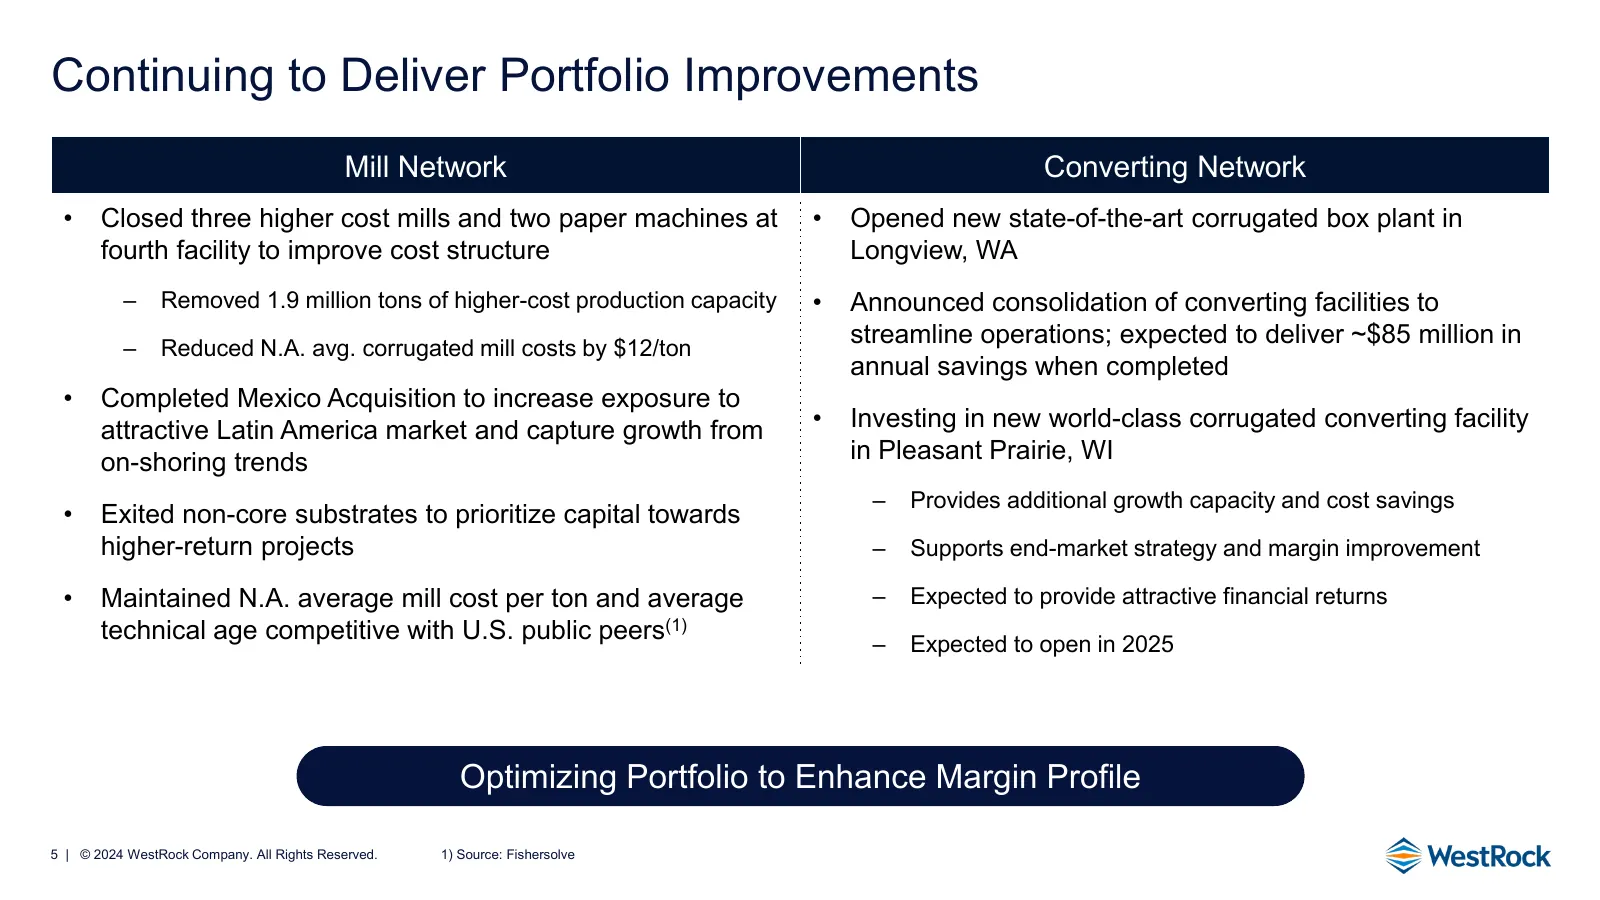
Continuing to Deliver Portfolio Improvements Mill Network Converting Network • Closed three higher cost mills and two paper machines at • Opened new state-of-the-art corrugated box plant in fourth facility to improve cost structure Longview, WA ‒ Removed 1.9 million tons of higher-cost production ca
Slide 6: Exceeding Cost Savings Targets; Strong Momentum for FY24 and Beyond
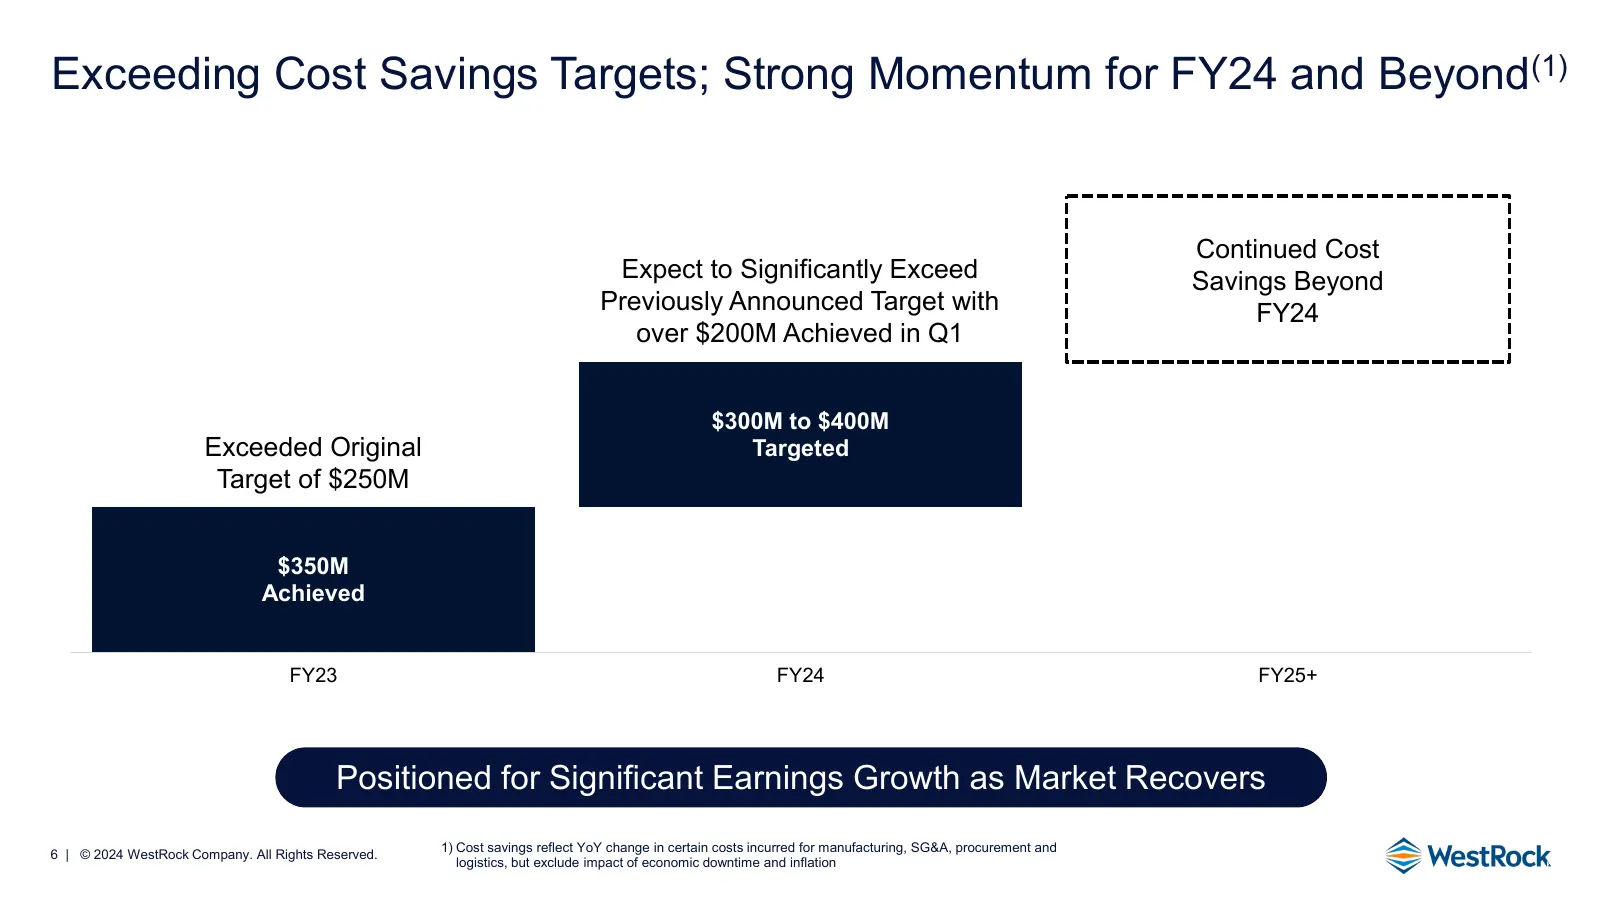
Exceeding Cost Savings Targets; Strong Momentum for FY24 and Beyond(1) Continued Cost Expect to Significantly Exceed Savings Beyond Previously Announced Target with FY24 over $200M Achieved in Q1 $300M to $400M Exceeded Original Targeted Target of $250M $350M Achieved FY23 FY24 FY25+ Positioned for
Slide 7: Q1 FY24 WestRock Results
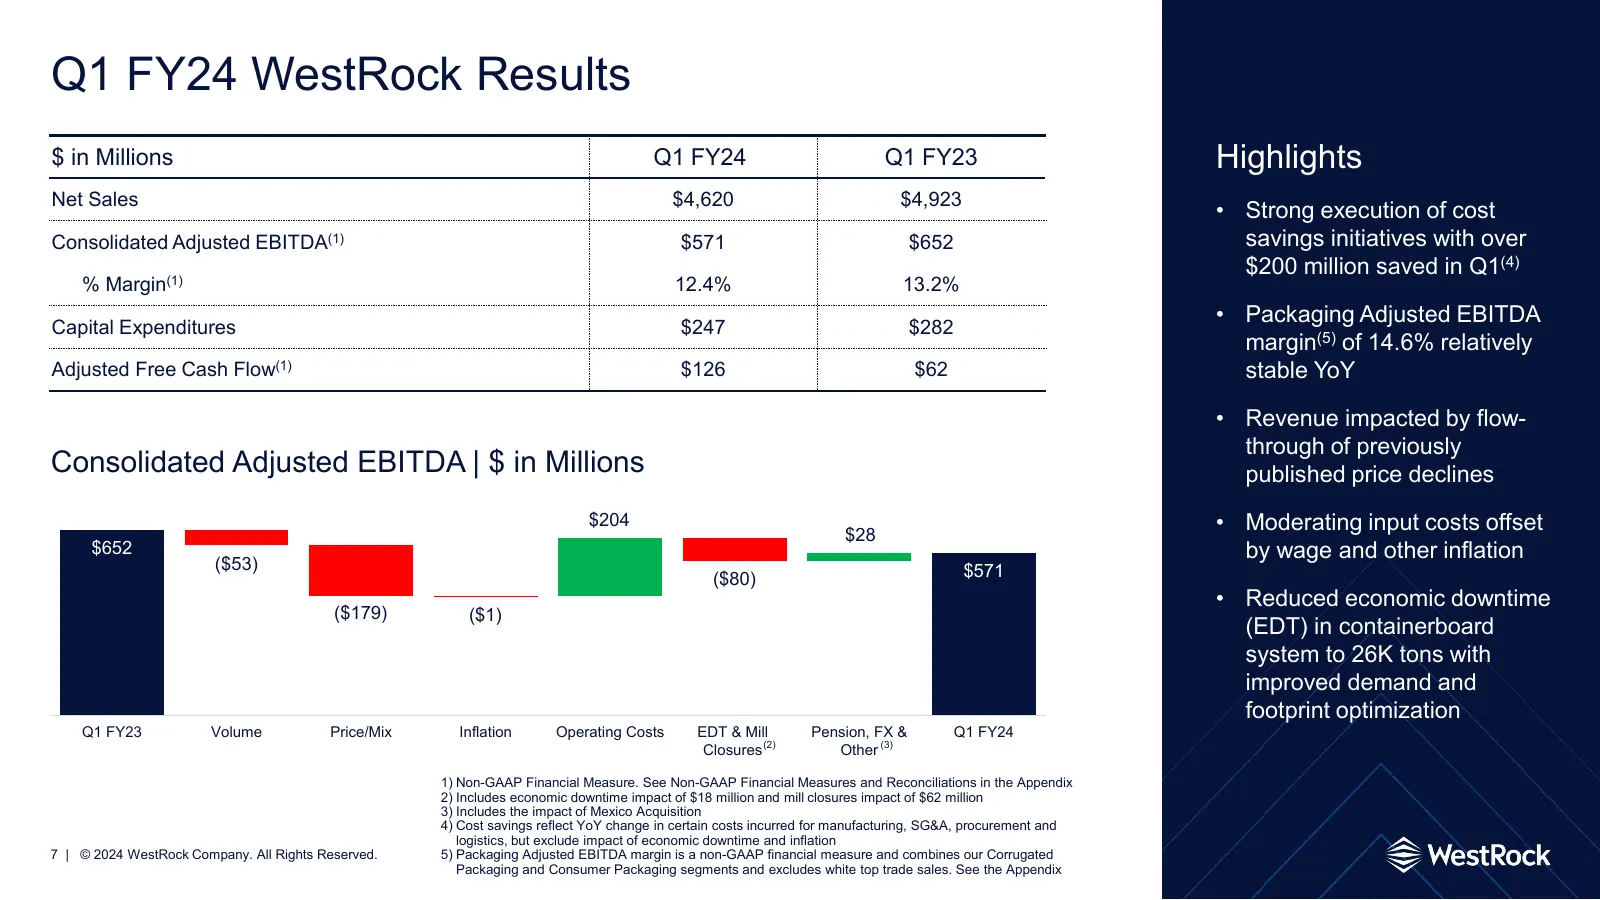
Q1 FY24 WestRock Results $ in Millions Q1 FY24 Q1 FY23 Highlights Net Sales $4,620 $4,923 • Strong execution of cost Consolidated Adjusted EBITDA(1) $571 $652 savings initiatives with over $200 million saved in Q1(4) % Margin(1) 12.4% 13.2% • Packaging Adjusted EBITDA Capital Expenditures $247 $282
Slide 8: Q1 FY24 Corrugated Packaging Results
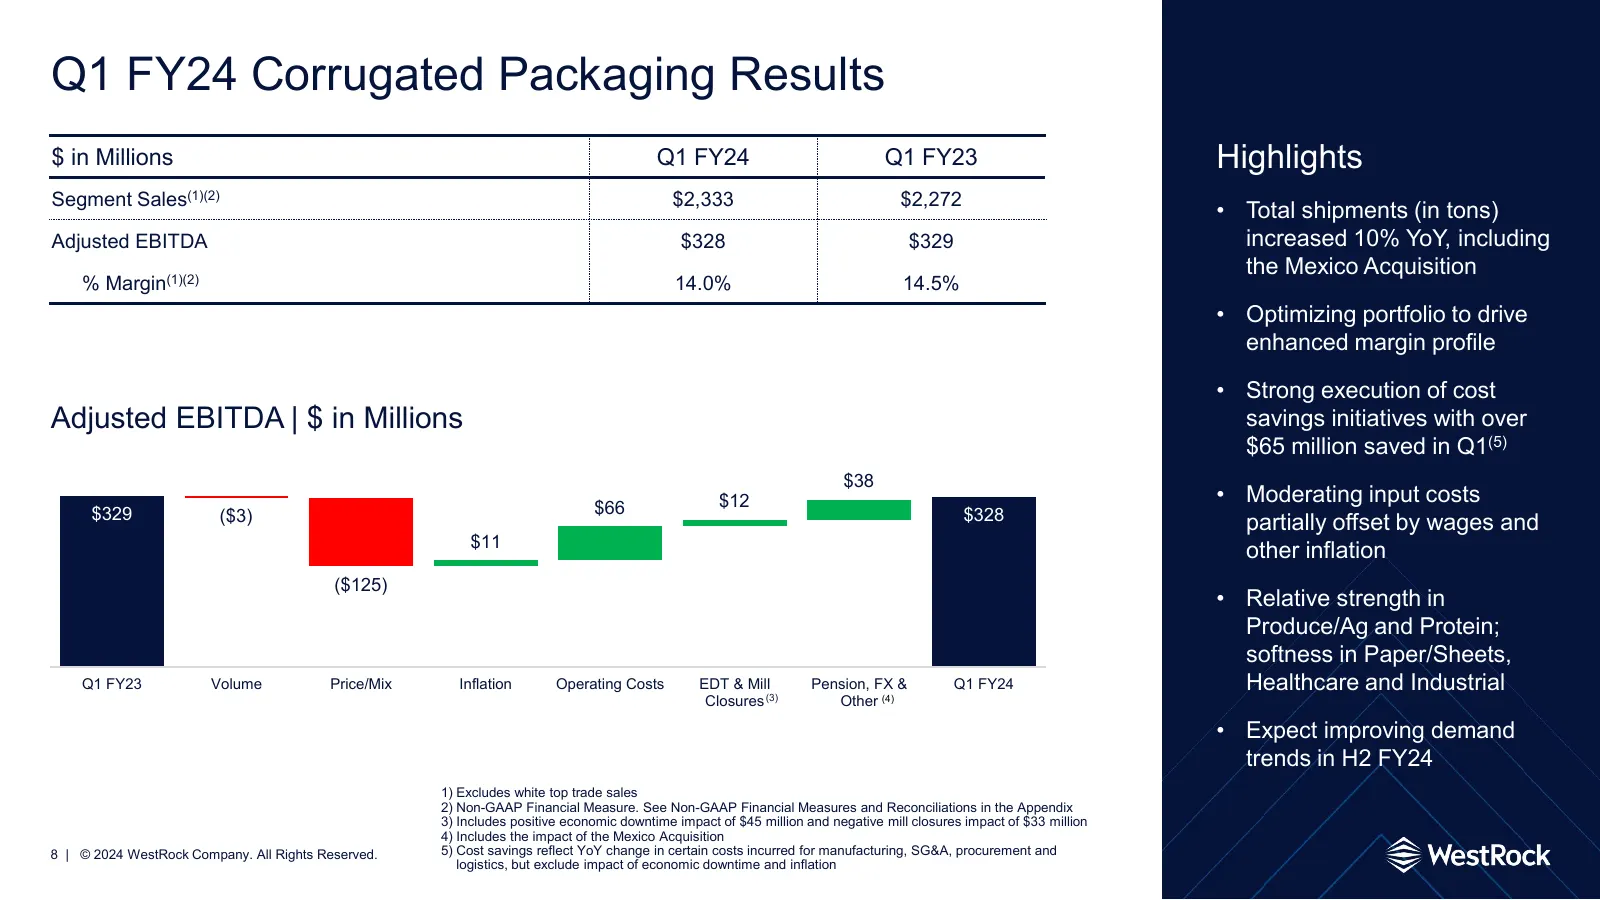
Q1 FY24 Corrugated Packaging Results $ in Millions Q1 FY24 Q1 FY23 Highlights Segment Sales(1)(2) $2,333 $2,272 • Total shipments (in tons) Adjusted EBITDA $328 $329 increased 10% YoY, including the Mexico Acquisition % Margin(1)(2) 14.0% 14.5% • Optimizing portfolio to drive enhanced margin profile
Slide 9: Q1 FY24 Consumer Packaging Results
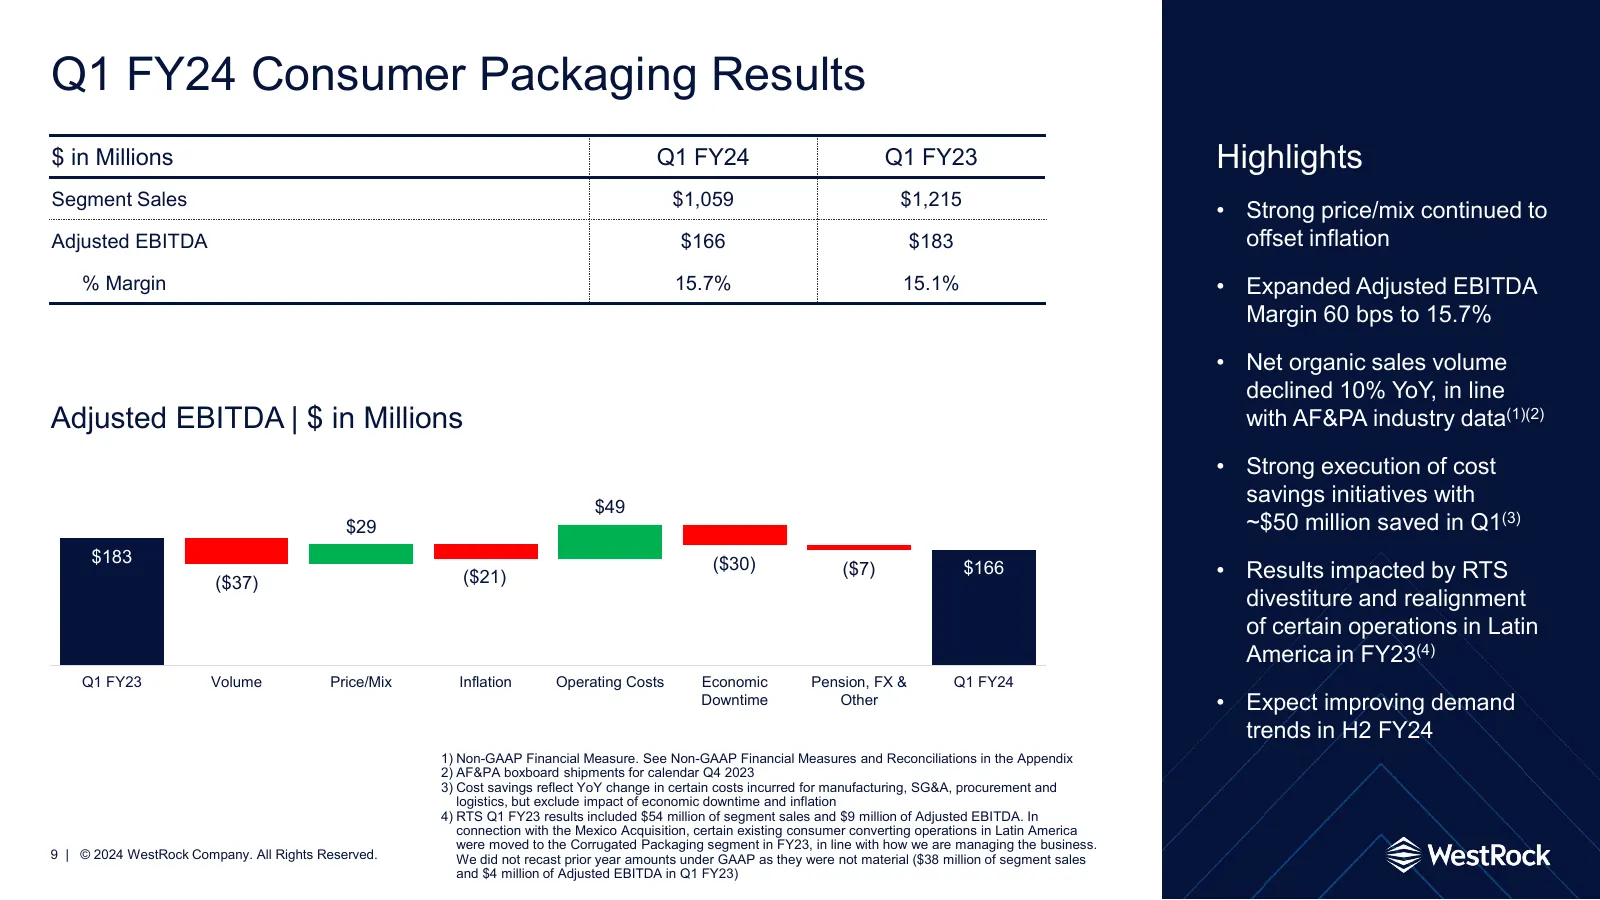
Q1 FY24 Consumer Packaging Results $ in Millions Q1 FY24 Q1 FY23 Highlights Segment Sales $1,059 $1,215 • Strong price/mix continued to Adjusted EBITDA $166 $183 offset inflation % Margin 15.7% 15.1% • Expanded Adjusted EBITDA Margin 60 bps to 15.7% • Net organic sales volume declined 10% YoY, in li
Slide 10: Q1 FY24 Global Paper Results
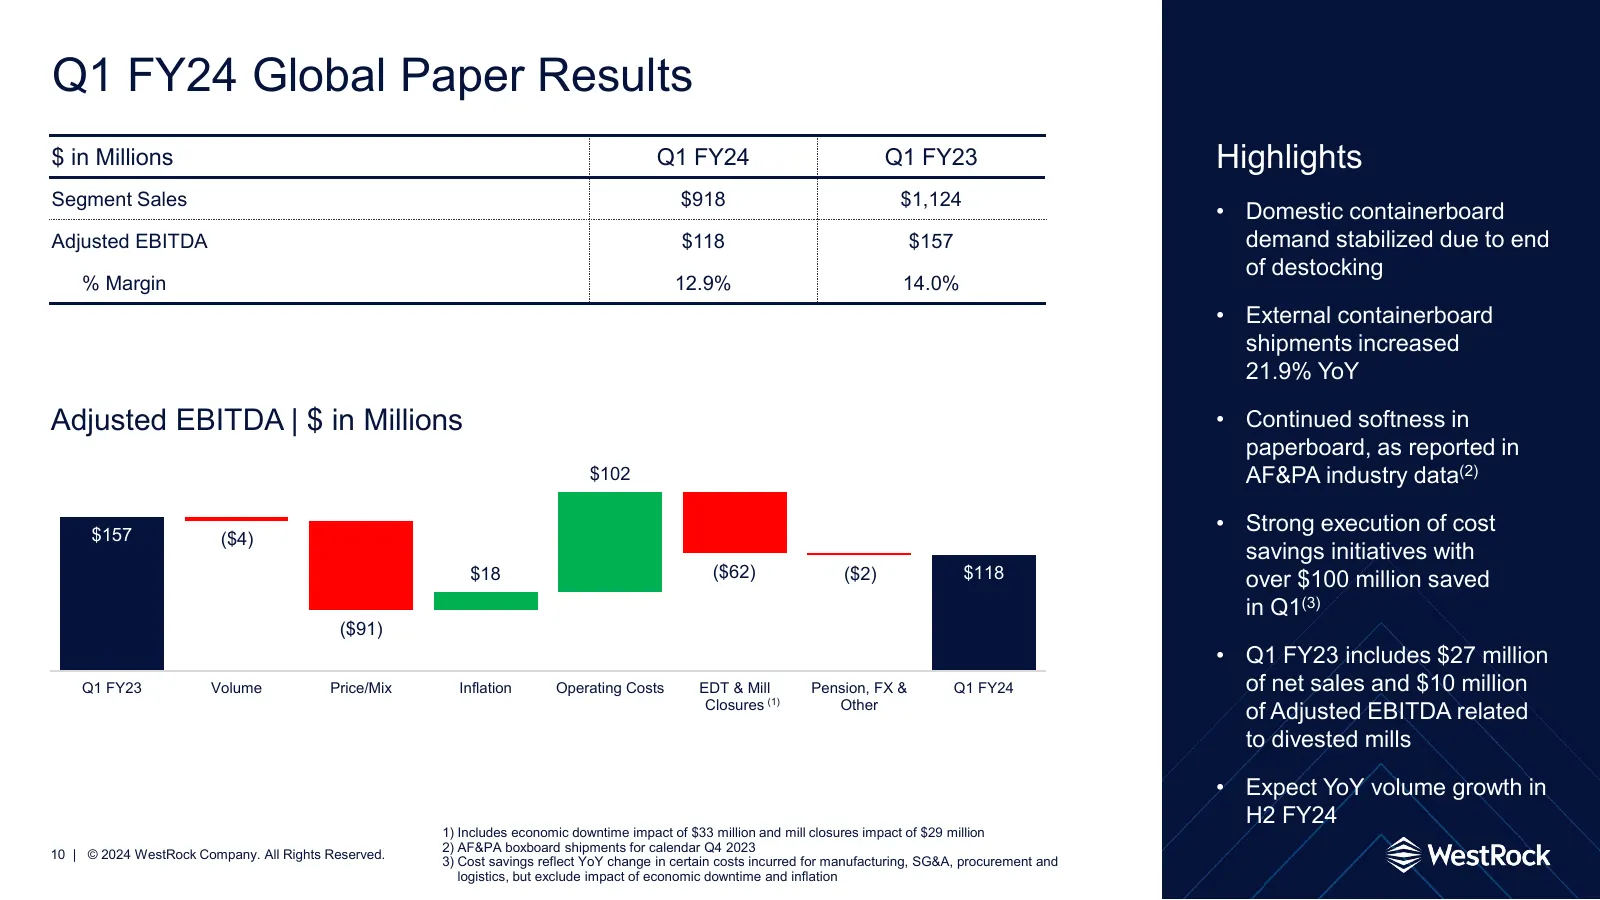
Q1 FY24 Global Paper Results $ in Millions Q1 FY24 Q1 FY23 Highlights Segment Sales $918 $1,124 • Domestic containerboard Adjusted EBITDA $118 $157 demand stabilized due to end of destocking % Margin 12.9% 14.0% • External containerboard shipments increased 21.9% YoY Adjusted EBITDA | $ in Millions
Slide 11: Q1 FY24 Distribution Results
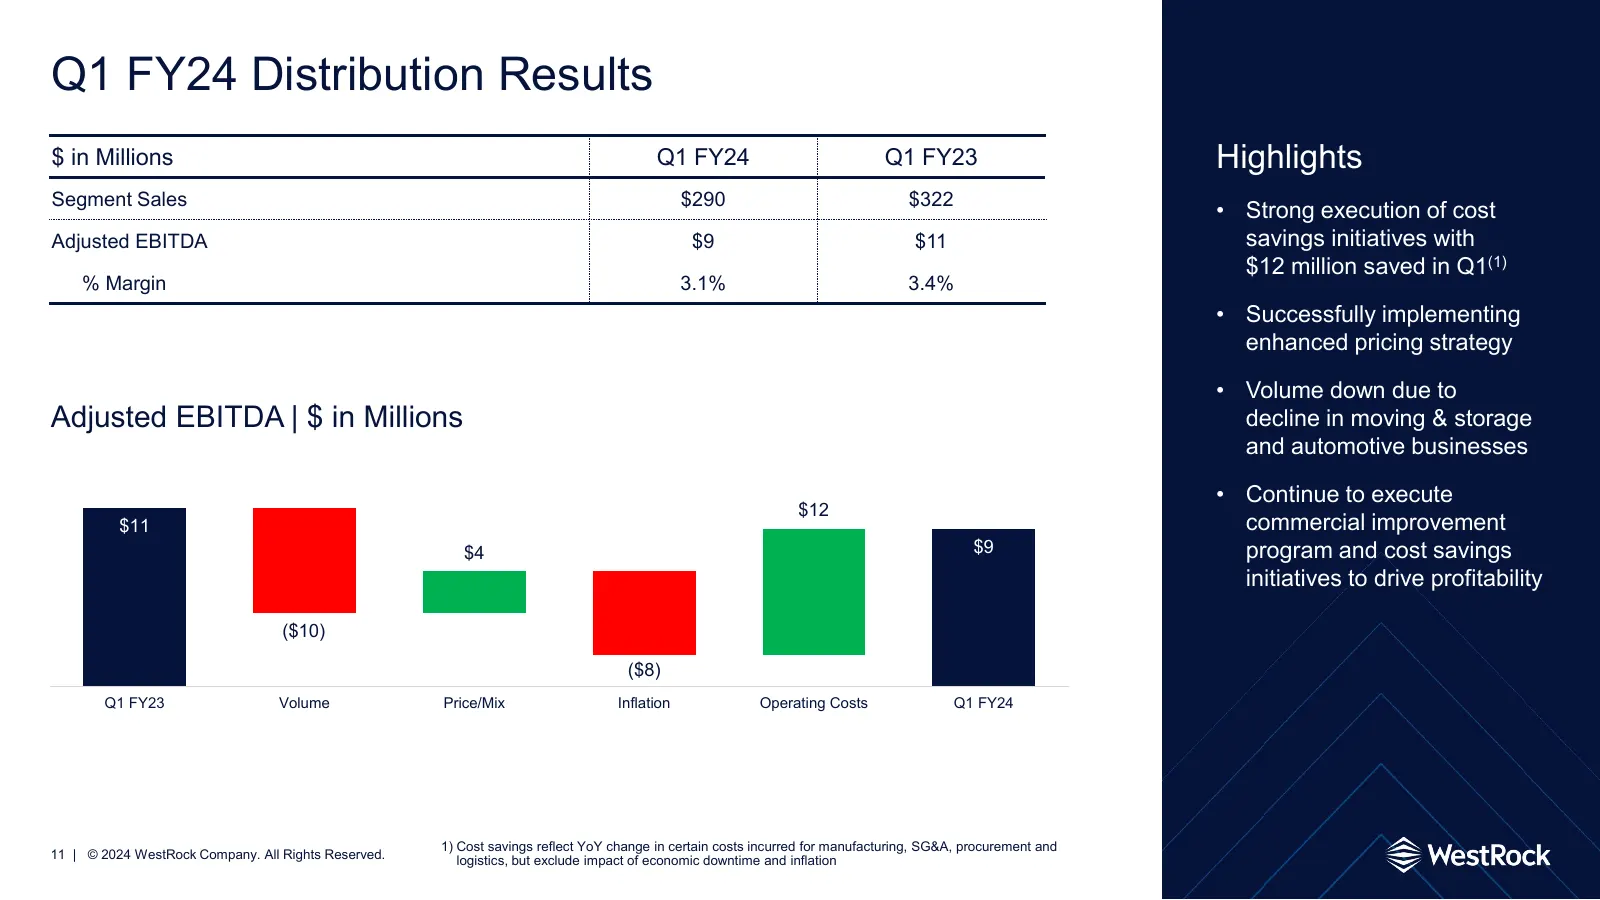
Q1 FY24 Distribution Results $ in Millions Q1 FY24 Q1 FY23 Highlights Segment Sales $290 $322 • Strong execution of cost Adjusted EBITDA $9 $11 savings initiatives with $12 million saved in Q1(1) % Margin 3.1% 3.4% • Successfully implementing enhanced pricing strategy • Volume down due to Adjusted E
Slide 12: Q2 FY24 WestRock Guidance
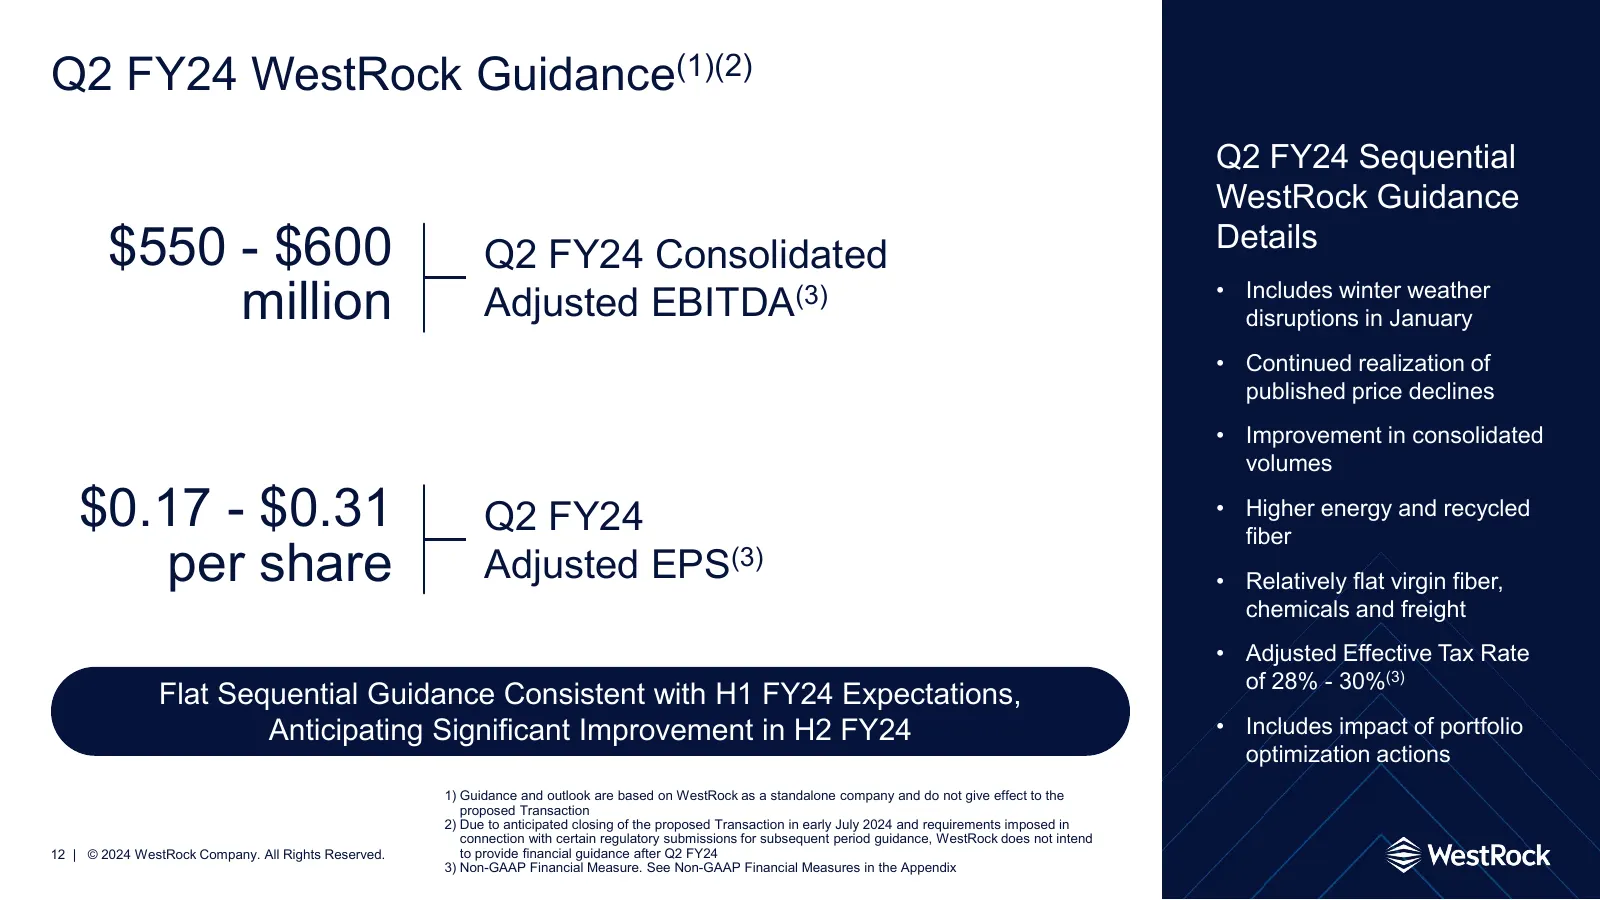
Q2 FY24 WestRock Guidance(1)(2) Q2 FY24 Sequential WestRock Guidance $550 - $600 Q2 FY24 Consolidated Details million Adjusted EBITDA(3) • Includes winter weather disruptions in January • Continued realization of published price declines • Improvement in consolidated volumes $0.17 - $0.31 Q2 FY24 •
Slide 13: Expecting Significant Demand Improvement in H2 FY24
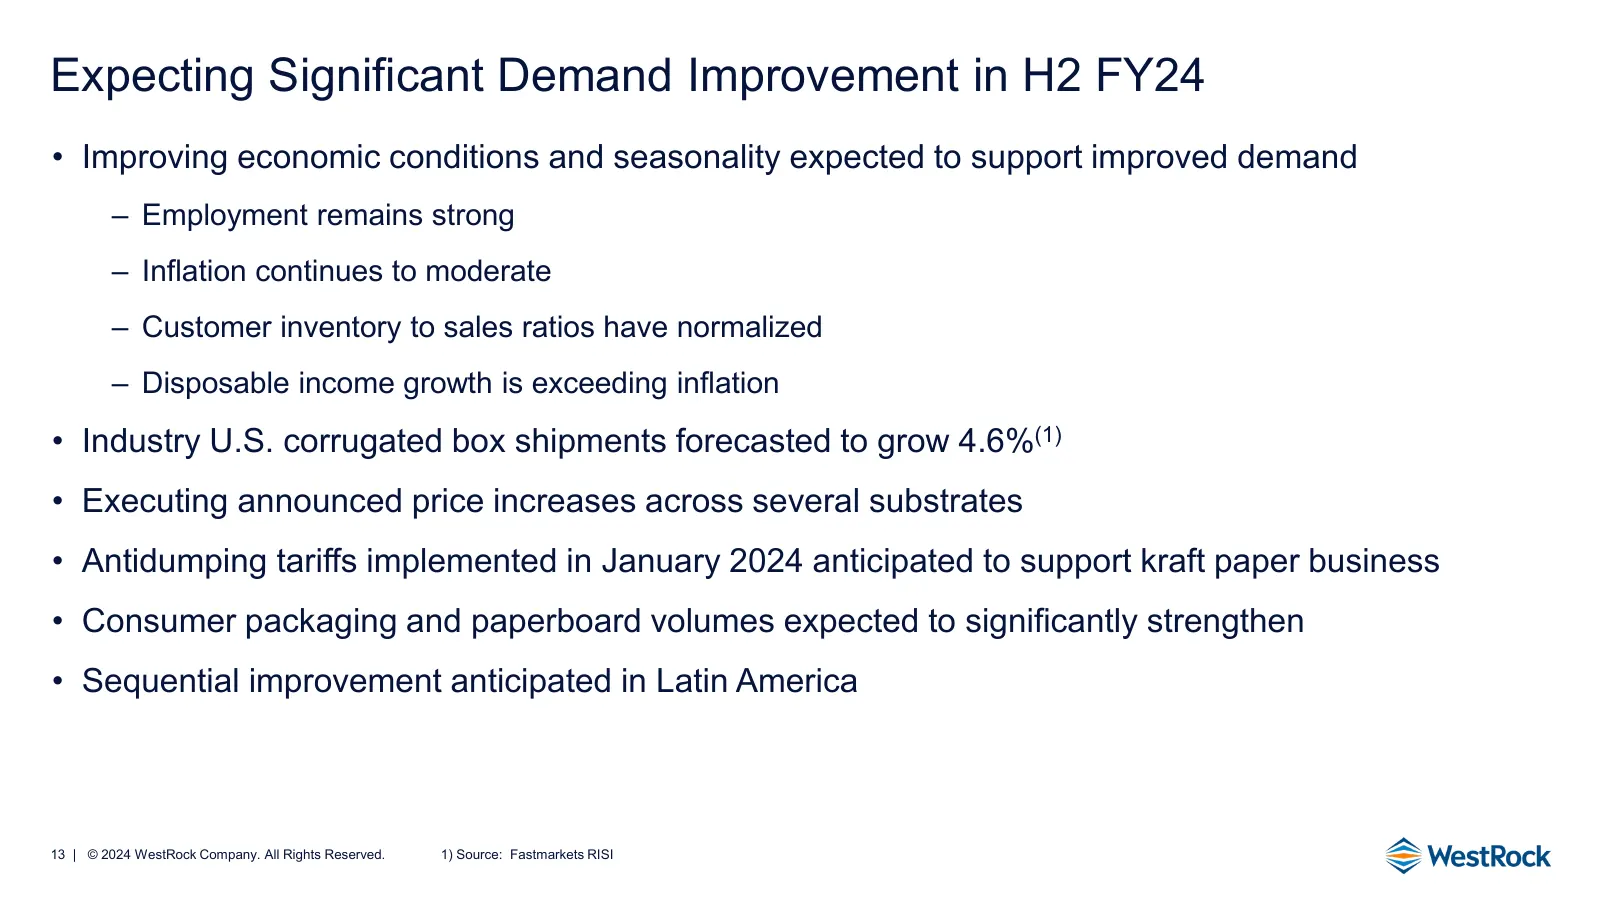
Expecting Significant Demand Improvement in H2 FY24 • Improving economic conditions and seasonality expected to support improved demand – Employment remains strong – Inflation continues to moderate – Customer inventory to sales ratios have normalized – Disposable income growth is exceeding inflation
Slide 14: Creating Value
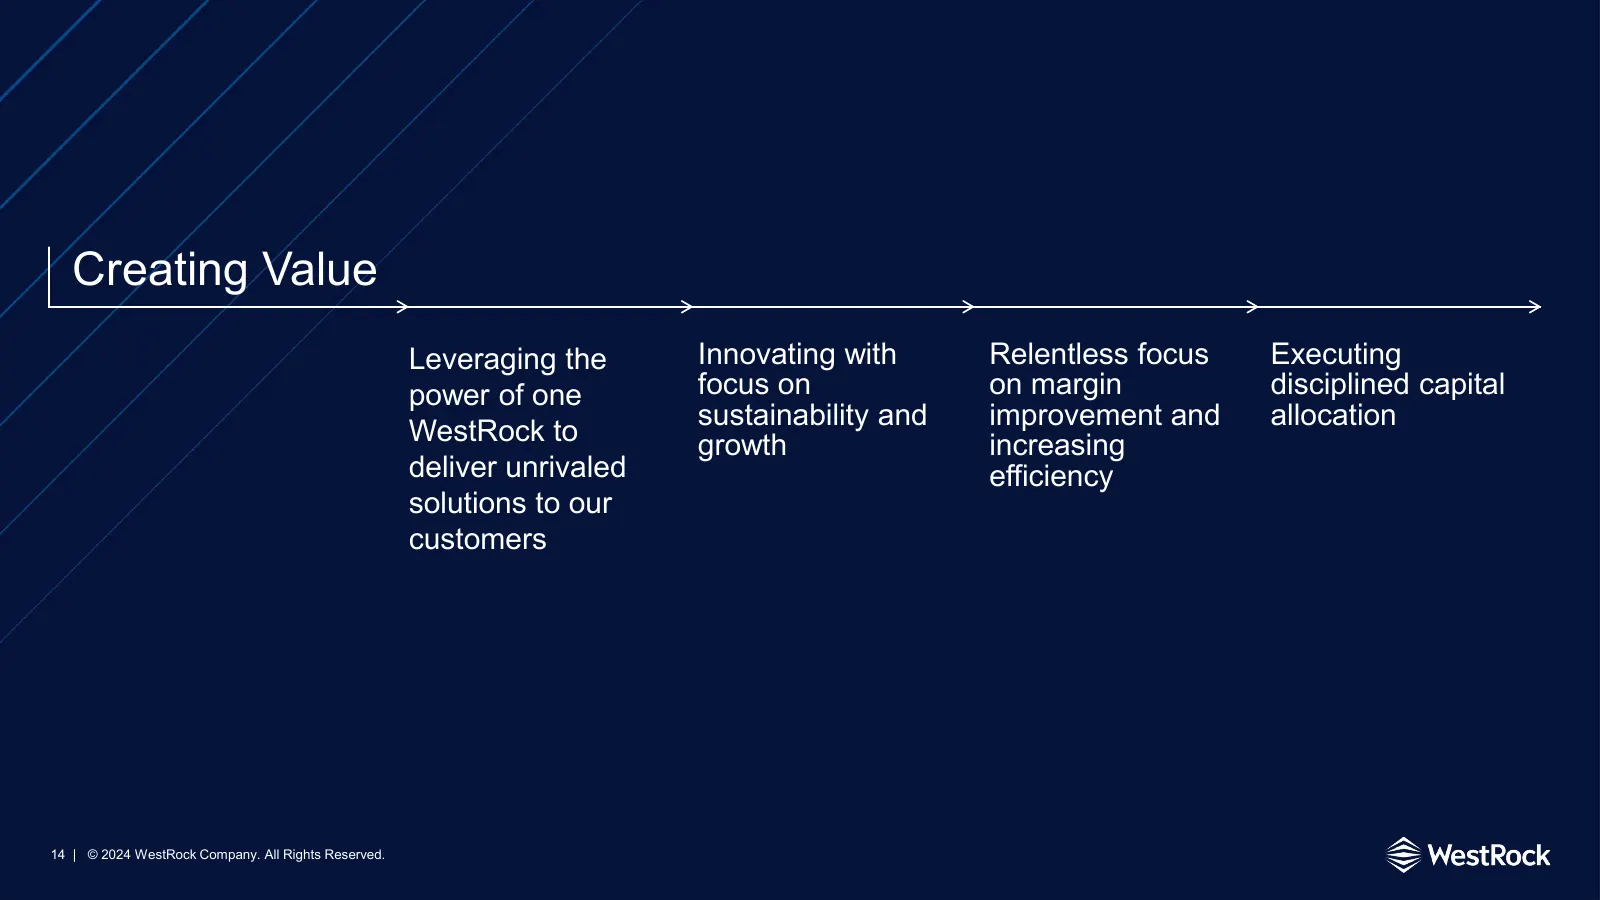
Creating Value Leveraging the Innovating with Relentless focus Executing power of one focus on on margin disciplined capital sustainability and improvement and allocation WestRock to growth increasing deliver unrivaled efficiency solutions to our customers 14 | © 2024 WestRock Company. All Rights Re
Slide 15: Appendix
Appendix 15 | © 2024 WestRock Company. All Rights Reserved. 15
Slide 16: Q1 Year Over Year Bridges
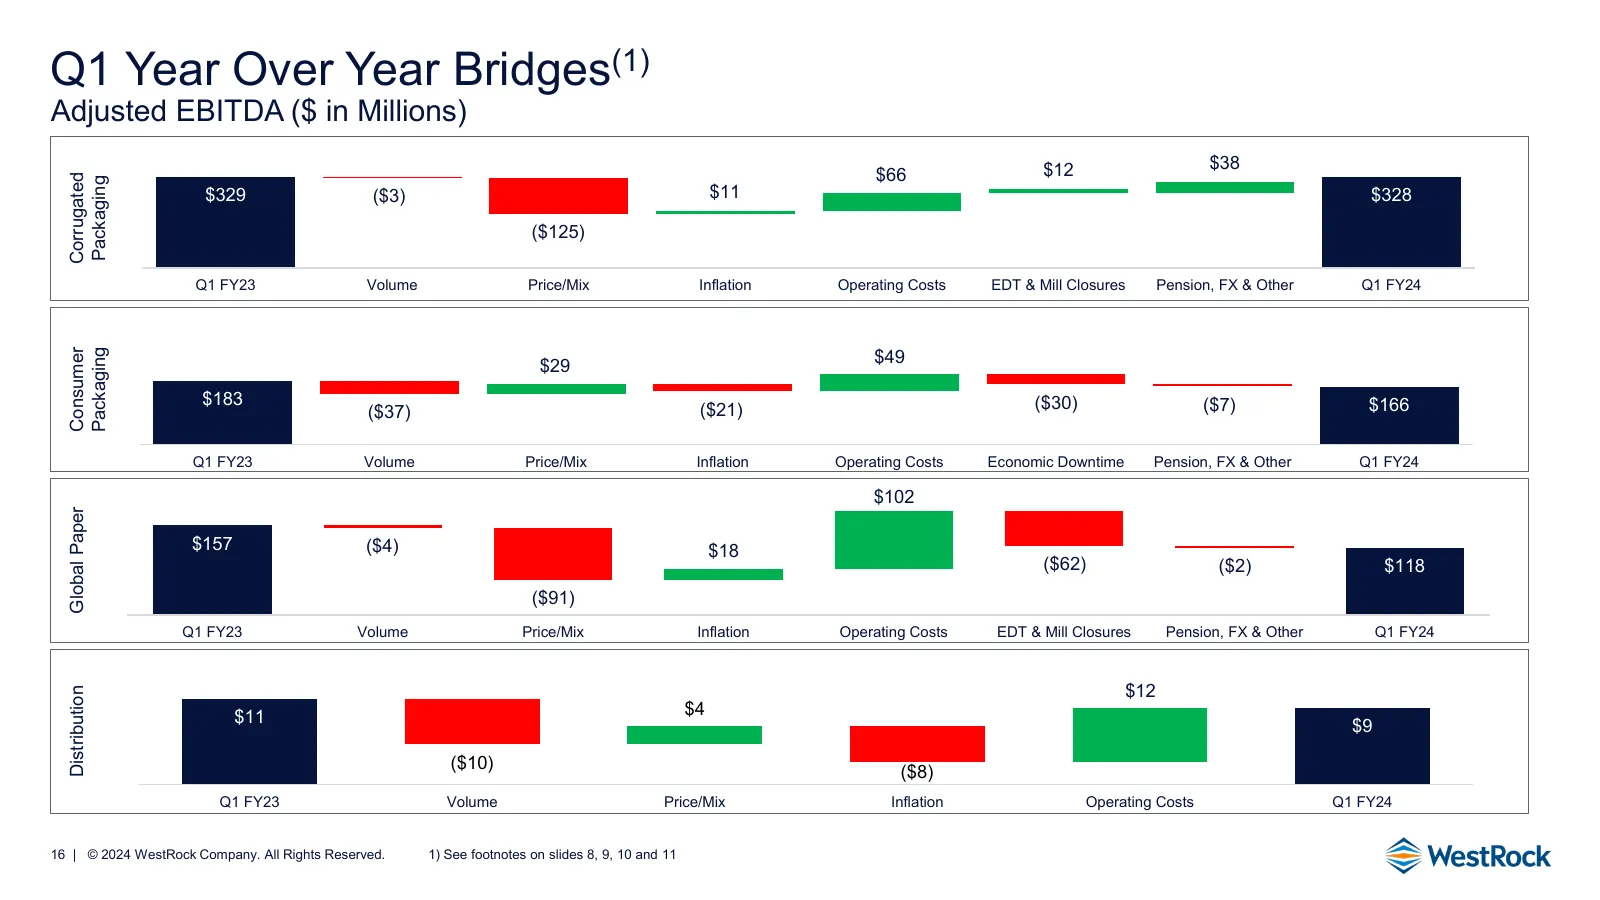
Q1 Year Over Year Bridges(1) Adjusted EBITDA ($ in Millions) $12 $38 $66 Corrugated Packaging $329 ($3) $11 $328 ($125) Q1 FY23 Volume Price/Mix Inflation Operating Costs EDT & Mill Closures Pension, FX & Other Q1 FY24 $49 Packaging Consumer $29 $183 ($30) ($7) $166 ($37) ($21) $173 Q1 FY23 Volume P
Slide 17: Q2 FY24 Guidance
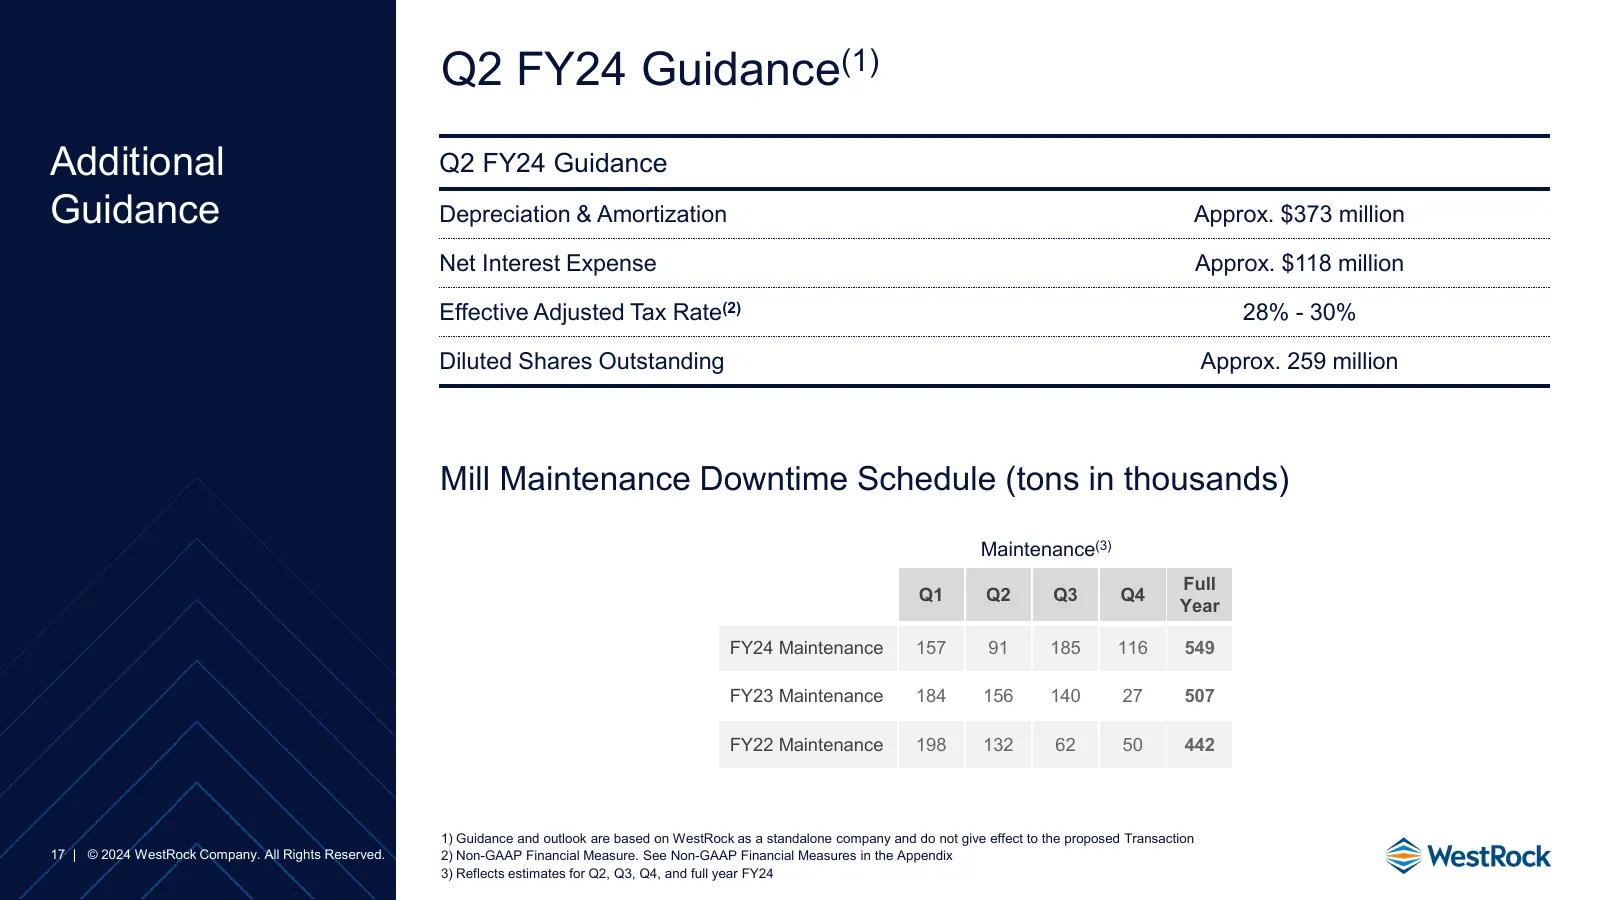
Q2 FY24 Guidance(1) Additional Q2 FY24 Guidance Guidance Depreciation & Amortization Approx. $373 million Net Interest Expense Approx. $118 million Effective Adjusted Tax Rate(2) 28% - 30% Diluted Shares Outstanding Approx. 259 million Mill Maintenance Downtime Schedule (tons in thousands) Maintenan
Slide 18: Sensitivity Analysis
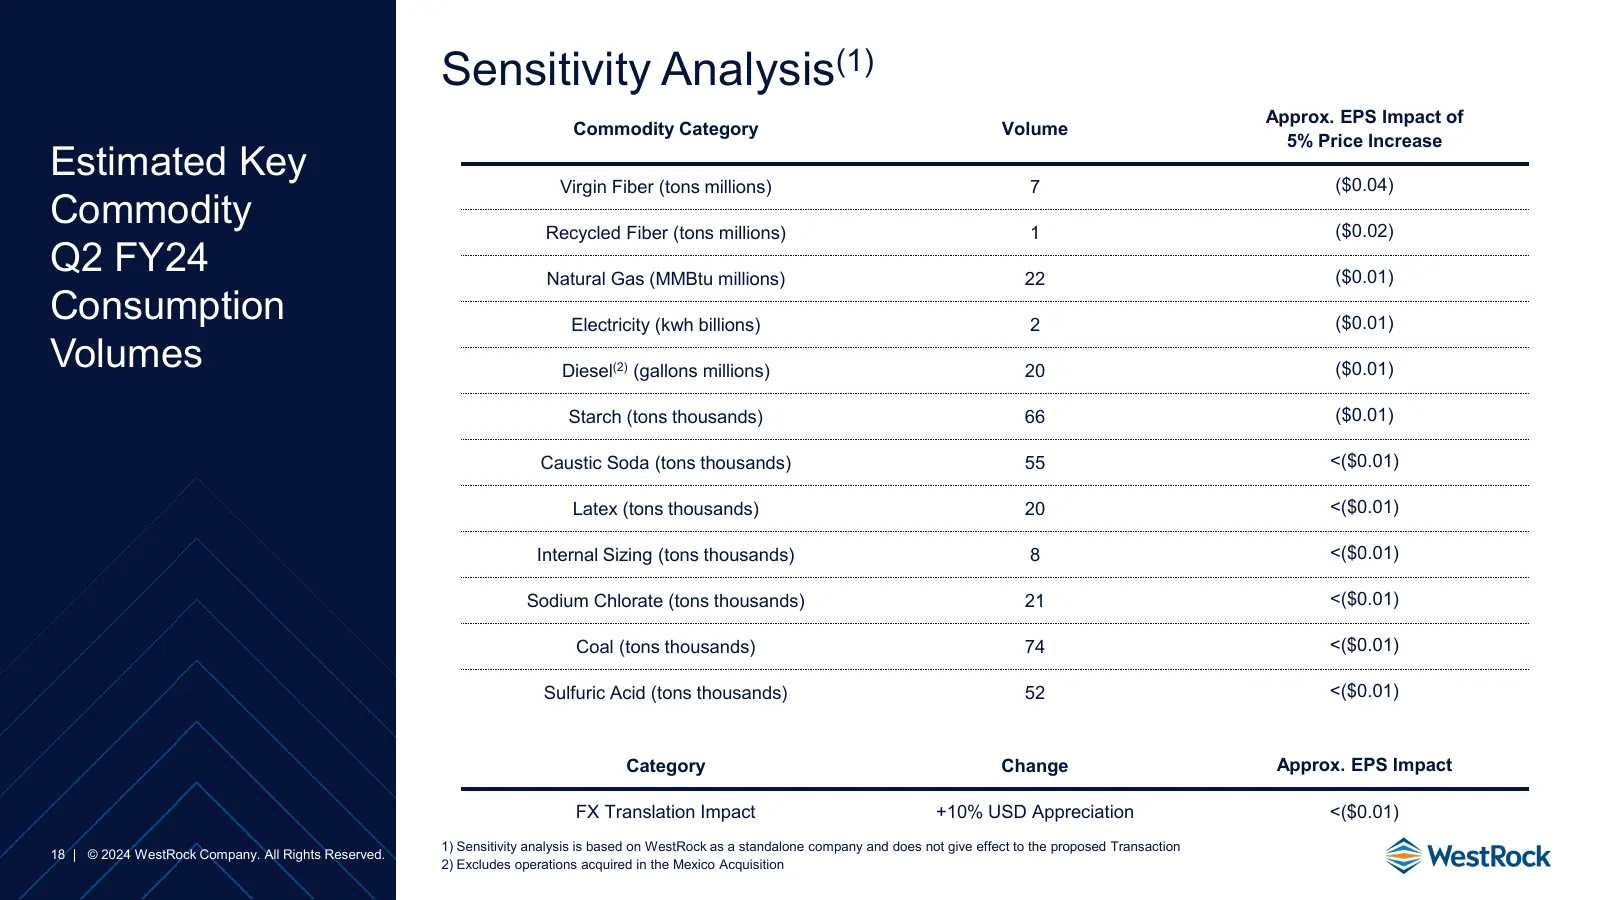
Sensitivity Analysis(1) Approx. EPS Impact of Commodity Category Volume 5% Price Increase Estimated Key Virgin Fiber (tons millions) 7 ($0.04) Commodity Recycled Fiber (tons millions) 1 ($0.02) Q2 FY24 Natural Gas (MMBtu millions) 22 ($0.01) Consumption Electricity (kwh billions) 2 ($0.01) Volumes D
Slide 19: Shipment Data
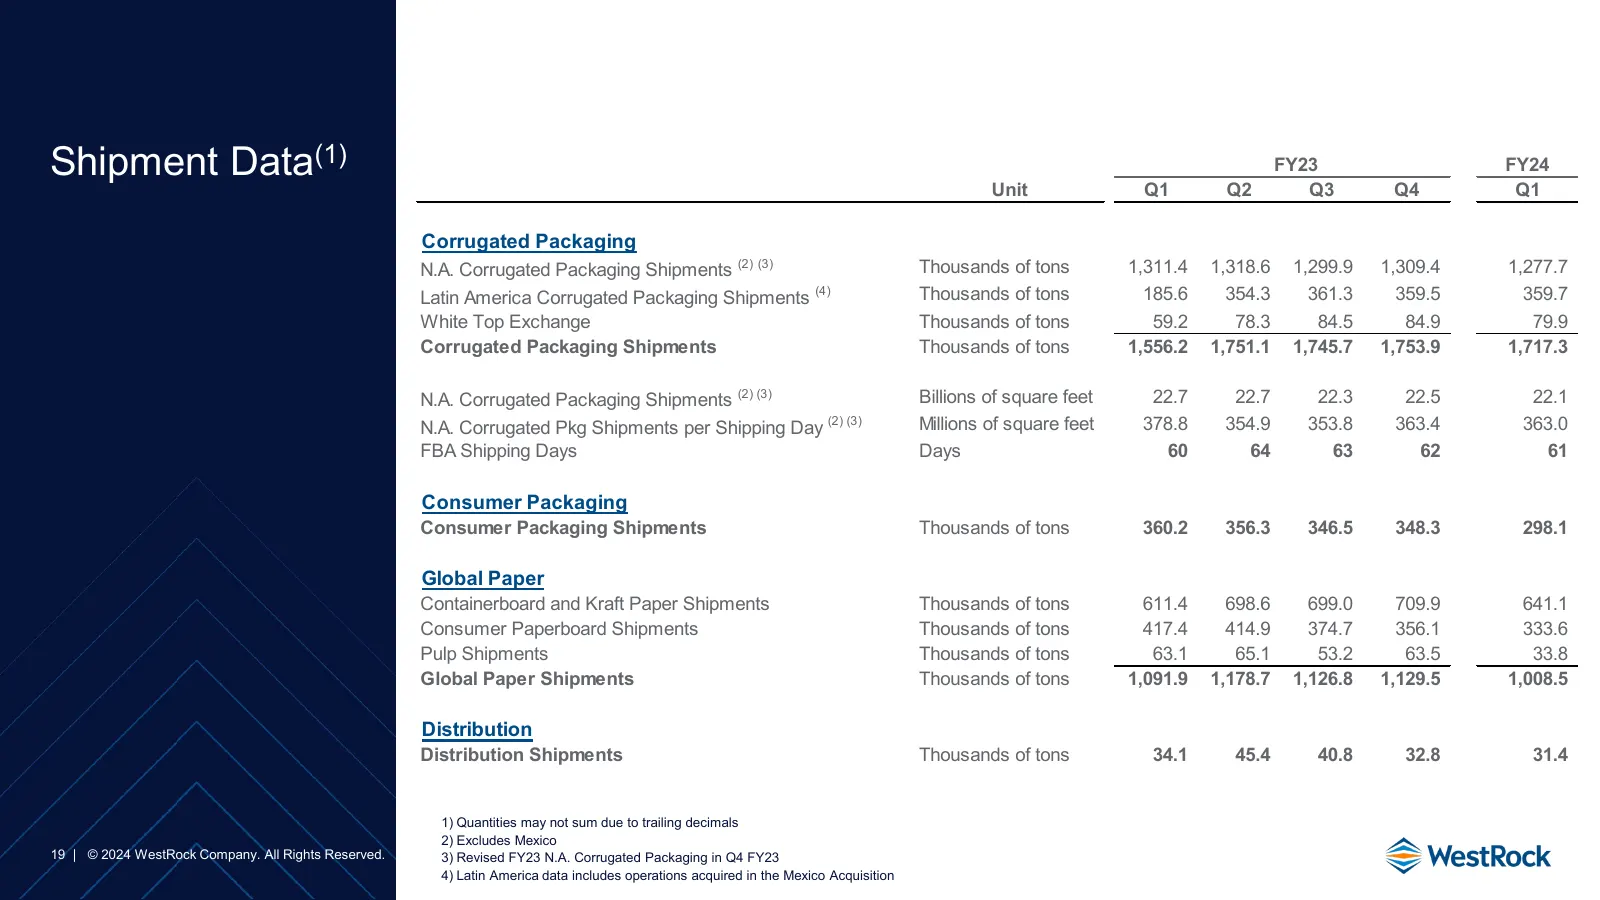
Shipment Data(1) FY23 FY24 Unit Q1 Q2 Q3 Q4 Q1 Corrugated Packaging N.A. Corrugated Packaging Shipments (2) (3) Thousands of tons 1,311.4 1,318.6 1,299.9 1,309.4 1,277.7 Latin America Corrugated Packaging Shipments (4) Thousands of tons 185.6 354.3 361.3 359.5 359.7 White Top Exchange Thousands of t
Slide 20: Non-GAAP Financial Measures
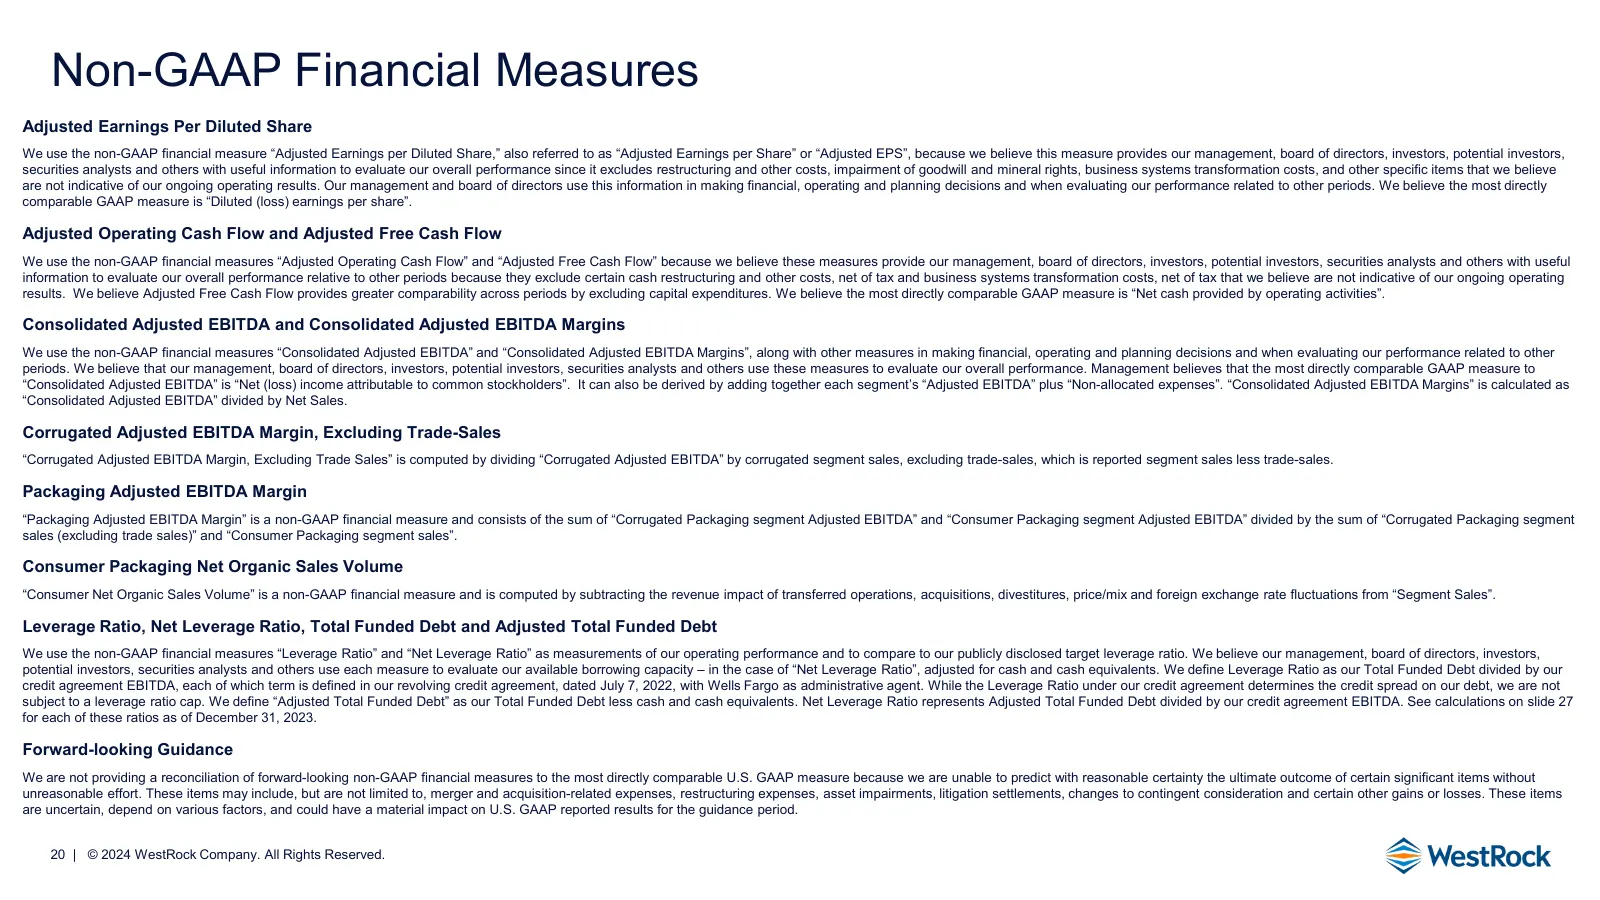
Non-GAAP Financial Measures Adjusted Earnings Per Diluted Share We use the non-GAAP financial measure “Adjusted Earnings per Diluted Share,” also referred to as “Adjusted Earnings per Share” or “Adjusted EPS”, because we believe this measure provides our management, board of directors, investors, po
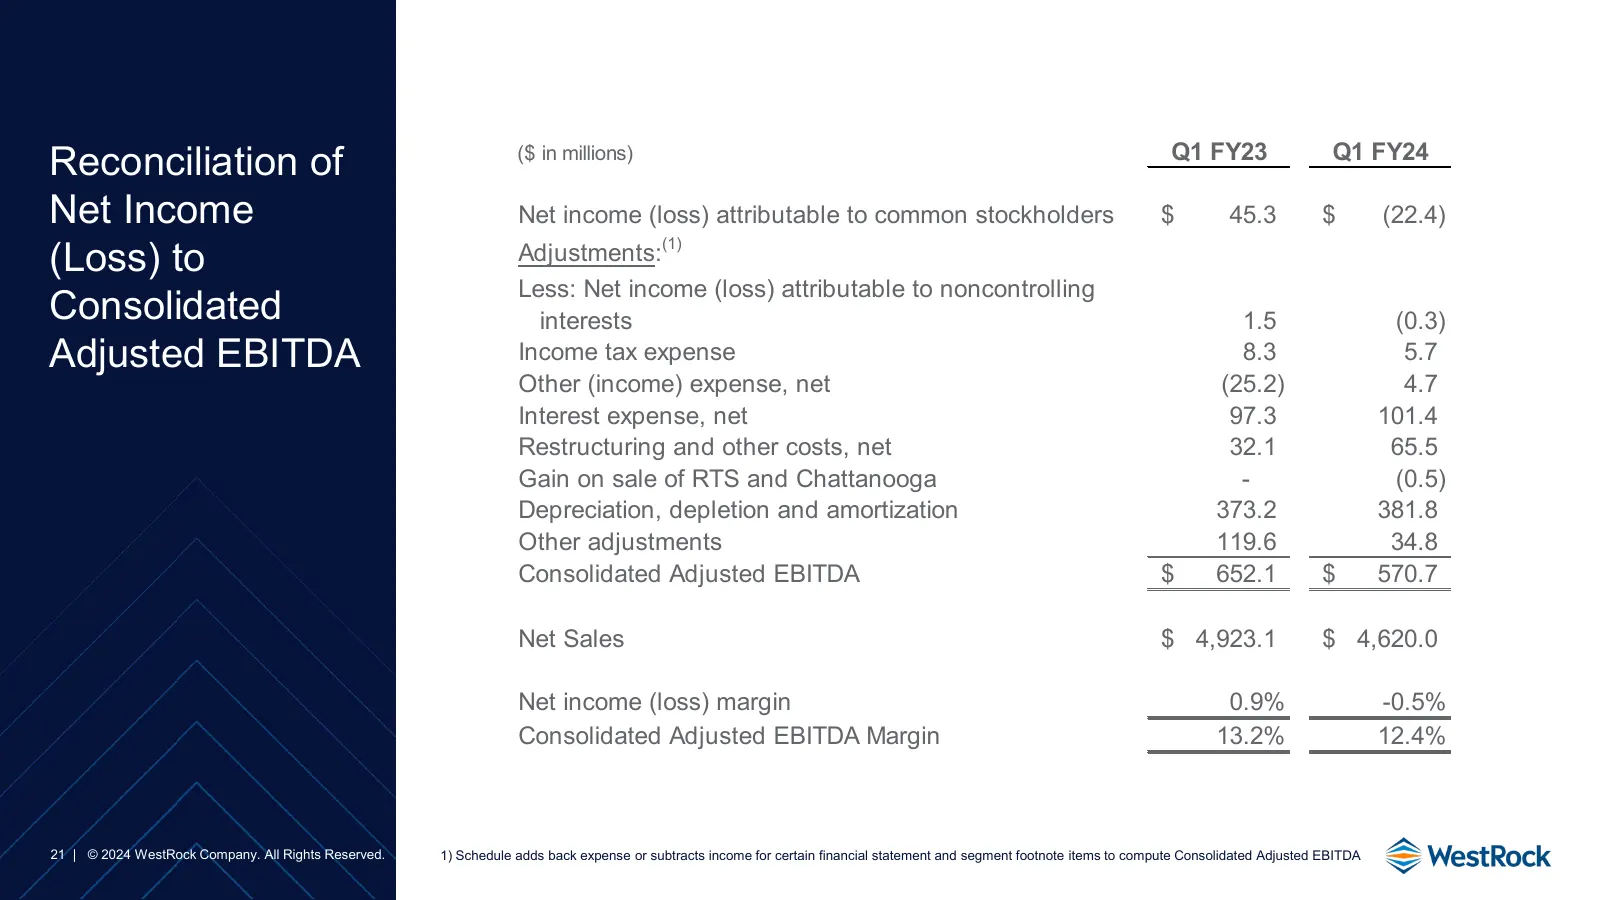
Slide 21: Reconciliation of Net Income (Loss) to Consolidated Adjusted EBITDA
Reconciliation of ($ in millions) Q1 FY23 Q1 FY24 Net Income Net income (loss) attributable to common stockholders $ 45.3 $ (22.4) (Loss) to (1) Adjustments: Less: Net income (loss) attributable to noncontrolling Consolidated interests 1.5 (0.3) Adjusted EBITDA Income tax expense 8.3 5.7 Other (inco
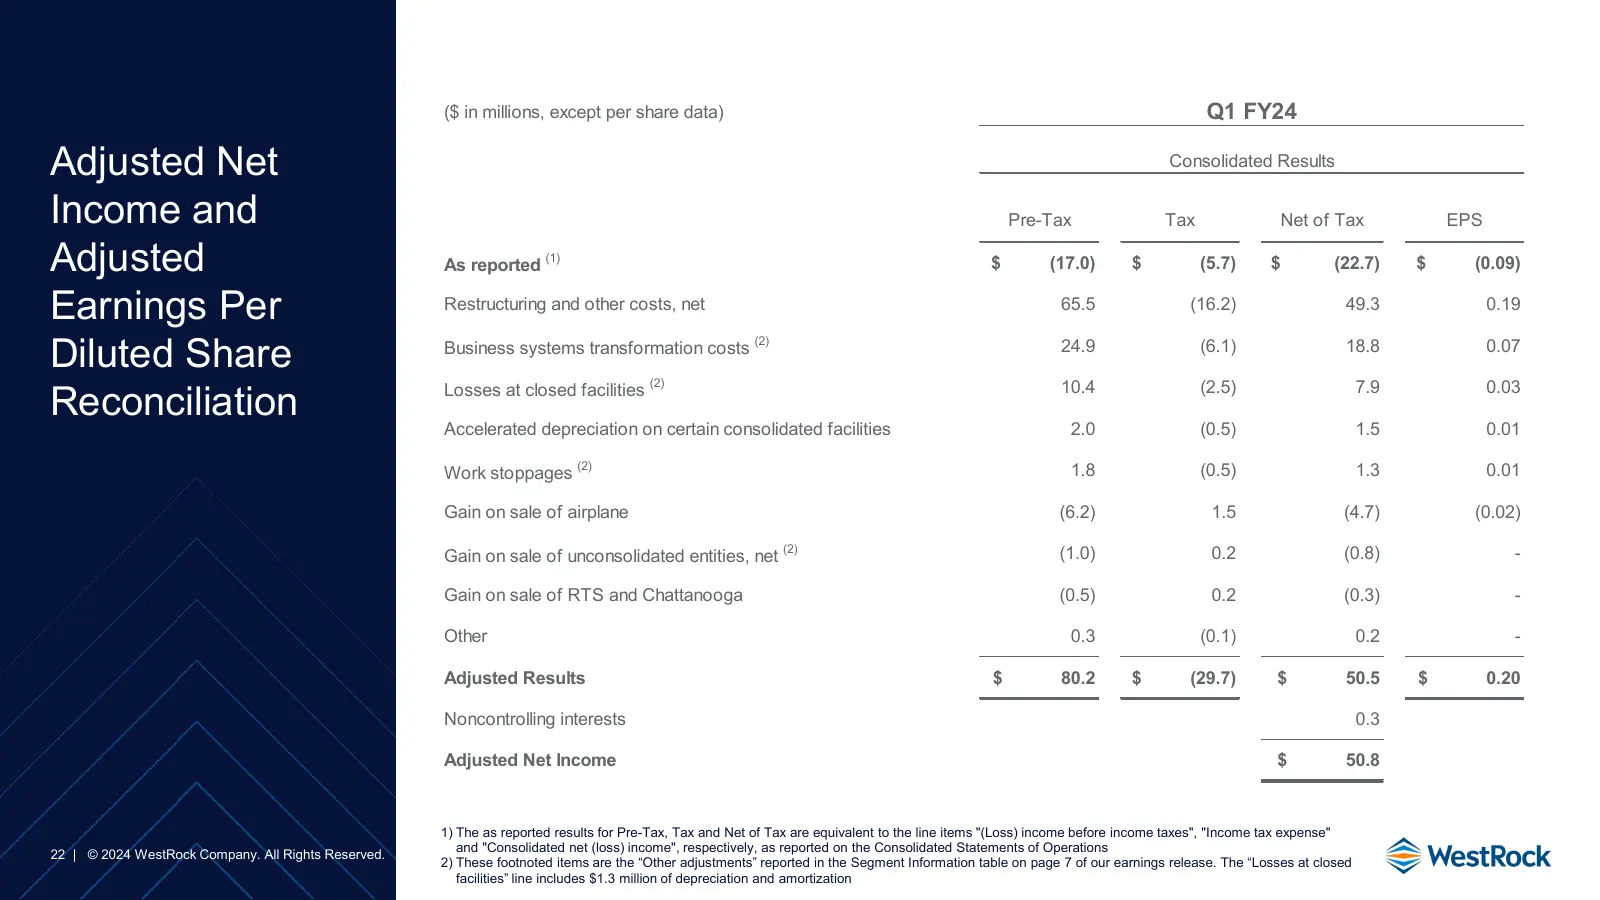
Slide 22: Adjusted Net Income and Adjusted Earnings Per Diluted Share Reconciliation
($ in millions, except per share data) Q1 FY24 Adjusted Net Consolidated Results Income and Pre-Tax Tax Net of Tax EPS Adjusted As reported (1) $ (17.0) $ (5.7) $ (22.7) $ (0.09) Earnings Per Restructuring and other costs, net 65.5 (16.2) 49.3 0.19 Diluted Share (2) Business systems transformation c
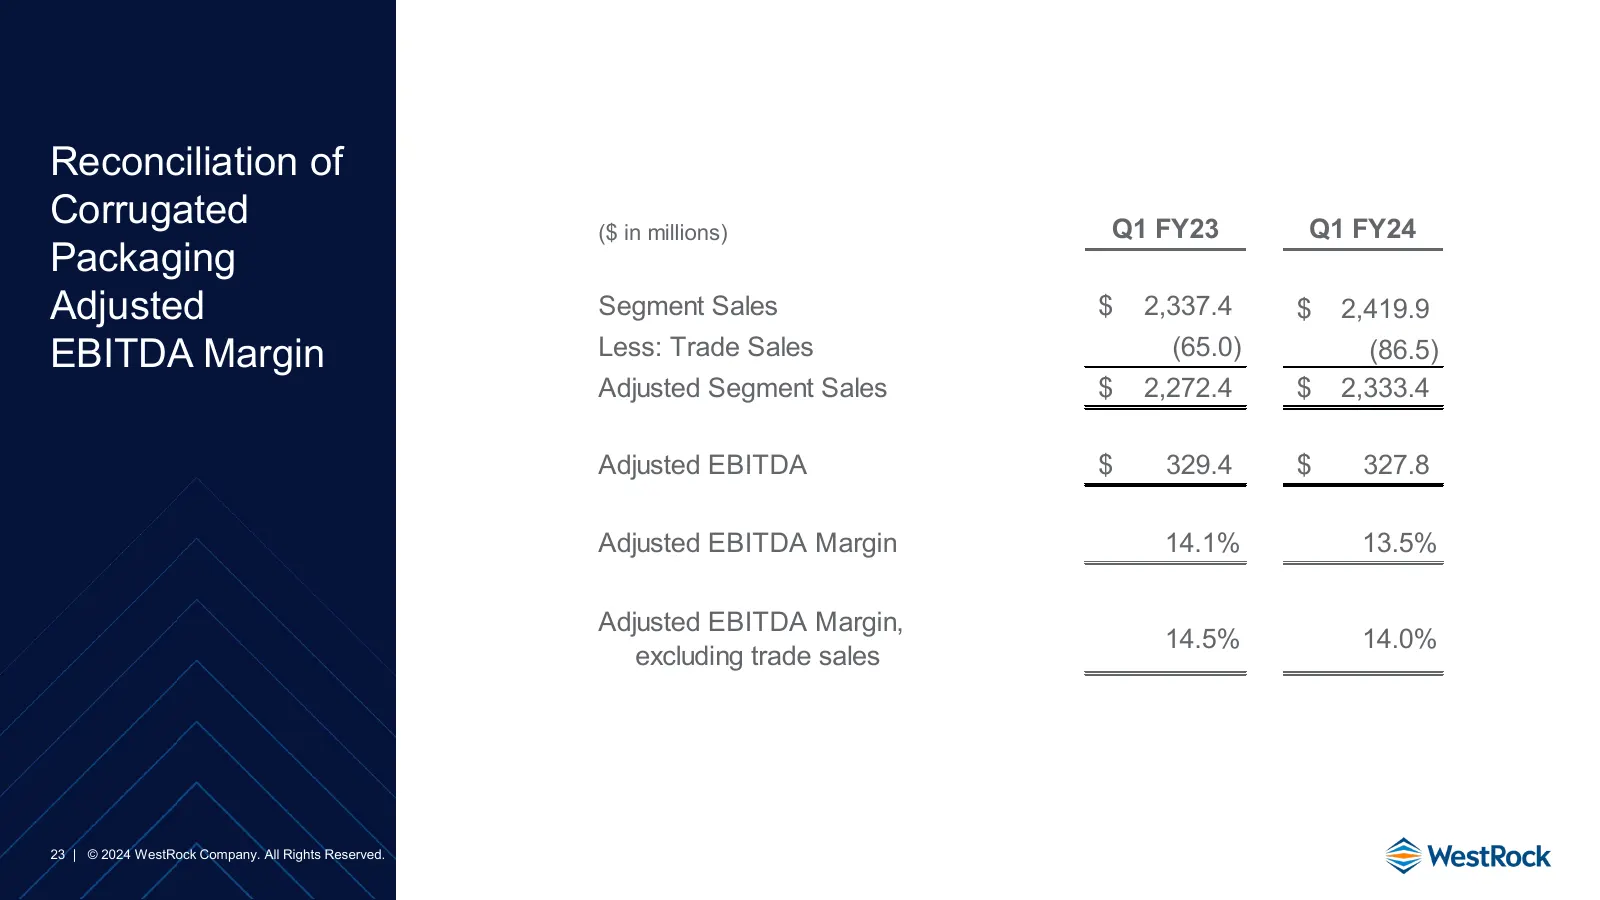
Slide 23: Reconciliation of Corrugated Packaging Adjusted EBITDA Margin
Reconciliation of Corrugated ($ in millions) Q1 FY23 Q1 FY24 Packaging Adjusted Segment Sales $ 2,337.4 $ 2,419.9 EBITDA Margin Less: Trade Sales (65.0) (86.5) Adjusted Segment Sales $ 2,272.4 $ 2,333.4 Adjusted EBITDA $ 329.4 $ 327.8 Adjusted EBITDA Margin 14.1% 13.5% Adjusted EBITDA Margin, 14.5%
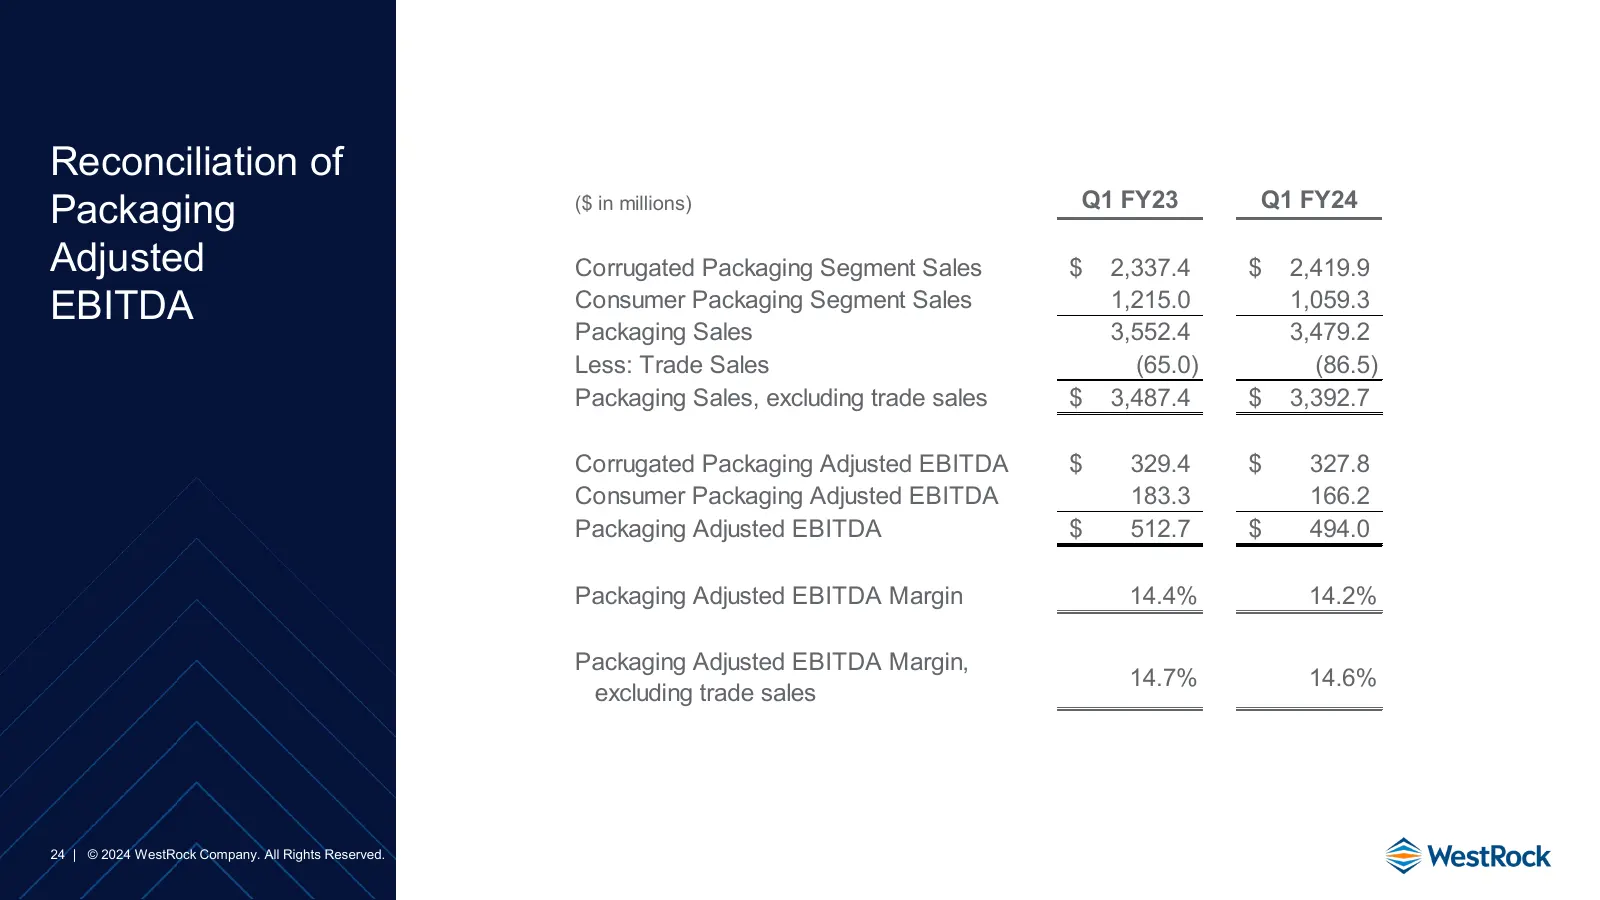
Slide 24: Reconciliation of Packaging Adjusted EBITDA
Reconciliation of Packaging ($ in millions) Q1 FY23 Q1 FY24 Adjusted Corrugated Packaging Segment Sales $ 2,337.4 $ 2,419.9 EBITDA Consumer Packaging Segment Sales 1,215.0 1,059.3 Packaging Sales 3,552.4 3,479.2 Less: Trade Sales (65.0) (86.5) Packaging Sales, excluding trade sales $ 3,487.4 $ 3,392
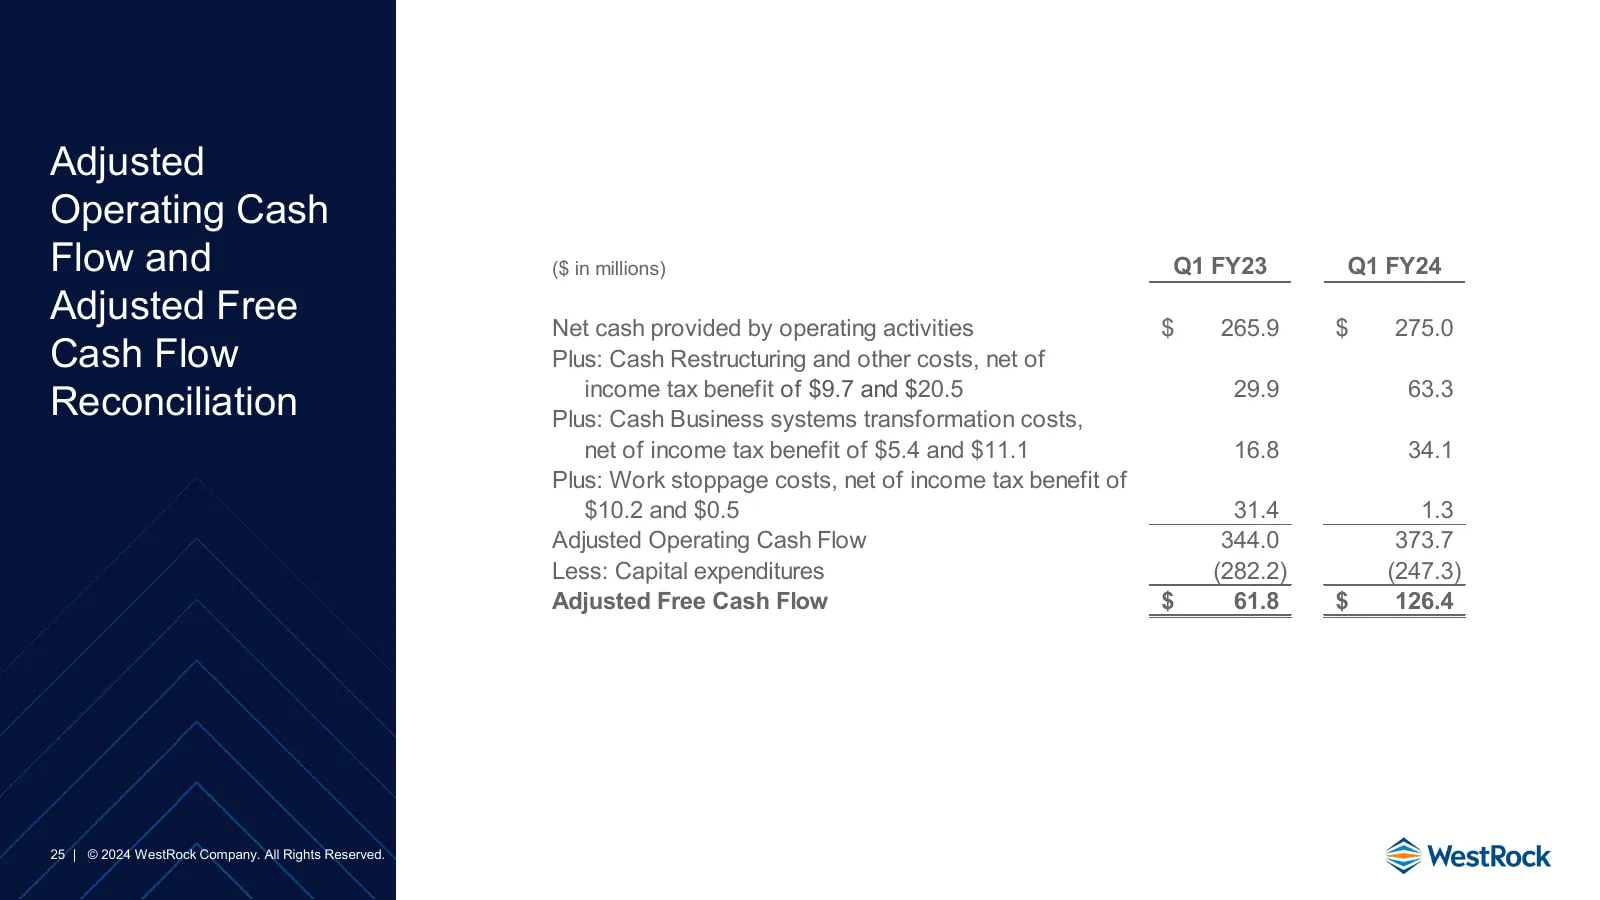
Slide 25: Adjusted Operating Cash Flow and Adjusted Free Cash Flow Reconciliation
Adjusted Operating Cash Flow and ($ in millions) Q1 FY23 Q1 FY24 Adjusted Free Net cash provided by operating activities $ 265.9 $ 275.0 Cash Flow Plus: Cash Restructuring and other costs, net of income tax benefit of $9.7 and $20.5 29.9 63.3 Reconciliation Plus: Cash Business systems transformation
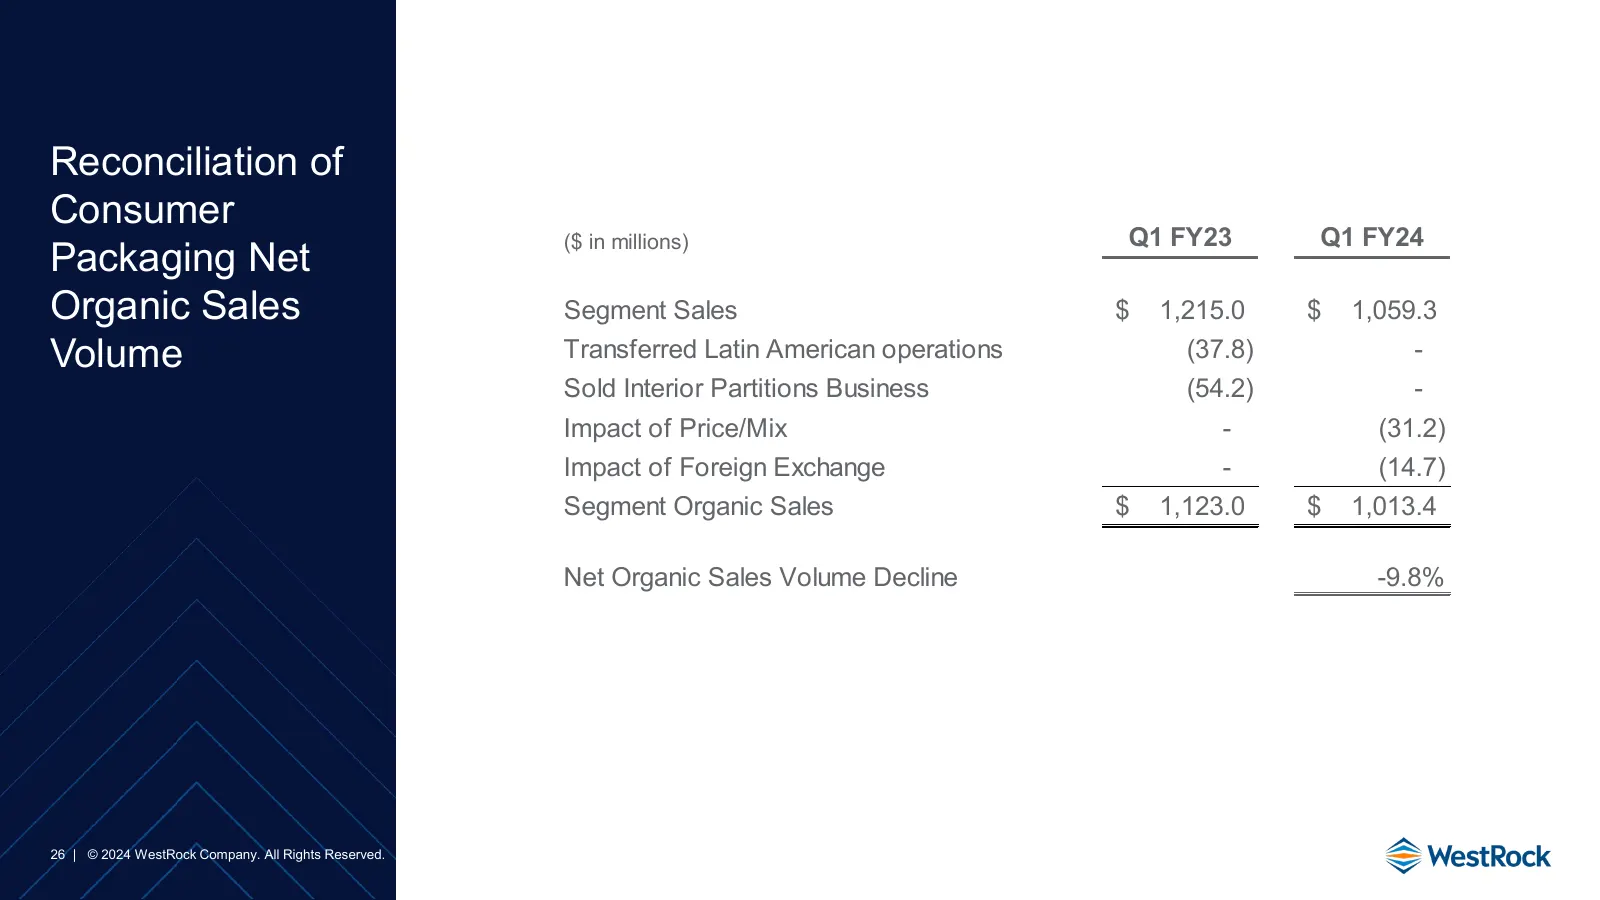
Slide 26: Reconciliation of Consumer Packaging Net Organic Sales Volume
Reconciliation of Consumer ($ in millions) Q1 FY23 Q1 FY24 Packaging Net Organic Sales Segment Sales $ 1,215.0 $ 1,059.3 Volume Transferred Latin American operations (37.8) - Sold Interior Partitions Business (54.2) - Impact of Price/Mix - (31.2) Impact of Foreign Exchange - (14.7) Segment Organic S
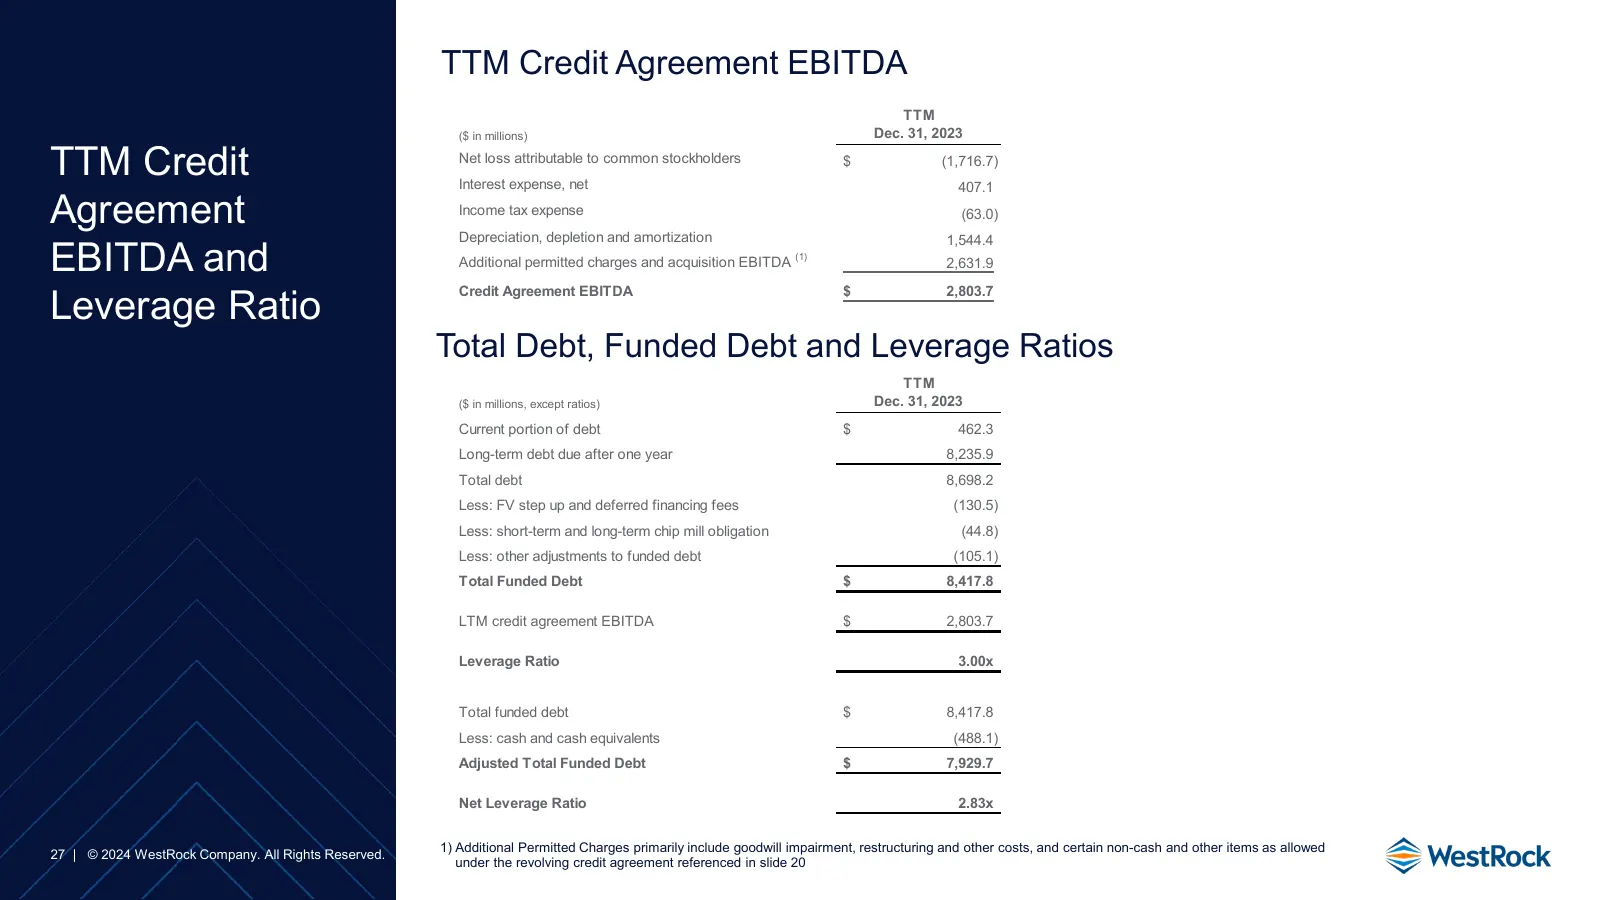
Slide 27: TTM Credit Agreement EBITDA and Leverage Ratio
TTM Credit Agreement EBITDA TTM ($ in millions) Dec. 31, 2023 TTM Credit Net loss attributable to common stockholders Interest expense, net $ (1,716.7) 407.1 Agreement Income tax expense Depreciation, depletion and amortization (63.0) EBITDA and 1,544.4 (1) Additional permitted charges and acquisiti

Slide 28: 28 | © 2024 WestRock Company. All Rights Reserved.
28 | © 2024 WestRock Company. All Rights Reserved.
Source: company website
More decks from WestRock Co
 Q2 FY2024 Earnings Presentation24 slides · May 2, 2024
 Q4 2023 Earnings Presentation28 slides · Nov 9, 2023
 Q3 FY2023 Earnings Presentation28 slides · Aug 3, 2023
 Q2 FY2023 Earnings Presentation29 slides · May 4, 2023
 Q1 FY23 Earnings Presentation21 slides · Mar 1, 2023
 Q1 FY23 Earnings Presentation26 slides · Feb 1, 2023