SI Financial — Shareholder Meeting (May 2012)
26 slides from SI Financial's shareholder meeting presentation, May 9, 2012
Slide 1: Annual Meeting May 9, 2012
Annual Meeting May 9, 2012
Slide 2: Forward Looking Statements
Forward Looking Statements 2 This presentation contains forward - looking statements, which can be identified by the use of words such as “believes,” “expects, ” “anticipates,” “estimates” or similar expressions. These forward - looking statements include, but are not limited to: statements of our
Slide 3: Market Summary as of 4/25/12
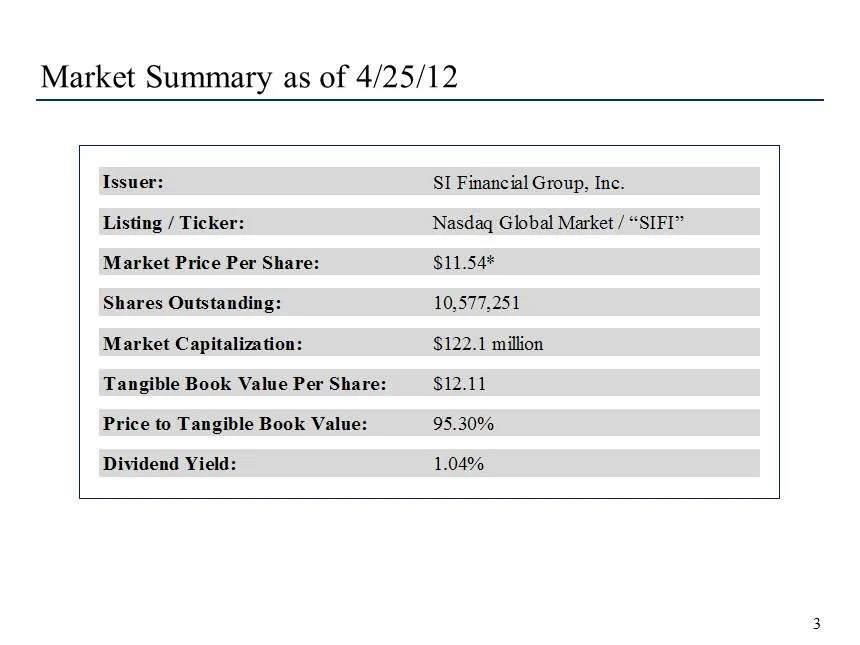
3 Market Summary as of 4/25/12 Issuer: SI Financial Group, Inc. Listing / Ticker: Nasdaq Global Market / “SIFI” Market Price Per Share: $11.54* Shares Outstanding: 10,577,251 Market Capitalization: $122.1 million Tangible Book Value Per Share: $12.11 Price to Tangible Book Value: 95.30% Dividend Yie
Slide 4: Company Overview
Company Overview
Slide 5: Company Profile
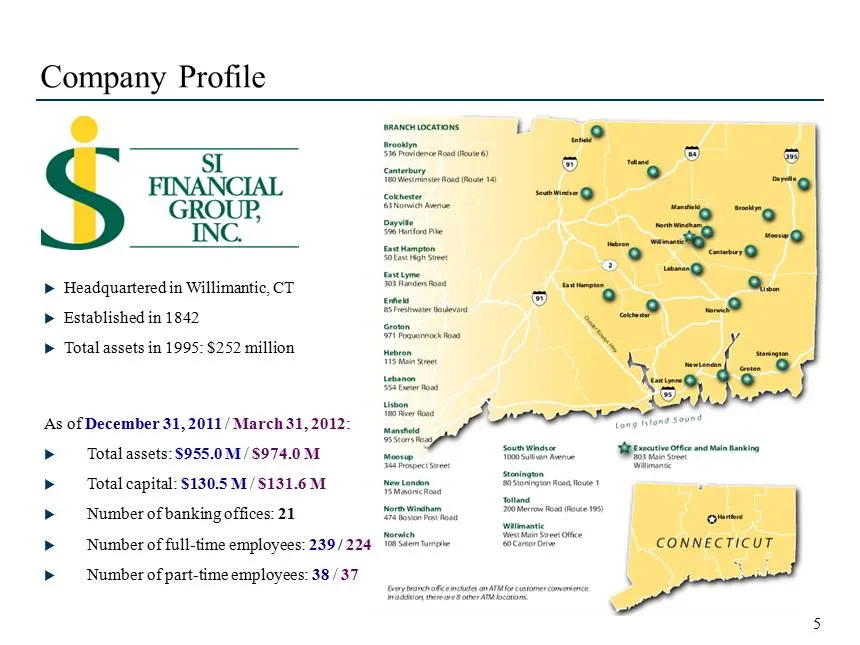
Company Profile 5 Headquartered in Willimantic, CT Established in 1842 Total assets in 1995: $252 million As of December 31, 2011 / March 31, 2012 : Total assets: $955.0 M / $974.0 M Total capital: $130.5 M / $131.6 M Number of banking offices: 21 Number of full - time employees: 239 /
Slide 6: Experienced Management Team
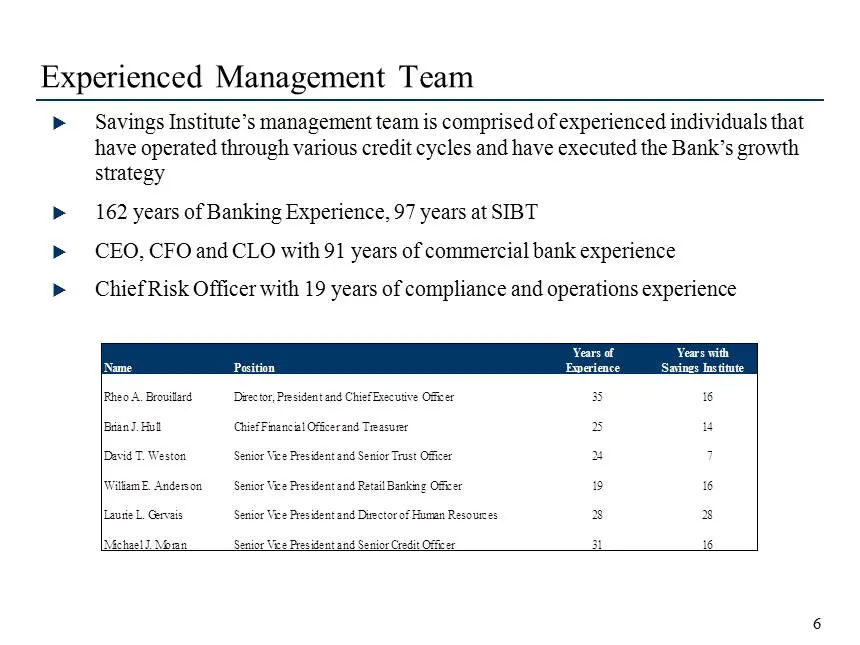
Experienced Management Team 6 Savings Institute’s management team is comprised of experienced individuals that have operated through various credit cycles and have executed the Bank’s growth strategy 162 years of Banking Experience, 97 years at SIBT CEO, CFO and CLO with 91 years of commercial
Slide 7: Market Area Overview
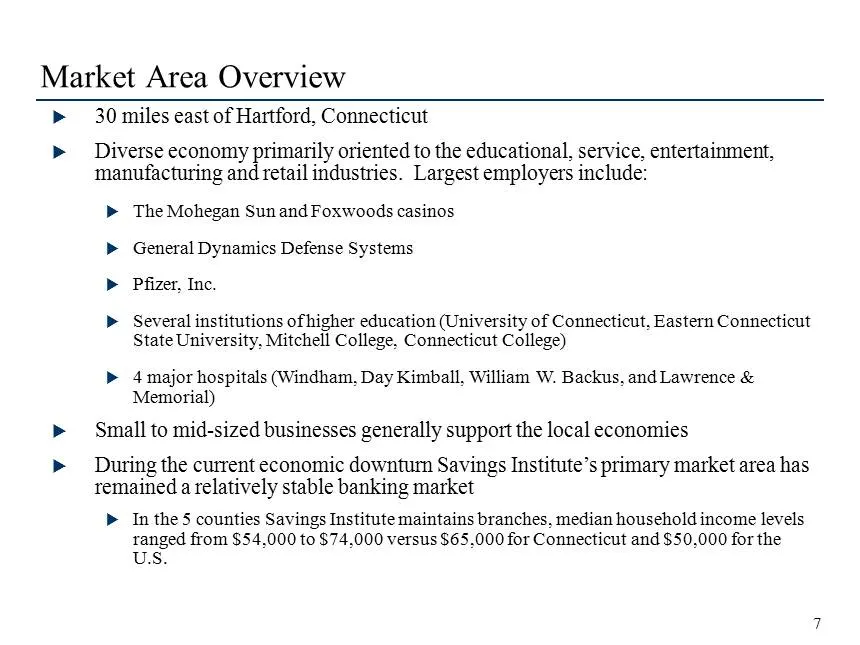
Market Area Overview 7 30 miles east of Hartford, Connecticut Diverse economy primarily oriented to the educational, service, entertainment, manufacturing and retail industries. Largest employers include: The Mohegan Sun and Foxwoods casinos General Dynamics Defense Systems Pfizer, Inc.
Slide 8: Market Area Presence
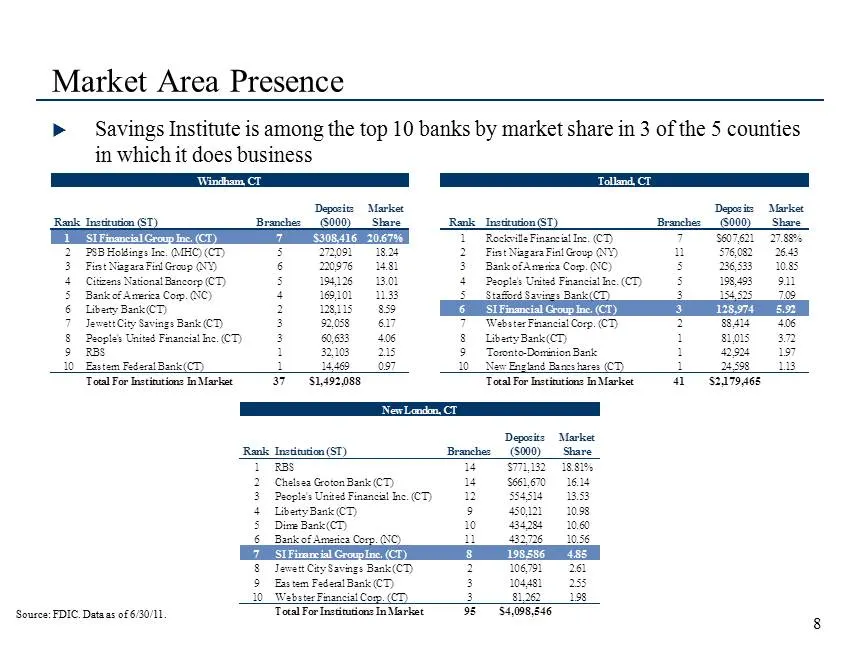
Market Area Presence 8 Savings Institute is among the top 10 banks by market share in 3 of the 5 counties in which it does business Source: FDIC. Data as of 6/30/11. Rank Institution (ST) Branches Deposits ($000) Market Share Rank Institution (ST) Branches Deposits ($000) Market Share 1 SI Financi
Slide 9: Business Strategy
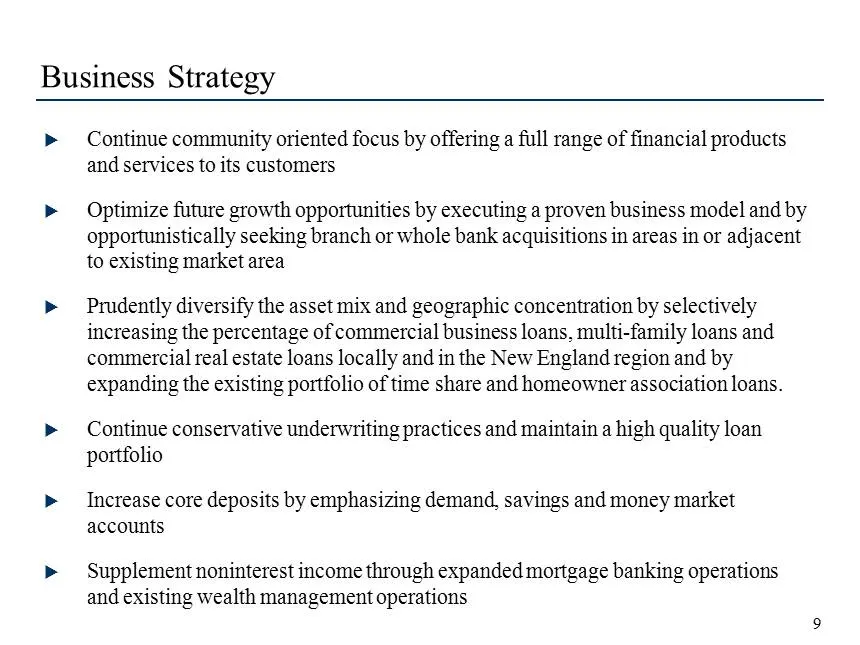
Business Strategy 9 Continue community oriented focus by offering a full range of financial products and services to its customers Optimize future growth opportunities by executing a proven business model and by opportunistically seeking branch or whole bank acquisitions in areas in or adjacent
Slide 10: Financial Highlights
Financial Highlights
Slide 11: Franchise Growth
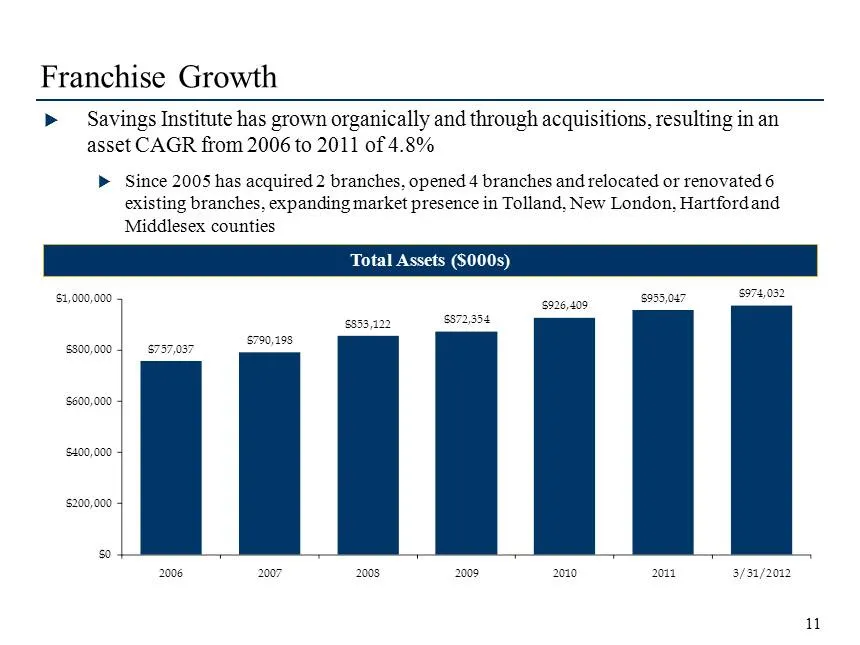
Franchise Growth 11 Savings Institute has grown organically and through acquisitions, resulting in an asset CAGR from 2006 to 2011 of 4.8% Since 2005 has acquired 2 branches, opened 4 branches and relocated or renovated 6 existing branches, expanding market presence in Tolland, New London, Hartf
Slide 12: Diversified Loan Portfolio
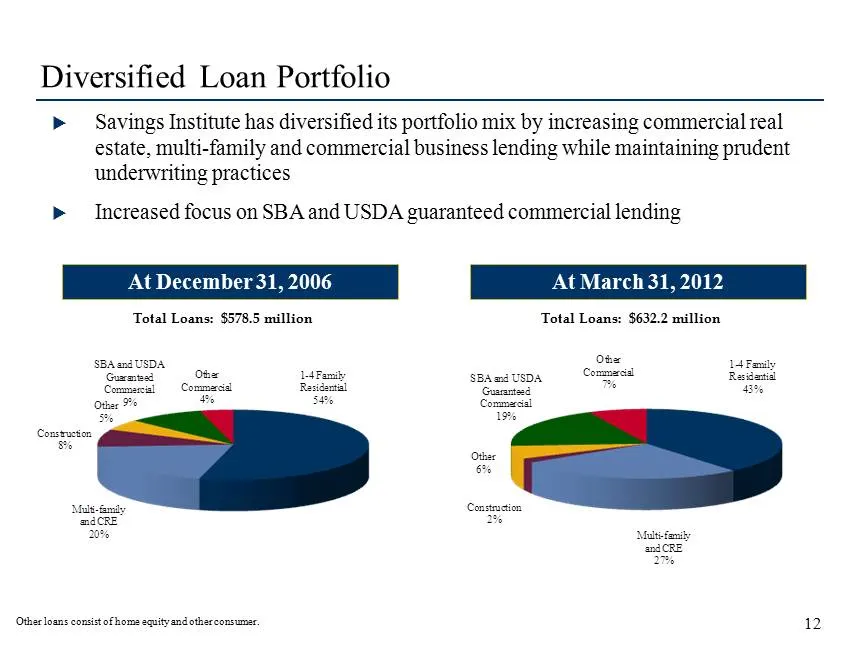
Diversified Loan Portfolio 12 Savings Institute has diversified its portfolio mix by increasing commercial real estate, multi - family and commercial business lending while maintaining prudent underwriting practices Increased focus on SBA and USDA guaranteed commercial lending At March 31, 2012
Slide 13: Commercial Loan Concentrations
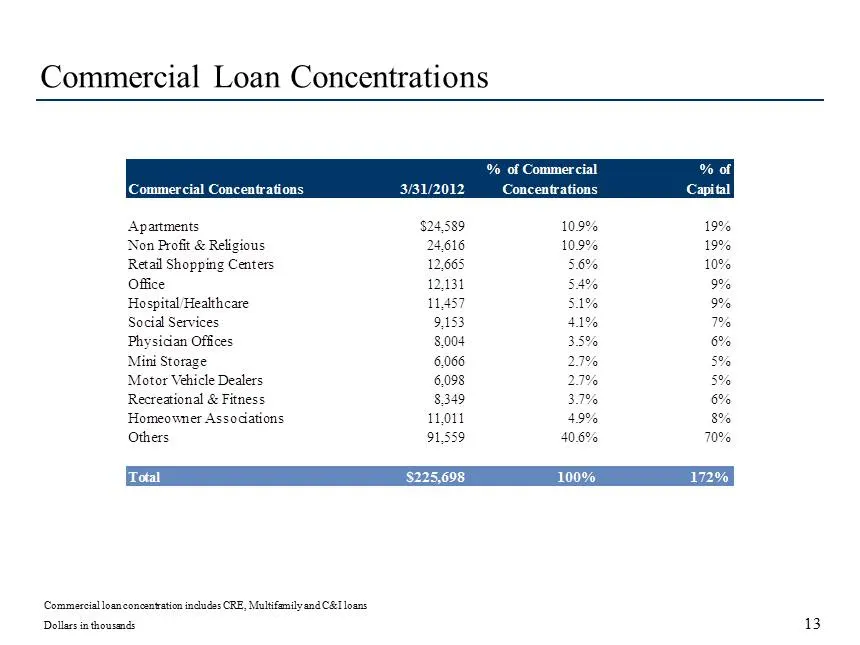
Commercial Loan Concentrations 13 Commercial loan concentration includes CRE, Multifamily and C&I loans Dollars in thousands % of Commercial % of Commercial Concentrations 3/31/2012 Concentrations Capital Apartments $24,589 10.9% 19% Non Profit & Religious 24,616 10.9% 19% Retail Shopping Centers 12
Slide 14: Asset Quality Trends
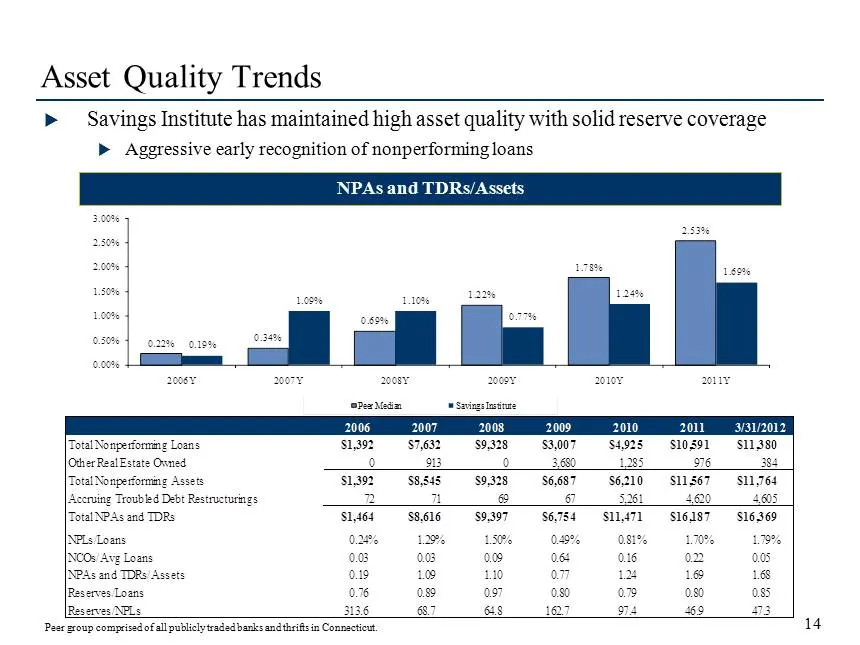
Asset Quality Trends 14 Savings Institute has maintained high asset quality with solid reserve coverage Aggressive early recognition of nonperforming loans NPAs and TDRs/Assets Peer group comprised of all publicly traded banks and thrifts in Connecticut. 0.22% 0.34% 0.69% 1.22% 1.78% 2.53% 0.19%
Slide 15: Delinquent Loans
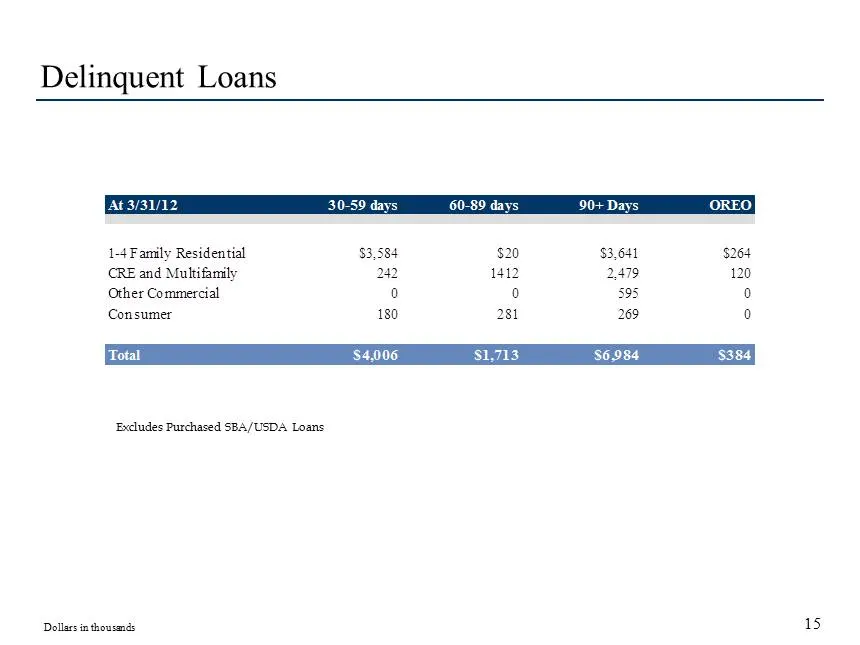
Delinquent Loans 15 Dollars in thousands Excludes Purchased SBA/USDA Loans At 3/31/12 30-59 days 60-89 days 90+ Days OREO 1-4 Family Residential $3,584 $20 $3,641 $264 CRE and Multifamily 242 1412 2,479 120 Other Commercial 0 0 595 0 Consumer 180 281 269 0 Total $4,006 $1,713 $6,984 $384
Slide 16: Securities Portfolio
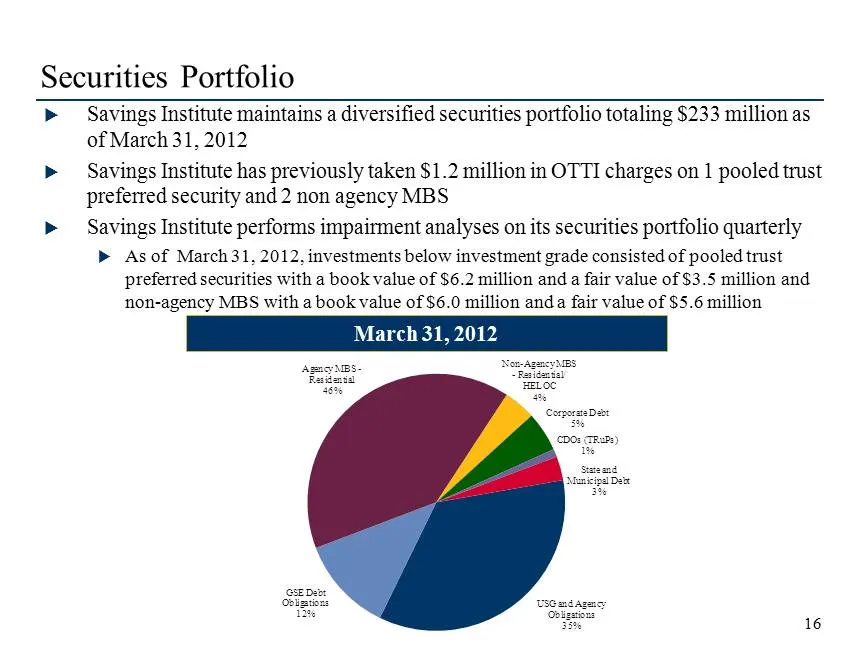
Securities Portfolio 16 Savings Institute maintains a diversified securities portfolio totaling $233 million as of March 31, 2012 Savings Institute has previously taken $1.2 million in OTTI charges on 1 pooled trust preferred security and 2 non agency MBS Savings Institute performs impairment
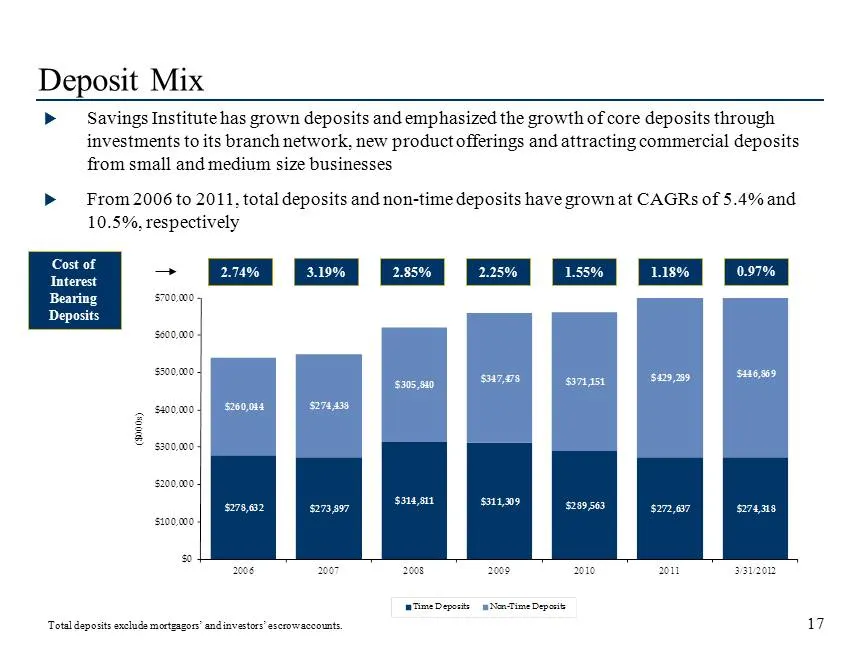
Slide 17: Deposit Mix
$278,632 $273,897 $314,811 $311,309 $289,563 $272,637 $274,318 $260,044 $274,438 $305,840 $347,478 $371,151 $429,289 $446,869 $0 $100,000 $200,000 $300,000 $400,000 $500,000 $600,000 $700,000 2006 2007 2008 2009 2010 2011 3/31/2012 ($000s) Time Deposits Non - Time Deposits Deposit Mix 17 Savings I
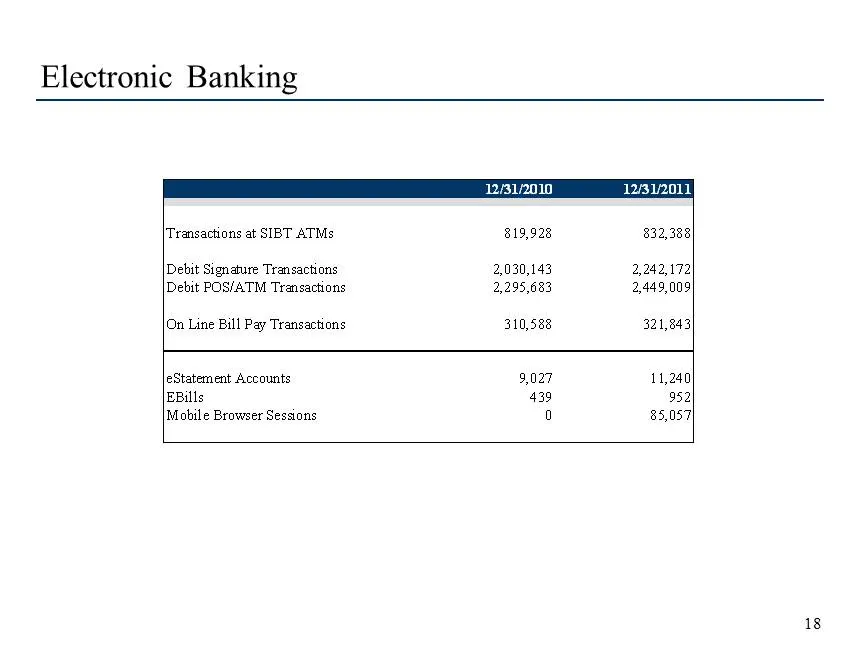
Slide 18: Electronic Banking
Electronic Banking 18 12/31/2010 12/31/2011 Transactions at SIBT ATMs 819,928 832,388 Debit Signature Transactions 2,030,143 2,242,172 Debit POS/ATM Transactions 2,295,683 2,449,009 On Line Bill Pay Transactions 310,588 321,843 eStatement Accounts 9,027 11,240 EBills 439 952 Mobile Browser Sessions
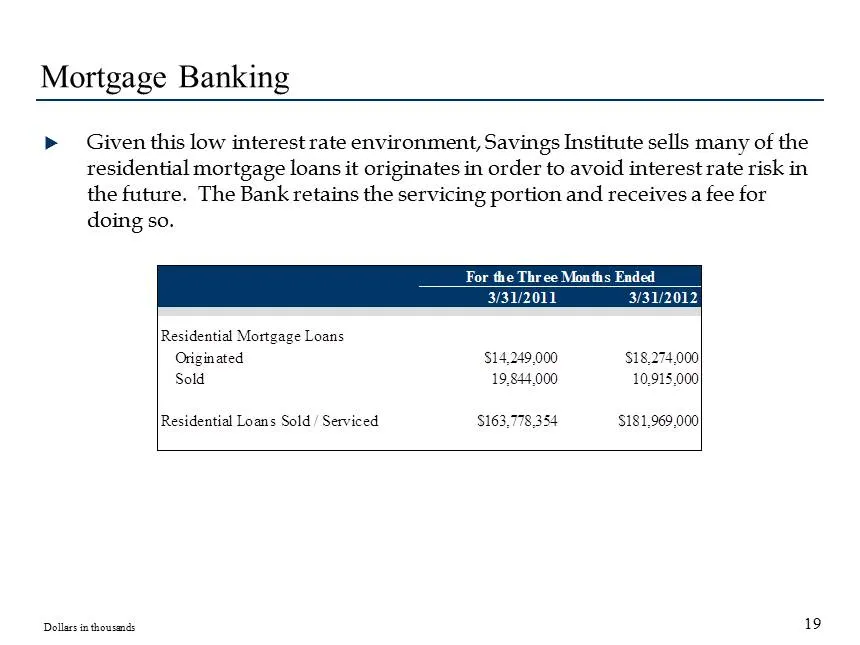
Slide 19: Mortgage Banking
Mortgage Banking 19 Dollars in thousands Given this low interest rate environment, Savings Institute sells many of the residential mortgage loans it originates in order to avoid interest rate risk in the future. The Bank retains the servicing portion and receives a fee for doing so. 3/31/2011 3/31
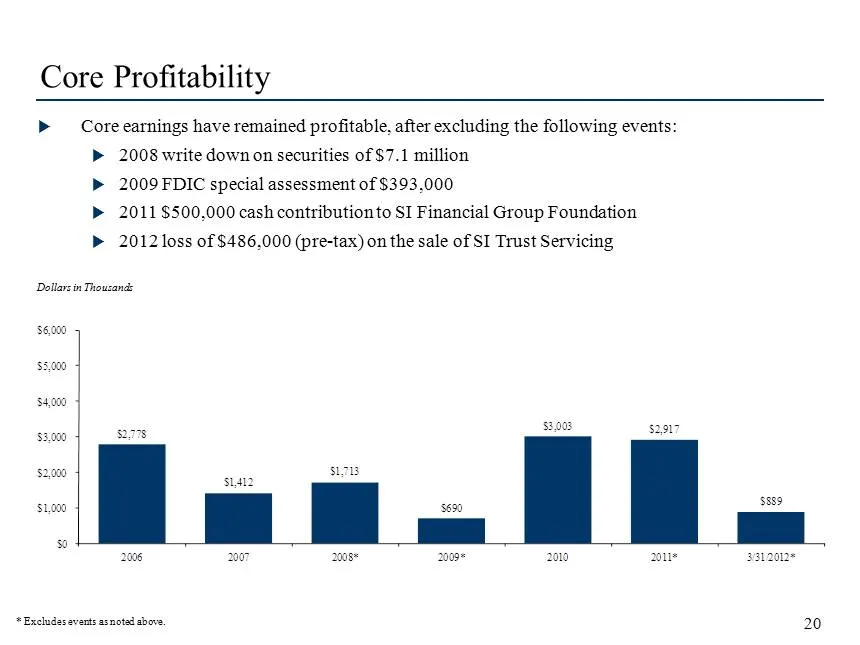
Slide 20: Core Profitability
Core Profitability 20 Core earnings have remained profitable, after excluding the following events: 2008 write down on securities of $7.1 million 2009 FDIC special assessment of $393,000 2011 $500,000 cash contribution to SI Financial Group Foundation 2012 loss of $486,000 (pre - tax) on t
Slide 21: Strong Capital Profile
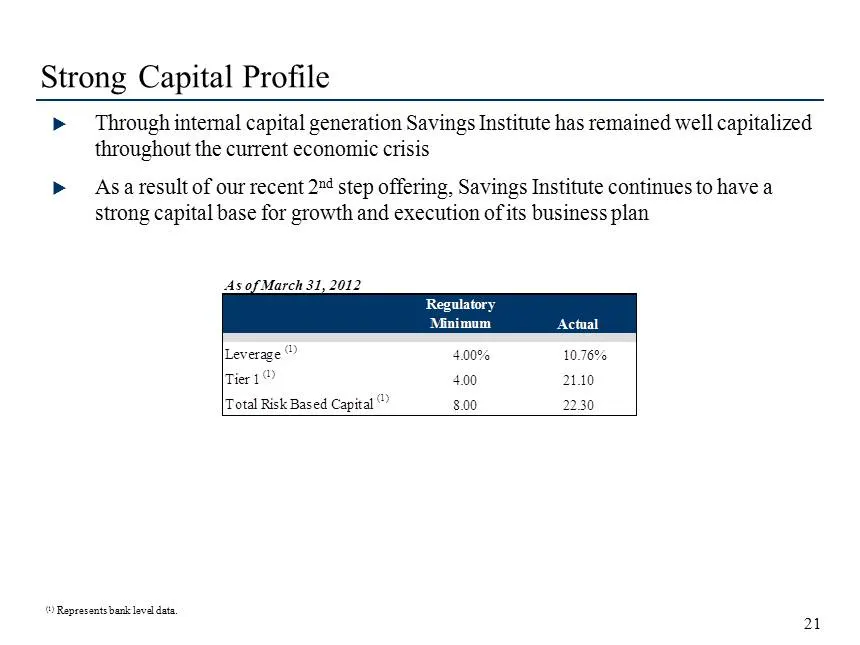
Strong Capital Profile 21 (1) Represents bank level data. Through internal capital generation Savings Institute has remained well capitalized throughout the current economic crisis As a result of our recent 2 nd step offering, Savings Institute continues to have a strong capital base for growth
Slide 22: Dividends and Buybacks
Dividends and Buybacks 22 Between March 2005 and March 2012 SI Financial has paid stockholders a total of $0.92 in quarterly dividends Quarterly dividend was suspended in January 2009 in order to preserve capital With improving earnings outlook, quarterly dividend of $0.03 reinstated in May 20
Slide 23: Investment Merits
Investment Merits Community - oriented bank with experienced management team Managed company through different credit cycles Executed various bank and non - bank acquisitions Strong asset quality track record and reserve coverage levels Strong core deposit base Diversified loan portfolio
Slide 24: Trading Multiples
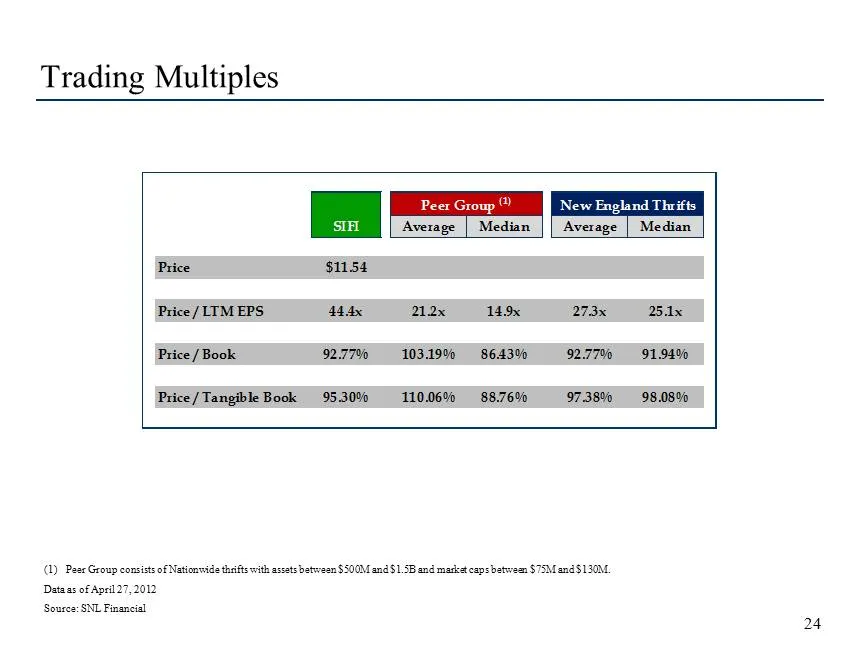
Trading Multiples 24 (1) Peer Group consists of Nationwide thrifts with assets between $500M and $1.5B and market caps between $75M and $130M. Data as of April 27, 2012 Source: SNL Financial SIFI Average Median Average Median Price $11.54 Price / LTM EPS 44.4x 21.2x 14.9x 27.3x 25.1x Price / Book 92
Slide 25: Appendix I: Non-GAAP Financial Measures
Appendix I: Non - GAAP Financial Measures
Slide 26: Non-GAAP Financial Measures
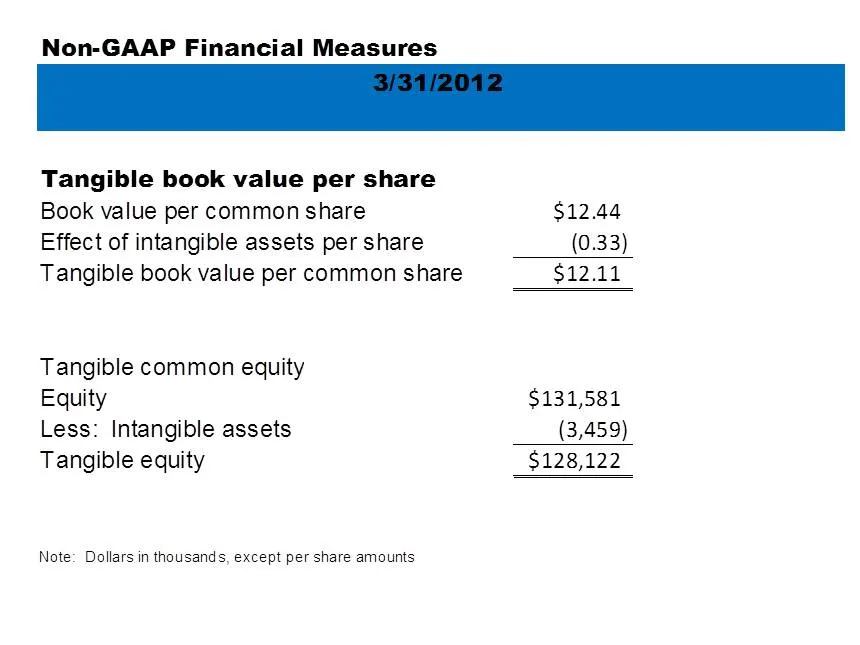
Non-GAAP Financial Measures Tangible book value per share Book value per common share Effect of intangible assets per share Tangible book value per common share Tangible common equity Equity $131,581 Less: Intangible assets (3,459) Tangible equity S$ 2 Note: Dollars in thousands, except per share am
Source: SEC EDGAR · 8-K filed May 9, 2012
More decks from SI Financial Group Inc
 Merger or Acquisition (December 2018)13 slides · Dec 11, 2018
 Investor Presentation (September 2018)18 slides · Sep 20, 2018
 Shareholder Meeting (May 2018)19 slides · May 9, 2018
 Investor Presentation (May 2017)18 slides · May 10, 2017
 Investor Presentation (May 2016)19 slides · May 11, 2016
 Shareholder Meeting (May 2015)19 slides · May 13, 2015