SI Financial — Investor Presentation (September 2018)
18 slides from SI Financial's investor presentation, Sep 20, 2018
Slide 1: Investors' Meeting September 20, 2018
Investors’ Meeting September 20, 2018
Slide 2: Forward Looking Statements
Forward Looking Statements This presentation may contain forward-looking statements, which can be identified by the use of words such as “believes,” “expects,” “anticipates,” “estimates” or similar expressions. These forward-looking statements include, but are not limited to: statements of our goa
Slide 3: Market Summary
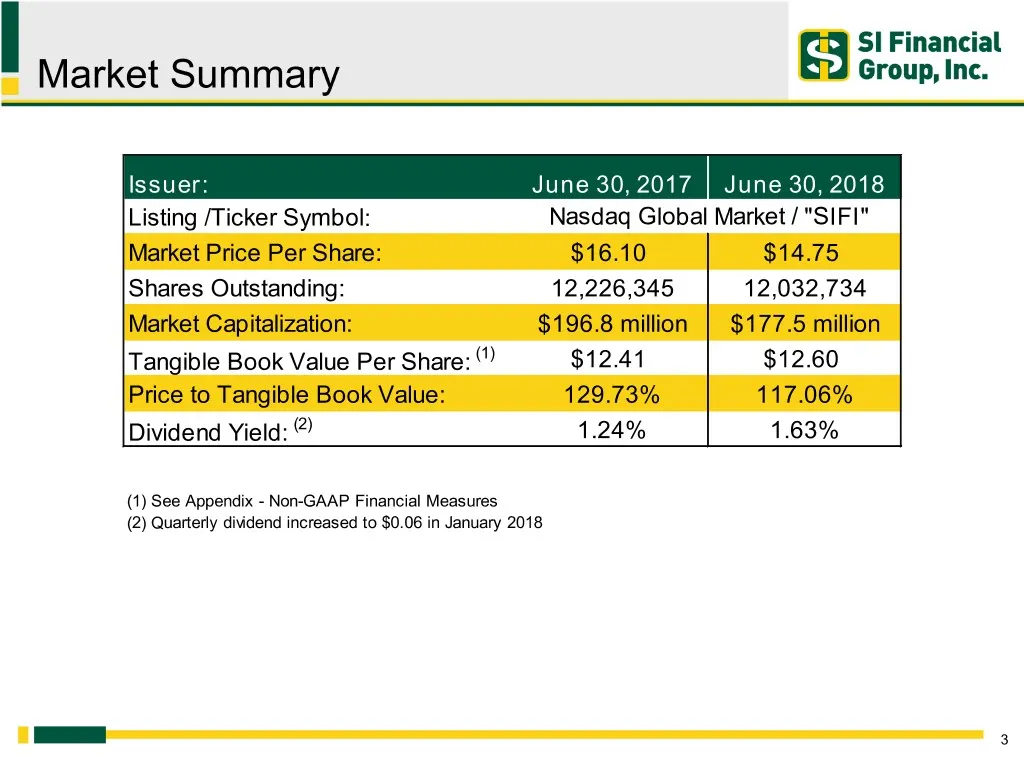
Market Summary Issuer: June 30, 2017 June 30, 2018 Listing /Ticker Symbol: Nasdaq Global Market / "SIFI" Market Price Per Share: $16.10 $14.75 Shares Outstanding: 12,226,345 12,032,734 Market Capitalization: $196.8 million $177.5 million Tangible Book Value Per Share: (1) $12.41 $12.60 Price to Tang
Slide 4: Company Overview
S SI Financial 4 Group, Inc. Company Overview
Slide 5: An Overview of SI Financial
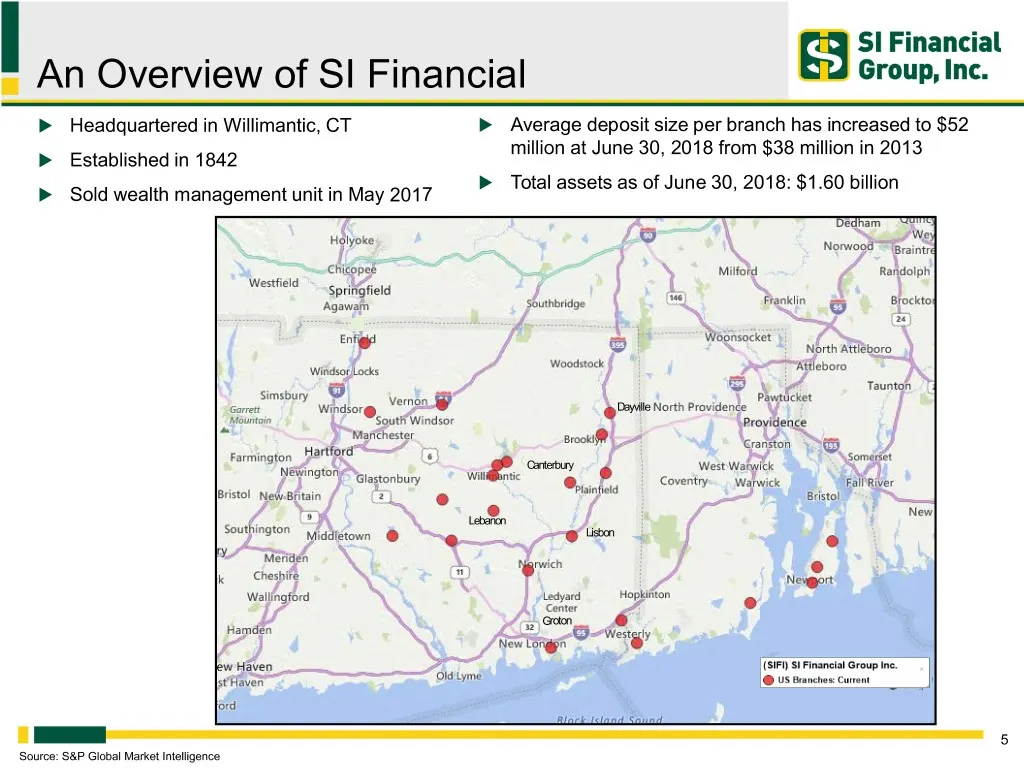
An Overview of SI Financial Headquartered in Willimantic, CT Average deposit size per branch has increased to $52 million at June 30, 2018 from $38 million in 2013 Established in 1842 Total assets as of June 30, 2018: $1.60 billion Sold wealth management unit in May 2017 Dayville Canterbur
Slide 6: Business Strategy
Business Strategy Community oriented focus with a full range of financial products and services Prudently diversify the asset mix and geographic concentration by selectively increasing the percentage of commercial business, multi-family and commercial real estate loans locally and throughout New
Slide 7: Financial Highlights
S SI Financial 4 Group, Inc. Financial Highlights
Slide 8: Improving Profitability: Core Income & Core ROAA
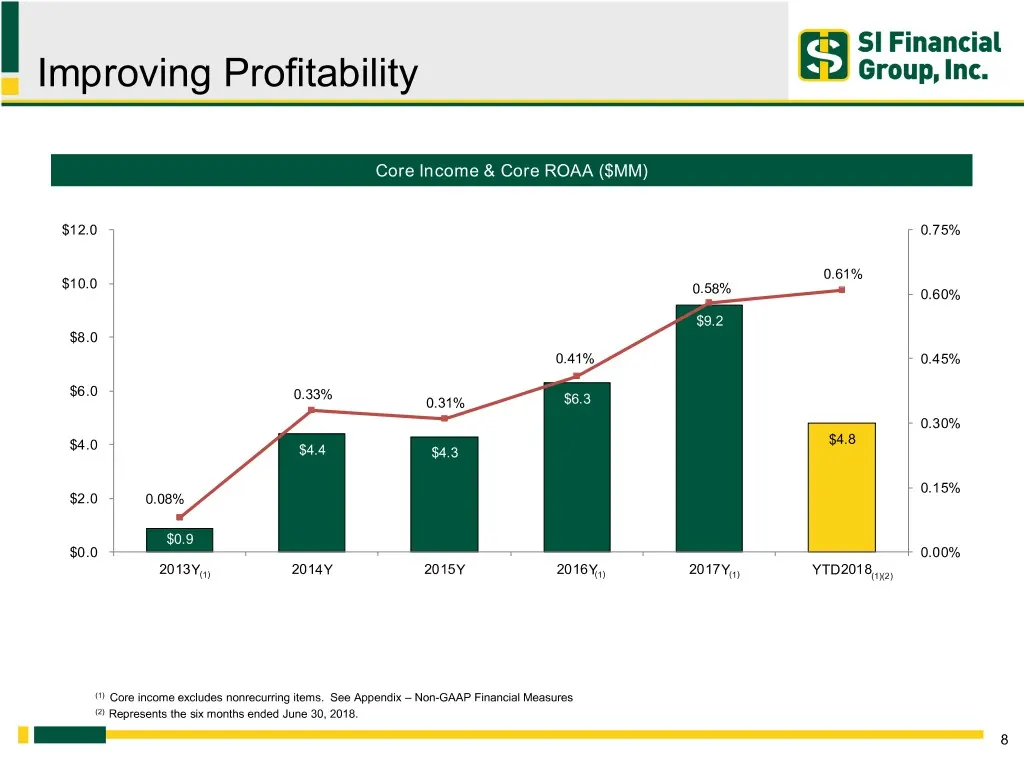
Improving Profitability Core Income & Core ROAA ($MM) $12.0 0.75% 0.61% $10.0 0.58% 0.60% $9.2 $8.0 0.41% 0.45% $6.0 0.33% 0.31% $6.3 0.30% $4.0 $4.8 $4.4 $4.3 0.15% $2.0 0.08% $0.9 $0.0 0.00% 2013Y(1) 2014Y 2015Y 2016Y(1) 2017Y(1) YTD2018(1)(2) (1) Core income excludes nonrecurring items. See Appen
Slide 9: Improving Profitability: Net Interest Margin
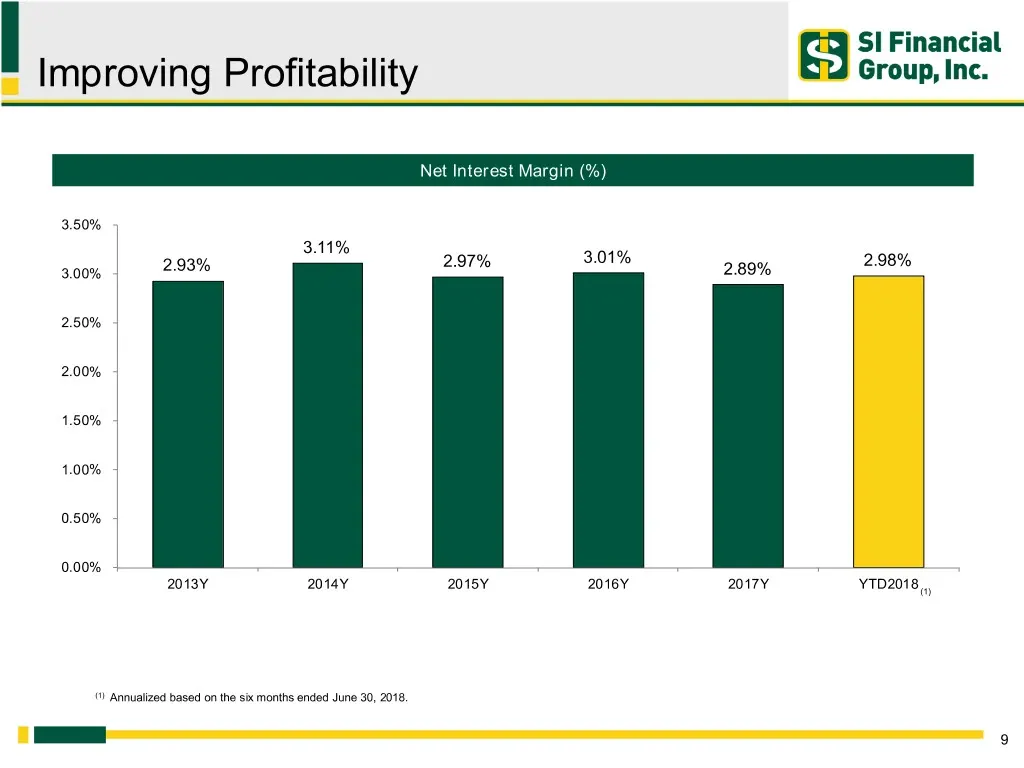
Improving Profitability Net Interest Margin (%) 3.50% 3.11% 2.97% 3.01% 2.98% 3.00% 2.93% 2.89% 2.50% 2.00% 1.50% 1.00% 0.50% 0.00% 2013Y 2014Y 2015Y 2016Y 2017Y YTD2018 (1) (1) Annualized based on the six months ended June 30, 2018. 9
Slide 10: Improving Profitability: Efficiency Ratio
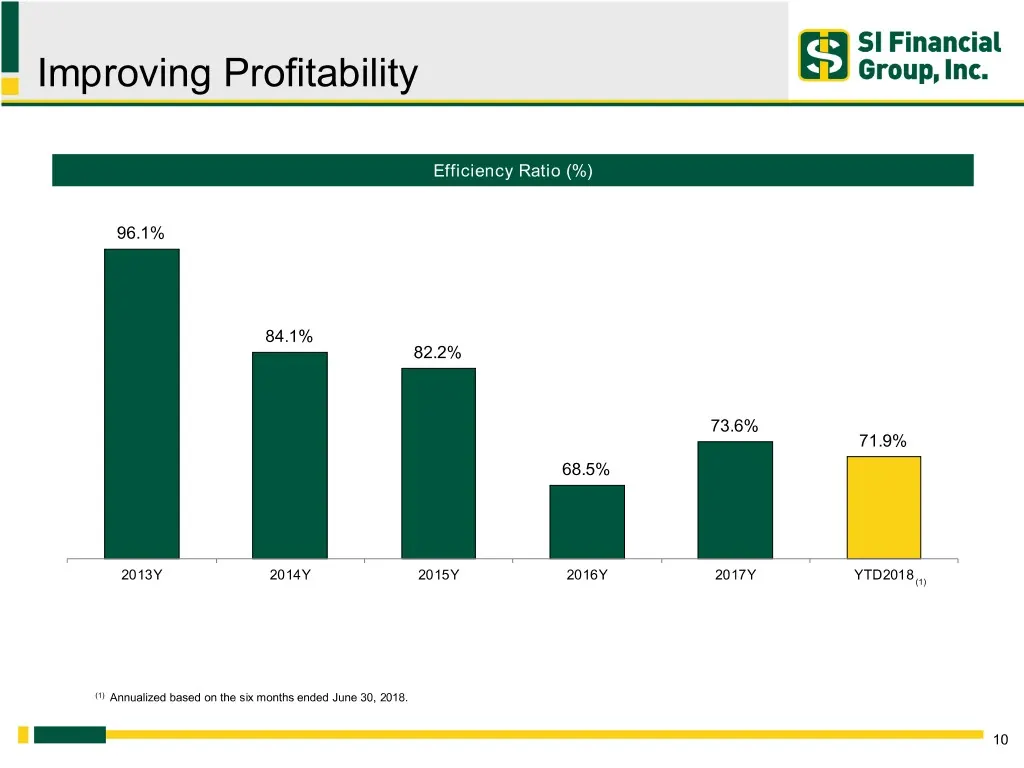
Improving Profitability Efficiency Ratio (%) 96.1% 84.1% 82.2% 73.6% 71.9% 68.5% 2013Y 2014Y 2015Y 2016Y 2017Y YTD2018 (1) (1) Annualized based on the six months ended June 30, 2018. 10
Slide 11: Consistent Loan Growth
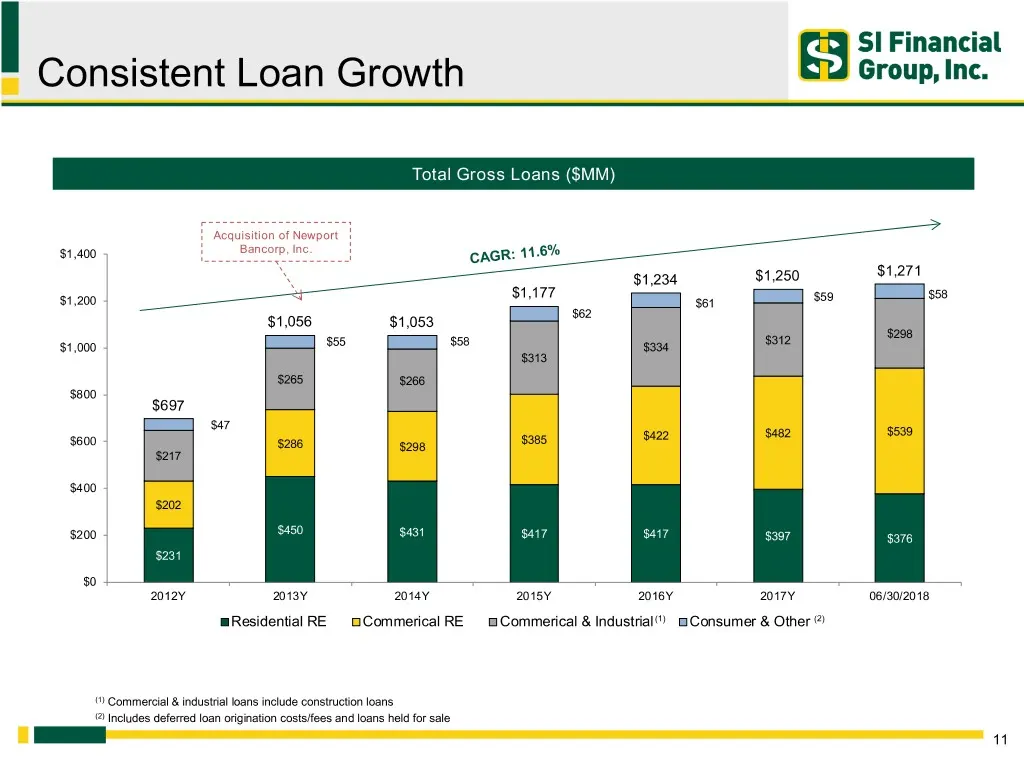
Consistent Loan Growth Total Gross Loans ($MM) Acquisition of Newport $1,400 Bancorp, Inc. $1,271 $1,234 $1,250 $1,177 $59 $58 $1,200 $61 $62 $1,056 $1,053 $298 $58 $312 $1,000 $55 $334 $313 $265 $266 $800 $697 $47 $482 $539 $385 $422 $600 $286 $298 $217 $400 $202 $450 $431 $200 $417 $417 $397 $376
Slide 12: Strong Loan Growth
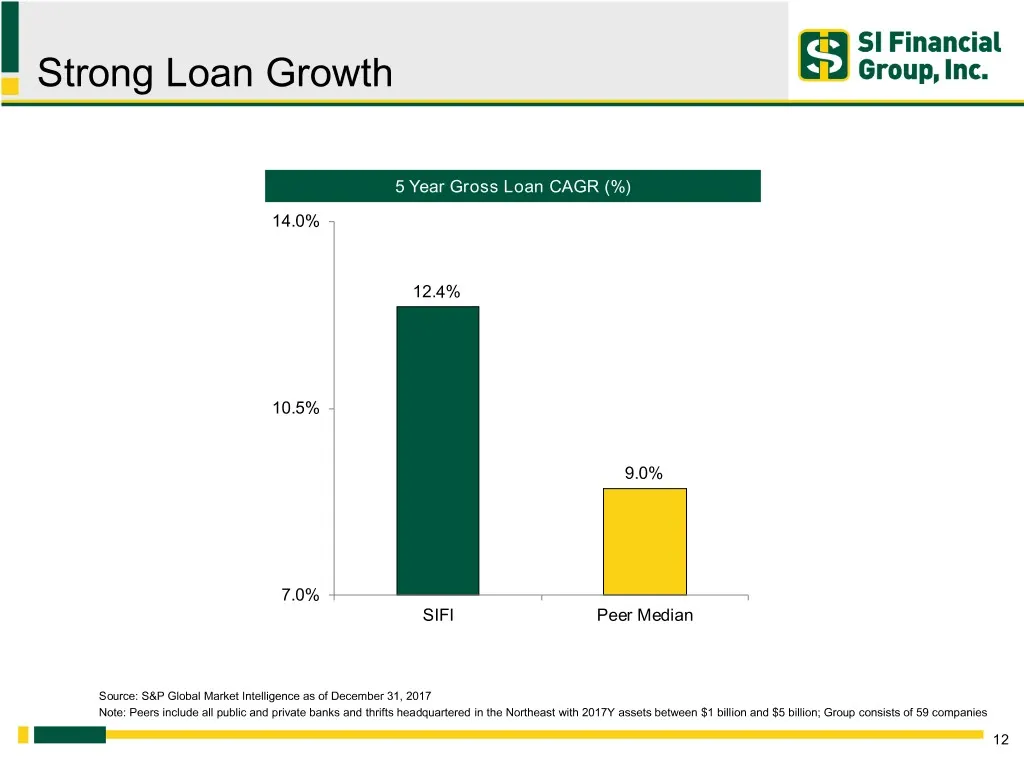
Strong Loan Growth 5 Year Gross Loan CAGR (%) 14.0% 12.4% 10.5% 9.0% 7.0% SIFI Peer Median Source: S&P Global Market Intelligence as of December 31, 2017 Note: Peers include all public and private banks and thrifts headquartered in the Northeast with 2017Y assets between $1 billion and $5 billion; G
Slide 13: Consistent Deposit Growth
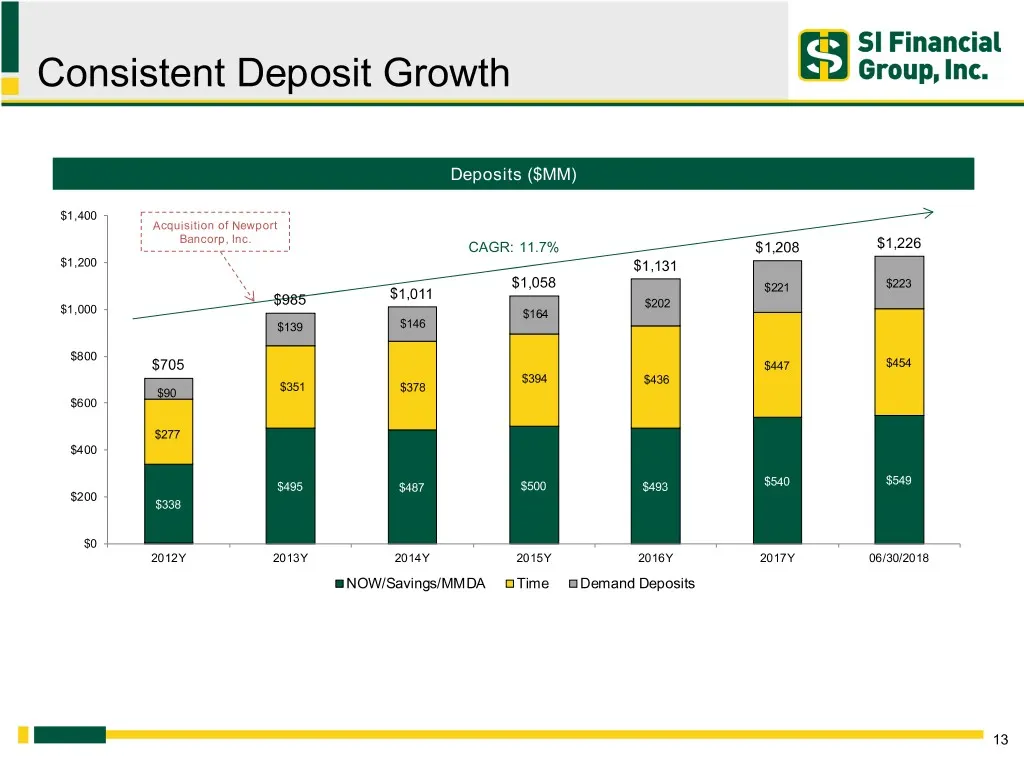
Consistent Deposit Growth Deposits ($MM) $1,400 Acquisition of Newport Bancorp, Inc. CAGR: 11.7% $1,208 $1,226 $1,200 $1,131 $1,058 $223 $1,011 $221 $985 $202 $1,000 $164 $139 $146 $800 $705 $447 $454 $394 $436 $351 $90 $378 $600 $277 $400 $540 $549 $495 $487 $500 $493 $200 $338 $0 2012Y 2013Y 2014Y
Slide 14: Strong Deposit Growth
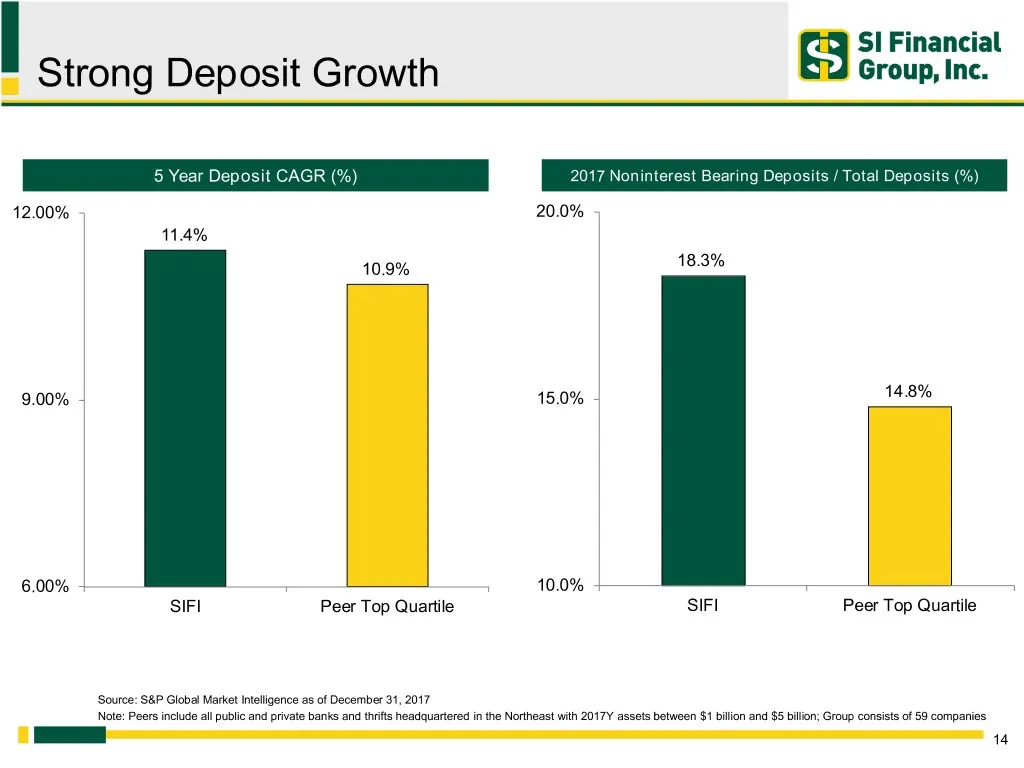
Strong Deposit Growth 5 Year Deposit CAGR (%) 2017 Noninterest Bearing Deposits / Total Deposits (%) 12.00% 20.0% 11.4% 18.3% 10.9% 9.00% 15.0% 14.8% 6.00% 10.0% SIFI Peer Top Quartile SIFI Peer Top Quartile Source: S&P Global Market Intelligence as of December 31, 2017 Note: Peers include all publi
Slide 15: Strong Asset Quality
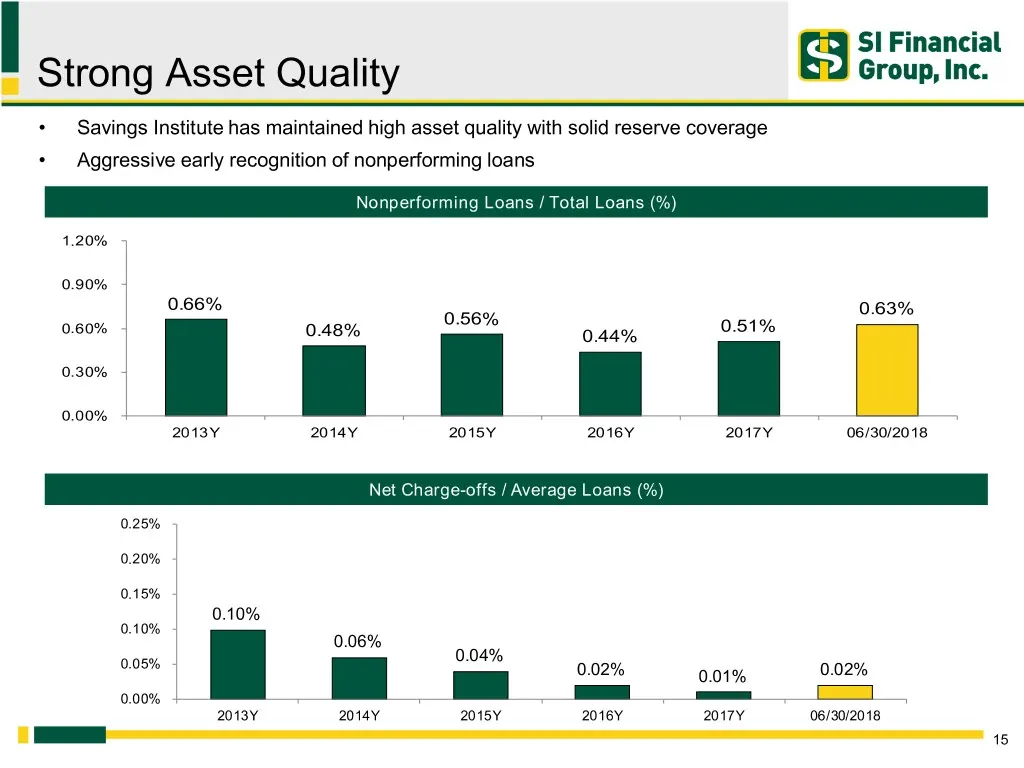
Strong Asset Quality • Savings Institute has maintained high asset quality with solid reserve coverage • Aggressive early recognition of nonperforming loans Nonperforming Loans / Total Loans (%) 1.20% 0.90% 0.66% 0.63% 0.56% 0.60% 0.51% 0.48% 0.44% 0.30% 0.00% 2013Y 2014Y 2015Y 2016Y 2017Y 06/30/201
Slide 16: Financial Strength – June 30, 2018
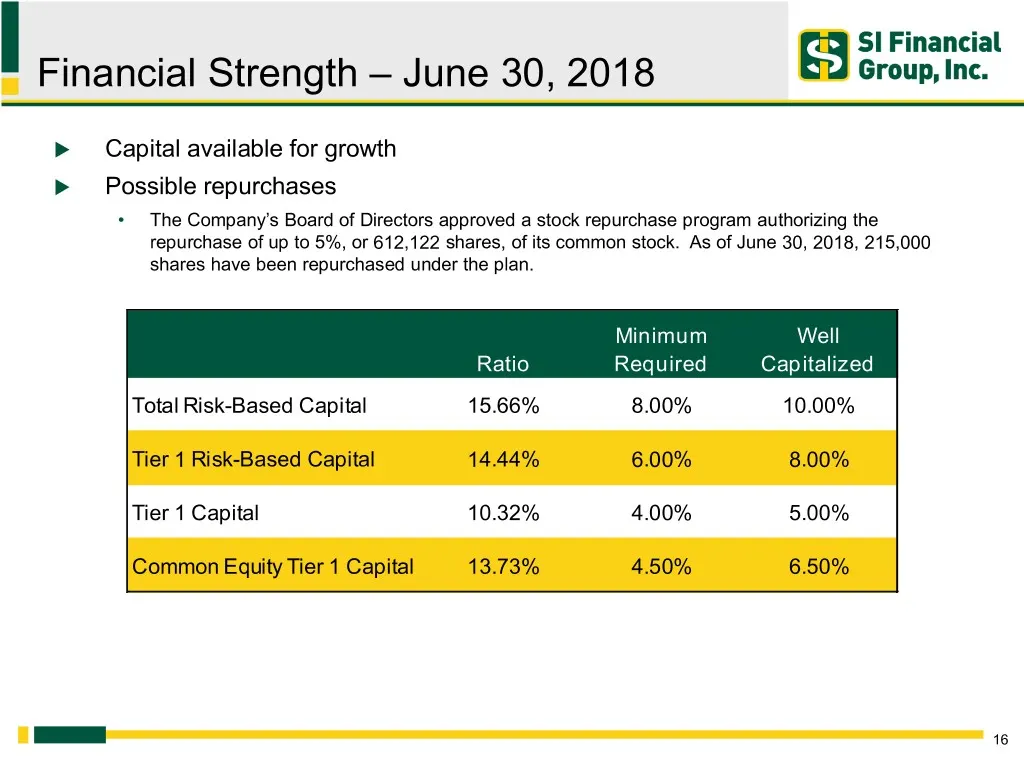
Financial Strength – June 30, 2018 Capital available for growth Possible repurchases • The Company’s Board of Directors approved a stock repurchase program authorizing the repurchase of up to 5%, or 612,122 shares, of its common stock. As of June 30, 2018, 215,000 shares have been repurchased un
Slide 17: Appendix – Non-GAAP Financial Measures
Appendix – Non-GAAP Financial Measures
Slide 18: Non-GAAP Financial Measures
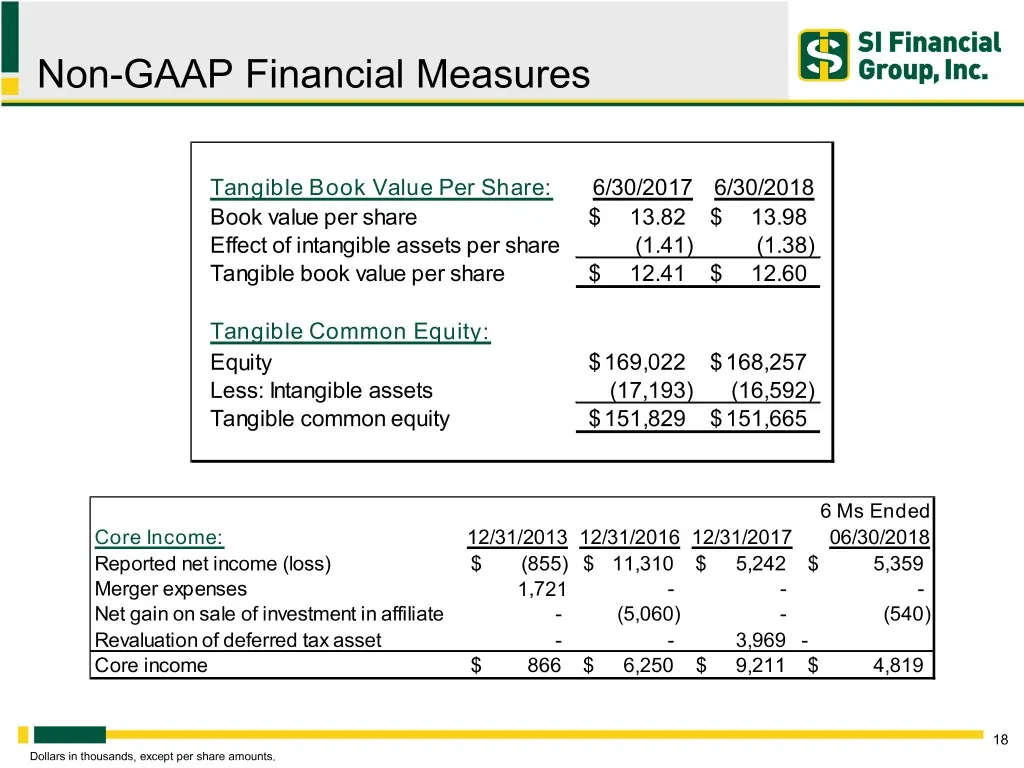
Non-GAAP Financial Measures Tangible Book Value Per Share: 6/30/2017 6/30/2018 Book value per share $ 13.82 $ 13.98 Effect of intangible assets per share (1.41) (1.38) Tangible book value per share $ 12.41 $ 12.60 Tangible Common Equity: Equity $ 169,022 $ 168,257 Less: Intangible assets (17,193) (1
Source: SEC EDGAR · 8-K filed Sep 20, 2018
More decks from SI Financial Group Inc
 Merger or Acquisition (December 2018)13 slides · Dec 11, 2018
 Shareholder Meeting (May 2018)19 slides · May 9, 2018
 Investor Presentation (May 2017)18 slides · May 10, 2017
 Investor Presentation (May 2016)19 slides · May 11, 2016
 Shareholder Meeting (May 2015)19 slides · May 13, 2015
 Sterne Agee Investor Conference 201520 slides · Feb 12, 2015