Sundance Energy — Sundance Energy Australia — Investor Presentation (February 2019)
18 slides from Sundance Energy's investor presentation, Feb 6, 2019
Slide 1: Disclaimers: Important Notice and Disclaimer
Disclaimers Important Notice and Disclaimer IMPORTANT: You are advised to read the following carefully before making any use of the information contained in this presentation. Except as required by law, no representation or warranty, express or implied, is made by Sundance or any of the Sundance Rel
Slide 2: Disclaimers: Industry data, Past performance, Forward-looking statements
Disclaimers Industry data Certain market and industry data used in connection with this presentation, including in relation to other companies in Sundance’s peer group, may have been obtained from public filings, research, surveys or studies conducted by third parties, including industry or general
Slide 3: Disclaimers: Proved and probable reserves
Disclaimers Proved and probable reserves Ryder Scott Company, L.P. (Ryder Scott) has prepared an independent estimate of the proved and probable reserves, future production and income attributable to leasehold interests within the recently closed acquisition of 21,900 net acres for sale by Pioneer N
Slide 4: Sundance Energy – Positioned for Continued Success in 2019
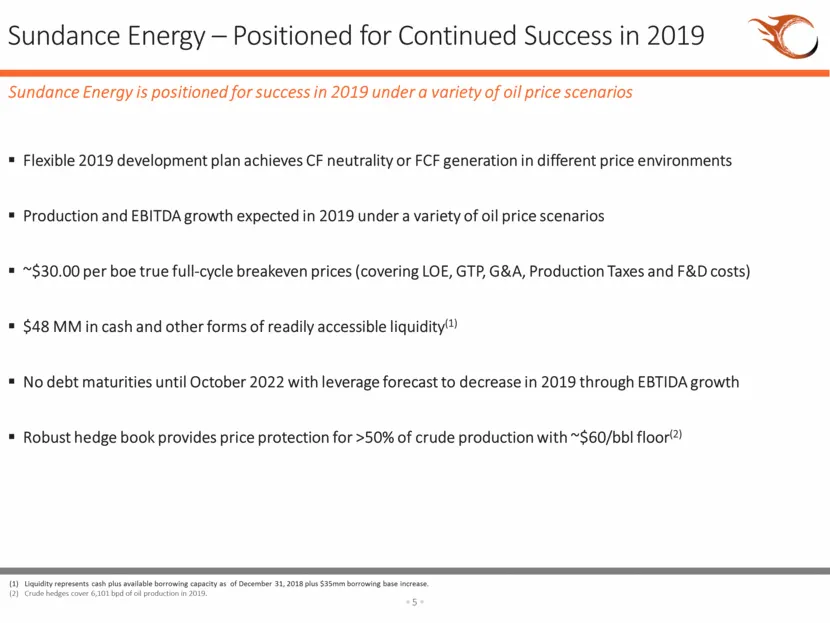
Sundance Energy – Positioned for Continued Success in 2019 Sundance Energy is positioned for success in 2019 under a variety of oil price scenarios Liquidity represents cash plus available borrowing capacity as of December 31, 2018 plus $35mm borrowing base increase. Crude hedges cover 6,101 bpd of
Slide 5: A Leading Pure Play Eagle Ford Producer
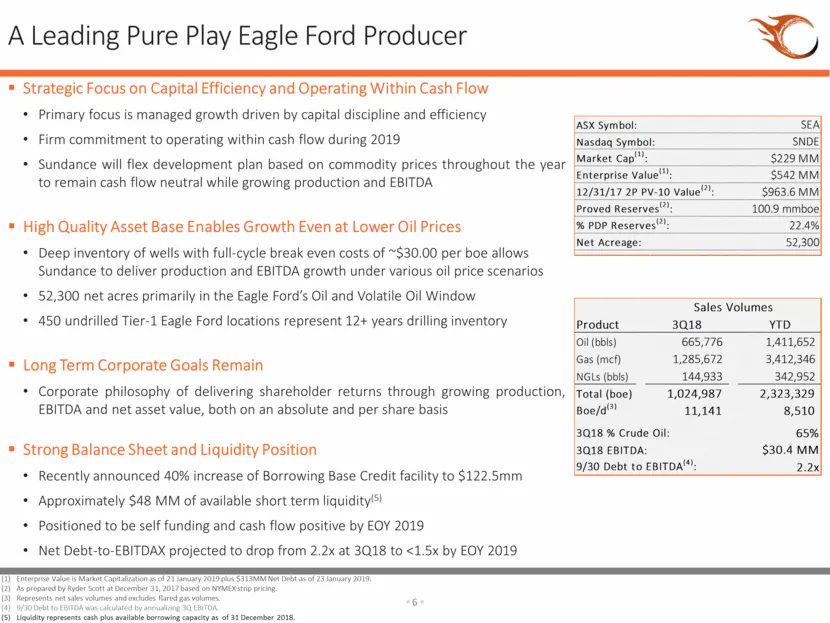
A Leading Pure Play Eagle Ford Producer Strategic Focus on Capital Efficiency and Operating Within Cash Flow Primary focus is managed growth driven by capital discipline and efficiency Firm commitment to operating within cash flow during 2019 Sundance will flex development plan based on commodity pr
Slide 6: Cycle-Tested Leadership Team with History of Value Creation
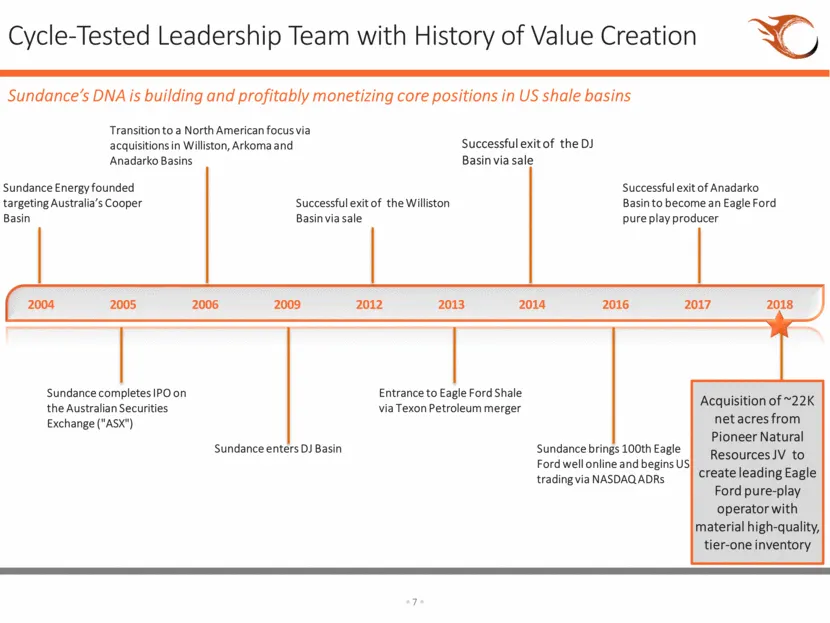
Cycle-Tested Leadership Team with History of Value Creation Sundance’s DNA is building and profitably monetizing core positions in US shale basins 2004 2005 2006 2009 2012 2013 2014 2016 2018 Sundance Energy founded targeting Australia’s Cooper Basin Sundance completes IPO on the Australian Securiti
Slide 7: Premier Asset Base Economic At Lower Commodity Prices
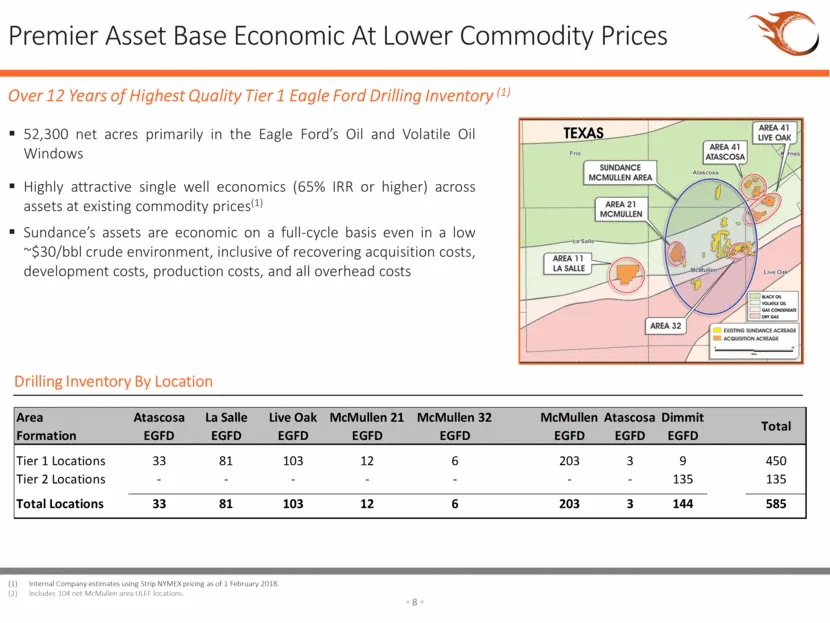
Premier Asset Base Economic At Lower Commodity Prices 52,300 net acres primarily in the Eagle Ford’s Oil and Volatile Oil Windows Highly attractive single well economics (65% IRR or higher) across assets at existing commodity prices(1) Sundance’s assets are economic on a full-cycle basis even in a l
Slide 8: 2018 Development – Legacy Acreage
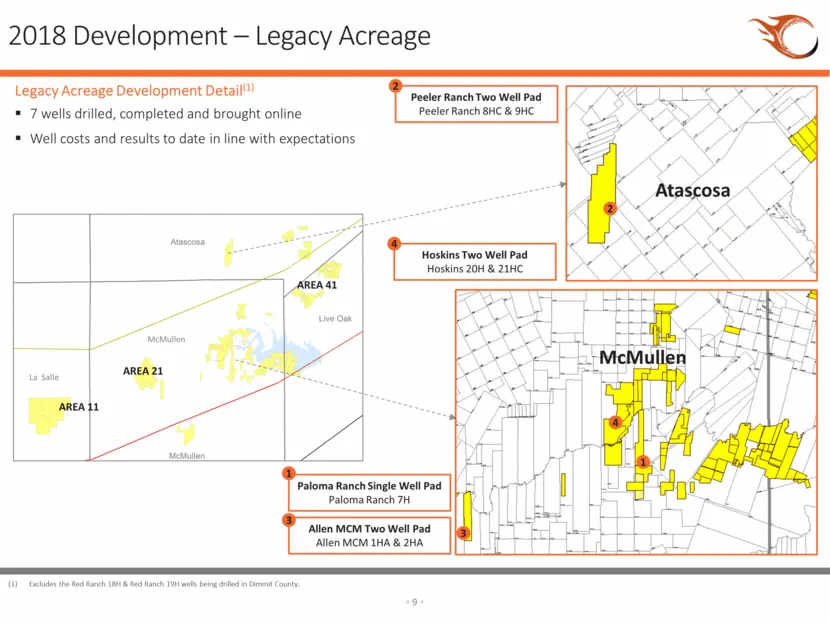
2018 Development – Legacy Acreage 3 1 2 Atascosa McMullen La Salle McMullen AREA 41 AREA 11 AREA 21 Paloma Ranch Single Well Pad Paloma Ranch 7H 1 Peeler Ranch Two Well Pad Peeler Ranch 8HC & 9HC 2 Allen MCM Two Well Pad Allen MCM 1HA & 2HA 3 Legacy Acreage Development Detail(1) 7 wells drilled, com
Slide 9: 2018 Development – Newly Acquired Acreage
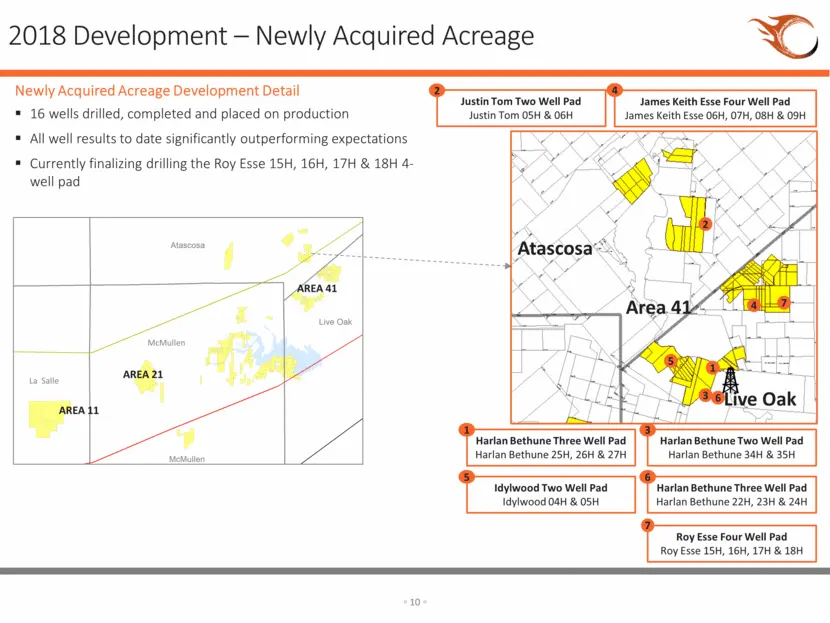
La Salle McMullen AREA 41 AREA 11 AREA 21 2018 Development – Newly Acquired Acreage 2 4 3 1 5 Atascosa Live Oak Harlan Bethune Three Well Pad Harlan Bethune 25H, 26H & 27H 1 Harlan Bethune Two Well Pad Harlan Bethune 34H & 35H 3 James Keith Esse Four Well Pad James Keith Esse 06H, 07H, 08H & 09H 4 J
Slide 10: Excellent Preliminary Well Results
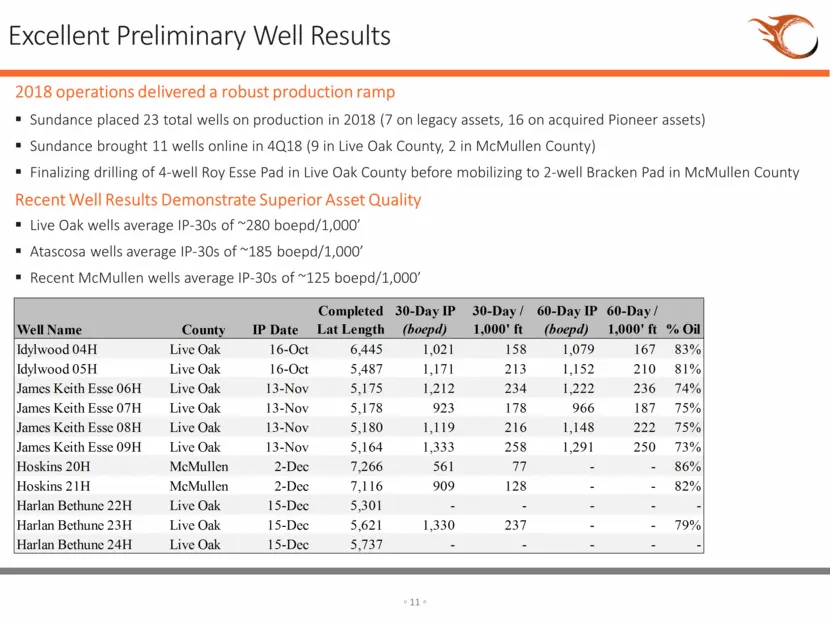
Excellent Preliminary Well Results 2018 operations delivered a robust production ramp Sundance placed 23 total wells on production in 2018 (7 on legacy assets, 16 on acquired Pioneer assets) Sundance brought 11 wells online in 4Q18 (9 in Live Oak County, 2 in McMullen County) Finalizing drilling of
Slide 11: Sundance Initial Production Rates vs Peers
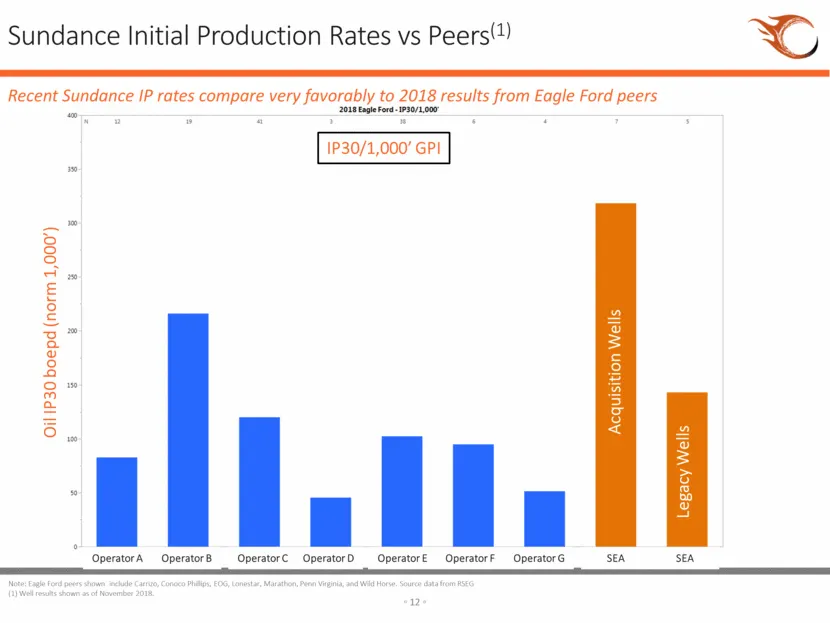
Sundance Initial Production Rates vs Peers(1) Recent Sundance IP rates compare very favorably to 2018 results from Eagle Ford peers IP30/1,000’ GPI Oil IP30 boepd (norm 1,000’) Operator A Operator B Operator C Operator D Operator E Operator F Operator G SEA SEA Acquisition Wells Legacy Wells Note: E
Slide 12: Live Oak County Initial Well Performance vs Type Curve
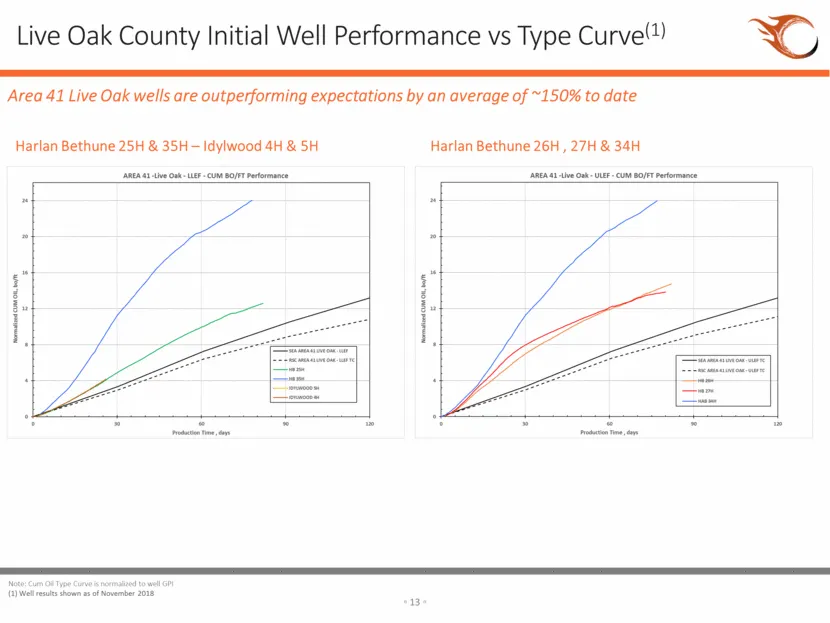
Harlan Bethune 25H & 35H – Idylwood 4H & 5H Live Oak County Initial Well Performance vs Type Curve(1) Harlan Bethune 26H , 27H & 34H Area 41 Live Oak wells are outperforming expectations by an average of ~150% to date Note: Cum Oil Type Curve is normalized to well GPI (1) Well results shown as of No
Slide 13: Atascosa County Initial Well Performance vs Type Curve
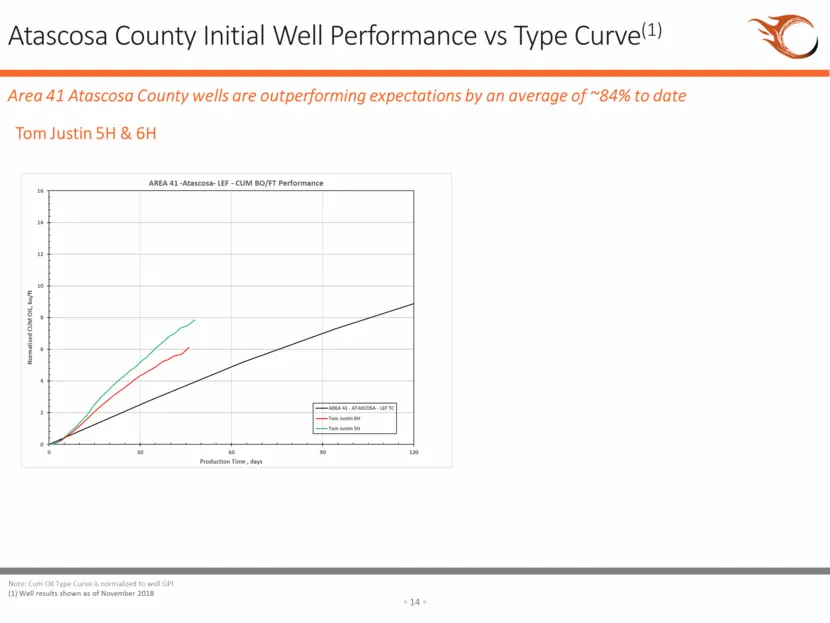
Atascosa County Initial Well Performance vs Type Curve(1) Tom Justin 5H & 6H Area 41 Atascosa County wells are outperforming expectations by an average of ~84% to date Note: Cum Oil Type Curve is normalized to well GPI (1) Well results shown as of November 2018
Slide 14: McMullen County Initial Well Performance vs Type Curve
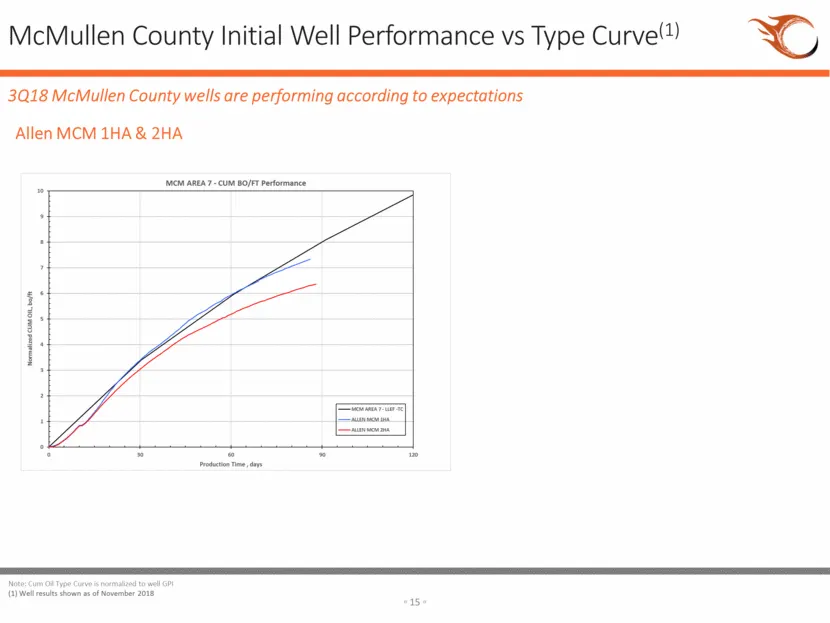
McMullen County Initial Well Performance vs Type Curve(1) Allen MCM 1HA & 2HA 3Q18 McMullen County wells are performing according to expectations Note: Cum Oil Type Curve is normalized to well GPI (1) Well results shown as of November 2018
Slide 15: Corporate Debt Overview
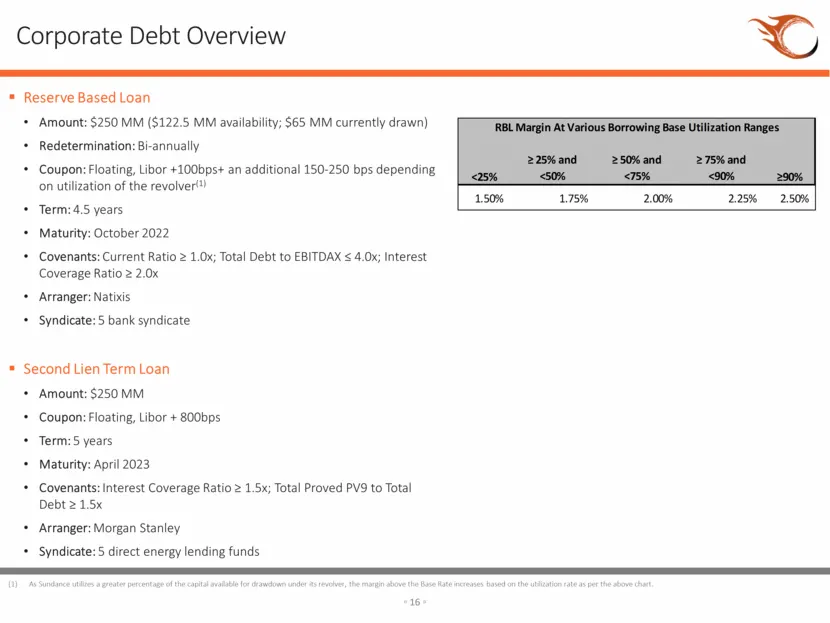
Corporate Debt Overview Reserve Based Loan Amount: $250 MM ($122.5 MM availability; $65 MM currently drawn) Redetermination: Bi-annually Coupon: Floating, Libor +100bps+ an additional 150-250 bps depending on utilization of the revolver(1) Term: 4.5 years Maturity: October 2022 Covenants: Current Ra
Slide 16: Robust 2019 Hedge Book Guarantees Strong Cash Flow Generation
Robust 2019 Hedge Book Guarantees Strong Cash Flow Generation All figures representative of Sundance’s hedge book through 2023 as at 21 January 2019. Hedge coverage percentage represents hedges as a percentage of the midpoint of Sundance’s public oil production guidance. Gas Hedges(1) Oil Hedges(1)
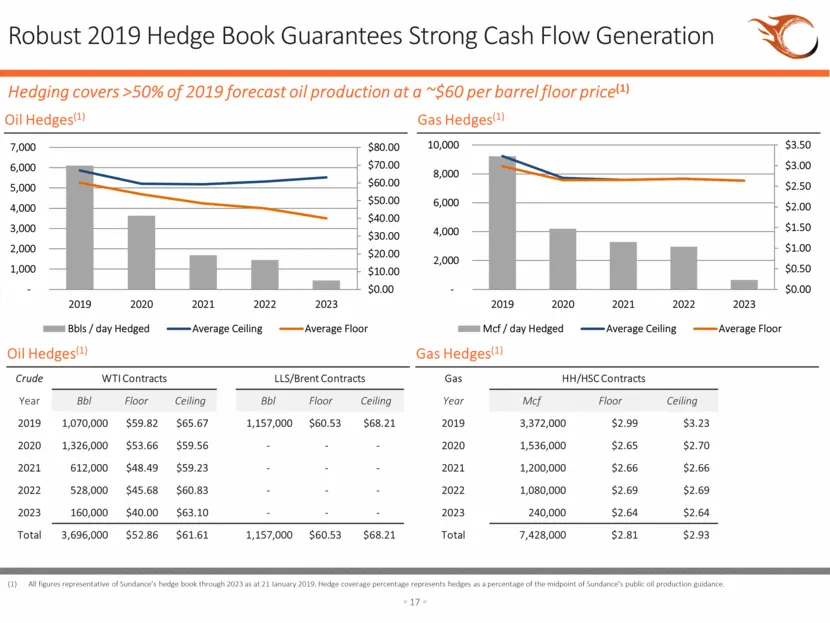
Slide 17: High Quality Asset Base – Material Inventory With Low Full-Cycle Break Even Costs
High Quality Asset Base – Material Inventory With Low Full-Cycle Break Even Costs 12+ years of highly attractive Tier 1 drilling inventory with $963.6 MM of 2P PV10 as at year end 2017(1) Full-cycle break even costs of ~$30 per boe allows production and EBITDA growth under various oil price scenario
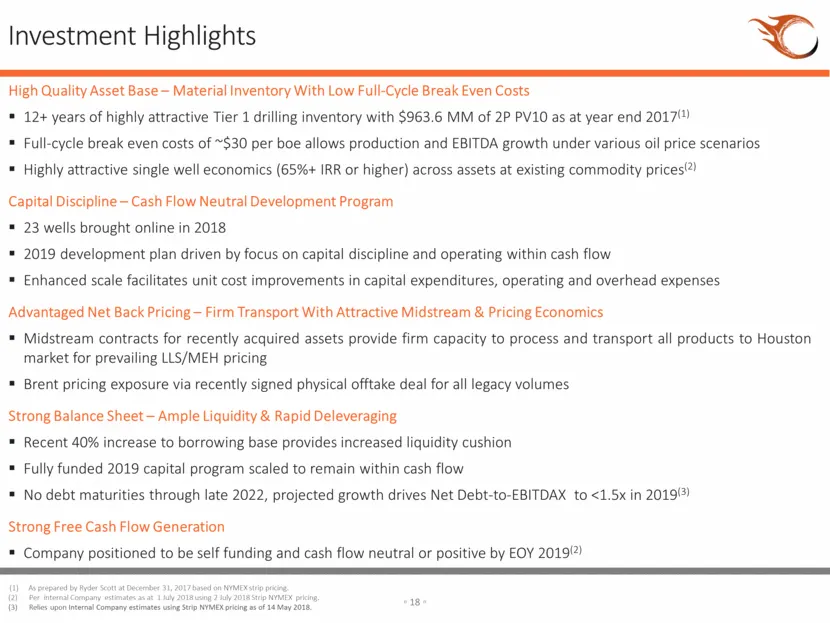
Slide 18: Investment Highlights
Investment Highlights .@ High Quality Asset Base — Material Inventory With Low Full-Cycle Break Even Costs = 12+ years of highly attractive Tier 1 drilling inventory with $963.6 MM of 2P PV10 as at year end 2017") = Full-cycle break even costs of ~$30 per boe allows production and EBITDA growth unde
Source: SEC EDGAR · 6-K filed Feb 6, 2019
More decks from Sundance Energy Inc
 Investor Presentation (February 2020)25 slides · Feb 10, 2020
 Sundance Energy Australia — Q3 2019 Earnings Presentation24 slides · Nov 18, 2019
 Sundance Energy Australia — Q2 2019 Earnings Presentation25 slides · Aug 16, 2019
 Sundance Energy Australia — Investor Presentation (July 2019)19 slides · Jul 24, 2019
 Sundance Energy Australia — Investor Presentation (June 2019)16 slides · Jun 3, 2019
 Sundance Energy Australia — Q1 2019 Earnings Presentation17 slides · May 21, 2019