Sundance Energy — Sundance Energy Australia — Investor Presentation (June 2019)
16 slides from Sundance Energy's investor presentation, Jun 3, 2019
Slide 1: Disclaimers: Important Notice and Disclaimer
Disclaimers Important Notice and Disclaimer IMPORTANT: You are advised to read the following carefully before making any use of the information contained in this presentation. Except as required by law, no representation or warranty, express or implied, is made by Sundance or any of the Sundance Rel
Slide 2: Disclaimers: Industry Data, Past Performance, Forward-Looking Statements
Disclaimers Industry data Certain market and industry data used in connection with this presentation, including in relation to other companies in Sundance’s peer group, may have been obtained from public filings, research, surveys or studies conducted by third parties, including industry or general
Slide 3: Disclaimers: Proved Reserves
Disclaimers Proved Reserves Ryder Scott Company, L.P. (Ryder Scott) has prepared an independent estimate of the proved reserves, future production and income attributable to Sundance Energy’s leasehold interests in the Eagle Ford shale play in the State of Texas, USA as of 1 January 2019. The Compan
Slide 4: A Leading Pure Play Eagle Ford Producer
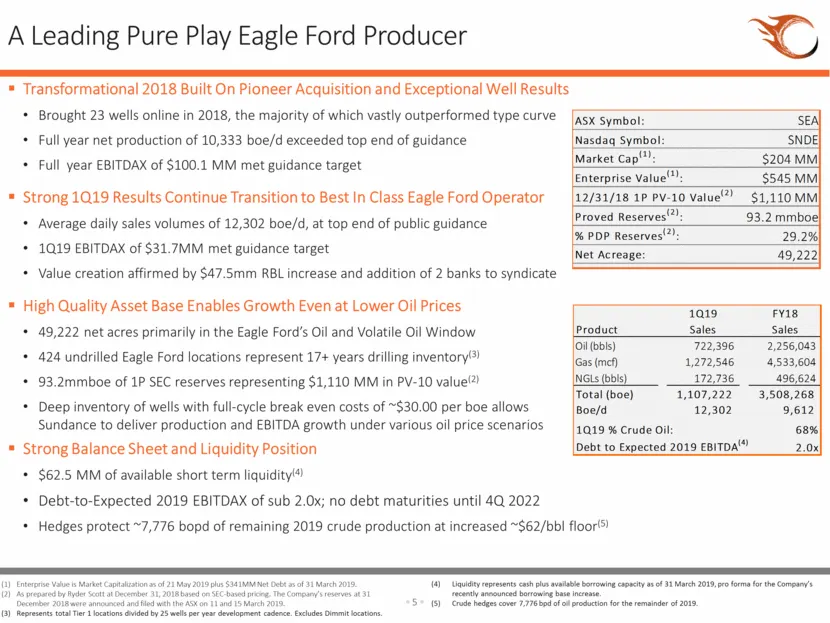
A Leading Pure Play Eagle Ford Producer Transformational 2018 Built On Pioneer Acquisition and Exceptional Well Results Brought 23 wells online in 2018, the majority of which vastly outperformed type curve Full year net production of 10,333 boe/d exceeded top end of guidance Full year EBITDAX of $10
Slide 5: High Quality Asset Base – Material Inventory With Low Full-Cycle Break Even Costs
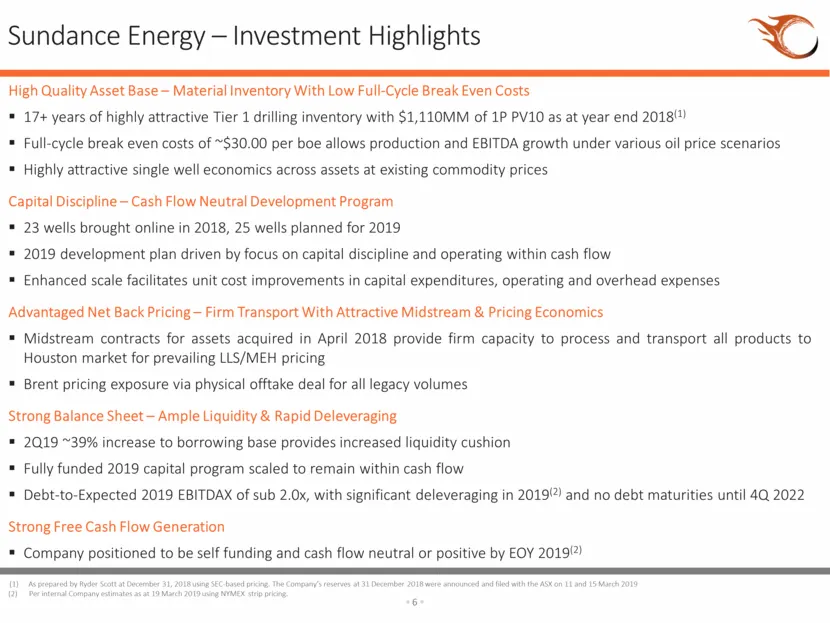
High Quality Asset Base – Material Inventory With Low Full-Cycle Break Even Costs 17+ years of highly attractive Tier 1 drilling inventory with $1,110MM of 1P PV10 as at year end 2018(1) Full-cycle break even costs of ~$30.00 per boe allows production and EBITDA growth under various oil price scenar
Slide 6: Summary Quarterly and Full Year 2019 Guidance
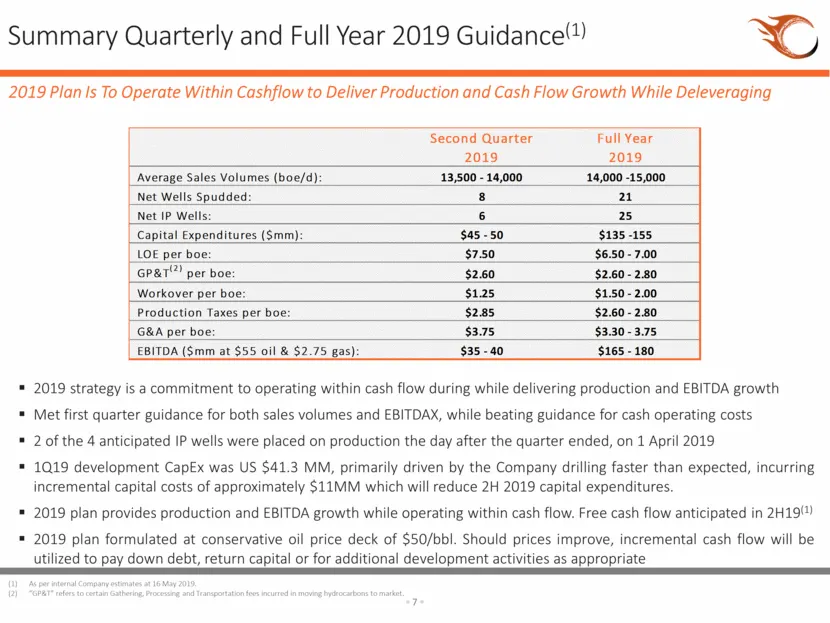
Summary Quarterly and Full Year 2019 Guidance(1) 2019 Plan Is To Operate Within Cashflow to Deliver Production and Cash Flow Growth While Deleveraging As per internal Company estimates at 16 May 2019. “GP&T” refers to certain Gathering, Processing and Transportation fees incurred in moving hydrocarb
Slide 7: Assets Deliver Attractive Returns At Lower Oil Prices
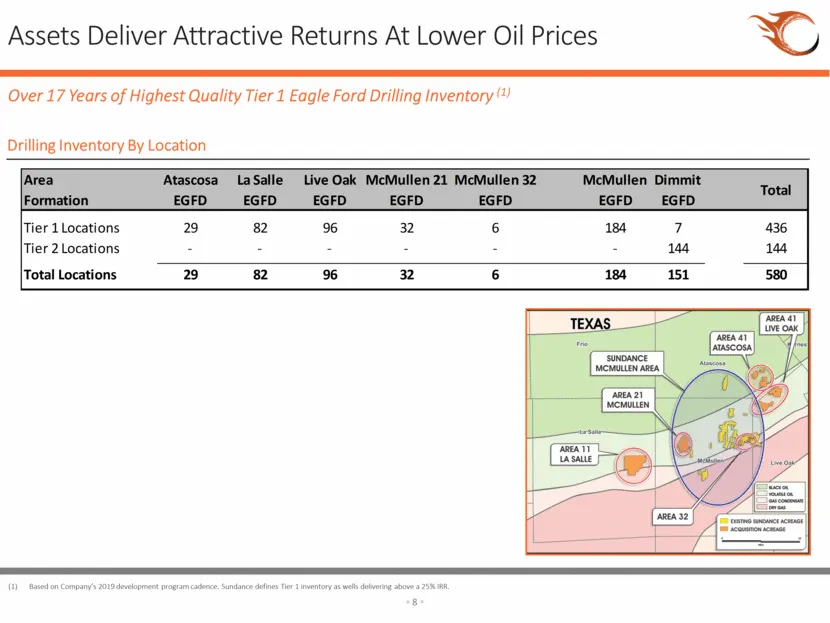
Assets Deliver Attractive Returns At Lower Oil Prices Based on Company’s 2019 development program cadence. Sundance defines Tier 1 inventory as wells delivering above a 25% IRR. Over 17 Years of Highest Quality Tier 1 Eagle Ford Drilling Inventory (1) Drilling Inventory By Location Area Atascosa La
Slide 8: Capitalization Table and Available Liquidity
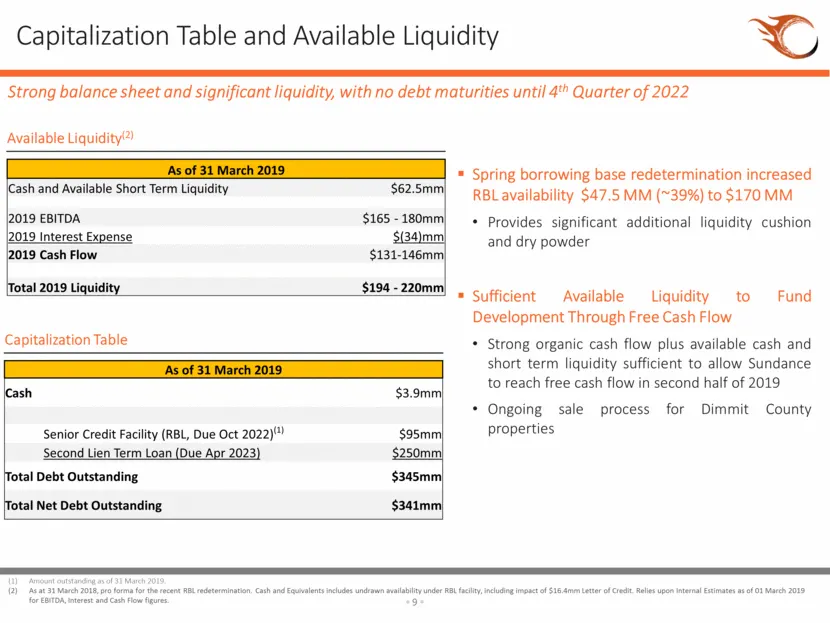
Capitalization Table and Available Liquidity Strong balance sheet and significant liquidity, with no debt maturities until 4th Quarter of 2022 Spring borrowing base redetermination increased RBL availability $47.5 MM (~39%) to $170 MM Provides significant additional liquidity cushion and dry powder
Slide 9: Corporate Debt Overview
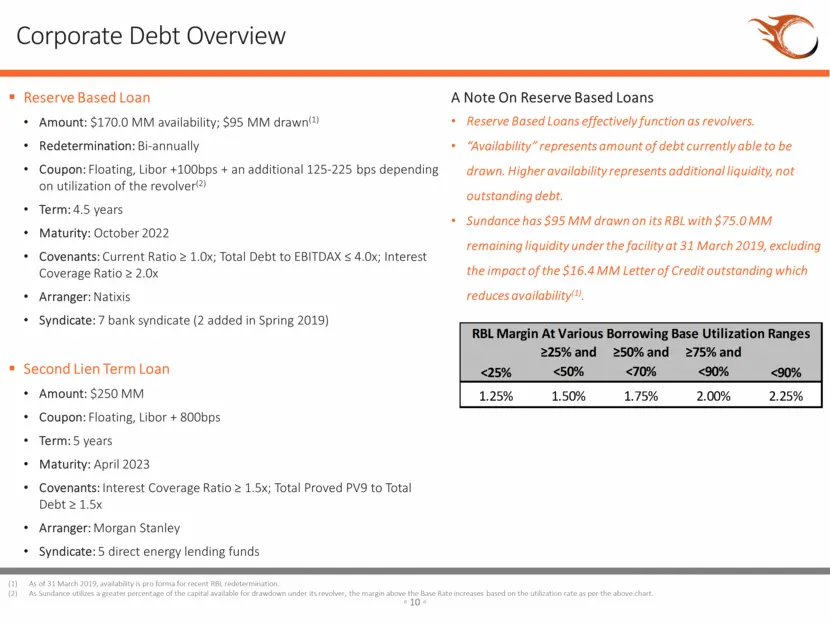
Corporate Debt Overview Reserve Based Loan Amount: $170.0 MM availability; $95 MM drawn(1) Redetermination: Bi-annually Coupon: Floating, Libor +100bps + an additional 125-225 bps depending on utilization of the revolver(2) Term: 4.5 years Maturity: October 2022 Covenants: Current Ratio > 1.0x; Tota
Slide 10: Debt Maturity and Service Schedule
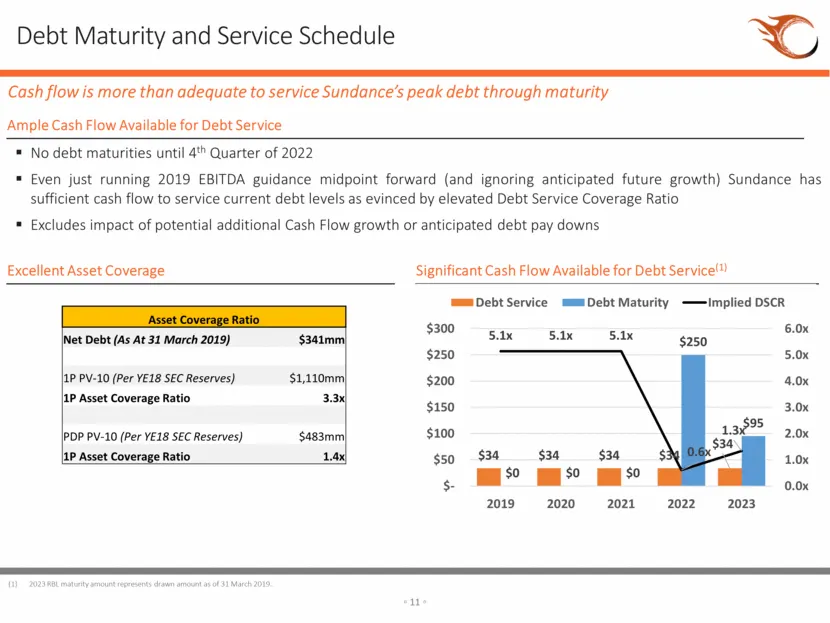
Debt Maturity and Service Schedule No debt maturities until 4th Quarter of 2022 Even just running 2019 EBITDA guidance midpoint forward (and ignoring anticipated future growth) Sundance has sufficient cash flow to service current debt levels as evinced by elevated Debt Service Coverage Ratio Exclude
Slide 11: Valuation Discount & Moderate Leverage
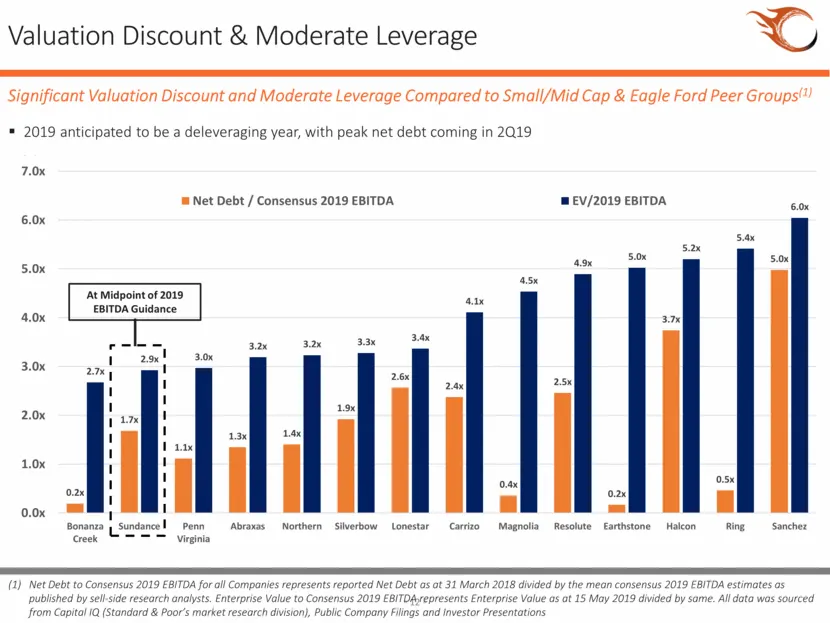
Valuation Discount & Moderate Leverage Significant Valuation Discount and Moderate Leverage Compared to Small/Mid Cap & Eagle Ford Peer Groups(1) Net Debt to Consensus 2019 EBITDA for all Companies represents reported Net Debt as at 31 March 2018 divided by the mean consensus 2019 EBITDA estimates a
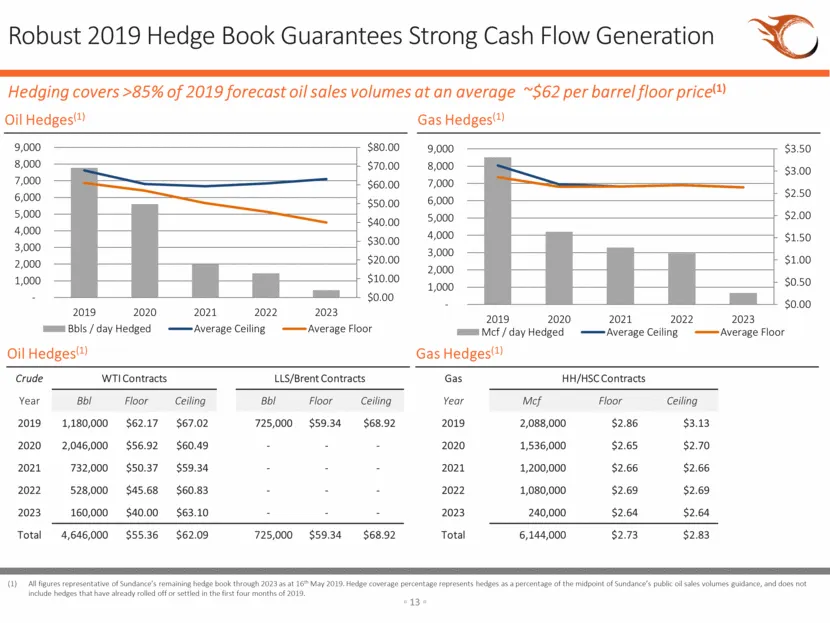
Slide 12: Robust 2019 Hedge Book Guarantees Strong Cash Flow Generation
Robust 2019 Hedge Book Guarantees Strong Cash Flow Generation All figures representative of Sundance’s remaining hedge book through 2023 as at 16th May 2019. Hedge coverage percentage represents hedges as a percentage of the midpoint of Sundance’s public oil sales volumes guidance, and does not incl
Slide 13: Appendix: Reserves Assumptions
Appendix: Reserves Assumptions
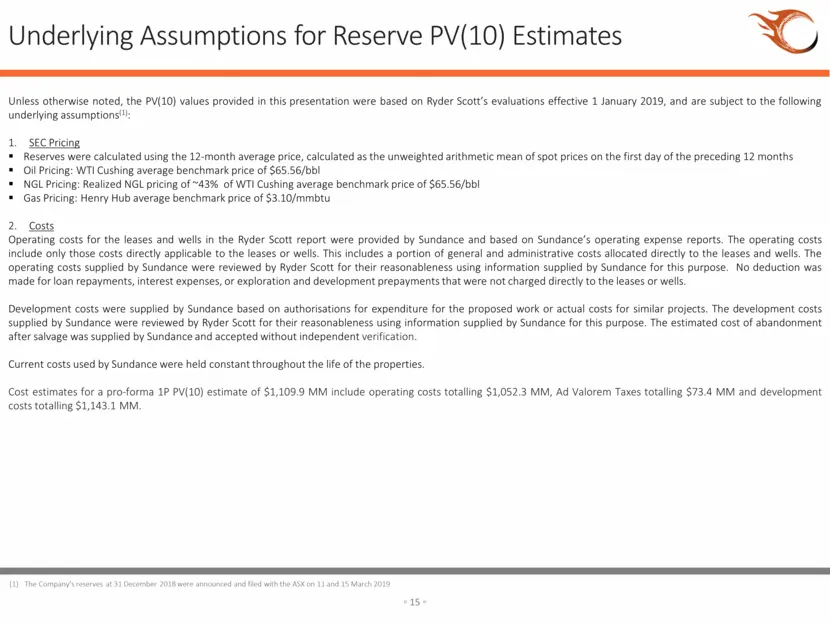
Slide 14: Underlying Assumptions for Reserve PV(10) Estimates
Underlying Assumptions for Reserve PV(10) Estimates Unless otherwise noted, the PV(10) values provided in this presentation were based on Ryder Scott’s evaluations effective 1 January 2019, and are subject to the following underlying assumptions(1): SEC Pricing Reserves were calculated using the 12-
Slide 15: For Additional Information Please Contact
For Additional Information Please Contact: United States John Roberts, VP Finance & Investor Relations [email protected] +1 (720) 638-2400 Eric McCrady, CEO & Managing Director [email protected] +1 (303) 543-5703 Australia Mike Hannell, Chairman + 61 8 8274 2128 or + 61 418 834 9
Slide 16: Sundance Energy – Contact
YN SUNDANCE energy For Additional information Please Contact: United states John Roberts, VP Finance & Investor Relations +1 (720) 638-2400, Eric MeCrady, CEO & Managing Director [email protected] +1 (303) 543-5703 ‘Australia Mike Hannell, Chairman +618 8274 2128 or + 61 418 834 957 www su
Source: SEC EDGAR · 6-K filed Jun 3, 2019
More decks from Sundance Energy Inc
 Investor Presentation (February 2020)25 slides · Feb 10, 2020
 Sundance Energy Australia — Q3 2019 Earnings Presentation24 slides · Nov 18, 2019
 Sundance Energy Australia — Q2 2019 Earnings Presentation25 slides · Aug 16, 2019
 Sundance Energy Australia — Investor Presentation (July 2019)19 slides · Jul 24, 2019
 Sundance Energy Australia — Q1 2019 Earnings Presentation17 slides · May 21, 2019
 Sundance Energy Australia — FY2018 Earnings Presentation18 slides · Apr 5, 2019