Copano Energy L.L.C — Investor Presentation (November 2008)
32 slides from Copano Energy L.L.C's investor presentation, Nov 19, 2008
Slide 1: Investor Presentation November 2008
Investor Presentation NASDAQ: CPNO November 2008
Slide 2: Disclaimer
3 Disclaimer Statements made by representatives of Copano Energy, L.L.C. (the "Company") during this presentation may constitute "forward-looking statements" as defined by the Securities and Exchange Commission. All statements, other than statements of historical facts, made by representatives of th
Slide 3: Introduction to Copano
5 Introduction to Copano Midstream energy company providing services to natural gas producers - founded in 1992 Operations are focused in Oklahoma, Texas and Wyoming Service throughput volumes approximate 1,700,000 MMBtu per day of natural gas Equity Market cap: $800 million(1) Enterprise value: $1.
Slide 4: Copano's Business Strategy
7 Copano's Business Strategy Pursue growth from our existing operations in three leading natural gas regions Supplement growth through complementary acquisitions and organic expansion projects Use contract portfolio and option-focused hedging program to manage commodity price sensitivity of our cash
Slide 5: Operations
9 Operations Operations Disciplined Growth LLC Structure Financial Strength
Slide 6: Operations in three leading producing regions
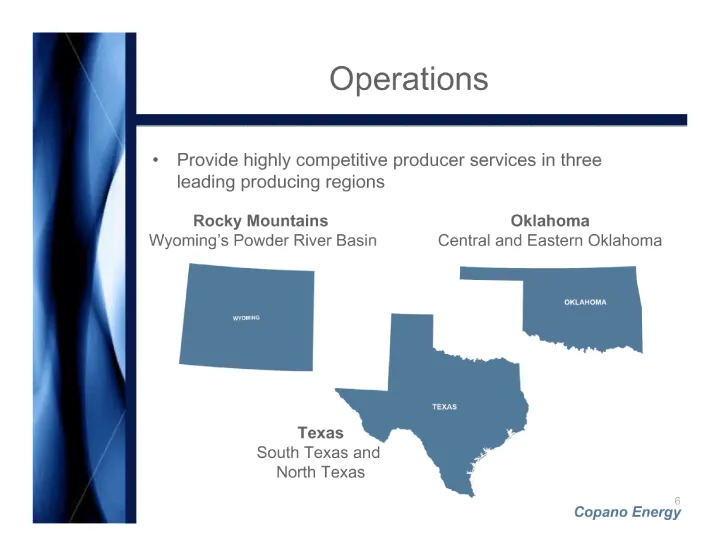
11 Provide highly competitive producer services in three leading producing regions Operations Texas South Texas and North Texas Oklahoma Central and Eastern Oklahoma Rocky Mountains Wyoming's Powder River Basin
Slide 7: Texas Operations
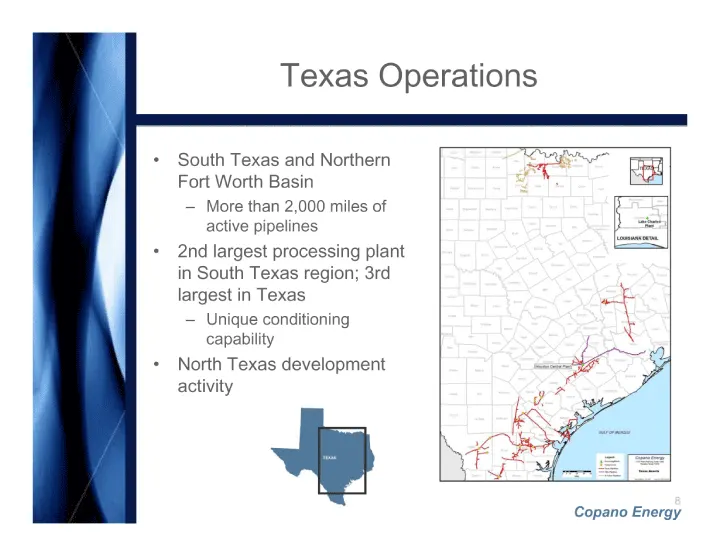
15 Texas Operations South Texas and Northern Fort Worth Basin More than 2,000 miles of active pipelines 2nd largest processing plant in South Texas region; 3rd largest in Texas Unique conditioning capability North Texas development activity
Slide 8: Rocky Mountain Operations
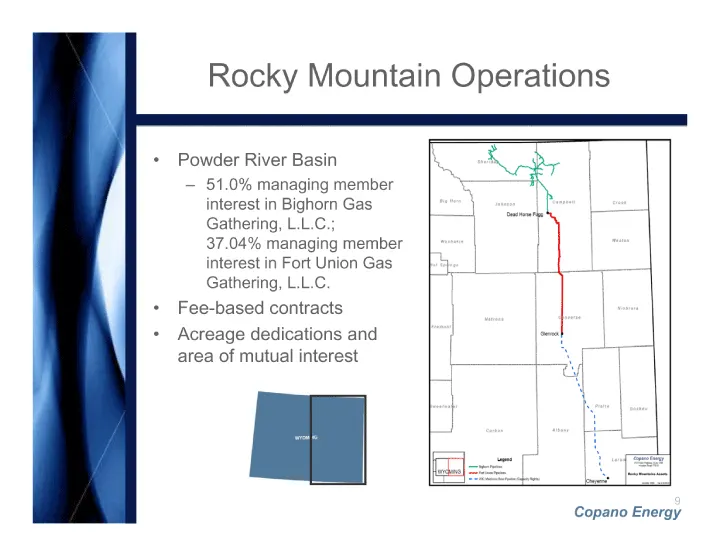
17 Rocky Mountain Operations Powder River Basin 51.0% managing member interest in Bighorn Gas Gathering, L.L.C.; 37.04% managing member interest in Fort Union Gas Gathering, L.L.C. Fee-based contracts Acreage dedications and area of mutual interest
Slide 9: Disciplined Growth
19 Disciplined Growth Disciplined Growth Financial Strength LLC Structure Operations
Slide 10: Total Return Performance
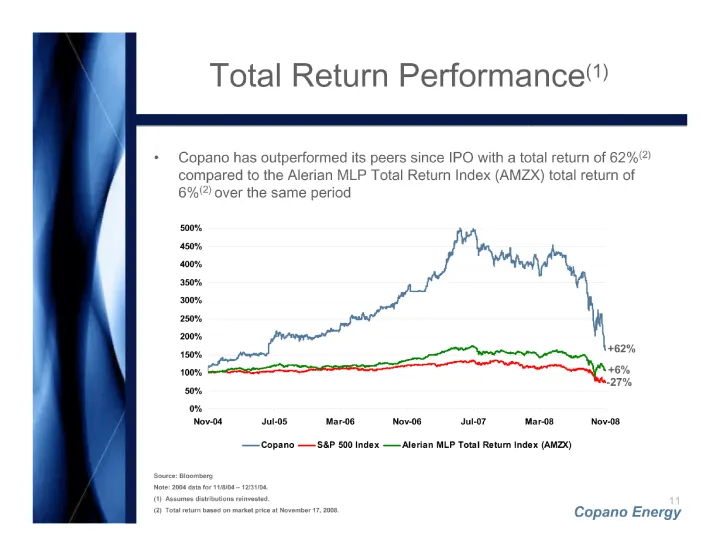
21 Total Return Performance(1) Copano has outperformed its peers since IPO with a total return of 62%(2) compared to the Alerian MLP Total Return Index (AMZX) total return of 6%(2) over the same period Source: Bloomberg Note: 2004 data for 11/8/04 - 12/31/04. (1) Assumes distributions reinvested. (2
Slide 11: Proven Growth Track Record
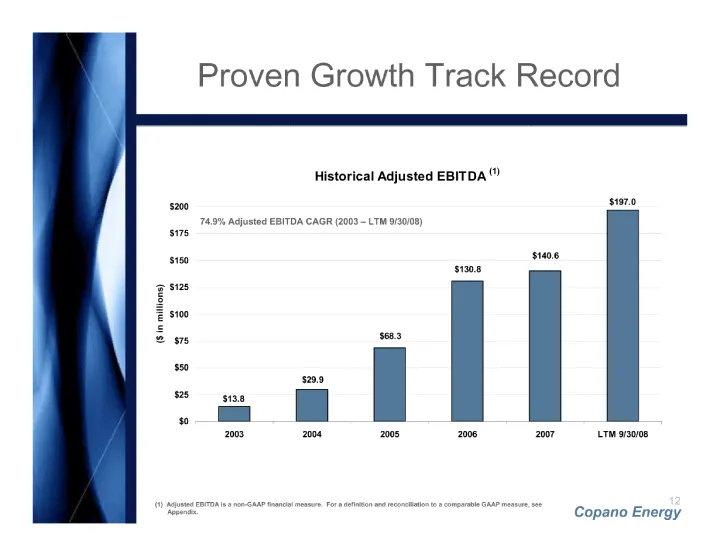
23 Proven Growth Track Record (1) Adjusted EBITDA is a non-GAAP financial measure. For a definition and reconciliation to a comparable GAAP measure, see Appendix. 74.9% Adjusted EBITDA CAGR (2003 - LTM 9/30/08)
Slide 12: Growth-Oriented History
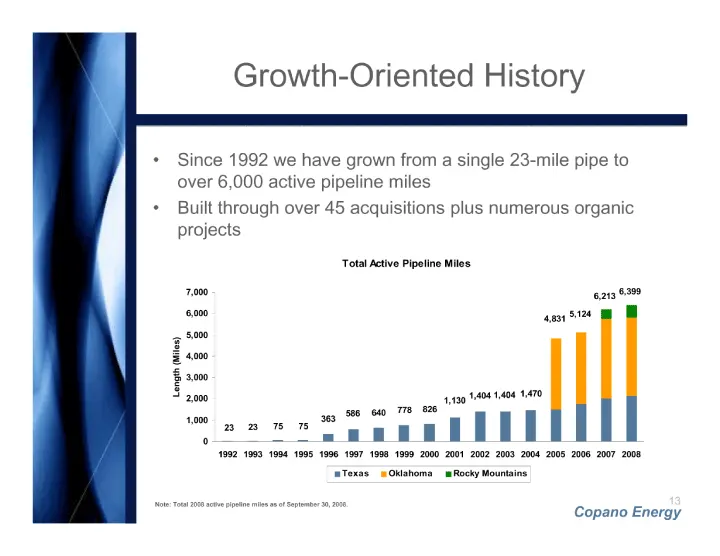
25 Growth-Oriented History Since 1992 we have grown from a single 23-mile pipe to over 6,000 active pipeline miles Built through over 45 acquisitions plus numerous organic projects Note: Total 2008 active pipeline miles as of September 30, 2008.
Slide 13: Approach to Acquisitions
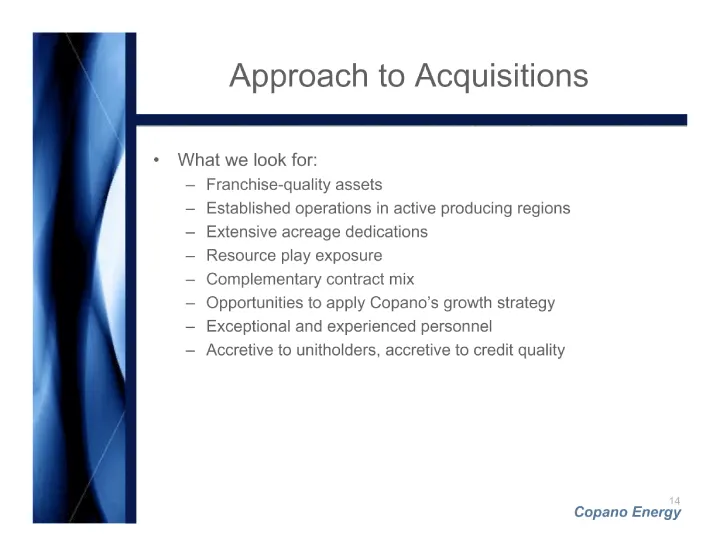
27 Approach to Acquisitions What we look for: Franchise-quality assets Established operations in active producing regions Extensive acreage dedications Resource play exposure Complementary contract mix Opportunities to apply Copano's growth strategy Exceptional and experienced personnel Accretive to
Slide 14: Impact of Resource Play Gas
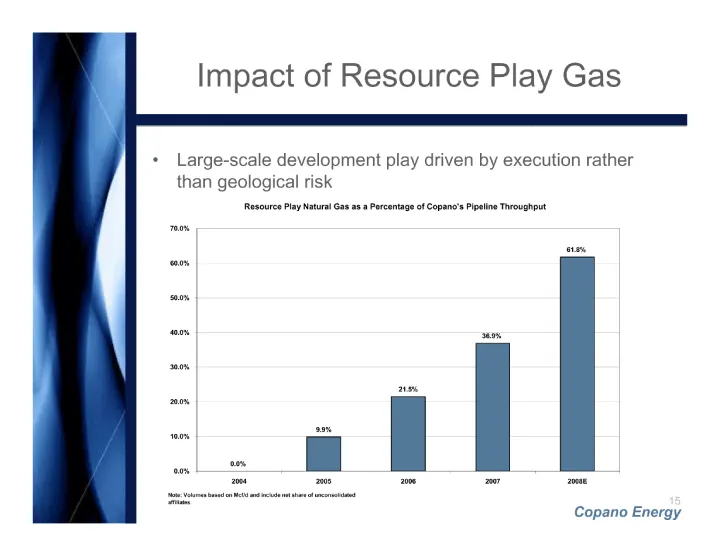
29 Impact of Resource Play Gas Large-scale development play driven by execution rather than geological risk
Slide 15: Bolt-On & Organic Growth
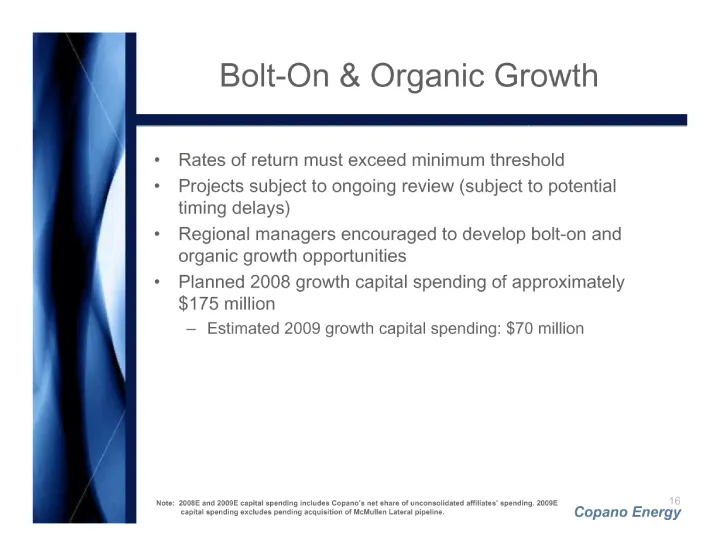
31 Bolt-On & Organic Growth Rates of return must exceed minimum threshold Projects subject to ongoing review (subject to potential timing delays) Regional managers encouraged to develop bolt-on and organic growth opportunities Planned 2008 growth capital spending of approximately $175 million Estima
Slide 16: Pending Bolt-On Acquisition
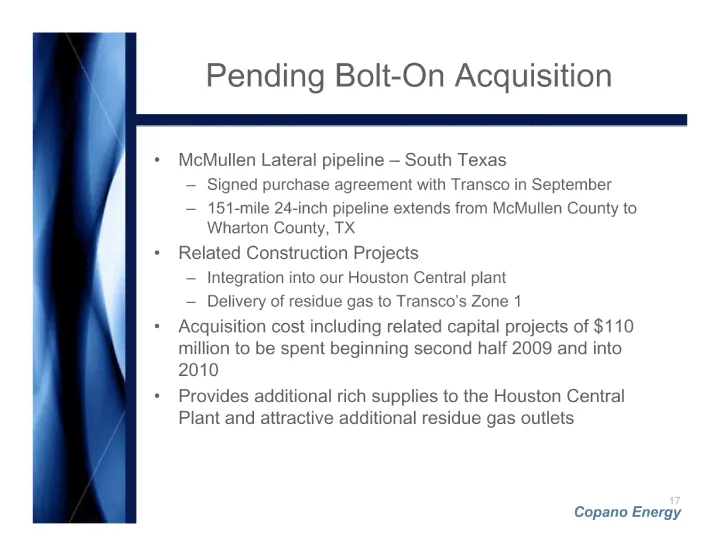
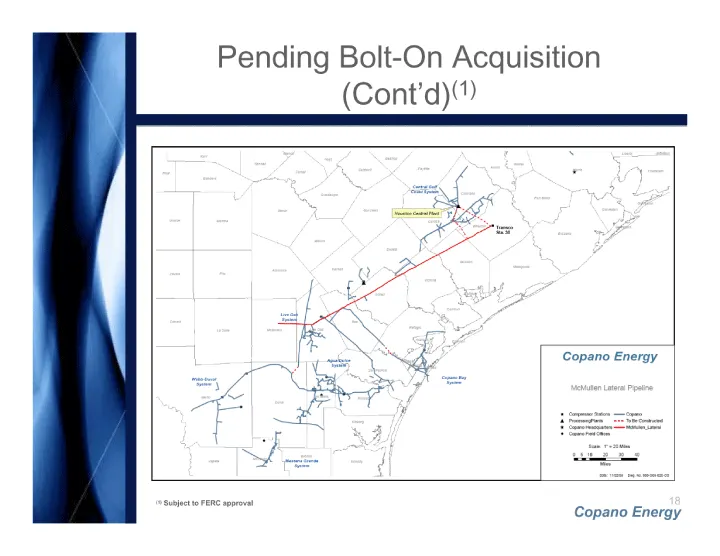
33 Pending Bolt-On Acquisition McMullen Lateral pipeline - South Texas Signed purchase agreement with Transco in September 151-mile 24-inch pipeline extends from McMullen County to Wharton County, TX Related Construction Projects Integration into our Houston Central plant Delivery of residue gas to
Slide 17: Pending Bolt-On Acquisition (Cont'd)
35 Pending Bolt-On Acquisition (Cont'd)(1) (1) Subject to FERC approval
Slide 18: Selected Recent Capital Projects
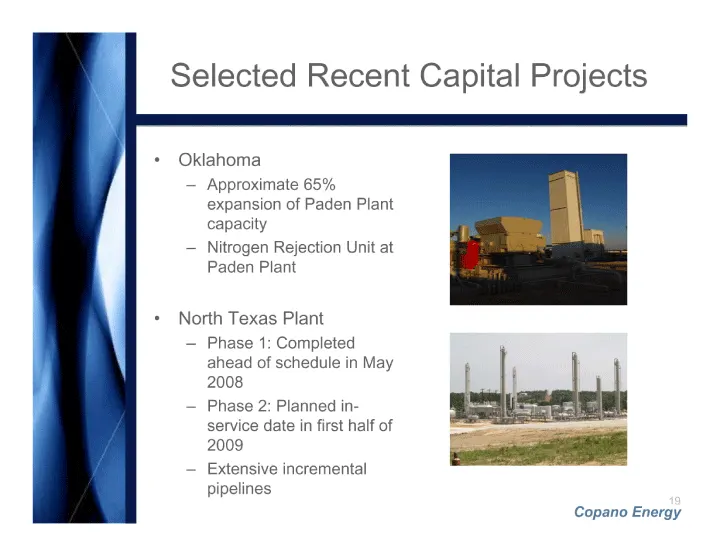
37 Selected Recent Capital Projects Oklahoma Approximate 65% expansion of Paden Plant capacity Nitrogen Rejection Unit at Paden Plant North Texas Plant Phase 1: Completed ahead of schedule in May 2008 Phase 2: Planned in-service date in first half of 2009 Extensive incremental pipelines
Slide 19: LLC Structure
39 LLC Structure LLC Structure Financial Strength Disciplined Growth Operations
Slide 20: Structure & Benefits
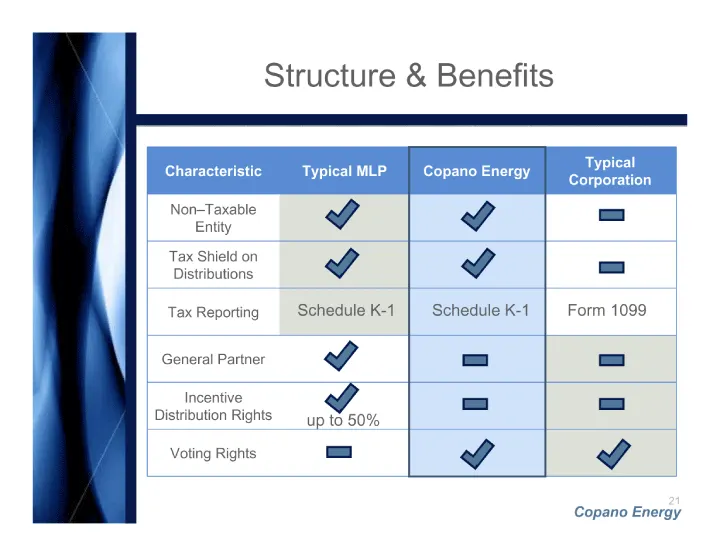
41 Structure & Benefits Characteristic Typical MLP Copano Energy Typical Corporation Non-Taxable Entity Tax Shield on Distributions Tax Reporting General Partner Incentive Distribution Rights Voting Rights up to 50% Schedule K-1 Schedule K-1 Form 1099
Slide 21: CPNO vs. Typical MLP Distributions
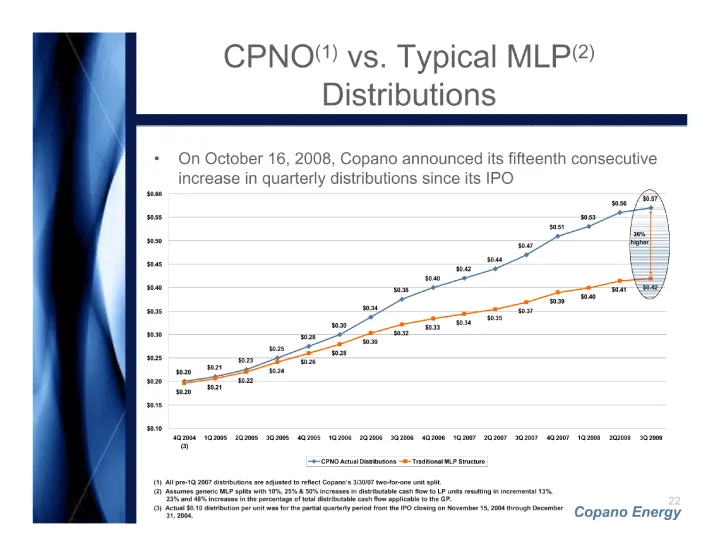
43 CPNO(1) vs. Typical MLP(2) Distributions On October 16, 2008, Copano announced its fifteenth consecutive increase in quarterly distributions since its IPO (1) All pre-1Q 2007 distributions are adjusted to reflect Copano's 3/30/07 two-for-one unit split. (2) Assumes generic MLP splits with 10%, 25
Slide 22: General Partner Incentive Distribution Loads
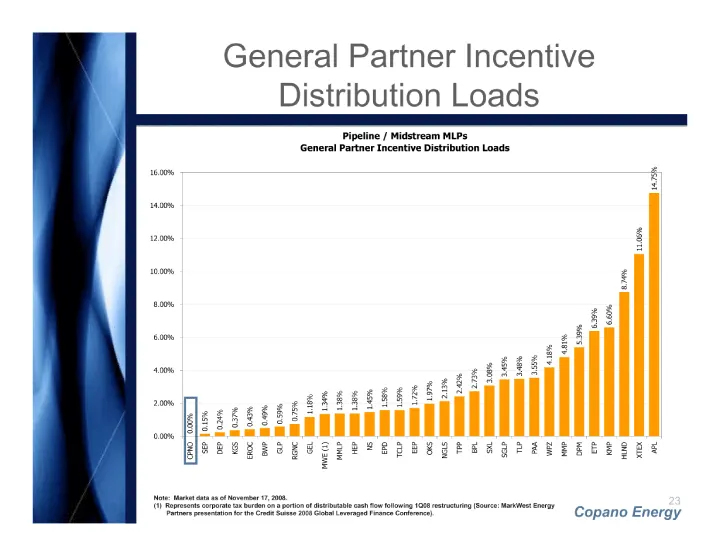
45 General Partner Incentive Distribution Loads Note: Market data as of November 17, 2008. (1) Represents corporate tax burden on a portion of distributable cash flow following 1Q08 restructuring (Source: MarkWest Energy Partners presentation for the Credit Suisse 2008 Global Leveraged Finance Confe
Slide 23: Financial Strength
47 Financial Strength Financial Strength LLC Structure Disciplined Growth Operations
Slide 24: Financial Structure
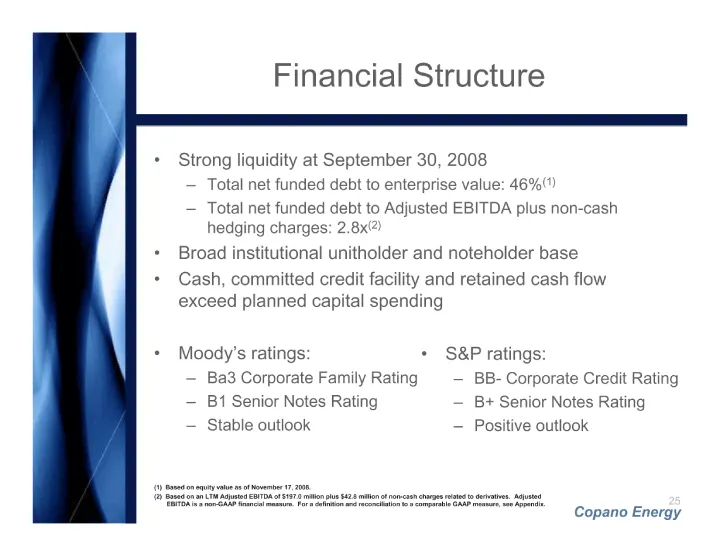
49 Financial Structure Strong liquidity at September 30, 2008 Total net funded debt to enterprise value: 46%(1) Total net funded debt to Adjusted EBITDA plus non-cash hedging charges: 2.8x(2) Broad institutional unitholder and noteholder base Cash, committed credit facility and retained cash flow ex
Slide 25: Financial Position
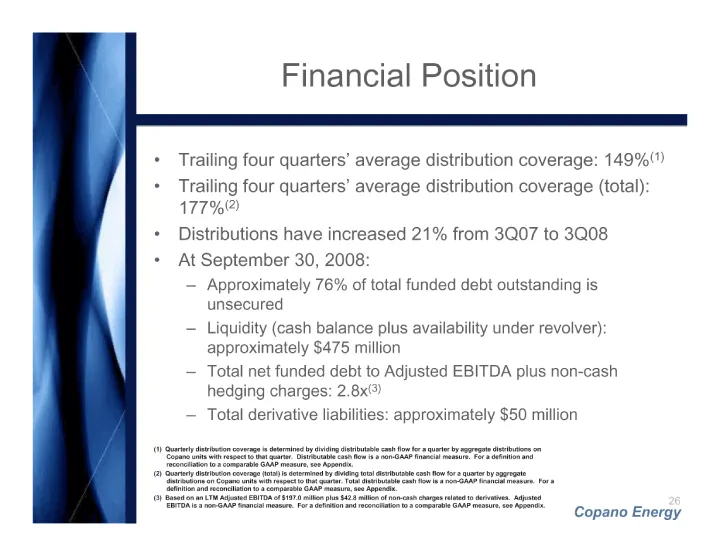
51 Financial Position Trailing four quarters' average distribution coverage: 149%(1) Trailing four quarters' average distribution coverage (total): 177%(2) Distributions have increased 21% from 3Q07 to 3Q08 At September 30, 2008: Approximately 76% of total funded debt outstanding is unsecured Liquid
Slide 26: Hedging Program and Risk Management
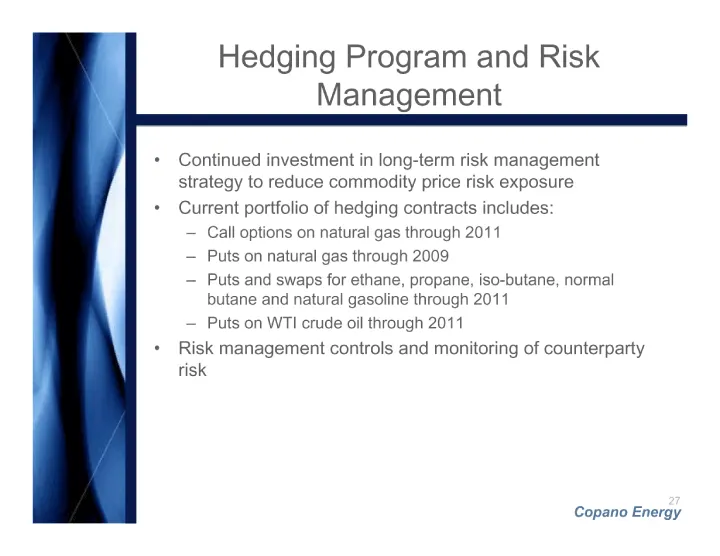
53 Hedging Program and Risk Management Continued investment in long-term risk management strategy to reduce commodity price risk exposure Current portfolio of hedging contracts includes: Call options on natural gas through 2011 Puts on natural gas through 2009 Puts and swaps for ethane, propane, iso
Slide 27: Experienced Management Team
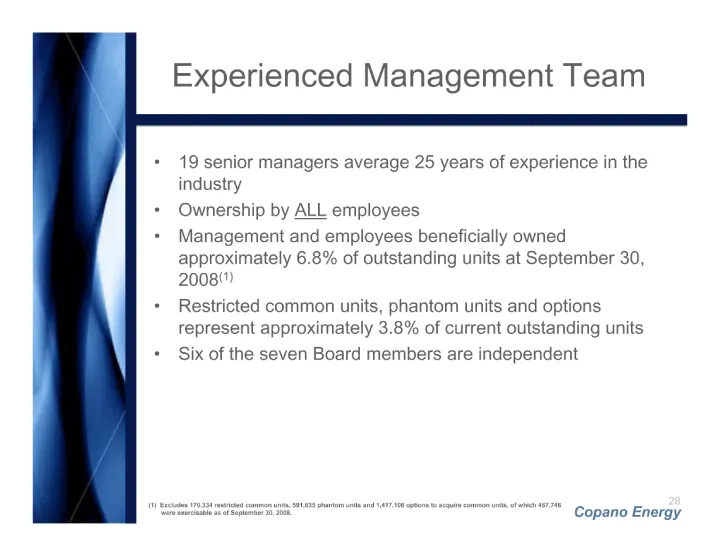
55 Experienced Management Team 19 senior managers average 25 years of experience in the industry Ownership by ALL employees Management and employees beneficially owned approximately 6.8% of outstanding units at September 30, 2008(1) Restricted common units, phantom units and options represent approx
Slide 28: Appendix
Appendix Copano Energy
Slide 29: Reconciliation of Non-GAAP Financial Measures: Adjusted EBITDA
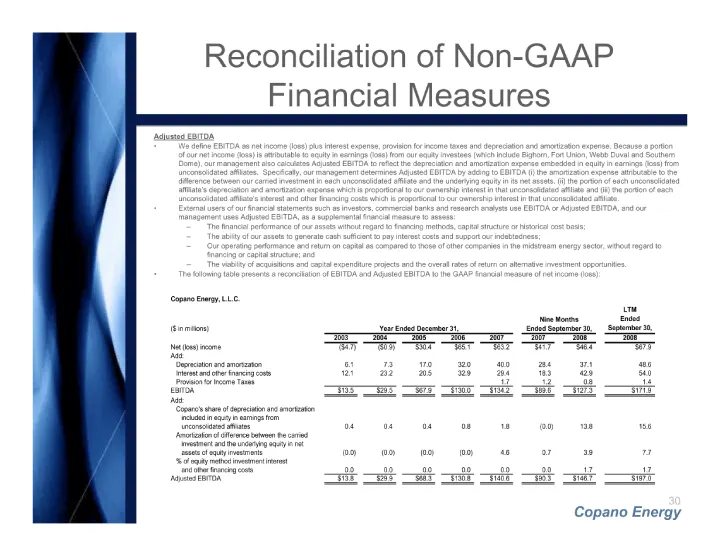
59 Reconciliation of Non-GAAP Financial Measures Adjusted EBITDA We define EBITDA as net income (loss) plus interest expense, provision for income taxes and depreciation and amortization expense. Because a portion of our net income (loss) is attributable to equity in earnings (loss) from our equity
Slide 30: Reconciliation of Non-GAAP Financial Measures: Distributable Cash Flow
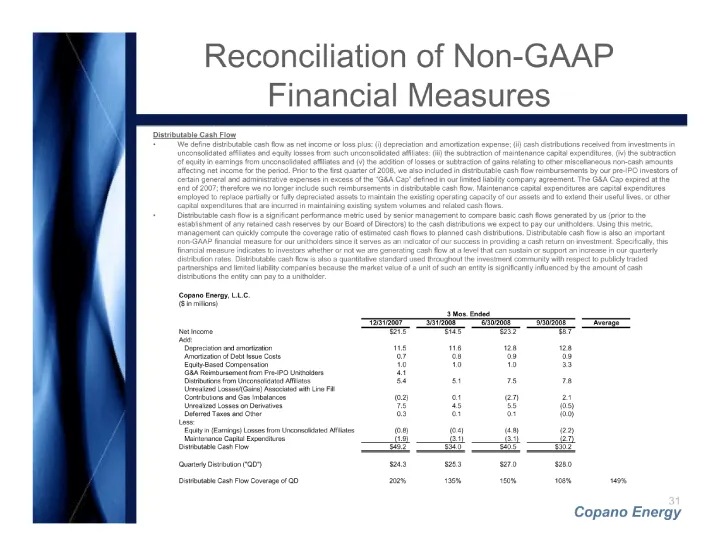
61 Reconciliation of Non-GAAP Financial Measures Distributable Cash Flow We define distributable cash flow as net income or loss plus: (i) depreciation and amortization expense; (ii) cash distributions received from investments in unconsolidated affiliates and equity losses from such unconsolidated
Slide 31: Reconciliation of Non-GAAP Financial Measures: Total Distributable Cash Flow
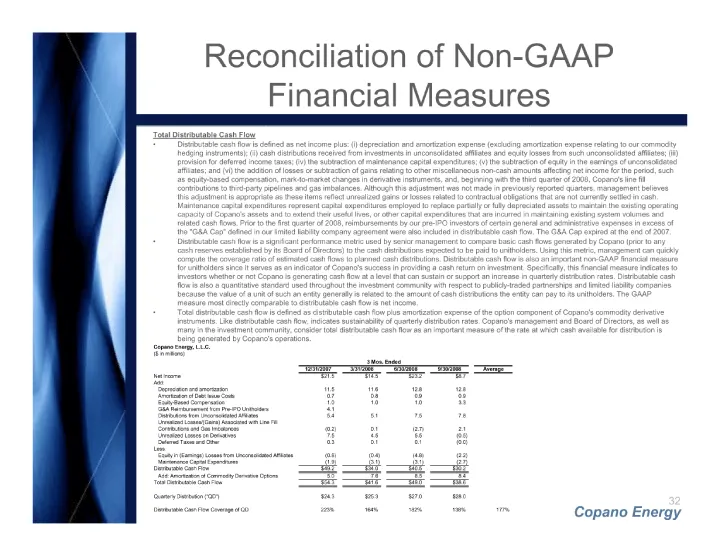
63 Reconciliation of Non-GAAP Financial Measures Total Distributable Cash Flow Distributable cash flow is defined as net income plus: (i) depreciation and amortization expense (excluding amortization expense relating to our commodity hedging instruments); (ii) cash distributions received from invest
Slide 32: Copano Energy
Copano Energy NASDAQ: CPNO.
Source: SEC EDGAR · 8-K filed Nov 19, 2008
More decks from Copano Energy L.L.C.
 2012 RBC Capital Markets MLP Conference35 slides · Nov 15, 2012
 2012 Citi One-on-One MLP/Midstream Infrastructure Conference35 slides · Aug 21, 2012
 Investor Presentation (June 2012)34 slides · Jun 18, 2012
 NAPTP 2012 MLP Investor Conference34 slides · May 22, 2012
 Morgan Stanley MLP and Diversified Natural Gas Corporate Access Day 201245 slides · Mar 7, 2012
 2011 RBC Capital Markets MLP Conference42 slides · Nov 17, 2011