Copano Energy L.L.C — 2012 Citi One-on-One MLP/Midstream Infrastructure Conference
35 slides from Copano Energy L.L.C's conference presentation, Aug 21, 2012

Slide 1: 2012 Citi One-on-One MLP/Midstream Infrastructure Conference
2012 Citi One-on-One MLP/Midstream Infrastructure Conference August 22-23, 2012 NASDAQ: CPNO
Slide 2: Disclaimer
Disclaimer Forward-Looking Statements This presentation includes “forward-looking statements,” as defined in the federal securities laws. Statements that address activities or events that Copano believes will or may occur in the future are forward-looking statements. These statements include, but ar
Slide 3: Eagle Ford Shale to Drive Long-Term Value
Eagle Ford Shale to Drive Long-Term Value Eagle Ford Shale play considered one of the best in North America • Size, quality and proximity to markets Copano created and investing $1 billion in organic projects • Pipelines, processing, NGL and condensate handling • Capital invested at 5x multiple Exec
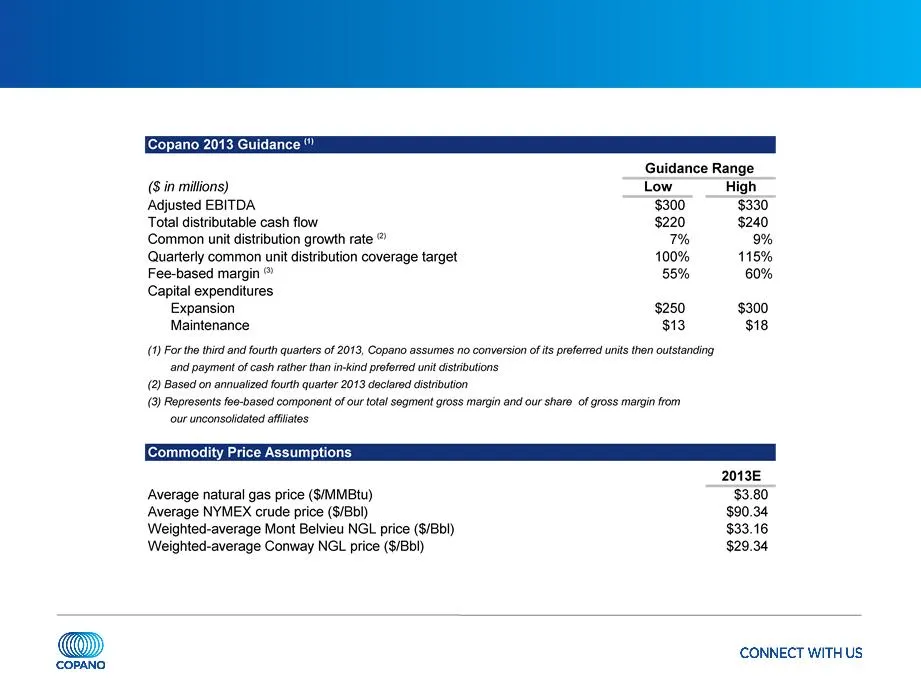
Slide 4: 2013 Guidance Reflects Initial Impact of Eagle Ford Projects
2013 Guidance Reflects Initial Impact of Eagle Ford Projects Note: Please refer to 2Q 2012 earnings press release (issued August 8, 2012) for additional key assumptions underlying 2013 guidance.
Slide 5: Organic Projects Business Segment
Organic Projects Business Segment Texas & Oklahoma \ Updates Finance & Commodity Risk Management
Slide 6: DK Pipeline Southwest Extension
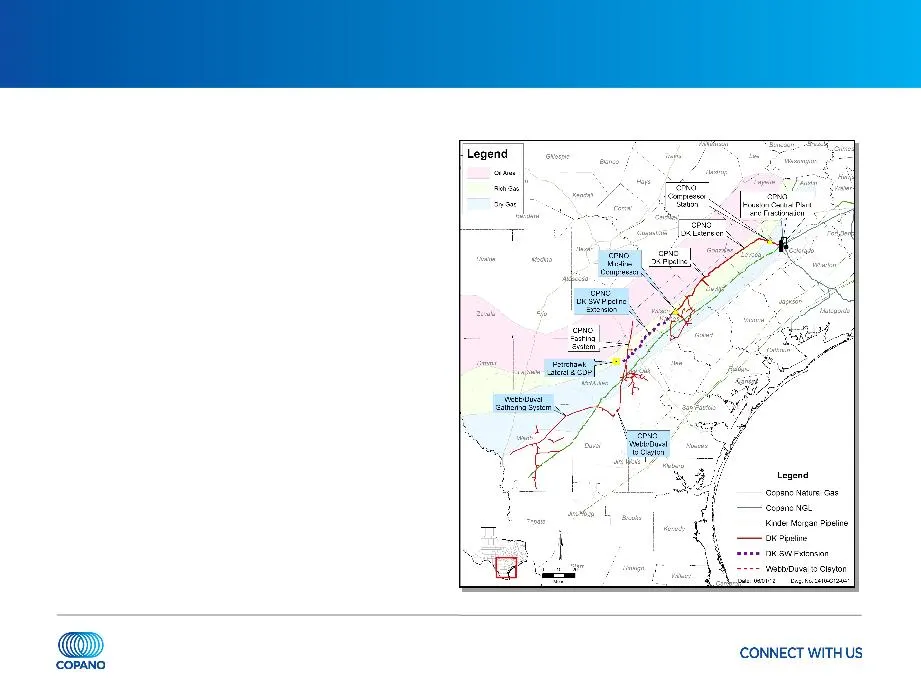
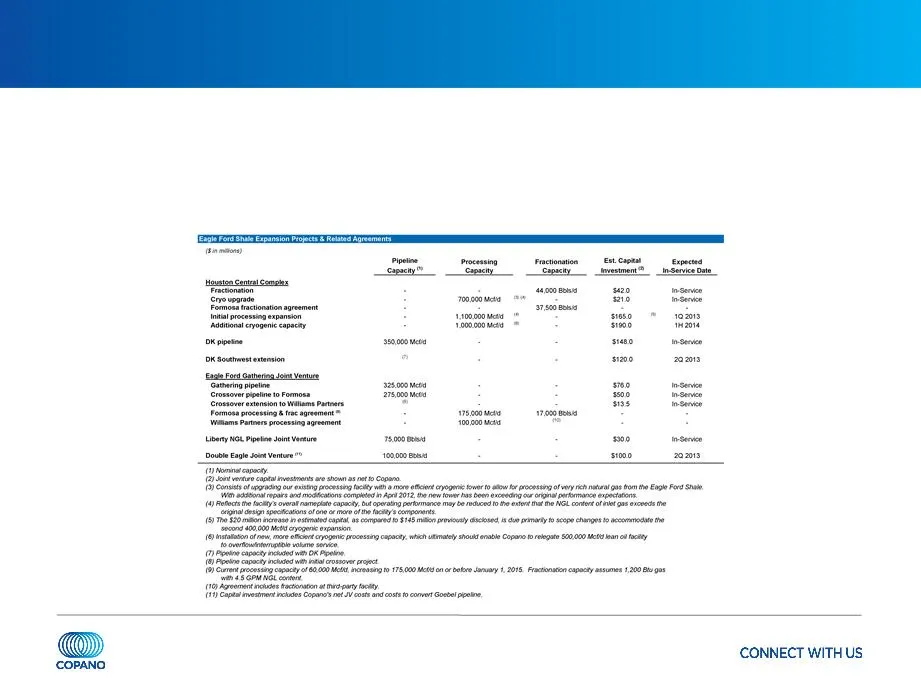
DK Pipeline Southwest Extension Further extend DK pipeline by adding approximately 65 miles of 24” pipeline southwest into McMullen County • Provides access to significant new Eagle Ford Shale volumes • Ties additional existing Copano gathering systems directly to Houston Central complex • Supported
Slide 7: Double Eagle Condensate Pipeline Joint Venture
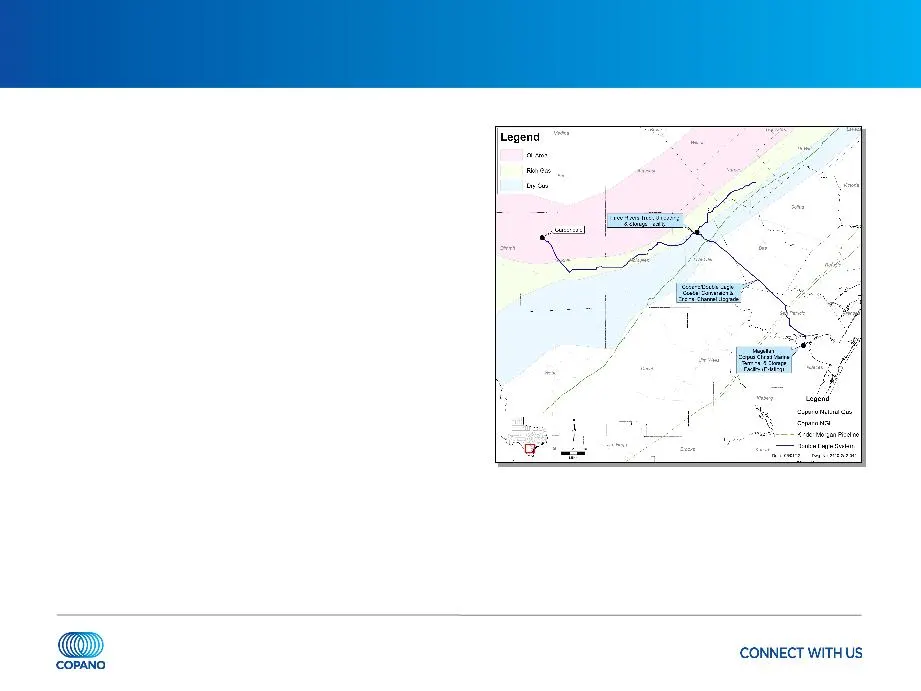
Double Eagle Condensate Pipeline Joint Venture 50/50 JV with Magellan Midstream • Utilizes Copano’s existing 14” Goebel pipeline and dual-line rights of way • 100,000 Bbls/d of nominal capacity • Ties into existing and expanded Magellan storage and loading docks at the Port of Corpus Christi • Inter
Slide 8: Houston Central Complex Expansion Projects
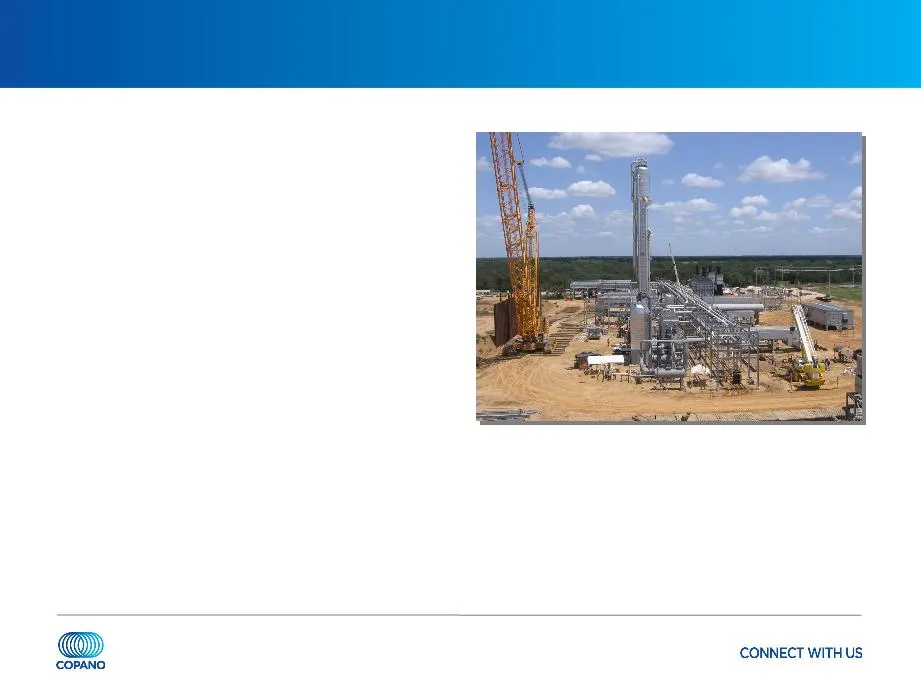
Houston Central Complex Expansion Projects New 400 MMcf/d cryogenic expansion expected in service 1Q 2013 • Average NGL recoveries will improve when the new cryogenic expansion comes online • When Formosa’s new fractionator becomes operational in 2Q 2013, recoveries will further improve • Estimated
Slide 9: Houston Central Complex Expansion Projects
Houston Central Complex Expansion Projects Second 400 MMcf/d cryogenic expansion further enhances NGL recoveries when placed in service in mid-2014 • Supported by long-term producer contract and higher recovery rates • Expected capital investment of $190 million at a 5x multiple Following second cry
Slide 10: Summary of Eagle Ford Shale Infrastructure
Summary of Eagle Ford Shale Infrastructure Announced total capital investment of over $950 million In excess of 1 Bcf/d of pipeline and processing capacity Greater than 100,000 Bbls/d of fractionation capacity
Slide 11: Mississippi Lime Play
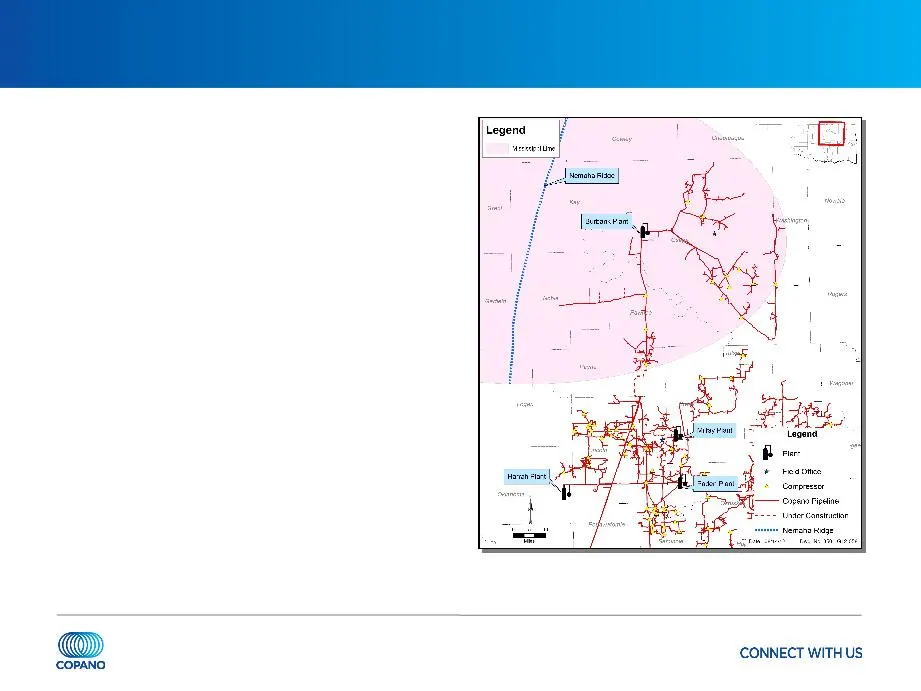
Mississippi Lime Play Focused on the eastern side of the play (east of the Nemaha ridge) • Volumes tend to have higher NGL and nitrogen content compared to the western side of the play Approaching roughly 50,000 acres in dedications from multiple producers Commenced construction of pipeline connecti

Slide 12: Organic Projects - Texas & Oklahoma Agenda Business Segment Updates
Organic Projects - Texas & Oklahoma Agenda Business Segment Updates Business Segment Updates Finance & Commodity Risk Management Organic Projects Texas & Oklahoma Finance & Commodity Risk Management
Slide 13: Recent Developments
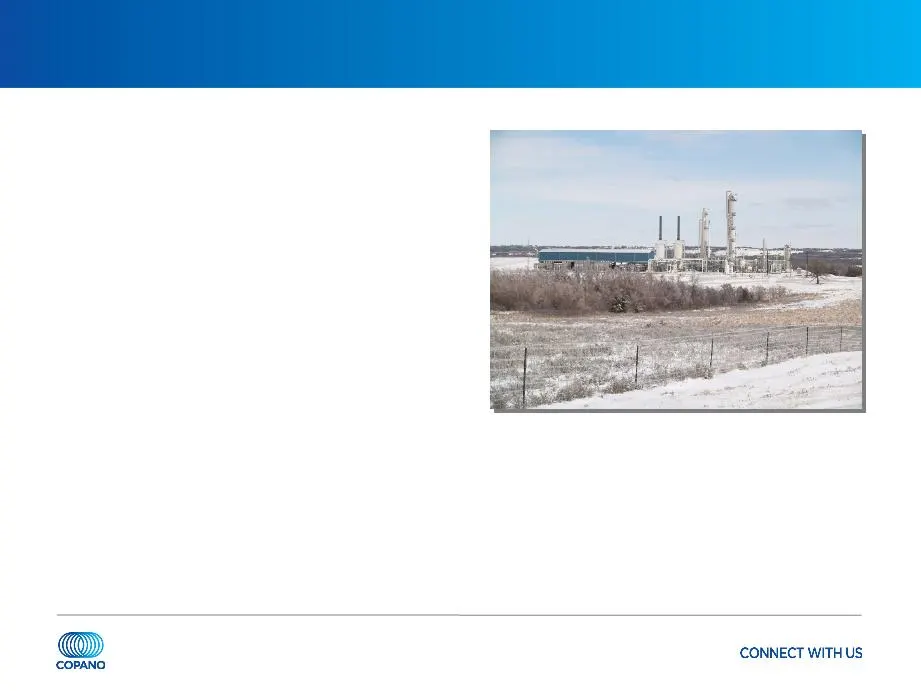
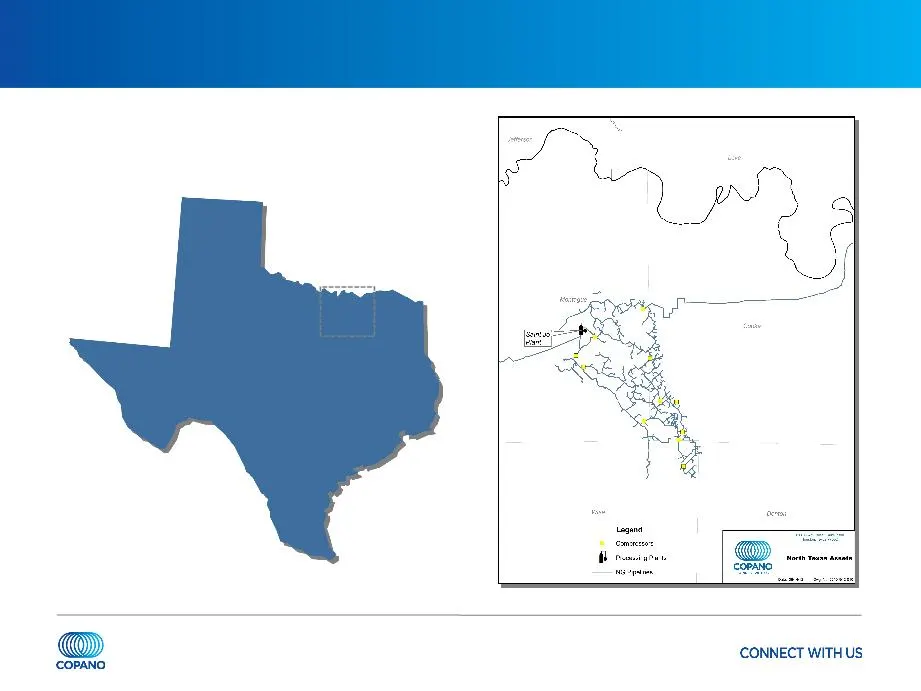
Recent Developments Saint Jo system - north Barnett Shale Combo • Plant fully committed under long-term, fee-based contracts • Plant running at or above nameplate capacity • Southeast extension of Saint Jo gathering system - Gathered volumes are incremental to current processed volumes - Expect init
Slide 14: Texas Outlook
Texas Outlook Eagle Ford Shale • Approximately 250 rigs currently running in the Eagle Ford Shale • Continue to expect volume increases on both wholly owned and joint venture assets for the balance of 2012 and beyond North Barnett Shale Combo • Copano’s largest producer continues an active drilling
Slide 15: Oklahoma Outlook
Oklahoma Outlook Rich gas (primarily Hunton dewatering and Mississippi Lime) • Drilling activity steady in 3Q 2012 compared to 2Q 2012 • 2 rigs running in the Hunton, 8 rigs in the Mississippi Lime and 7 rigs in other rich gas areas • In the Mississippi Lime, volume growth expected as drilling activ
Slide 16: Rocky Mountains Outlook
Rocky Mountains Outlook Drilling and dewatering activity will be driven by commodity prices and producer economics • 3Q 2012 volumes for Bighorn expected to be lower compared to 2Q 2012 • 3Q 2012 volumes for Fort Union expected to be lower compared to 2Q 2012 3Q 2012 Adjusted EBITDA expected to be $
Slide 17: Finance & Commodity Risk Management
Organic Projects - Texas & Oklahoma Agenda Finance & Commodity Risk Management Business Segment Updates Finance & Commodity Risk Management Organic Projects Texas & Oklahoma Business Segment Updates
Slide 18: Liquidity and Capitalization
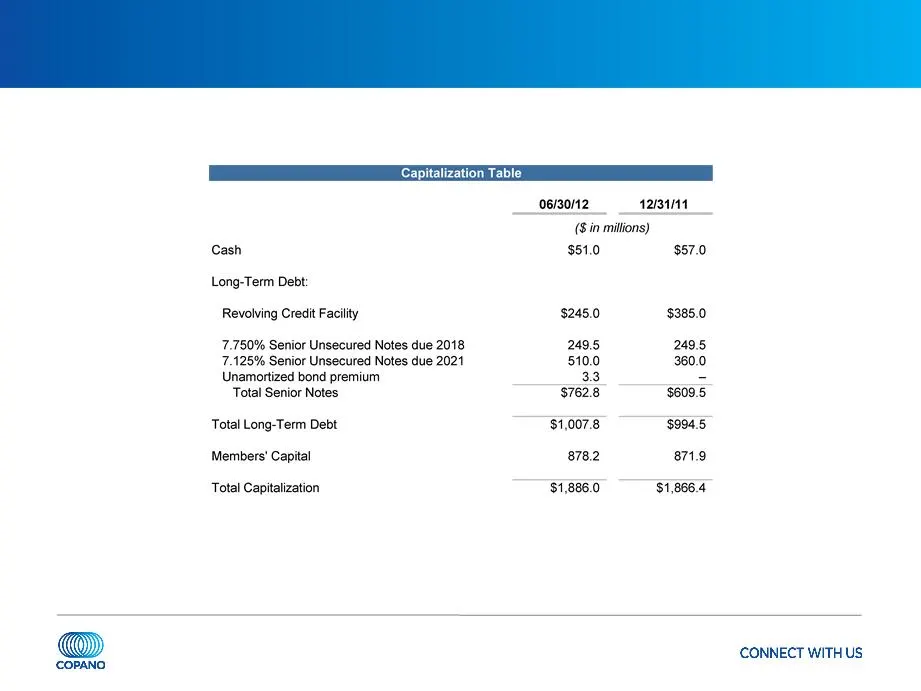
Liquidity and Capitalization As of June 30, 2012, total available liquidity approximately $284 million On July 30, 2012, S&P lowered Copano’s corporate credit rating and senior unsecured rating to B+ and B, respectively
Slide 19: Shifting Contract Mix
Shifting Contract Mix Contract Mix as a % of Gross Margin 2Q 2010 4Q 2011 2Q 2012 2013P Fee-based 33% 48% 62% 55-60% Percentage-of- proceeds 31% 26% 18% Keep-whole/Other 33% 41% 16% Net hedging 3% -15% 4% Net commodity exposed 67% 52% 38% 40-45% Continued shift towards a more fee-based mix • Eagle F
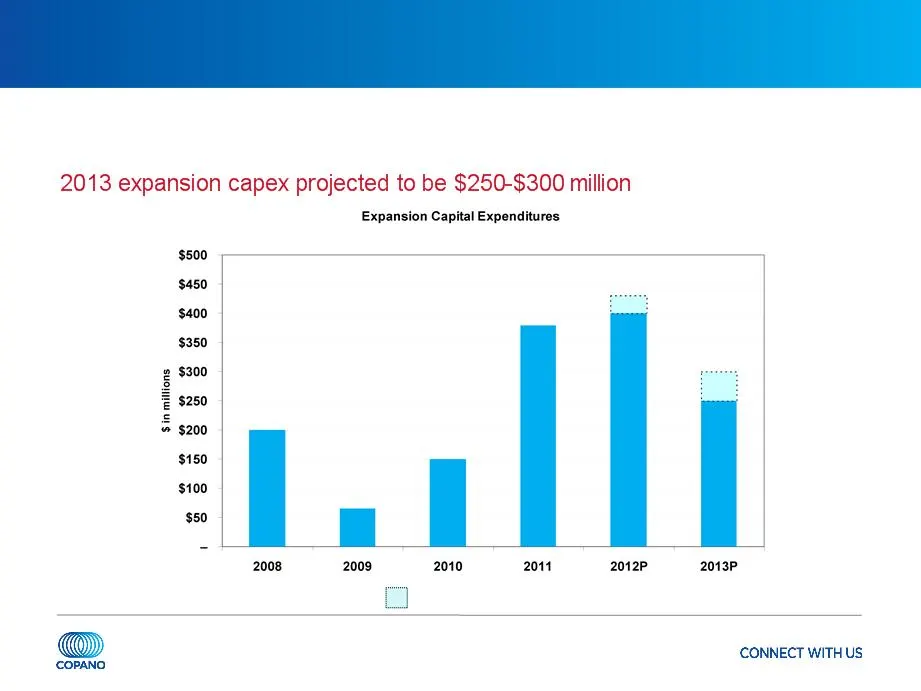
Slide 20: Expansion Capital Expenditures
Expansion Capital Expenditures Board-approved 2012 expansion capex of $400-$430 million Guidance Range
Slide 21: Hedging Strategy
Hedging Strategy Continued shift towards a more fee-based contract mix • Reliance on hedging will decrease as contract mix changes over time 2012 hedged near policy limits for all products except ethane • Approximately 90% of propane, butane, natural gasoline and condensate exposure hedged • Approxi

Slide 22: Appendix
Appendix
Slide 23: fer
] fer @M CONNECT WITH US ‘COPANO
Slide 24: South Texas Assets
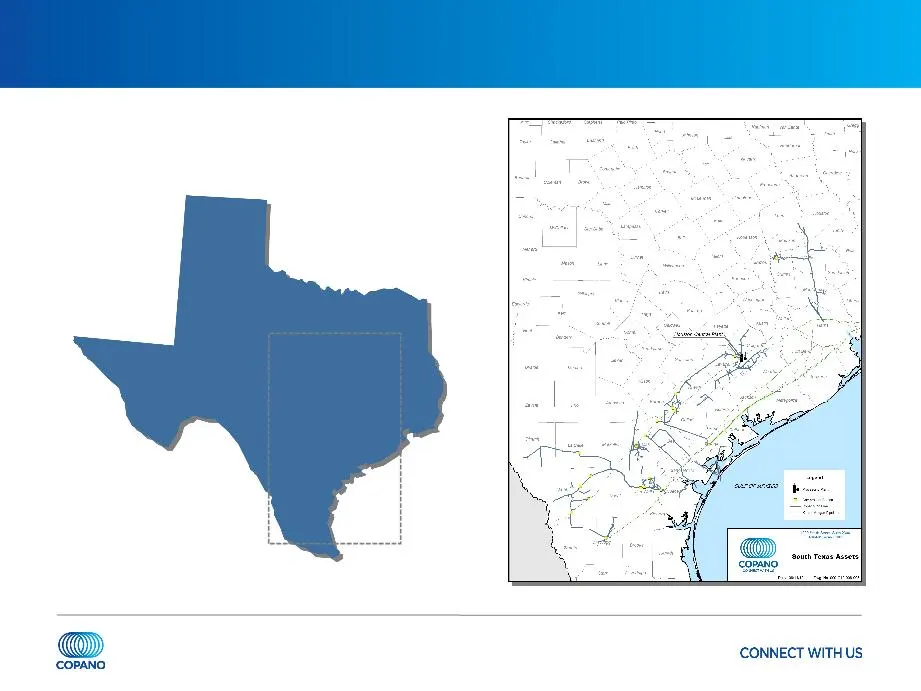
South Texas Assets TEXAS
Slide 25: Connect With Us
@M CONNECT WITH US ‘COPANO
Slide 26: Rocky Mountains Assets
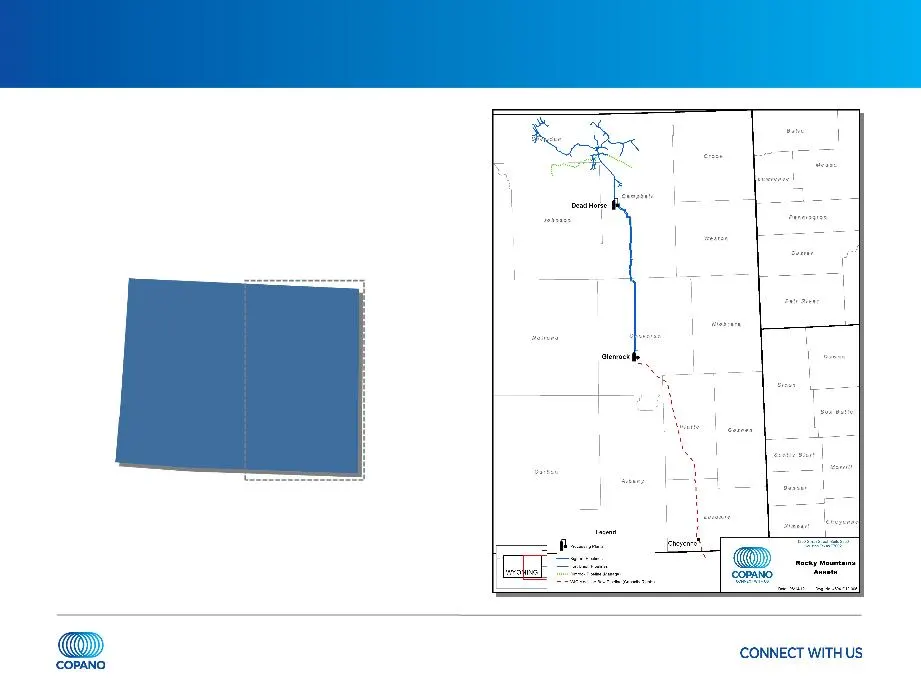
Rocky Mountains Assets WYOMING
Slide 27: Commodity-Related Margin Sensitivities
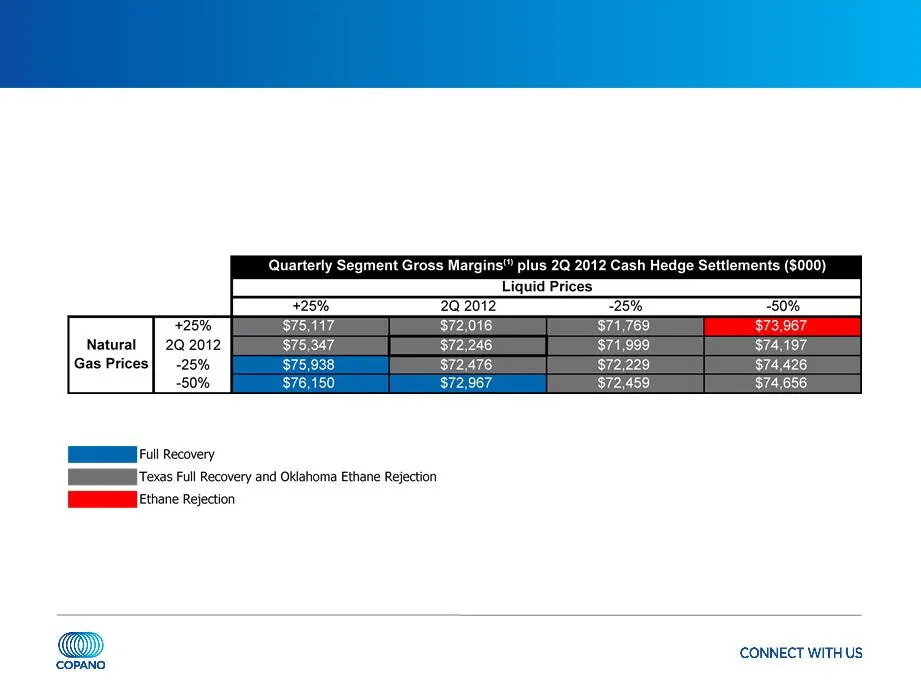
Commodity-Related Margin Sensitivities Matrix reflects 2Q 2012 wellhead and plant inlet volumes, adjusted using Copano’s 2012 planning models (1) Consists of Texas and Oklahoma Segment gross margins.
Slide 28: Texas Net Commodity Exposure
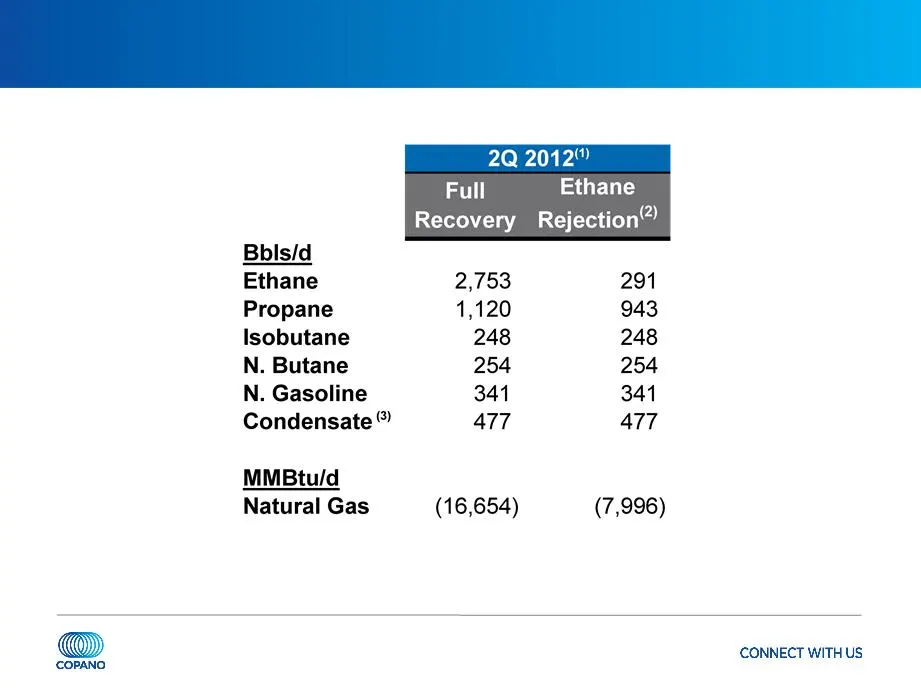
Texas Net Commodity Exposure Note: See explanation of processing modes in this Appendix. (1) Source: Copano Energy internal financial planning models. Based on 2Q 2012 daily wellhead/plant inlet volumes. (2) Fractionation at Houston Central complex permits significant reductions in ethane recoveries
Slide 29: Texas Commodity Price Sensitivities
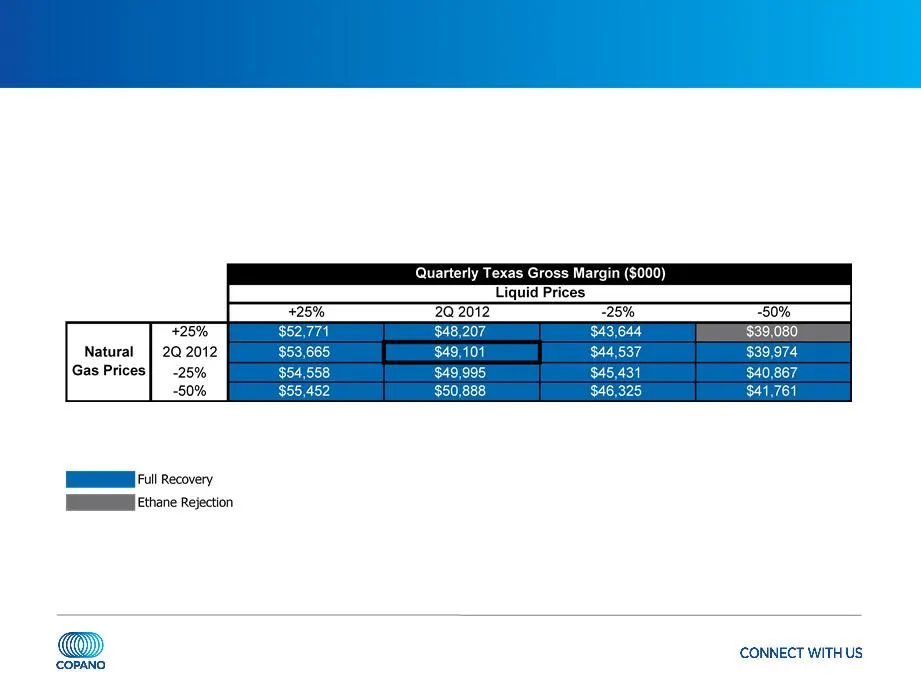
Texas Commodity Price Sensitivities Texas segment gross margins excluding hedge settlements • Matrix reflects 2Q 2012 volumes and operating conditions, adjusted using Copano’s 2012 planning models Note: Please see this Appendix for definitions of processing modes and additional details.
Slide 30: Oklahoma Net Commodity Exposure
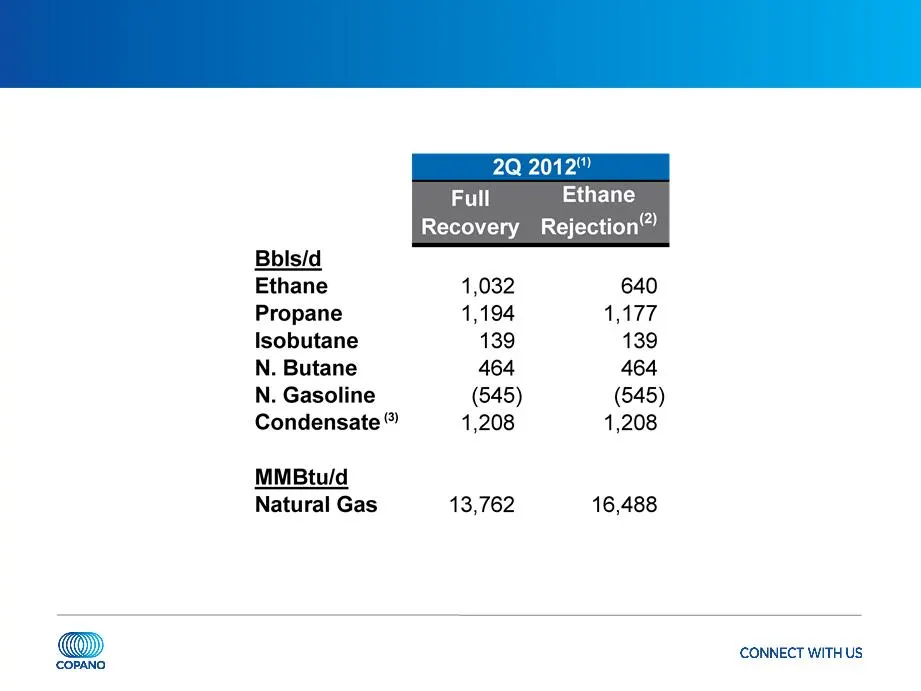
Oklahoma Net Commodity Exposure Note: See explanation of processing modes in this Appendix. Values reflect rounding. (1) Source: Copano Energy internal financial planning models. Based on 2Q 2012 daily wellhead/plant inlet volumes. (2) Ethane rejection at Paden plant is limited by nitrogen rejection
Slide 31: Oklahoma Commodity Price Sensitivities
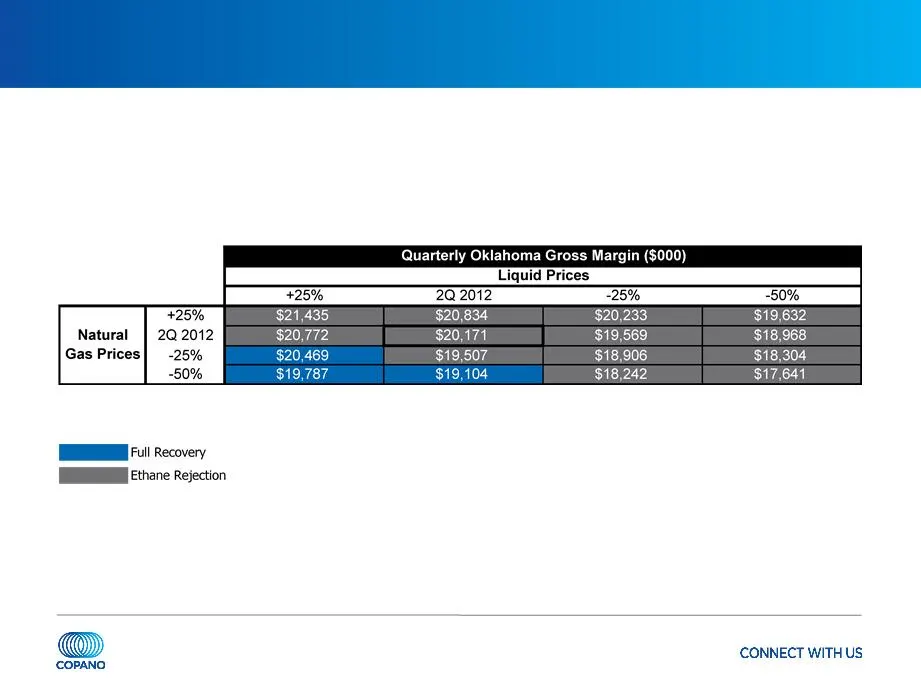
Oklahoma Commodity Price Sensitivities Oklahoma segment gross margins excluding hedge settlements • Matrix reflects 2Q 2012 volumes, adjusted using Copano’s 2012 planning models Note: Please see this Appendix for definitions of processing modes and additional details.
Slide 32: Rocky Mountains Sensitivities
Rocky Mountains Sensitivities 2Q 2012 Adjusted EBITDA volume sensitivity (positive or negative impact) • Bighorn: 10,000 MMBtu/d = $254,000 (1) • Fort Union: 10,000 MMBtu/d = immaterial impact until physical volumes exceed long-term contractual volume commitments - 2Q 2012 pipeline throughput: 626,1
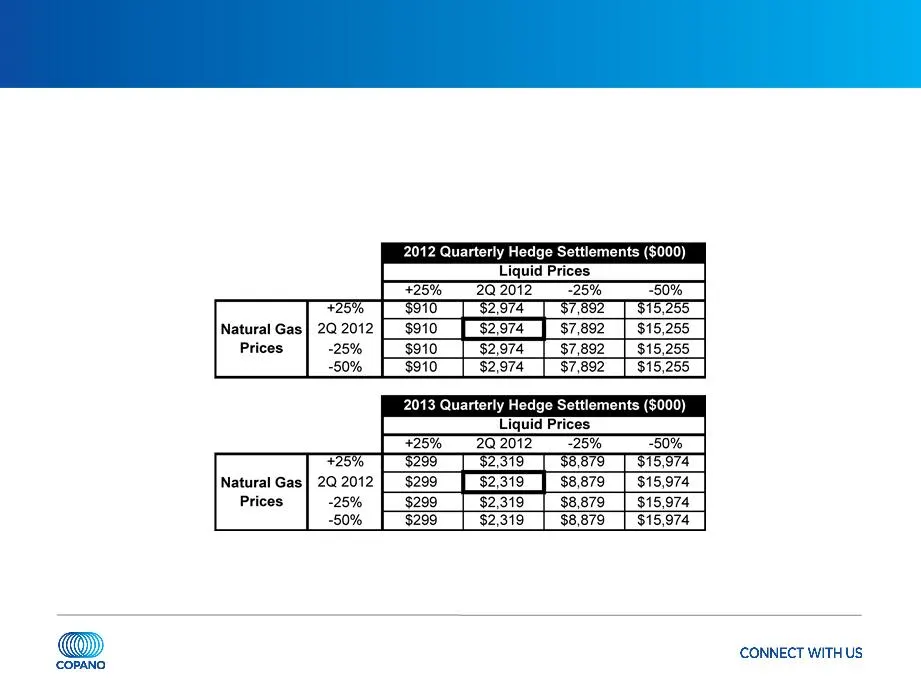
Slide 33: Hedging Impact of Commodity Price Sensitivities
Hedging Impact of Commodity Price Sensitivities Commodity hedging program supplements cash flow in 2012 through 2013 during less favorable commodity price periods
Slide 34: Processing Modes
Processing Modes Full Recovery Texas and Oklahoma - If the value of recovered NGLs exceeds the fuel and gas shrinkage costs of recovering NGLs Ethane Rejection Texas and Oklahoma - If the value of ethane is less than the fuel and shrinkage costs to recover ethane (in Oklahoma, ethane rejection at Pa
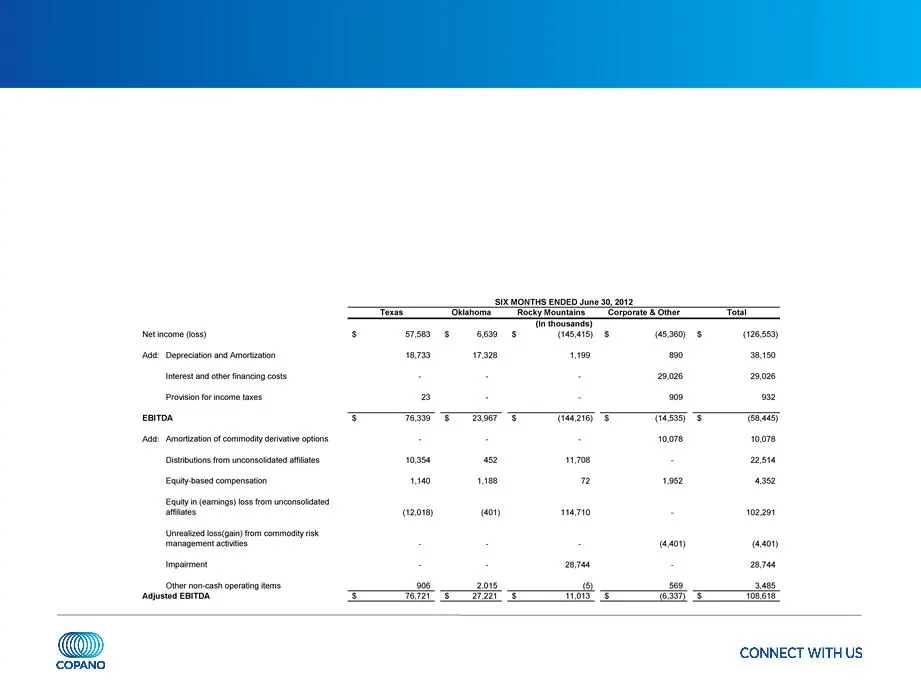
Slide 35: Reconciliation of Non-GAAP Financial Measures
Reconciliation of Non-GAAP Financial Measures Adjusted EBITDA • We define adjusted EBITDA as: - net income (loss); - plus interest and other financing costs, provision for income taxes, depreciation, amortization and impairment expense, non-cash amortization expense associated with our commodity der
Source: SEC EDGAR · 8-K filed Aug 21, 2012
More decks from Copano Energy L.L.C.
 2012 RBC Capital Markets MLP Conference35 slides · Nov 15, 2012
 Investor Presentation (June 2012)34 slides · Jun 18, 2012
 NAPTP 2012 MLP Investor Conference34 slides · May 22, 2012
 Morgan Stanley MLP and Diversified Natural Gas Corporate Access Day 201245 slides · Mar 7, 2012
 2011 RBC Capital Markets MLP Conference42 slides · Nov 17, 2011
 Deutsche Bank 19th Annual Leveraged Finance Conference 201143 slides · Oct 12, 2011