Diamond Foods — Investor Presentation (May 2006)
18 slides from Diamond Foods's investor presentation, May 22, 2006
Slide 1: Diamond Foods, Inc. Company Presentation May 2006
Diamond Foods, Inc. Company Presentation May 2006
Slide 2: Important Information: Forward-Looking Statements
Important Information Forward-Looking Statements This material contains forward-looking statements, including forecasts of growth, long- term financial goals, expanding margins, industry growth and our strategic plans, that involve known and unknown risks and uncertainties that may cause actual resu
Slide 3: Investment Considerations
Investment Considerations Strong and leveragable core business Proven track record of innovation and growth New market and channel expansion Focus on high margin opportunities Increasing infrastructure efficiencies Experienced management team
Slide 4: Our Four Product Lines
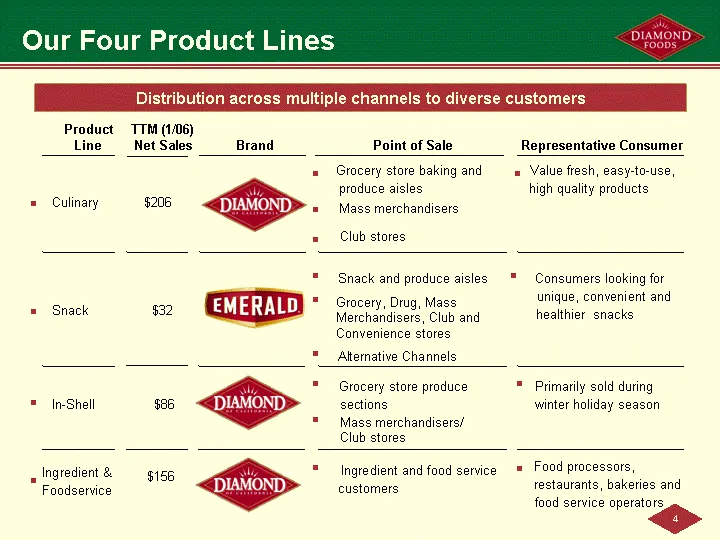
Our Four Product Lines Distribution across multiple channels to diverse customers Product Line TTM (1/06) Net Sales Brand Point of Sale Representative Consumer Culinary $206 n Grocery store baking and produce aisles n Mass merchandisers n Club stores n Value fresh, easy-to-use, high quality products
Slide 5: Blue Chip Customer Base
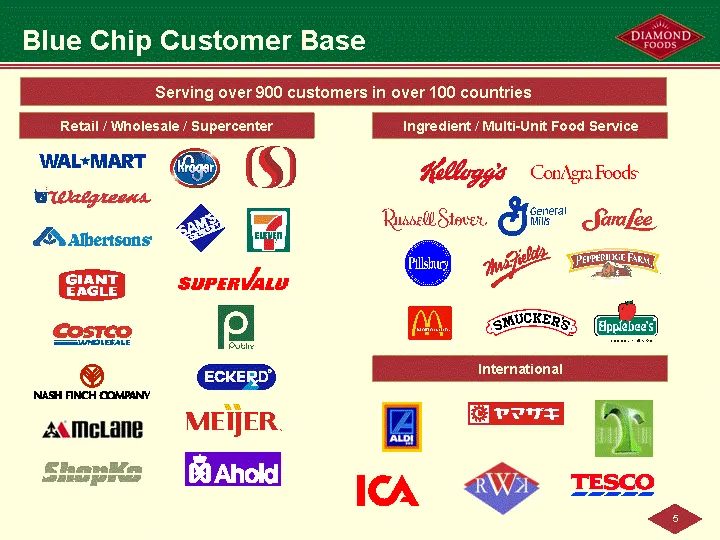
Blue Chip Customer Base Retail / Wholesale / Supercenter Ingredient / Multi-Unit Food Service International Serving over 900 customers in over 100 countries
Slide 6: Strong Brand Recognition
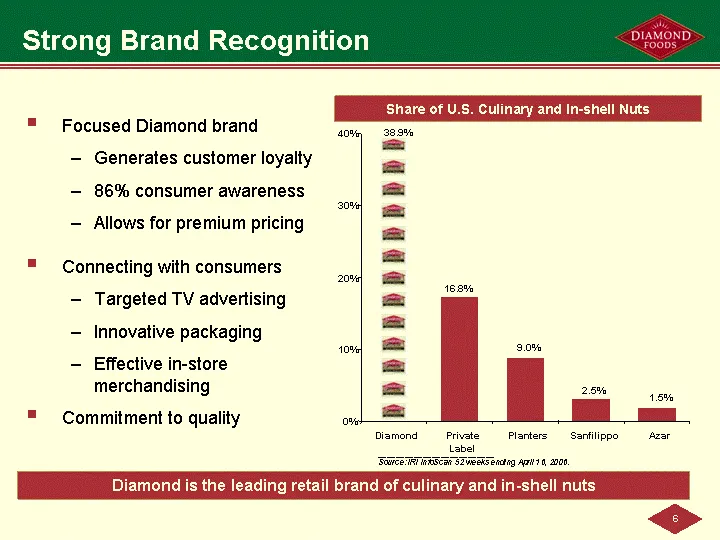
Strong Brand Recognition Share of U.S. Culinary and In-shell Nuts __________________________ Source: IRI InfoScan 52 weeks ending April 16, 2006. Focused Diamond brand Generates customer loyalty 86% consumer awareness Allows for premium pricing Connecting with consumers Targeted TV advertising Innov
Slide 7: Building Upon Our Brand Heritage
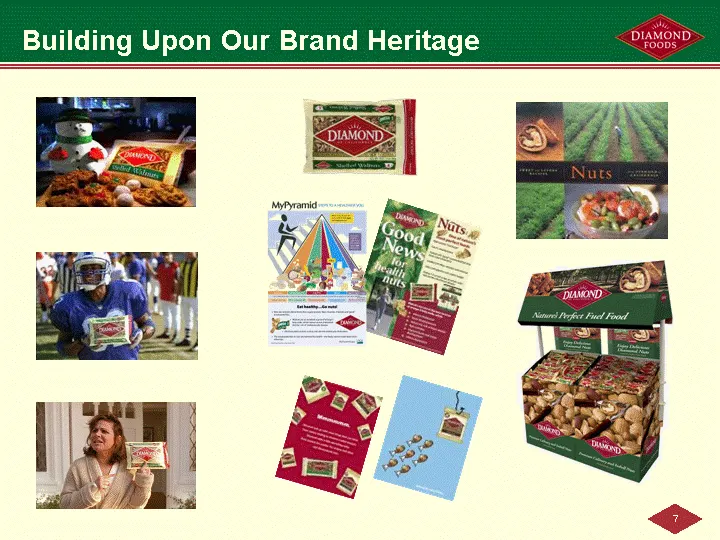
Building Upon Our Brand Heritage
Slide 8: Emerald Opportunity
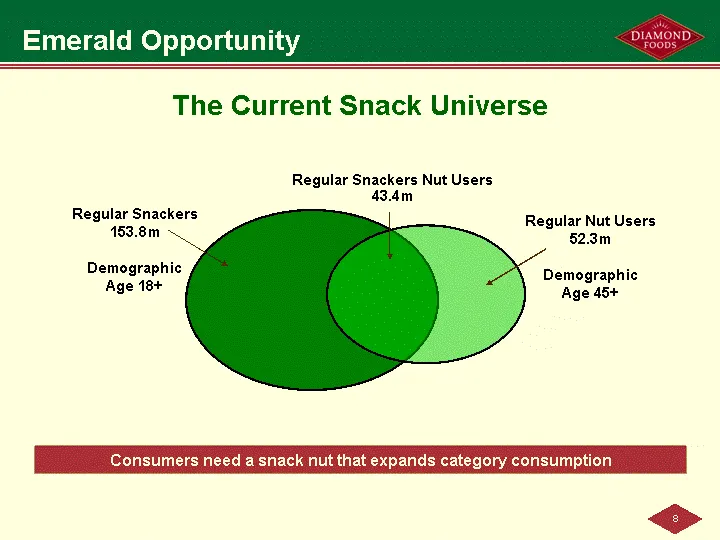
Emerald Opportunity The Current Snack Universe Regular Snackers Nut Users 43.4m Regular Nut Users 52.3m Demographic Age 45+ Regular Snackers 153.8m Demographic Age 18+ Consumers need a snack nut that expands category consumption
Slide 9: Successful Record of Product Innovations
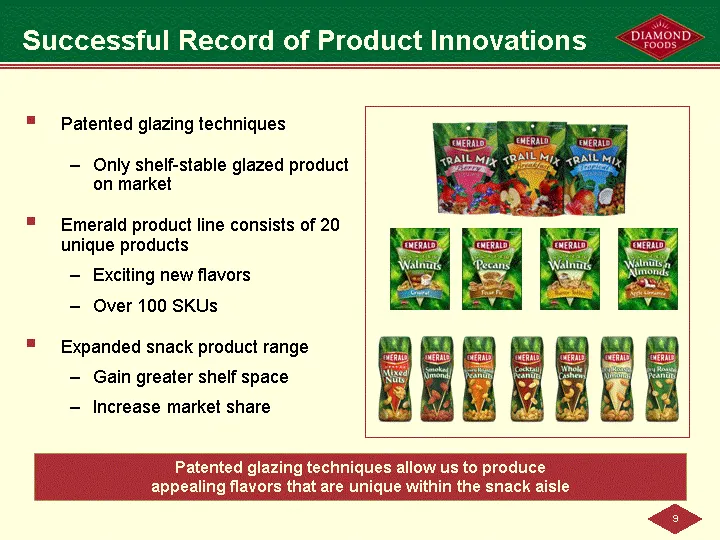
Successful Record of Product Innovations Patented glazing techniques Only shelf-stable glazed product on market Emerald product line consists of 20 unique products Exciting new flavors Over 100 SKUs Expanded snack product range Gain greater shelf space Increase market share Patented glazing techniqu
Slide 10: Successful Record of Packaging Innovations
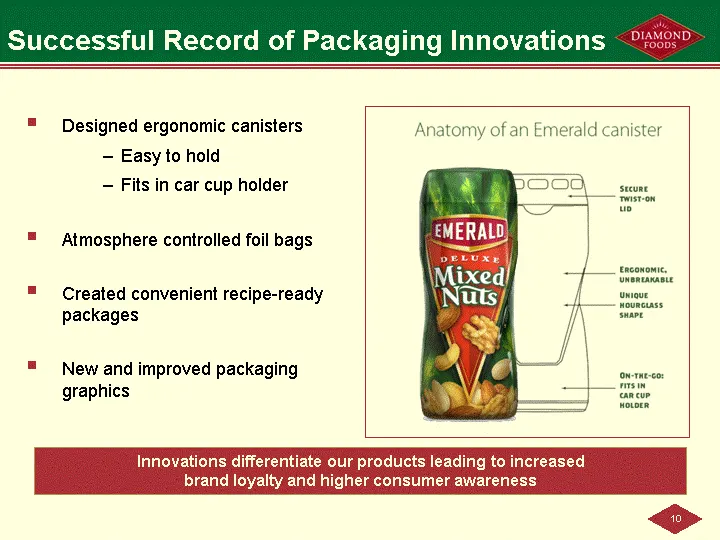
Successful Record of Packaging Innovations Designed ergonomic canisters Easy to hold Fits in car cup holder Atmosphere controlled foil bags Created convenient recipe-ready packages New and improved packaging graphics Innovations differentiate our products leading to increased brand loyalty and highe
Slide 11: Building a Consumer Snack Power
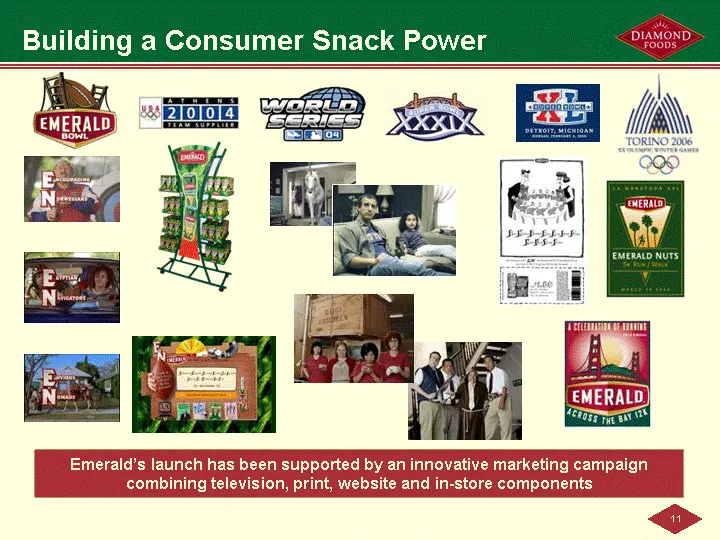
Building a Consumer Snack Power Emerald's launch has been supported by an innovative marketing campaign combining television, print, website and in-store components
Slide 12: Increased Snack Nut Sales
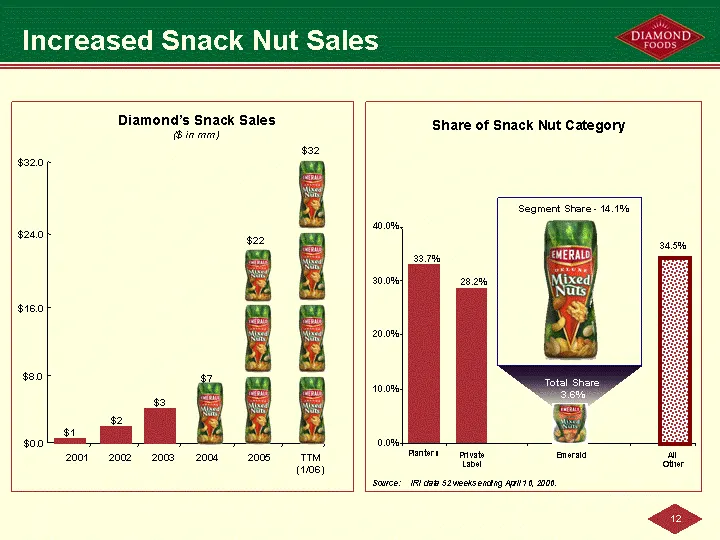
33.7% 0.0% 10.0% 20.0% 30.0% 40.0% Planters Private Label Emerald $1 $2 $3 $7 $0.0 $8.0 $16.0 $24.0 $32.0 2001 2003 2004 2005 TTM (1/06) Increased Snack Nut Sales Diamond's Snack Sales ($ in mm) Share of Snack Nut Category Source: IRI data 52 weeks ending April 16, 2006. 3.6% 2002 $32 $22 28.2% 34.5
Slide 13: Emerald Progress
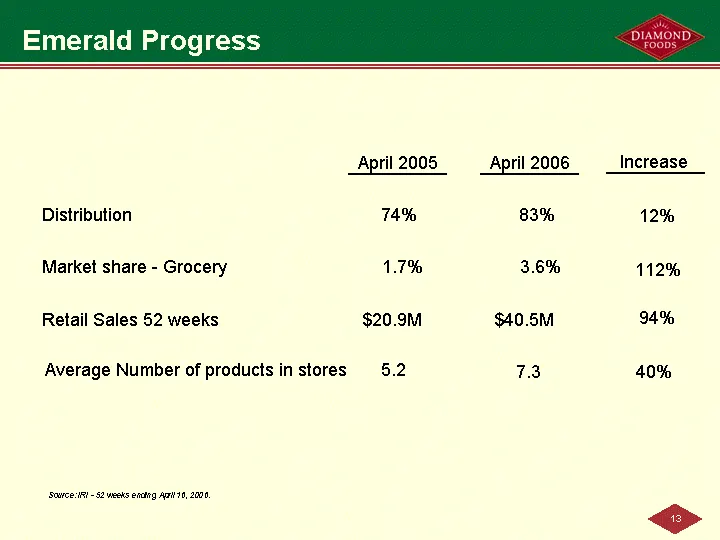
Emerald Progress April 2005 April 2006 Distribution 74% 83% Market share - Grocery 1.7% 3.6% Retail Sales 52 weeks $20.9M $40.5M Increase 12% 112% 94% Average Number of products in stores 5.2 40% 7.3 Source: IRI - 52 weeks ending April 16, 2006.
Slide 14: Harmony Acquisition
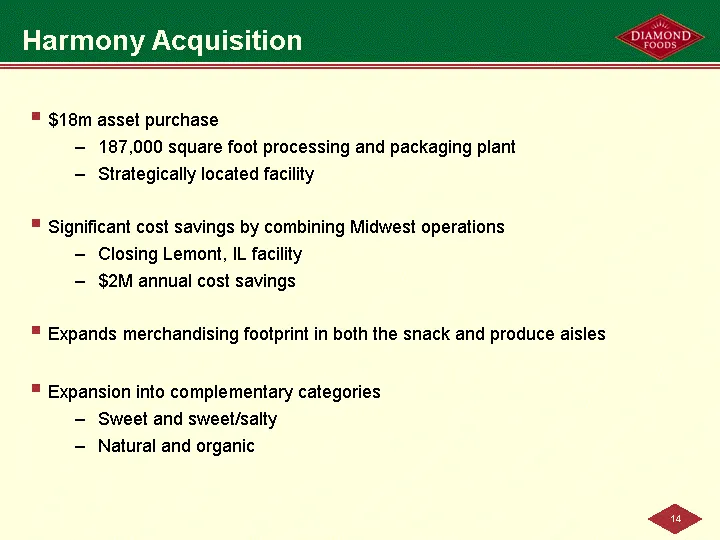
Harmony Acquisition $18m asset purchase 187,000 square foot processing and packaging plant Strategically located facility Significant cost savings by combining Midwest operations Closing Lemont, IL facility $2M annual cost savings Expands merchandising footprint in both the snack and produce aisles
Slide 15: Emerald Expansion Opportunities
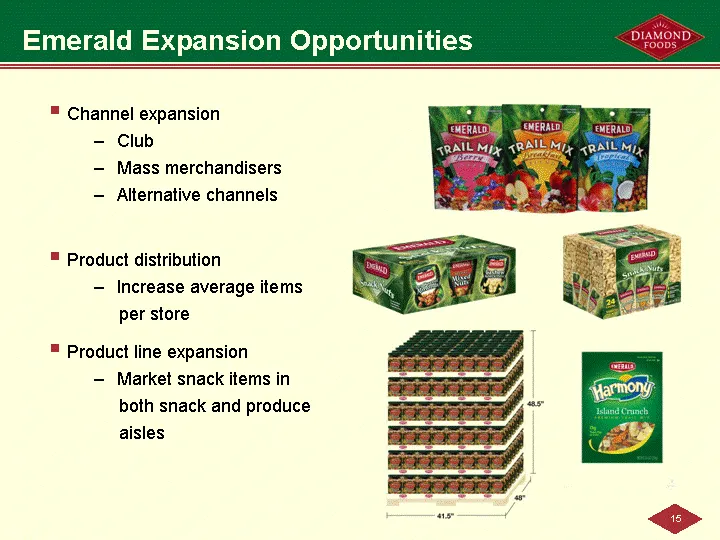
Emerald Expansion Opportunities Channel expansion Club Mass merchandisers Alternative channels Product distribution Increase average items per store Product line expansion Market snack items in both snack and produce aisles
Slide 16: FY 2006 Guidance
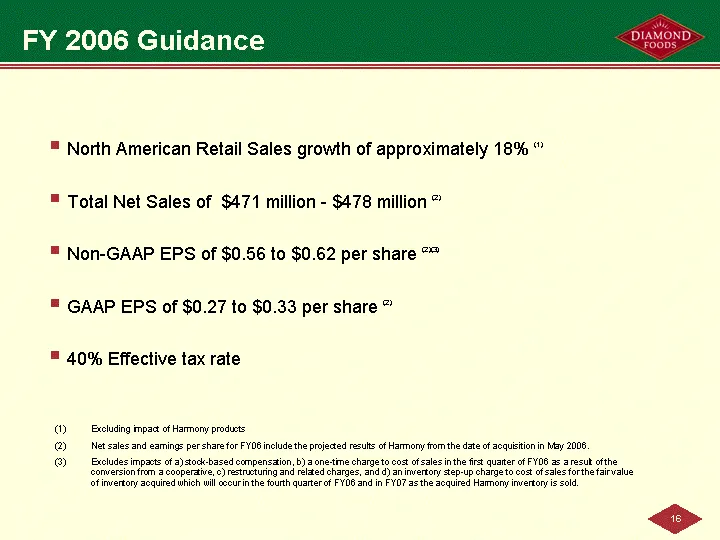
FY 2006 Guidance North American Retail Sales growth of approximately 18% (1) Total Net Sales of $471 million - $478 million (2) Non-GAAP EPS of $0.56 to $0.62 per share (2)(3) GAAP EPS of $0.27 to $0.33 per share (2) 40% Effective tax rate Excluding impact of Harmony products Net sales and earnings
Slide 17: Long-Term Financial Targets
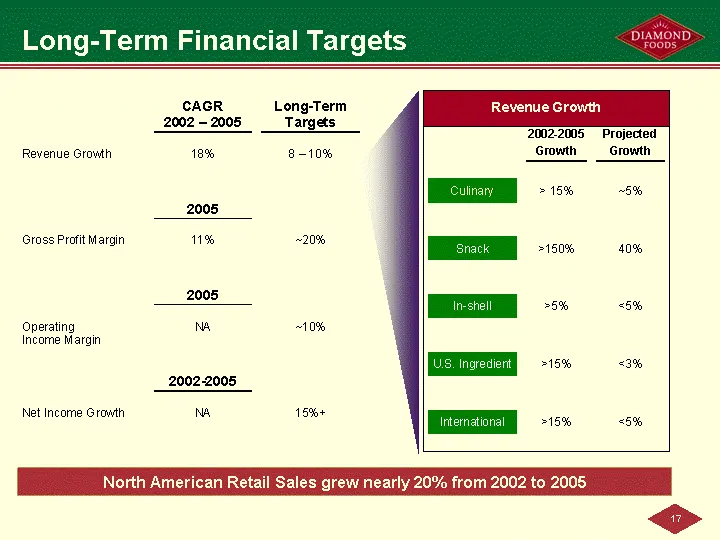
Long-Term Financial Targets North American Retail Sales grew nearly 20% from 2002 to 2005
Slide 18: Diamond Foods, Inc.
Diamond Foods, Inc. Cream: 255 255 221 Green: 0 102 51
Source: SEC EDGAR · 8-K filed May 22, 2006
More decks from Diamond Foods Inc
 Investor Presentation (June 2013)21 slides · Jun 17, 2013
 Investor Presentation (April 2013)21 slides · Apr 29, 2013
 Investor Presentation (February 2013)20 slides · Feb 26, 2013
 Q3 2012 Earnings Presentation18 slides · Nov 14, 2012
 Debt Investor Presentation (May 2012)18 slides · May 23, 2012
 Barclays Capital Back-to-School Consumer Conference 201141 slides · Sep 7, 2011