Nielsen — Merger or Acquisition (December 2020)
16 slides from Nielsen's merger presentation, Dec 9, 2020
Slide 1: Forward-Looking Statements
FORWARD-LOOKING STATEMENTS This presentation includes information that could constitute forward-looking statements made pursuant to the safe harbor provision of the Private Securities Litigation Reform Act of 1995. These statements include those set forth below relating to the proposed sale by Niels
Slide 2: Additional Information and Where to Find It
ADDITIONAL INFORMATION AND WHERE TO FIND IT This communication relates to the proposed transaction involving Nielsen. In connection with the proposed transaction, Nielsen has filed and will be filing relevant materials with the SEC, including the Proxy Statement. This communication is not a substitute
Slide 3: Resetting the Baseline for the New Nielsen
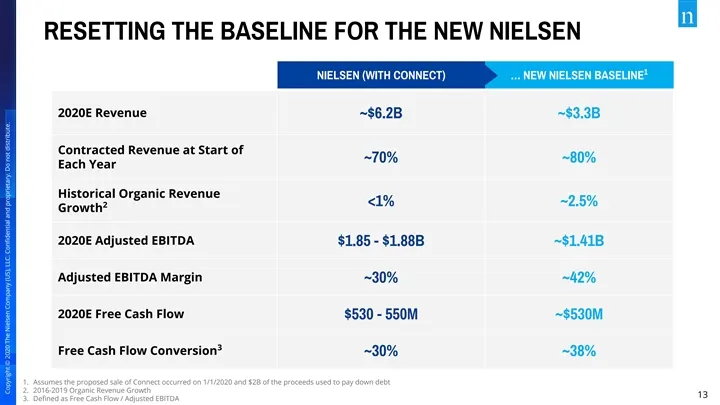
RESETTING THE BASELINE FOR THE NEW NIELSEN 1 NIELSEN (WITH CONNECT) … NEW NIELSEN BASELINE 2020E Revenue ~$6.2B ~$3.3B Contracted Revenue at Start of ~70% ~80% Each Year Historical Organic Revenue <1% ~2.5% 2 Growth 2020E Adjusted EBITDA $1.85 - $1.88B ~$1.41B Adjusted EBITDA Margin ~30% ~42% 2020E
Slide 4: The New Nielsen: Improved Financial Profile
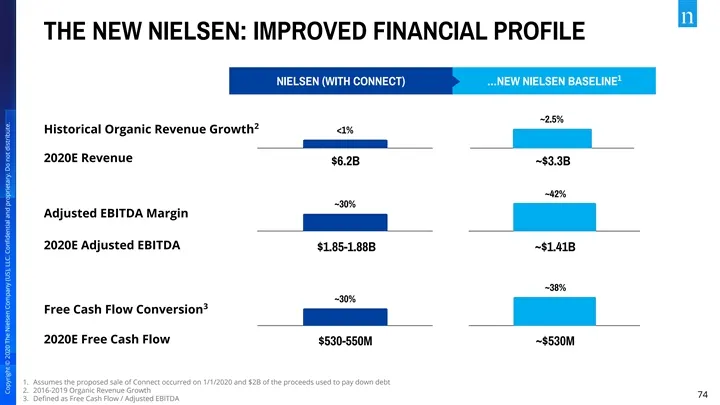
THE NEW NIELSEN: IMPROVED FINANCIAL PROFILE 1 NIELSEN (WITH CONNECT) …NEW NIELSEN BASELINE ~2.5% 2 Historical Organic Revenue Growth <1% 2020E Revenue $6.2B ~$3.3B ~42% ~30% Adjusted EBITDA Margin 2020E Adjusted EBITDA $1.85-1.88B ~$1.41B ~38% ~30% 3 Free Cash Flow Conversion 2020E Free Cash Flow $5
Slide 5: Multiple Levers to Improve FCF Conversion
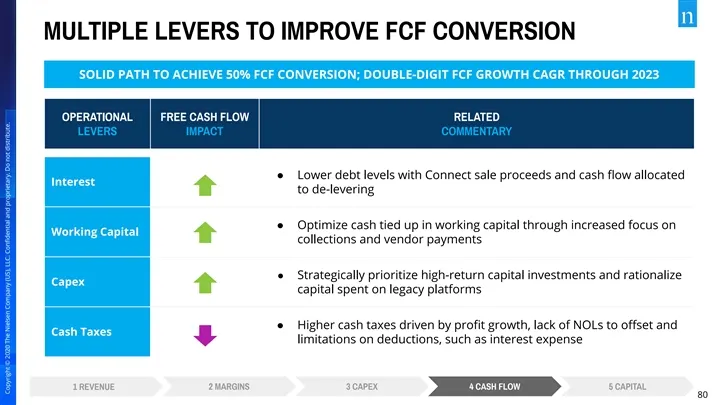
MULTIPLE LEVERS TO IMPROVE FCF CONVERSION SOLID PATH TO ACHIEVE 50% FCF CONVERSION; DOUBLE-DIGIT FCF GROWTH CAGR THROUGH 2023 OPERATIONAL FREE CASH FLOW RELATED LEVERS IMPACT COMMENTARY ● Lower debt levels with Connect sale proceeds and cash flow allocated Interest to de-levering ● Optimize cash tied
Slide 6: Near-Term Focus on De-Levering
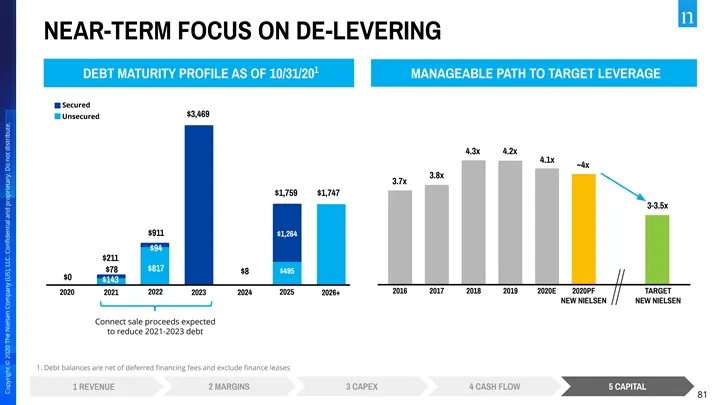
NEAR-TERM FOCUS ON DE-LEVERING 1 DEBT MATURITY PROFILE AS OF 10/31/20 MANAGEABLE PATH TO TARGET LEVERAGE Secured $3,469 Unsecured 4.3x 4.2x 4.1x ~4x 3.8x 3.7x $1,759 $1,747 3-3.5x $911 $1,264 $94 $211 $817 $78 $8 $495 $0 $143 2016 2017 2018 2019 2020E 2020PF TARGET 2020 2021 2022 2023 2024 2025 2026
Slide 7: A Balanced Capital Allocation Strategy
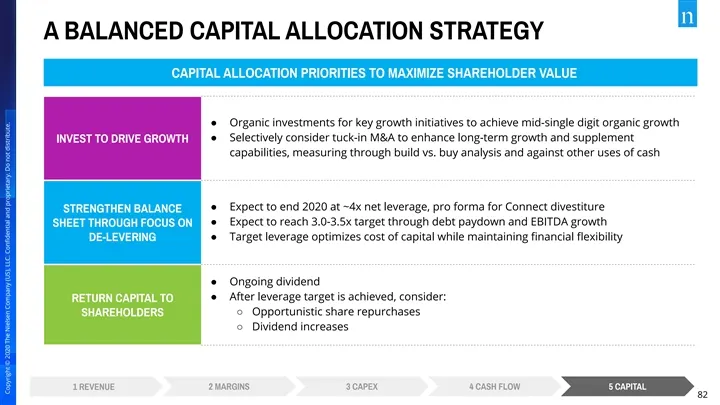
A BALANCED CAPITAL ALLOCATION STRATEGY CAPITAL ALLOCATION PRIORITIES TO MAXIMIZE SHAREHOLDER VALUE ● Organic investments for key growth initiatives to achieve mid-single digit organic growth ● Selectively consider tuck-in M&A to enhance long-term growth and supplement INVEST TO DRIVE GROWTH capabili
Slide 8: 2020 Pro Forma & 2021 Preliminary Outlook
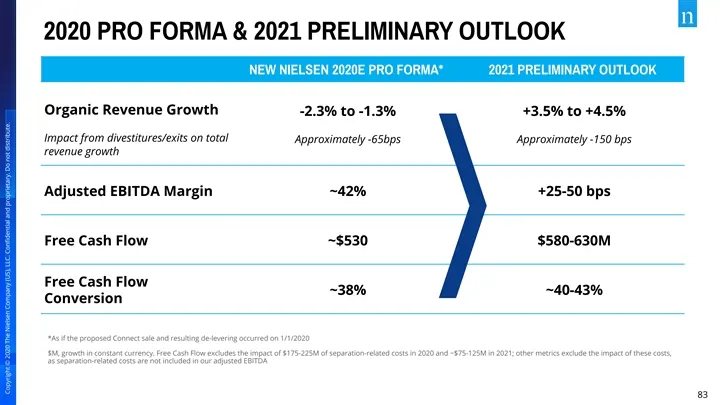
2020 PRO FORMA & 2021 PRELIMINARY OUTLOOK NEW NIELSEN 2020E PRO FORMA* 2021 PRELIMINARY OUTLOOK Organic Revenue Growth -2.3% to -1.3% +3.5% to +4.5% Impact from divestitures/exits on total Approximately -65bps Approximately -150 bps revenue growth Adjusted EBITDA Margin ~42% +25-50 bps Free Cash Flo
Slide 9: Certain Non-GAAP Measures
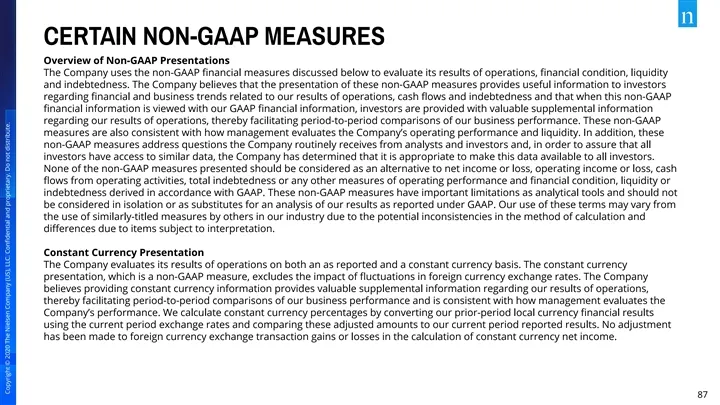
CERTAIN NON-GAAP MEASURES Overview of Non-GAAP Presentations The Company uses the non-GAAP financial measures discussed below to evaluate its results of operations, financial condition, liquidity and indebtedness. The Company believes that the presentation of these non-GAAP measures provides useful in
Slide 10: Certain Non-GAAP Measures (continued)
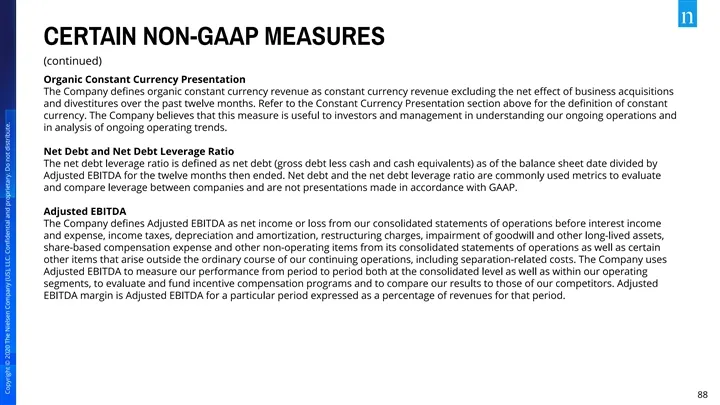
CERTAIN NON-GAAP MEASURES (continued) Organic Constant Currency Presentation The Company defines organic constant currency revenue as constant currency revenue excluding the net effect of business acquisitions and divestitures over the past twelve months. Refer to the Constant Currency Presentation se
Slide 11: Certain Non-GAAP Measures (continued)
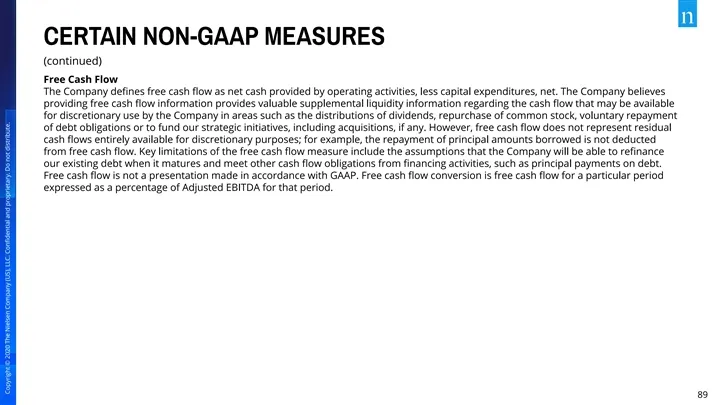
CERTAIN NON-GAAP MEASURES (continued) Free Cash Flow The Company defines free cash flow as net cash provided by operating activities, less capital expenditures, net. The Company believes providing free cash flow information provides valuable supplemental liquidity information regarding the cash flow tha
Slide 12: Revenue Reconciliation
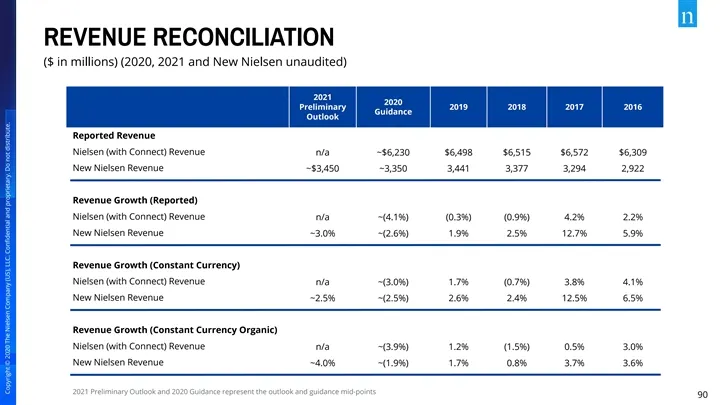
REVENUE RECONCILIATION ($ in millions) (2020, 2021 and New Nielsen unaudited) 2021 2020 Preliminary 2019 2018 2017 2016 Guidance Outlook Reported Revenue Nielsen (with Connect) Revenue n/a ~$6,230 $6,498 $6,515 $6,572 $6,309 New Nielsen Revenue ~$3,450 ~3,350 3,441 3,377 3,294 2,922 Revenue Growth (
Slide 13: FY'20 Adjusted EBITDA Reconciliation
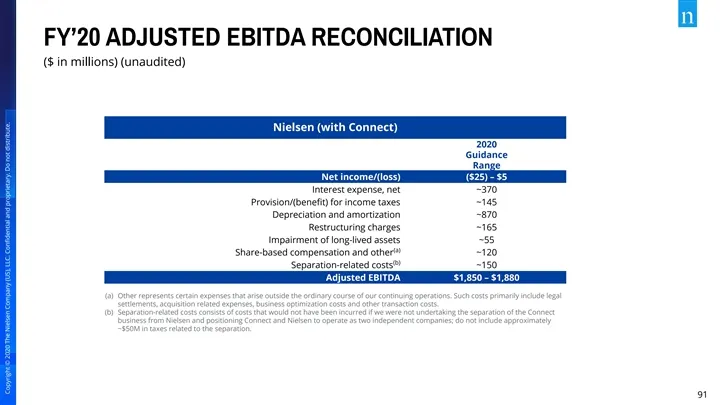
FY’20 ADJUSTED EBITDA RECONCILIATION ($ in millions) (unaudited) Nielsen (with Connect) 2020 Guidance Range Net income/(loss) ($25) – $5 Interest expense, net ~370 Provision/(benefit) for income taxes ~145 Depreciation and amortization ~870 Restructuring charges ~165 Impairment of long-lived assets ~
Slide 14: Adjusted EBITDA Reconciliation
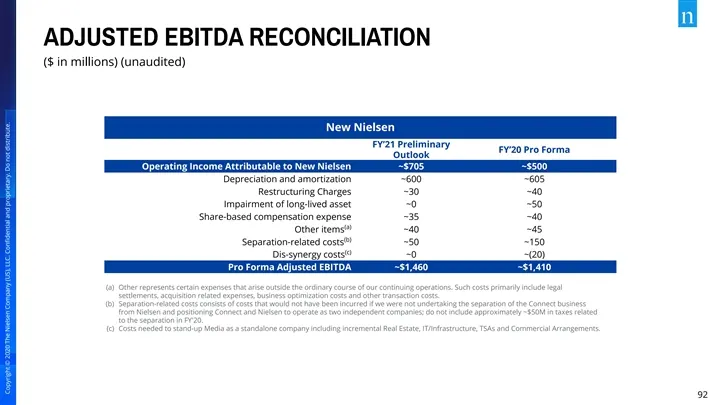
ADJUSTED EBITDA RECONCILIATION ($ in millions) (unaudited) New Nielsen FY’21 Preliminary FY’20 Pro Forma Outlook Operating Income Attributable to New Nielsen ~$705 ~$500 Depreciation and amortization ~600 ~605 Restructuring Charges ~30 ~40 Impairment of long-lived asset ~0 ~50 Share-based compensati
Slide 15: Free Cash Flow Reconciliation
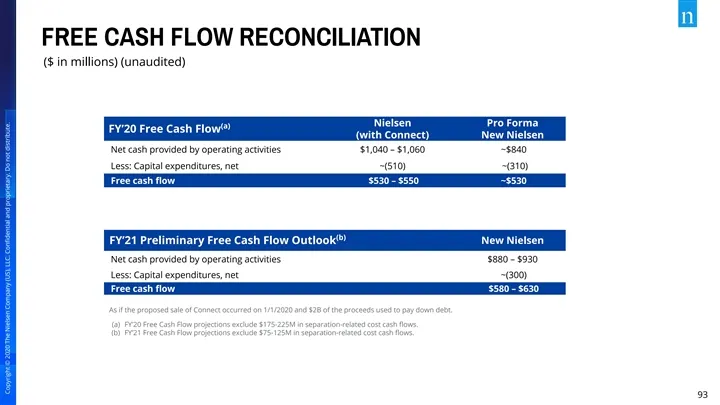
FREE CASH FLOW RECONCILIATION ($ in millions) (unaudited) Nielsen Pro Forma (a) FY’20 Free Cash Flow (with Connect) New Nielsen Net cash provided by operating activities $1,040 – $1,060 ~$840 Less: Capital expenditures, net ~(510) ~(310) Free cash flow $530 – $550 ~$530 (b) FY’21 Preliminary Free Cas
Slide 16: Net Debt Leverage Ratio Reconciliation
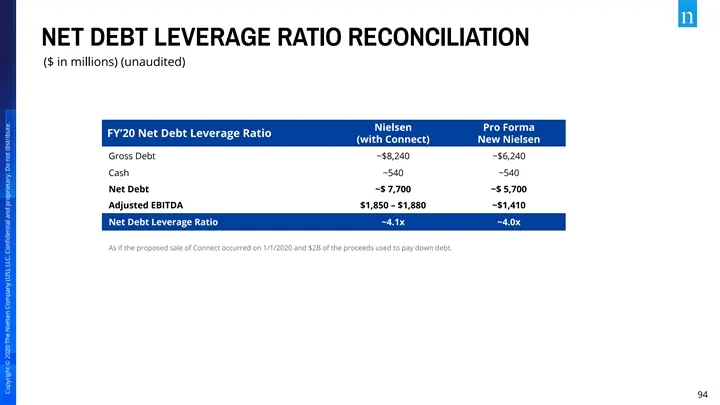
NET DEBT LEVERAGE RATIO RECONCILIATION ($ in millions) (unaudited) Nielsen Pro Forma FY’20 Net Debt Leverage Ratio (with Connect) New Nielsen Gross Debt ~$8,240 ~$6,240 Cash ~540 ~540 Net Debt ~$ 7,700 ~$ 5,700 Adjusted EBITDA $1,850 – $1,880 ~$1,410 Net Debt Leverage Ratio ~4.1x ~4.0x As if the pro
Source: SEC EDGAR · DEFA14A filed Dec 9, 2020
More decks from Nielsen Holdings PLC
 Proxy Contest (April 2022)71 slides · Apr 26, 2022
 Q4 2021 Earnings Presentation29 slides · Feb 28, 2022
 Q3 2021 Earnings Presentation27 slides · Oct 28, 2021
 Q2 2021 Earnings Presentation27 slides · Jul 29, 2021
 Q1 2021 Earnings Presentation29 slides · May 6, 2021
 Q4 2020 Earnings Presentation34 slides · Feb 25, 2021