Anchor BanCorp Wisconsin — Q2 2015 Earnings Presentation
17 slides from Anchor BanCorp Wisconsin's earnings presentation, Jul 31, 2015
Slide 1: Second Quarter 2015 Earnings Presentation
Exhibit 99.2 Second Quarter 2015 Earnings Presentation
Slide 2: Cautionary Statement Regarding Forward-Looking Information and Non-GAAP Financial Information
Cautionary Statement Regarding Forward-Looking Information and Non-GAAP Financial Information This presentation does not constitute an offer to sell, nor a solicitation of an offer to buy, any securities of Anchor BanCorp Wisconsin, Inc. (the “Company”) by any person in any jurisdiction in which it
Slide 3: Continuing the Recovery & Executing Our Business Plan
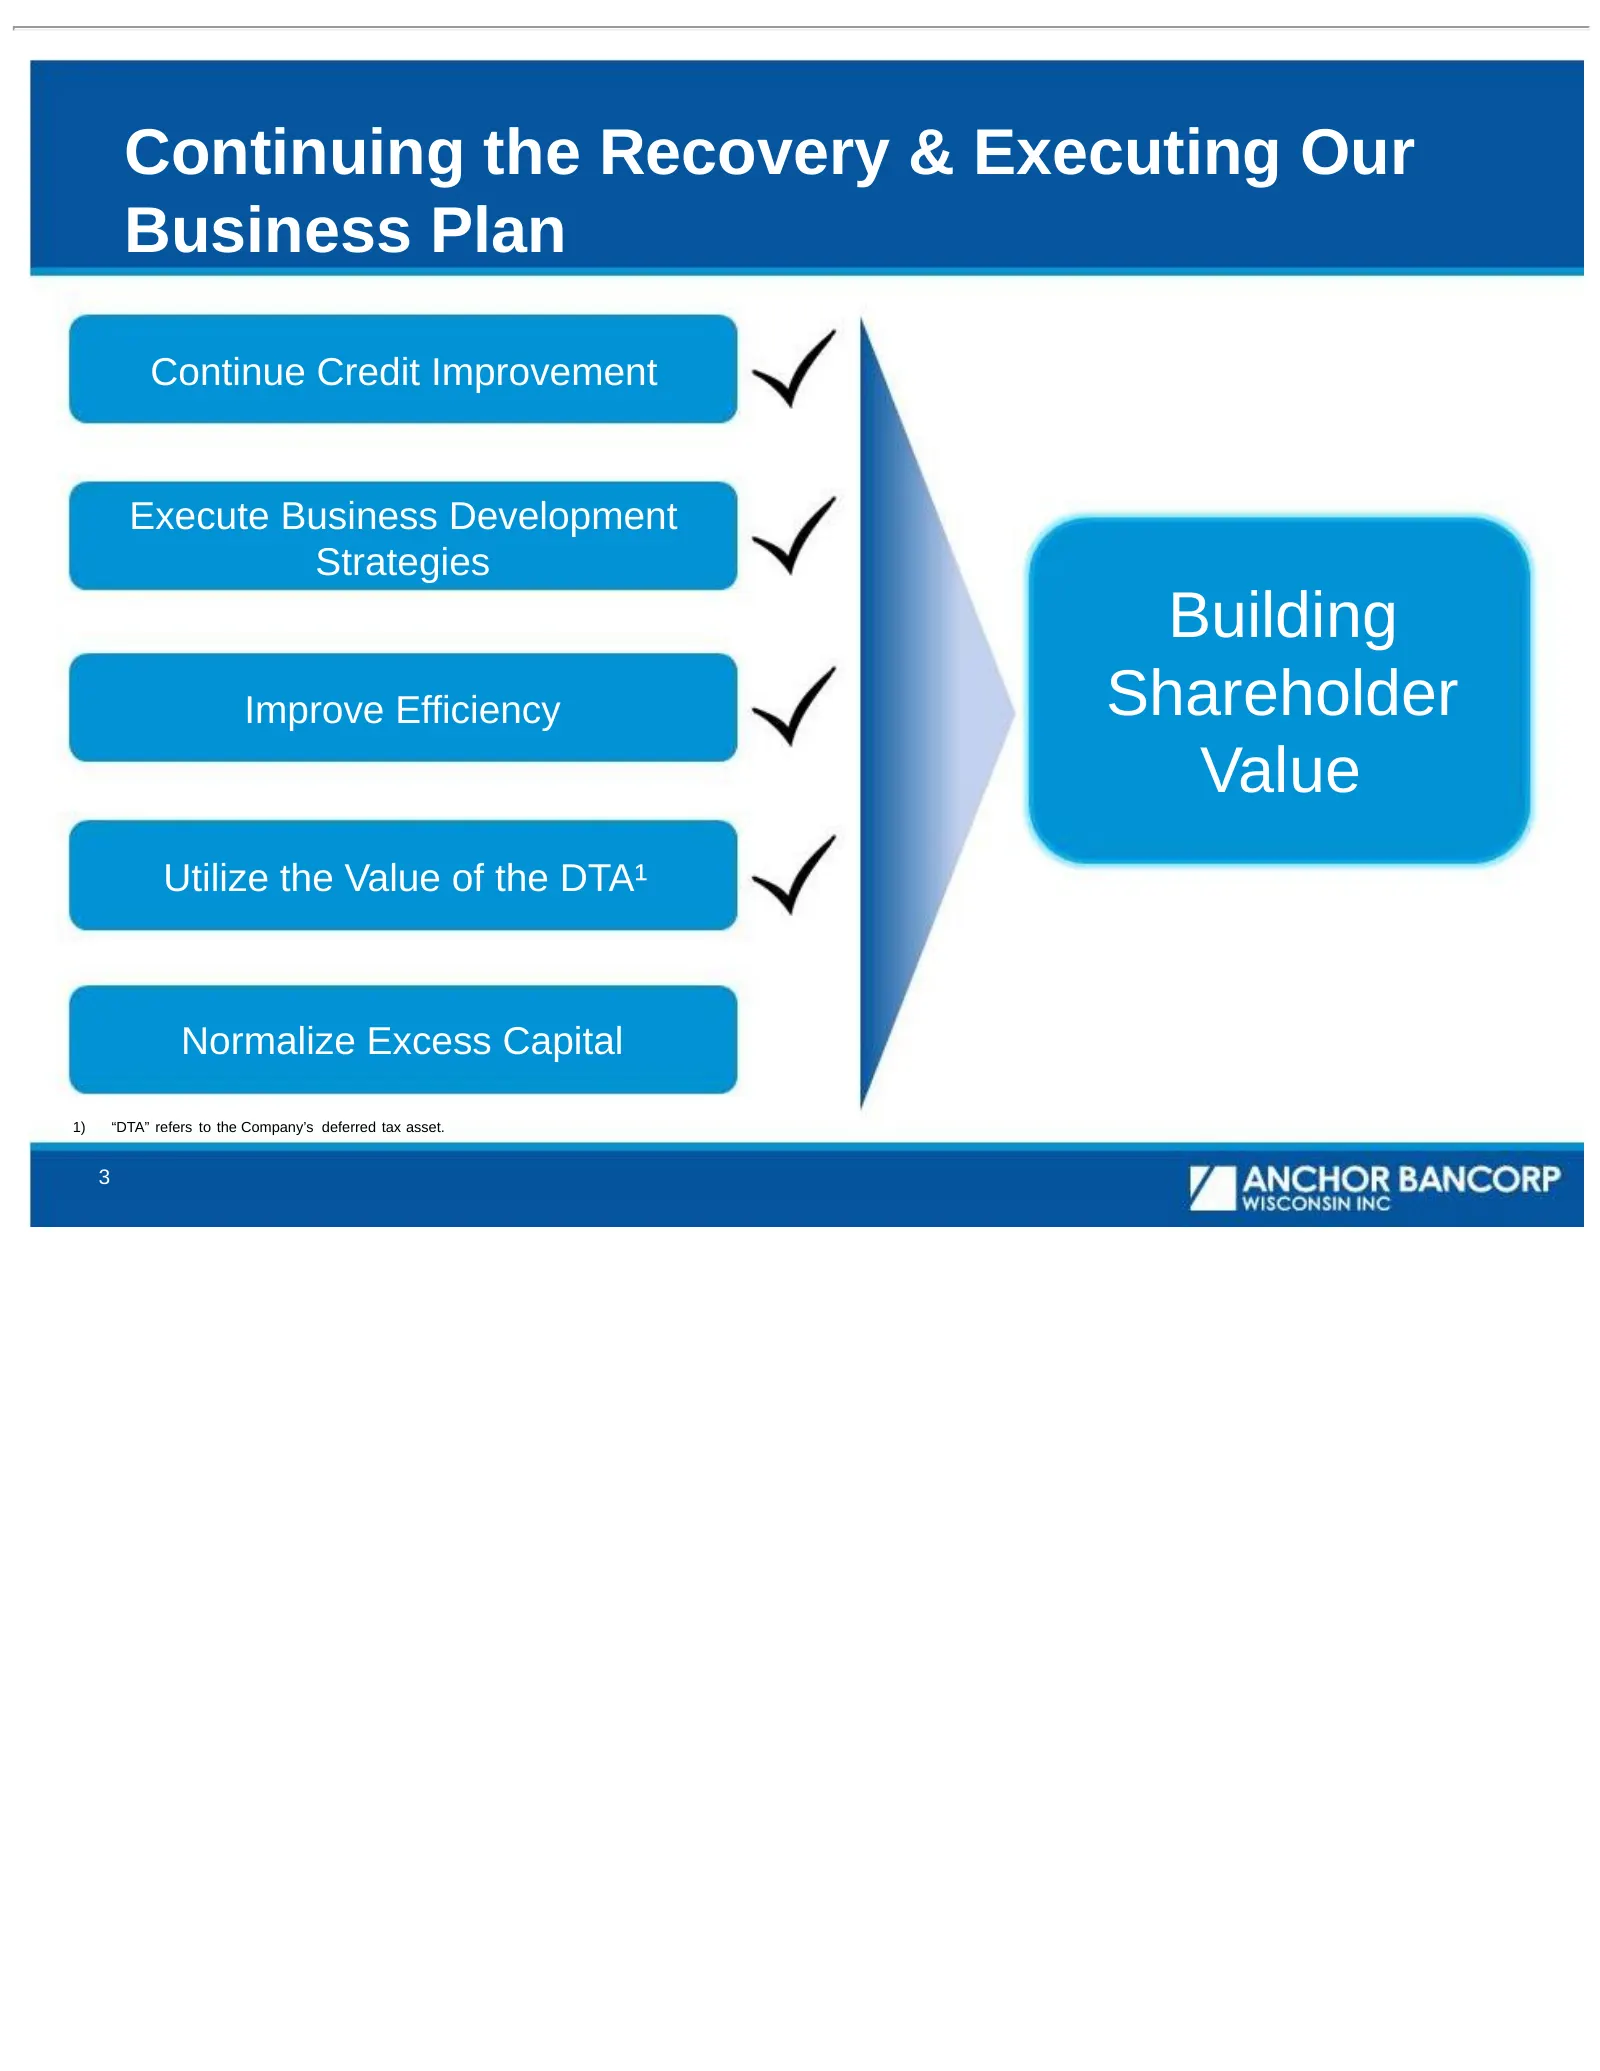
Continuing the Recovery & Executing Our Business Plan Continue Credit Improvement Execute Business Development Strategies Building Improve Efficiency Shareholder Value Utilize the Value of the DTA¹ Normalize Excess Capital 1) “DTA” refers to the Company’s deferred tax asset. 3
Slide 4: 2015 Q2 Financial Highlights
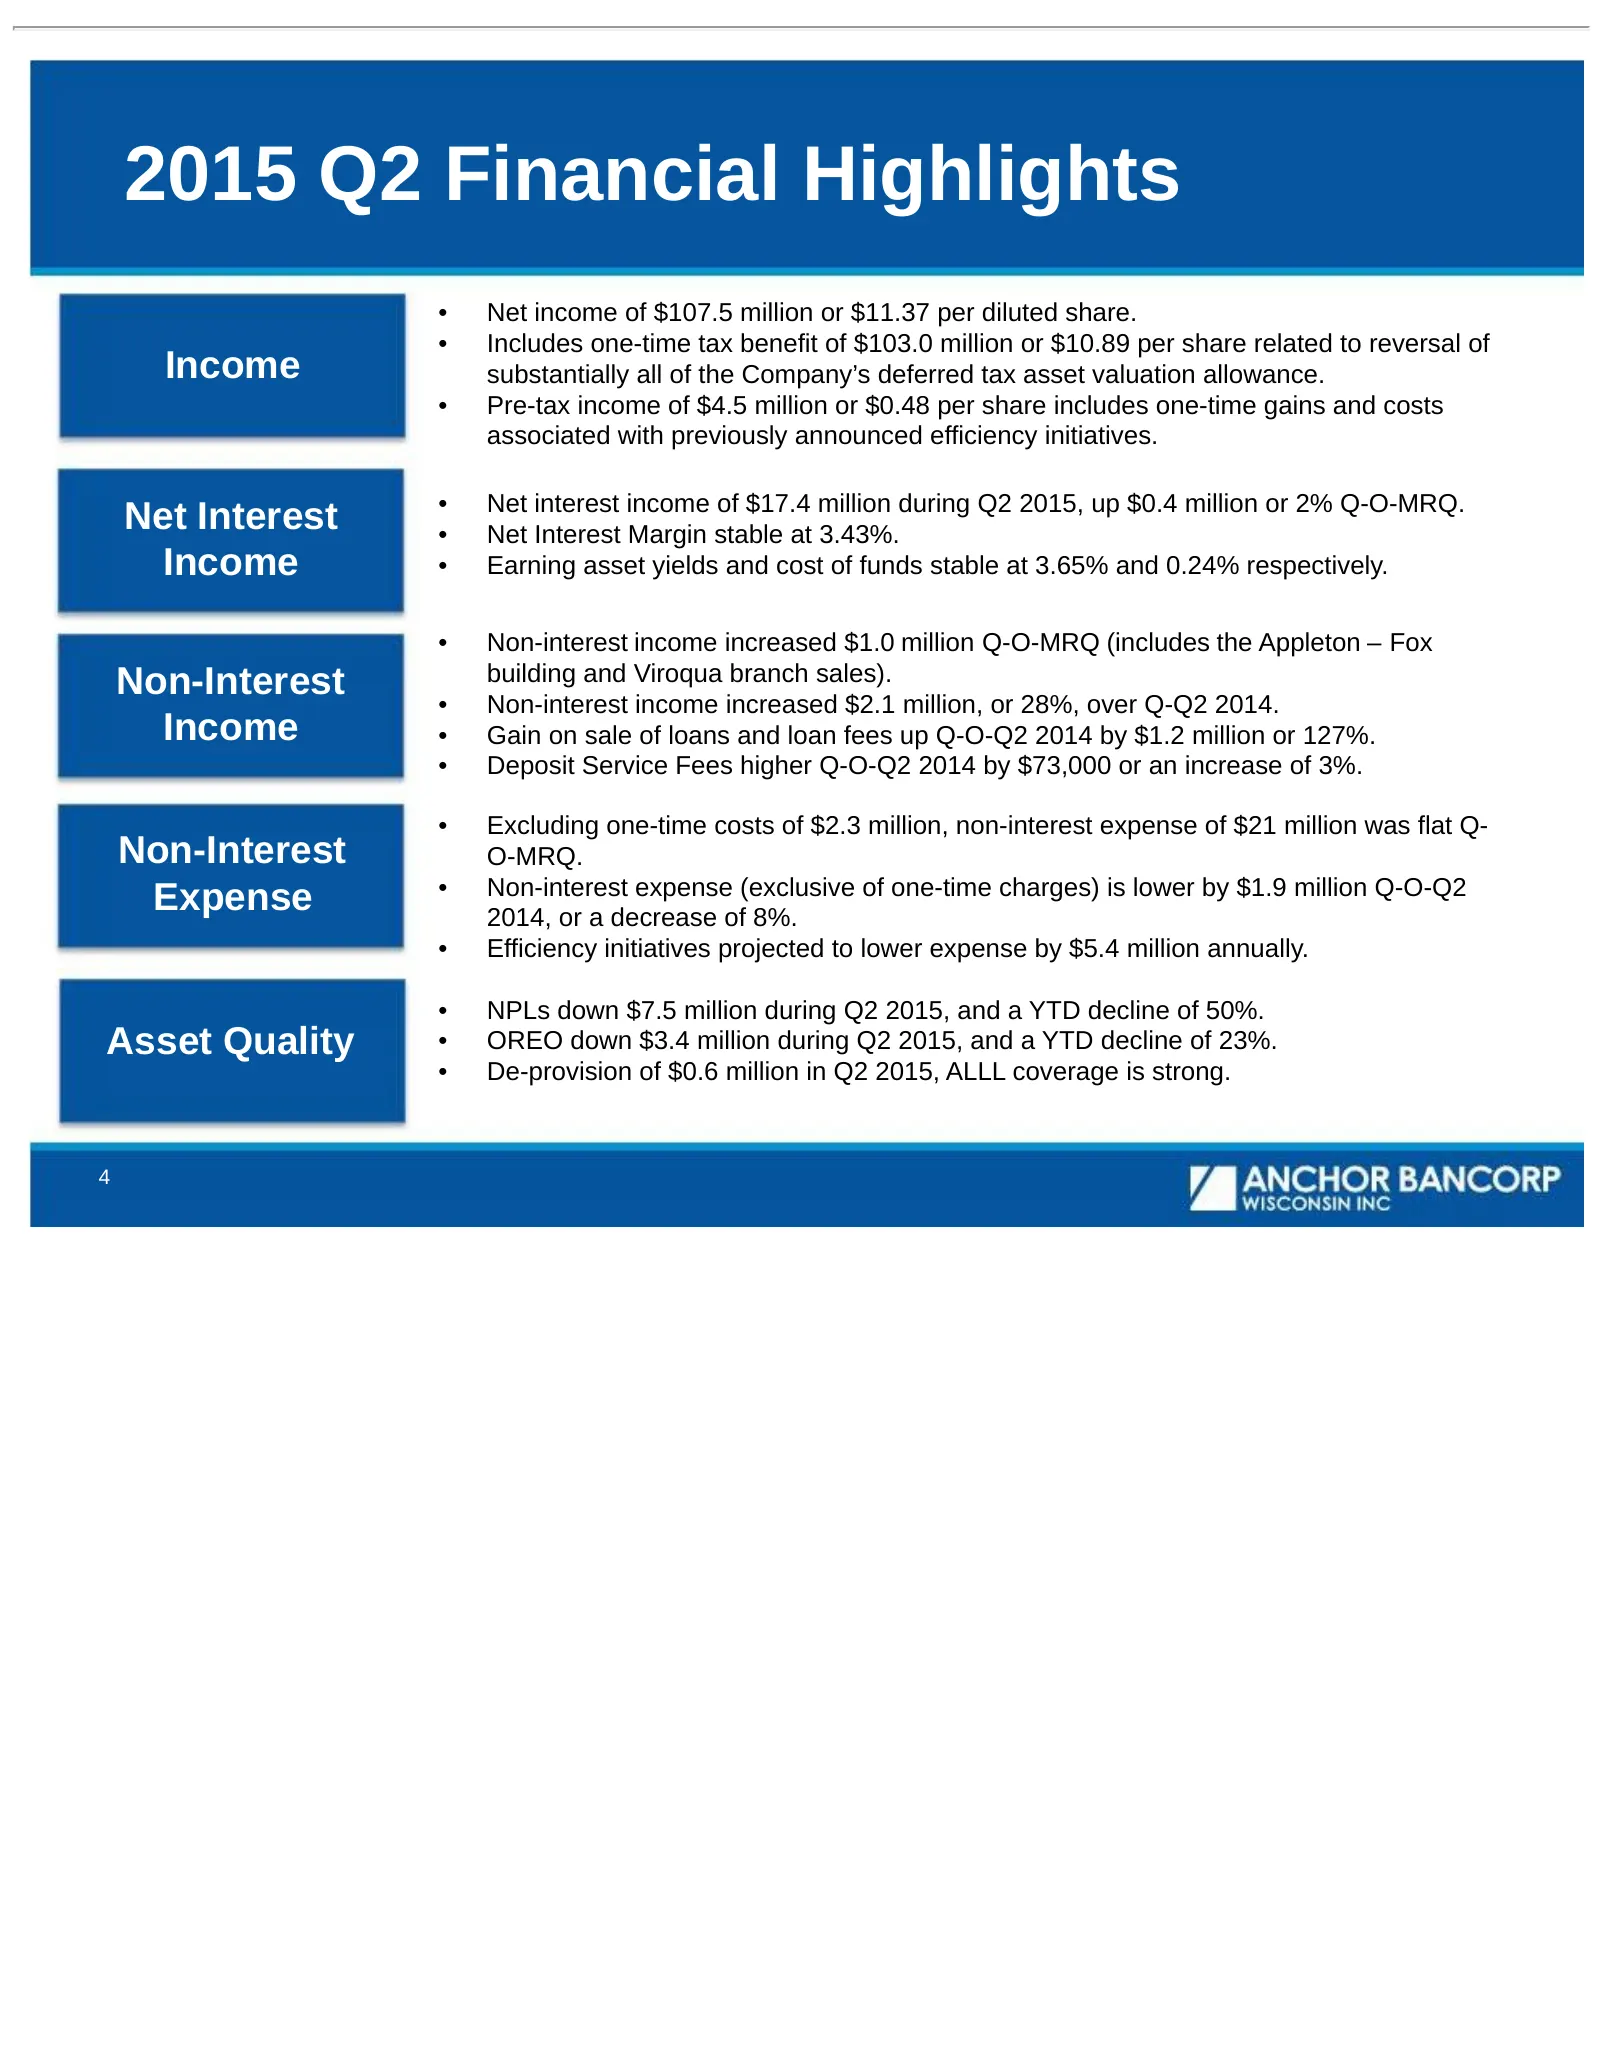
2015 Q2 Financial Highlights • Net income of $107.5 million or $11.37 per diluted share. • Includes one-time tax benefit of $103.0 million or $10.89 per share related to reversal of Income substantially all of the Company’s deferred tax asset valuation allowance. • Pre-tax income of $4.5 million or
Slide 5: DTA Valuation Allowance Recapture
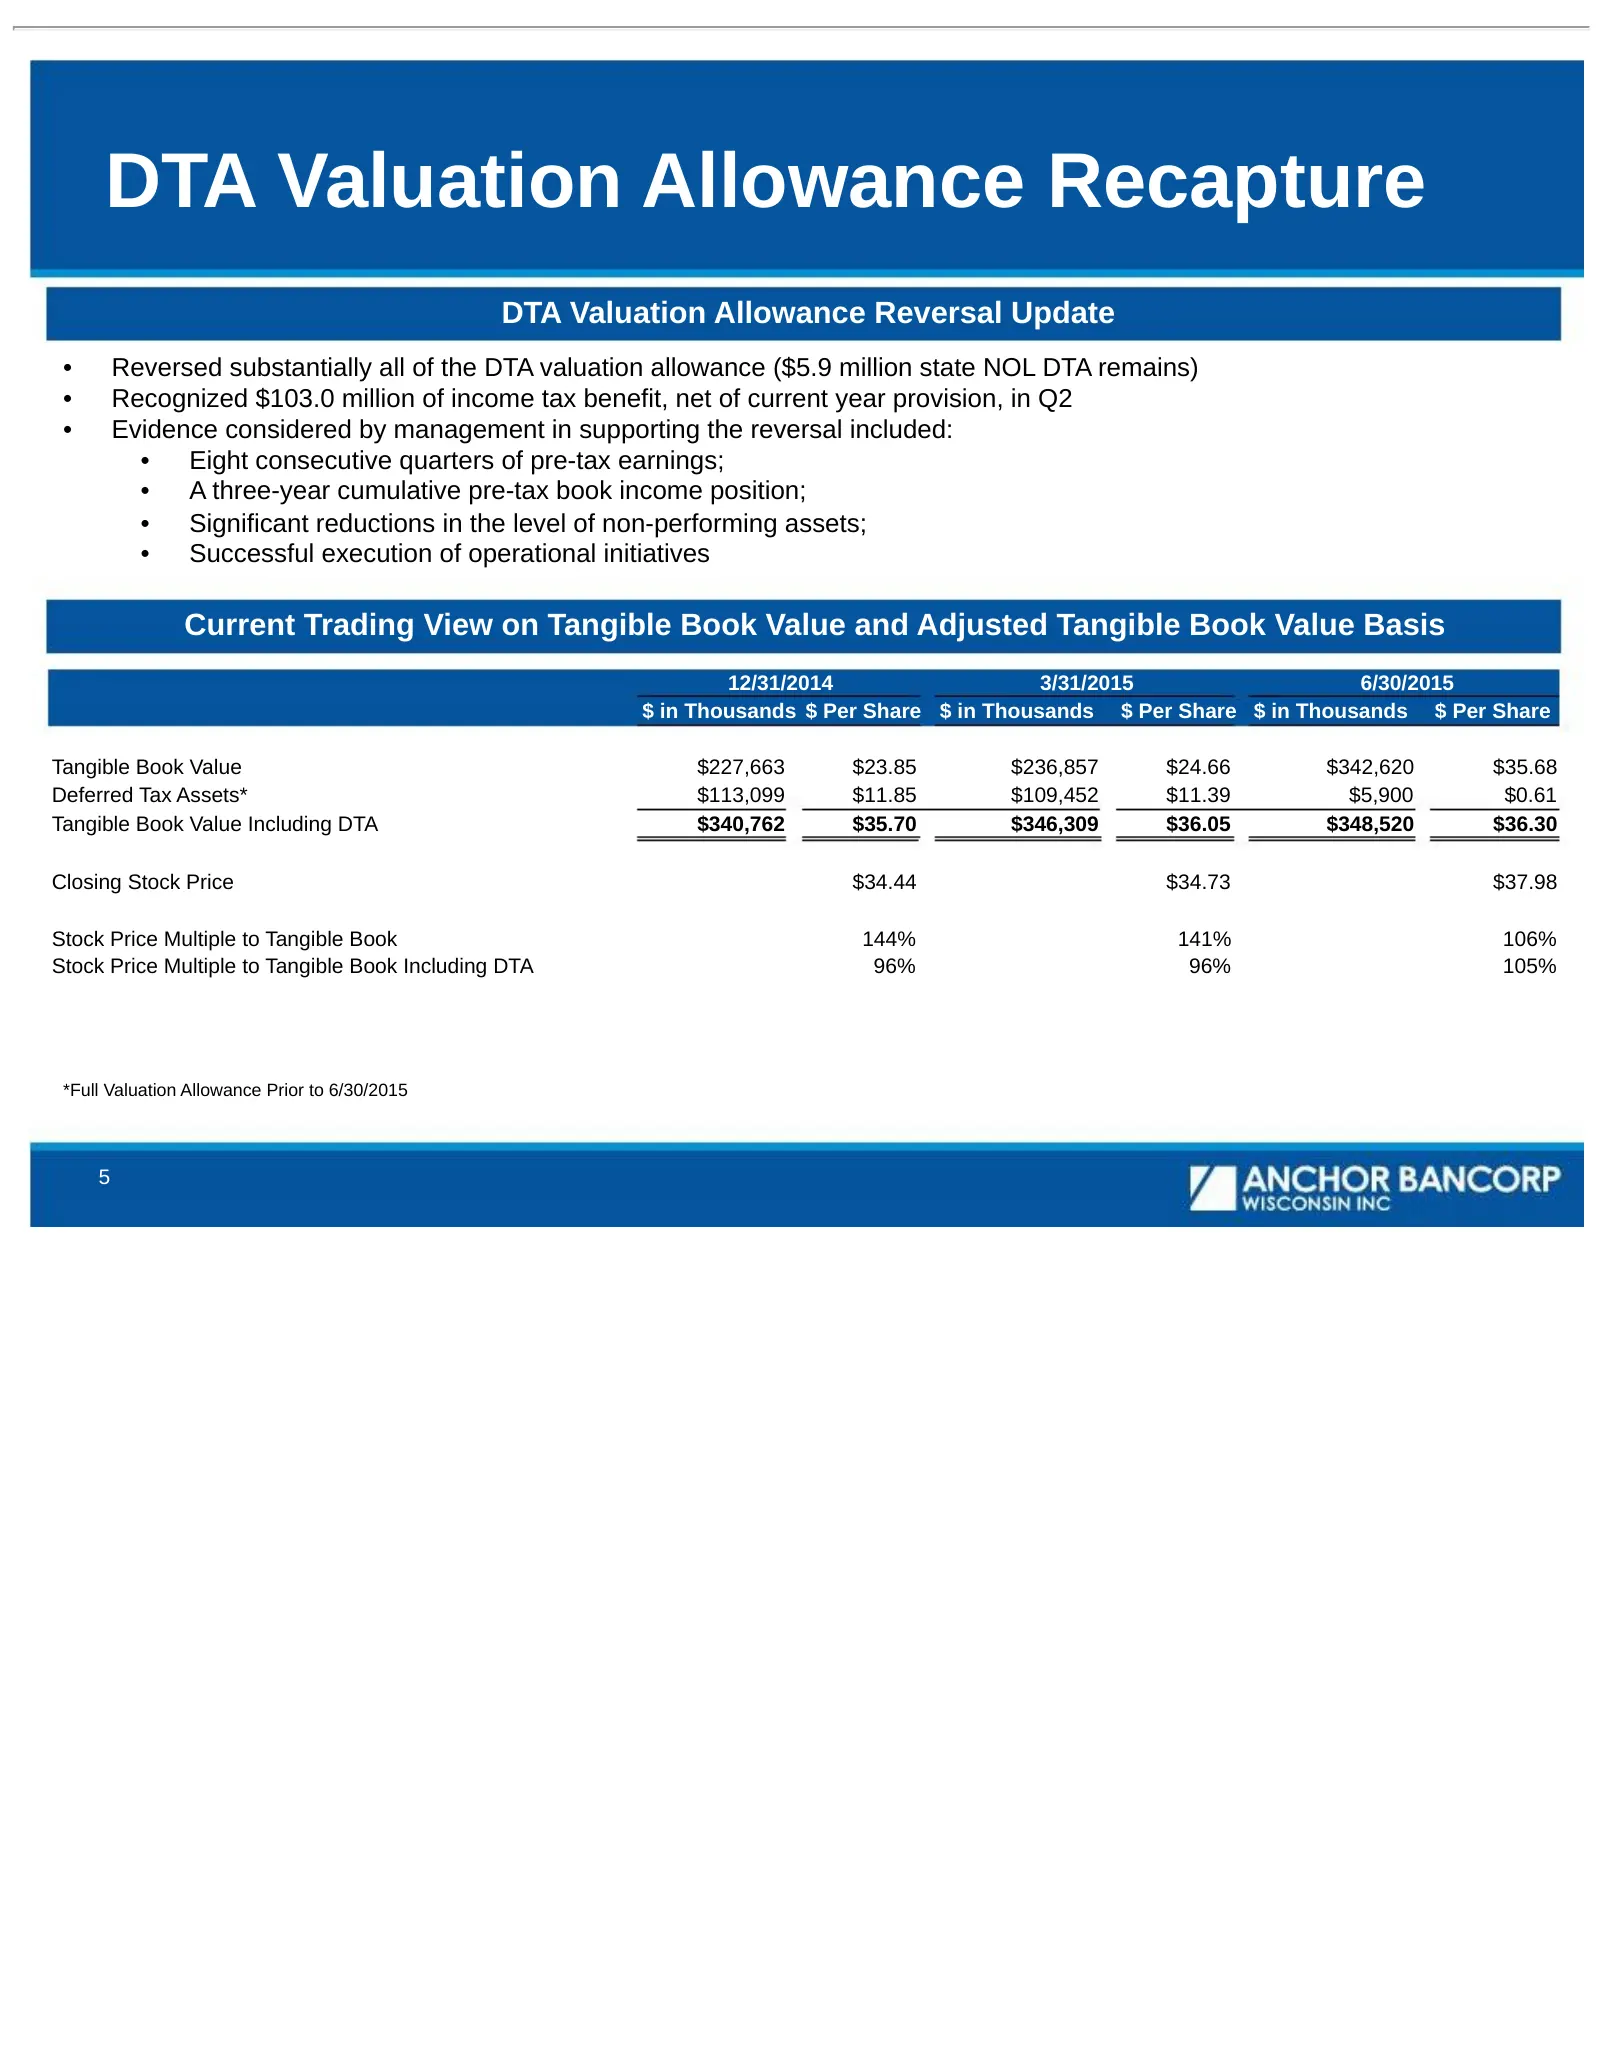
DTA Valuation Allowance Recapture DTA Valuation Allowance Reversal Update • Reversed substantially all of the DTA valuation allowance ($5.9 million state NOL DTA remains) • Recognized $103.0 million of income tax benefit, net of current year provision, in Q2 • Evidence considered by management in su
Slide 6: Net Interest Income
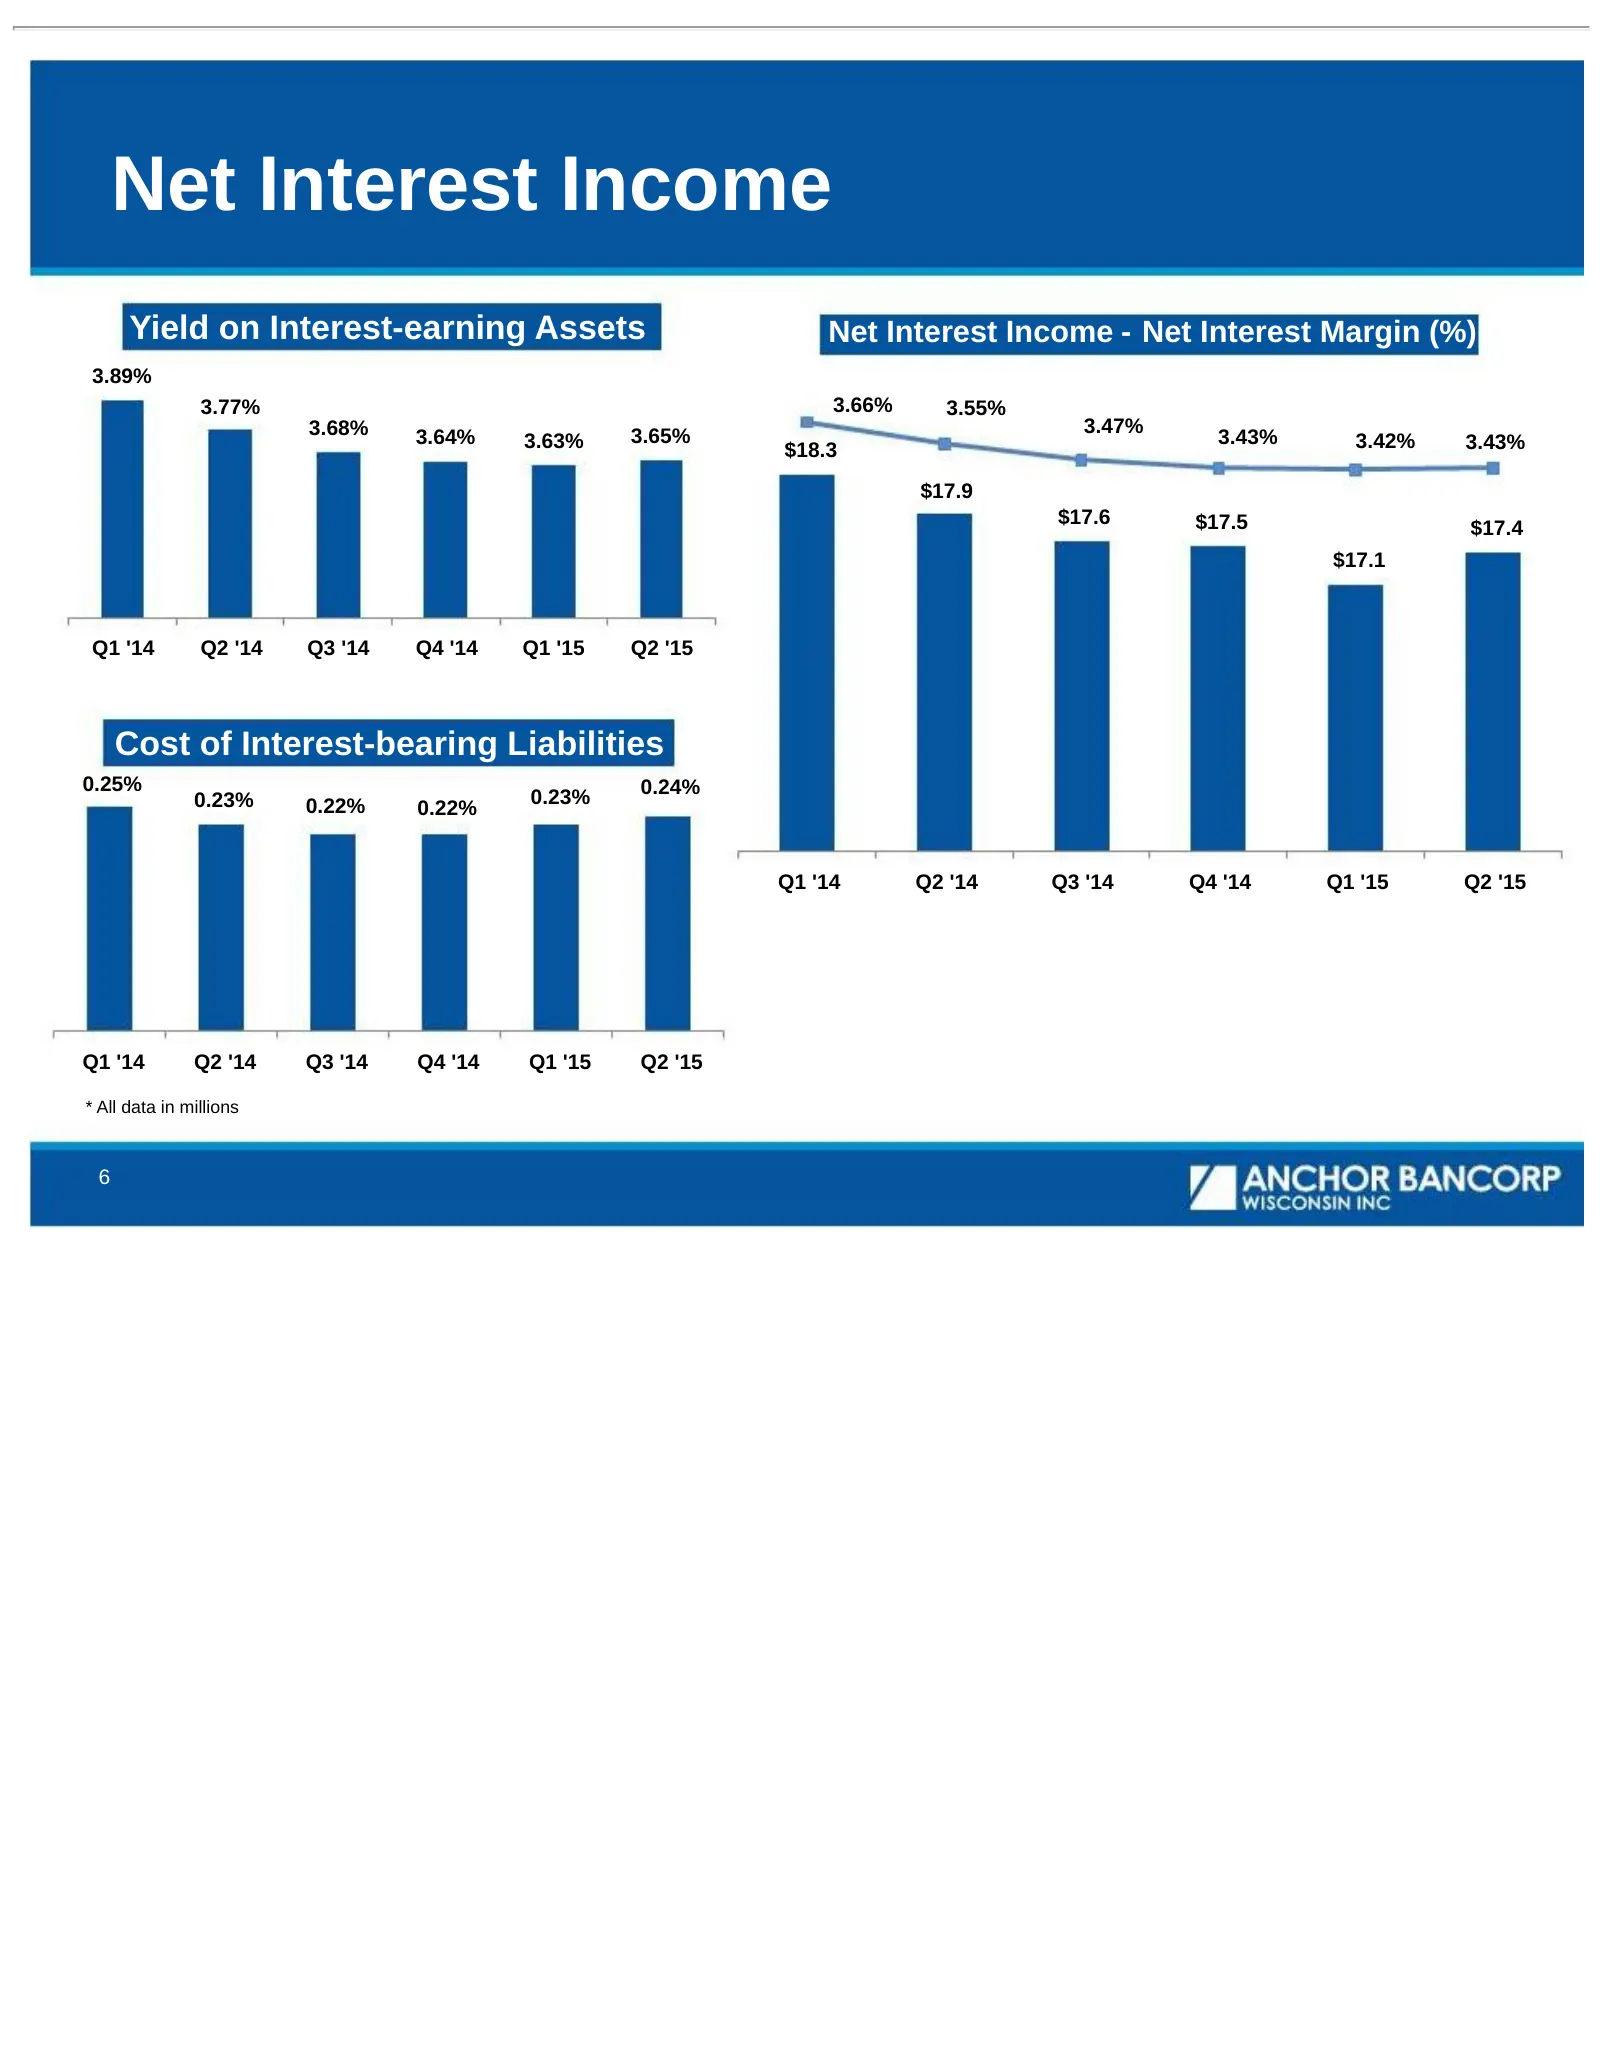
Net Interest Income Yield on Interest-earning Assets Net Interest Income - Net Interest Margin (%) 3.89% 3.77% 3.66% 3.55% 3.68% 3.65% 3.47% 3.64% 3.63% 3.43% 3.42% 3.43% $18.3 $17.9 $17.6 $17.5 $17.4 $17.1 Q1 '14 Q2 '14 Q3 '14 Q4 '14 Q1 '15 Q2 '15 Cost of Interest-bearing Liabilities 0.25% 0.24% 0.
Slide 7: Non-Interest Income
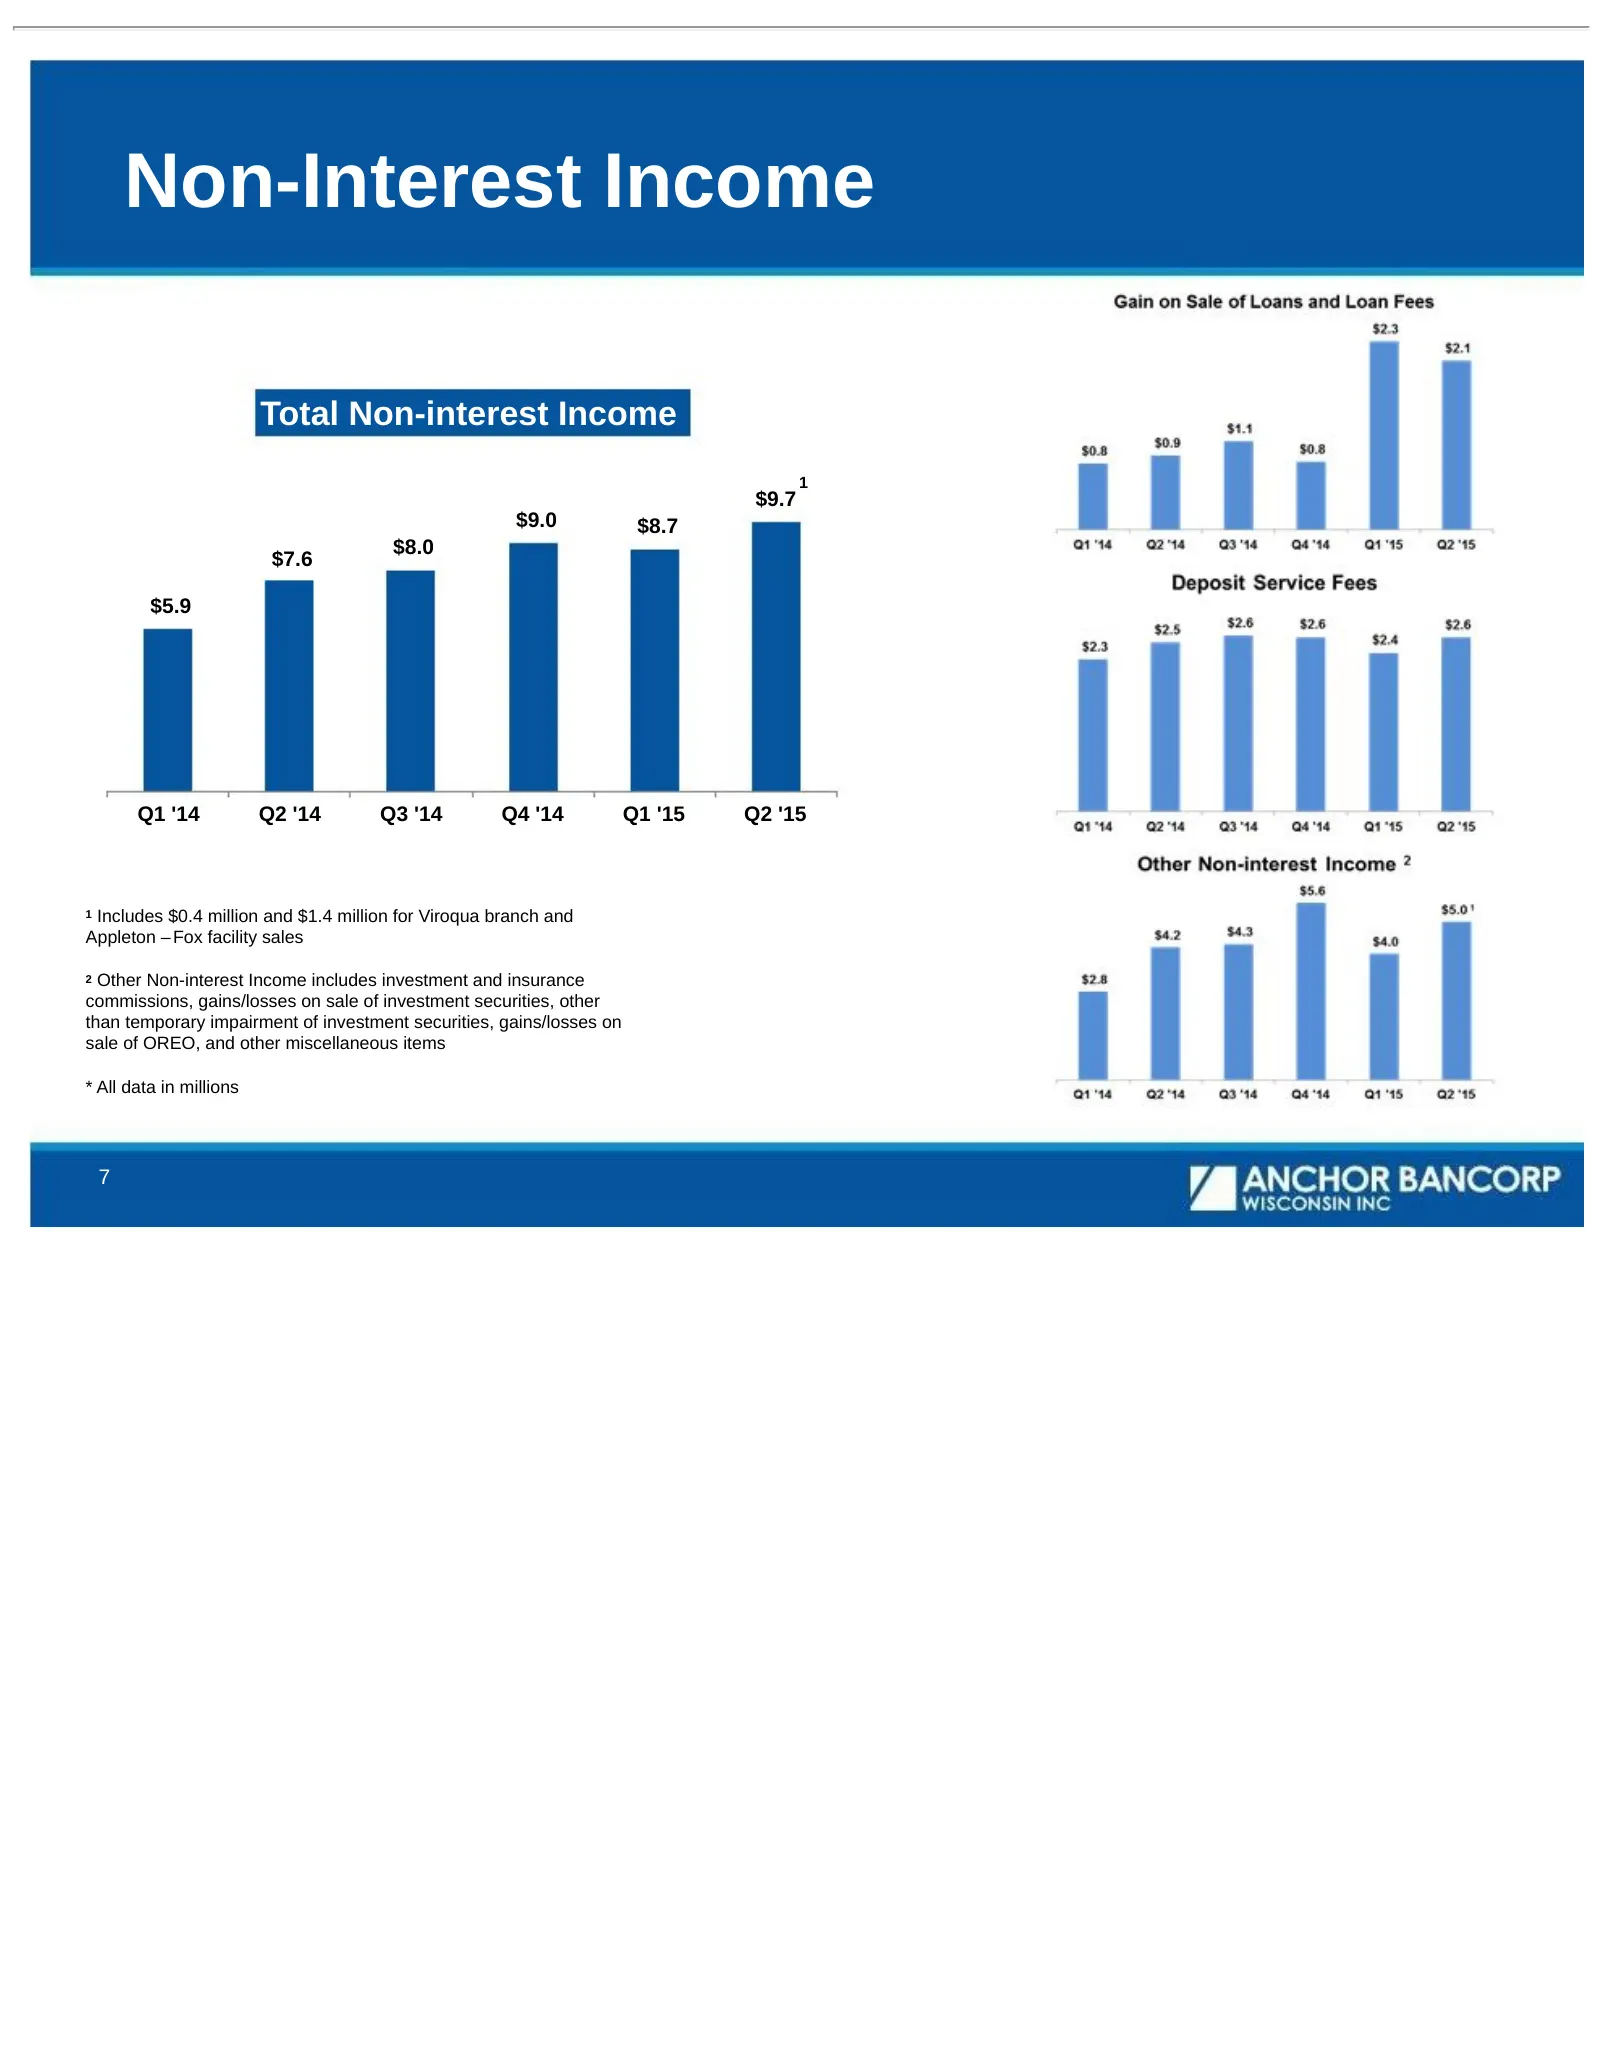
Non-Interest Income Total Non-interest Income 1 $9.7 $9.0 $8.7 $8.0 $7.6 $5.9 Q1 '14 Q2 '14 Q3 '14 Q4 '14 Q1 '15 Q2 '15 1 Includes $0.4 million and $1.4 million for Viroqua branch and Appleton – Fox facility sales 2 Other Non-interest Income includes investment and insurance commissions, gains/losse
Slide 8: Non-Interest Expense
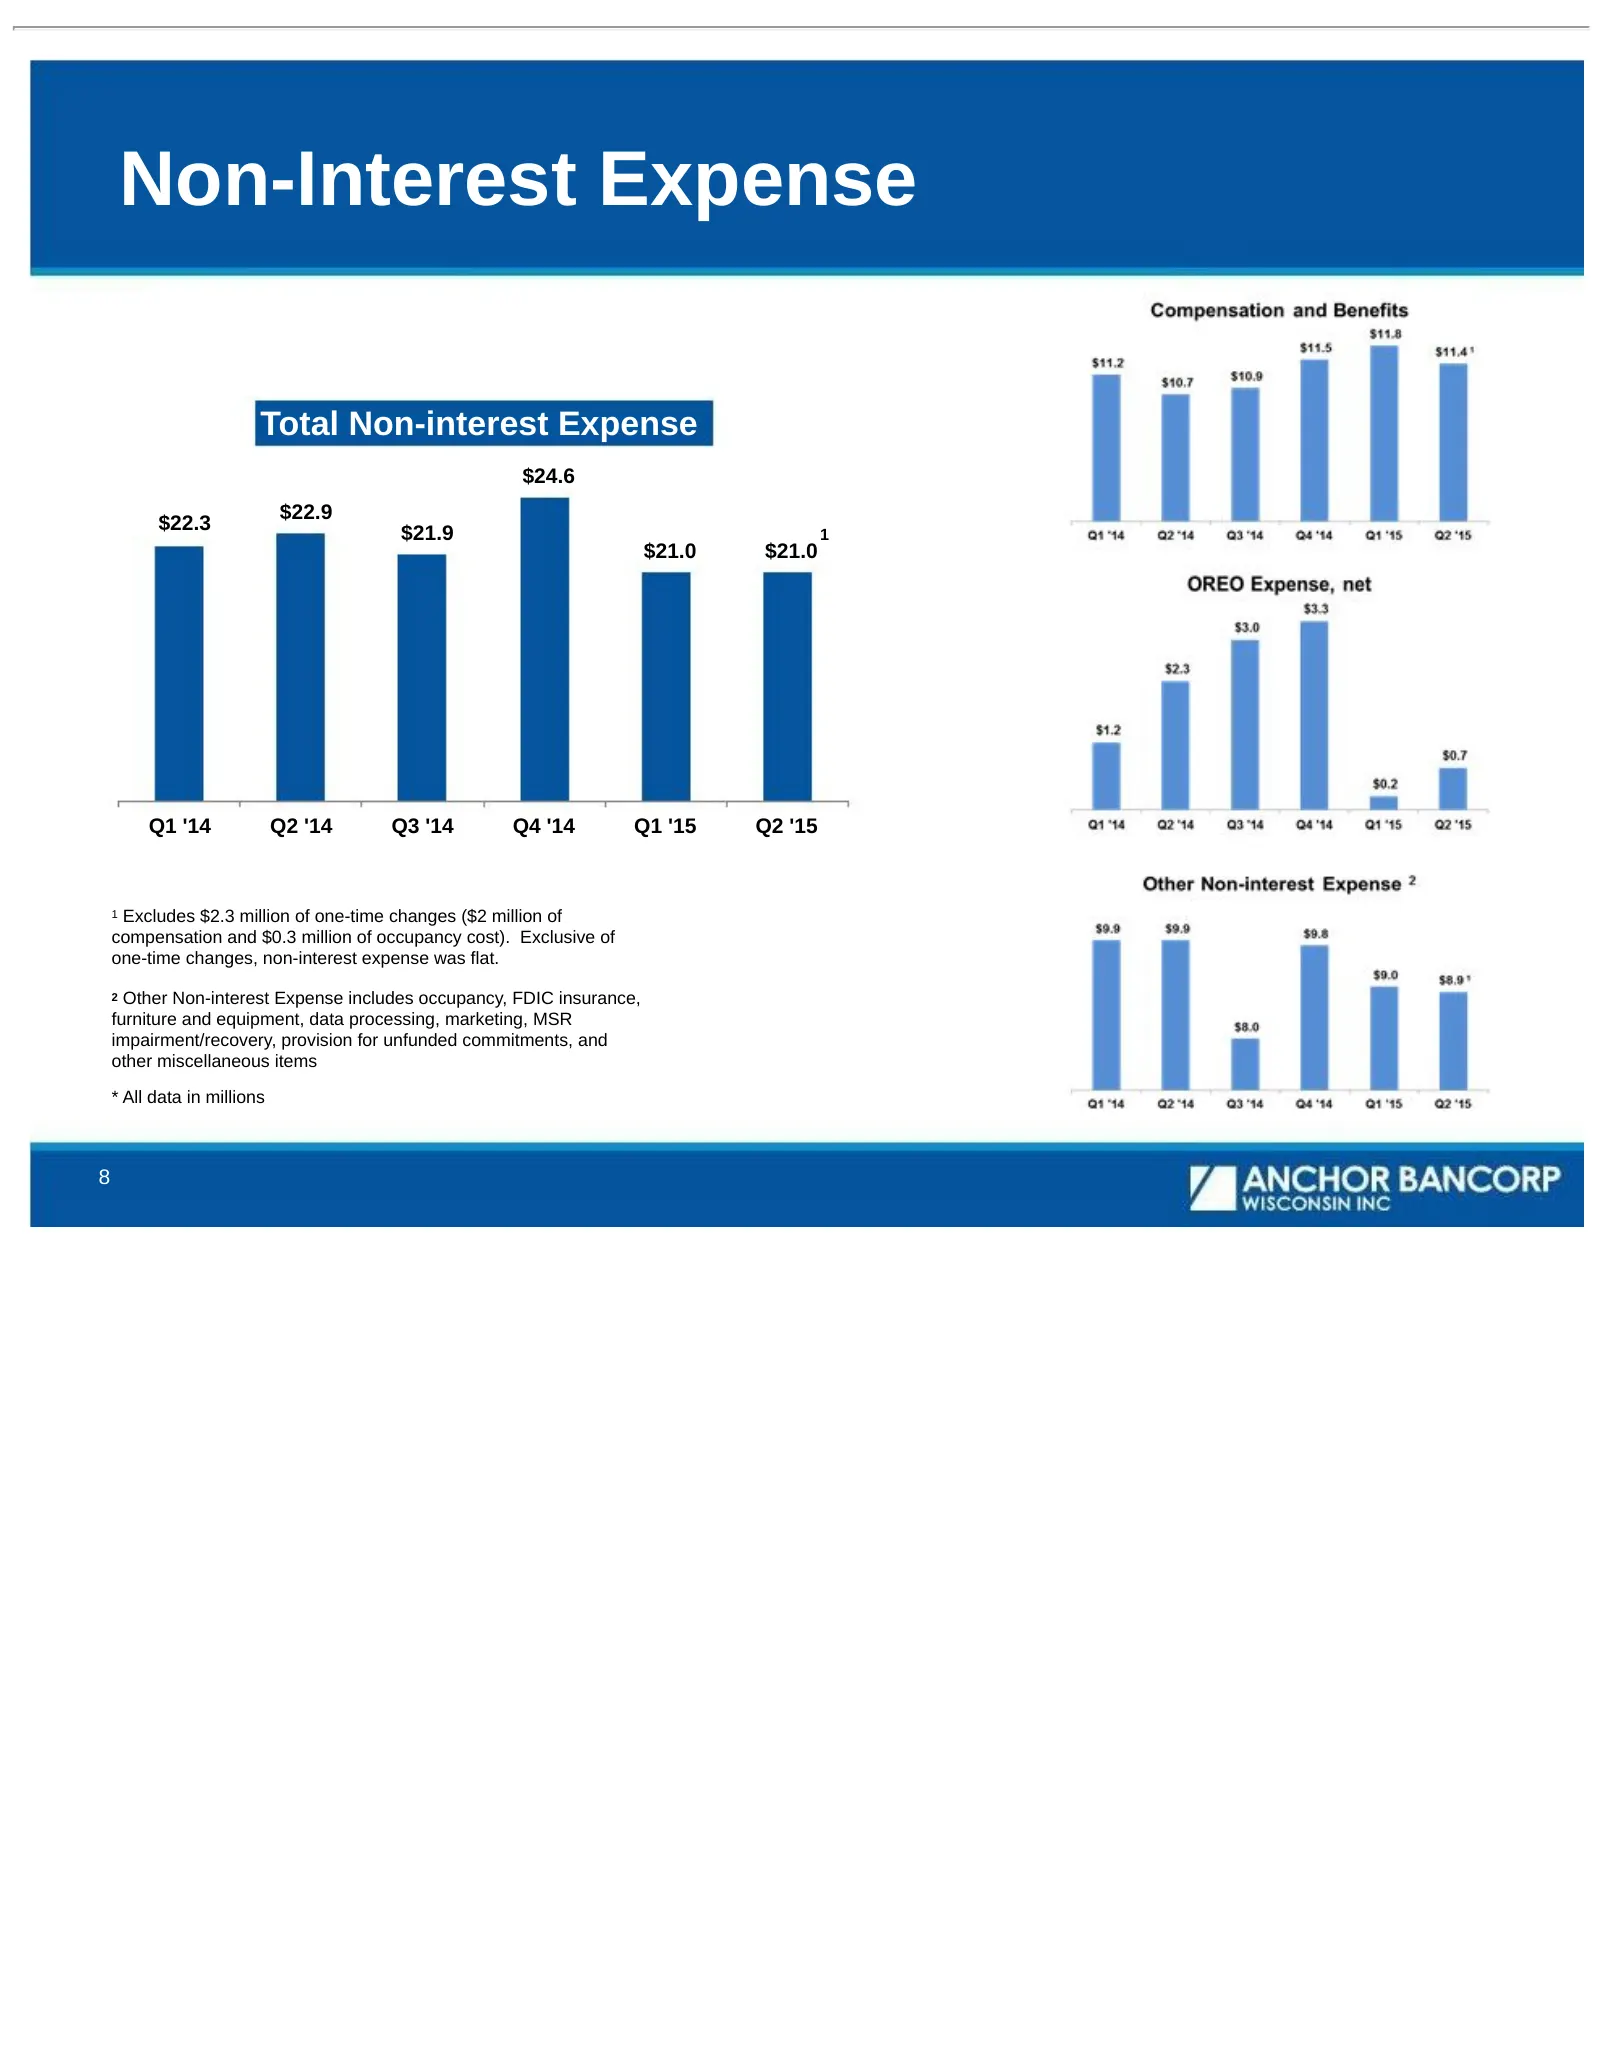
Non-Interest Expense Total Non-interest Expense $24.6 $22.9 $22.3 $21.9 1 $21.0 $21.0 Q1 '14 Q2 '14 Q3 '14 Q4 '14 Q1 '15 Q2 '15 1 Excludes $2.3 million of one-time changes ($2 million of compensation and $0.3 million of occupancy cost). Exclusive of one-time changes, non-interest expense was flat. 2
Slide 9: Summary of Recent Initiatives
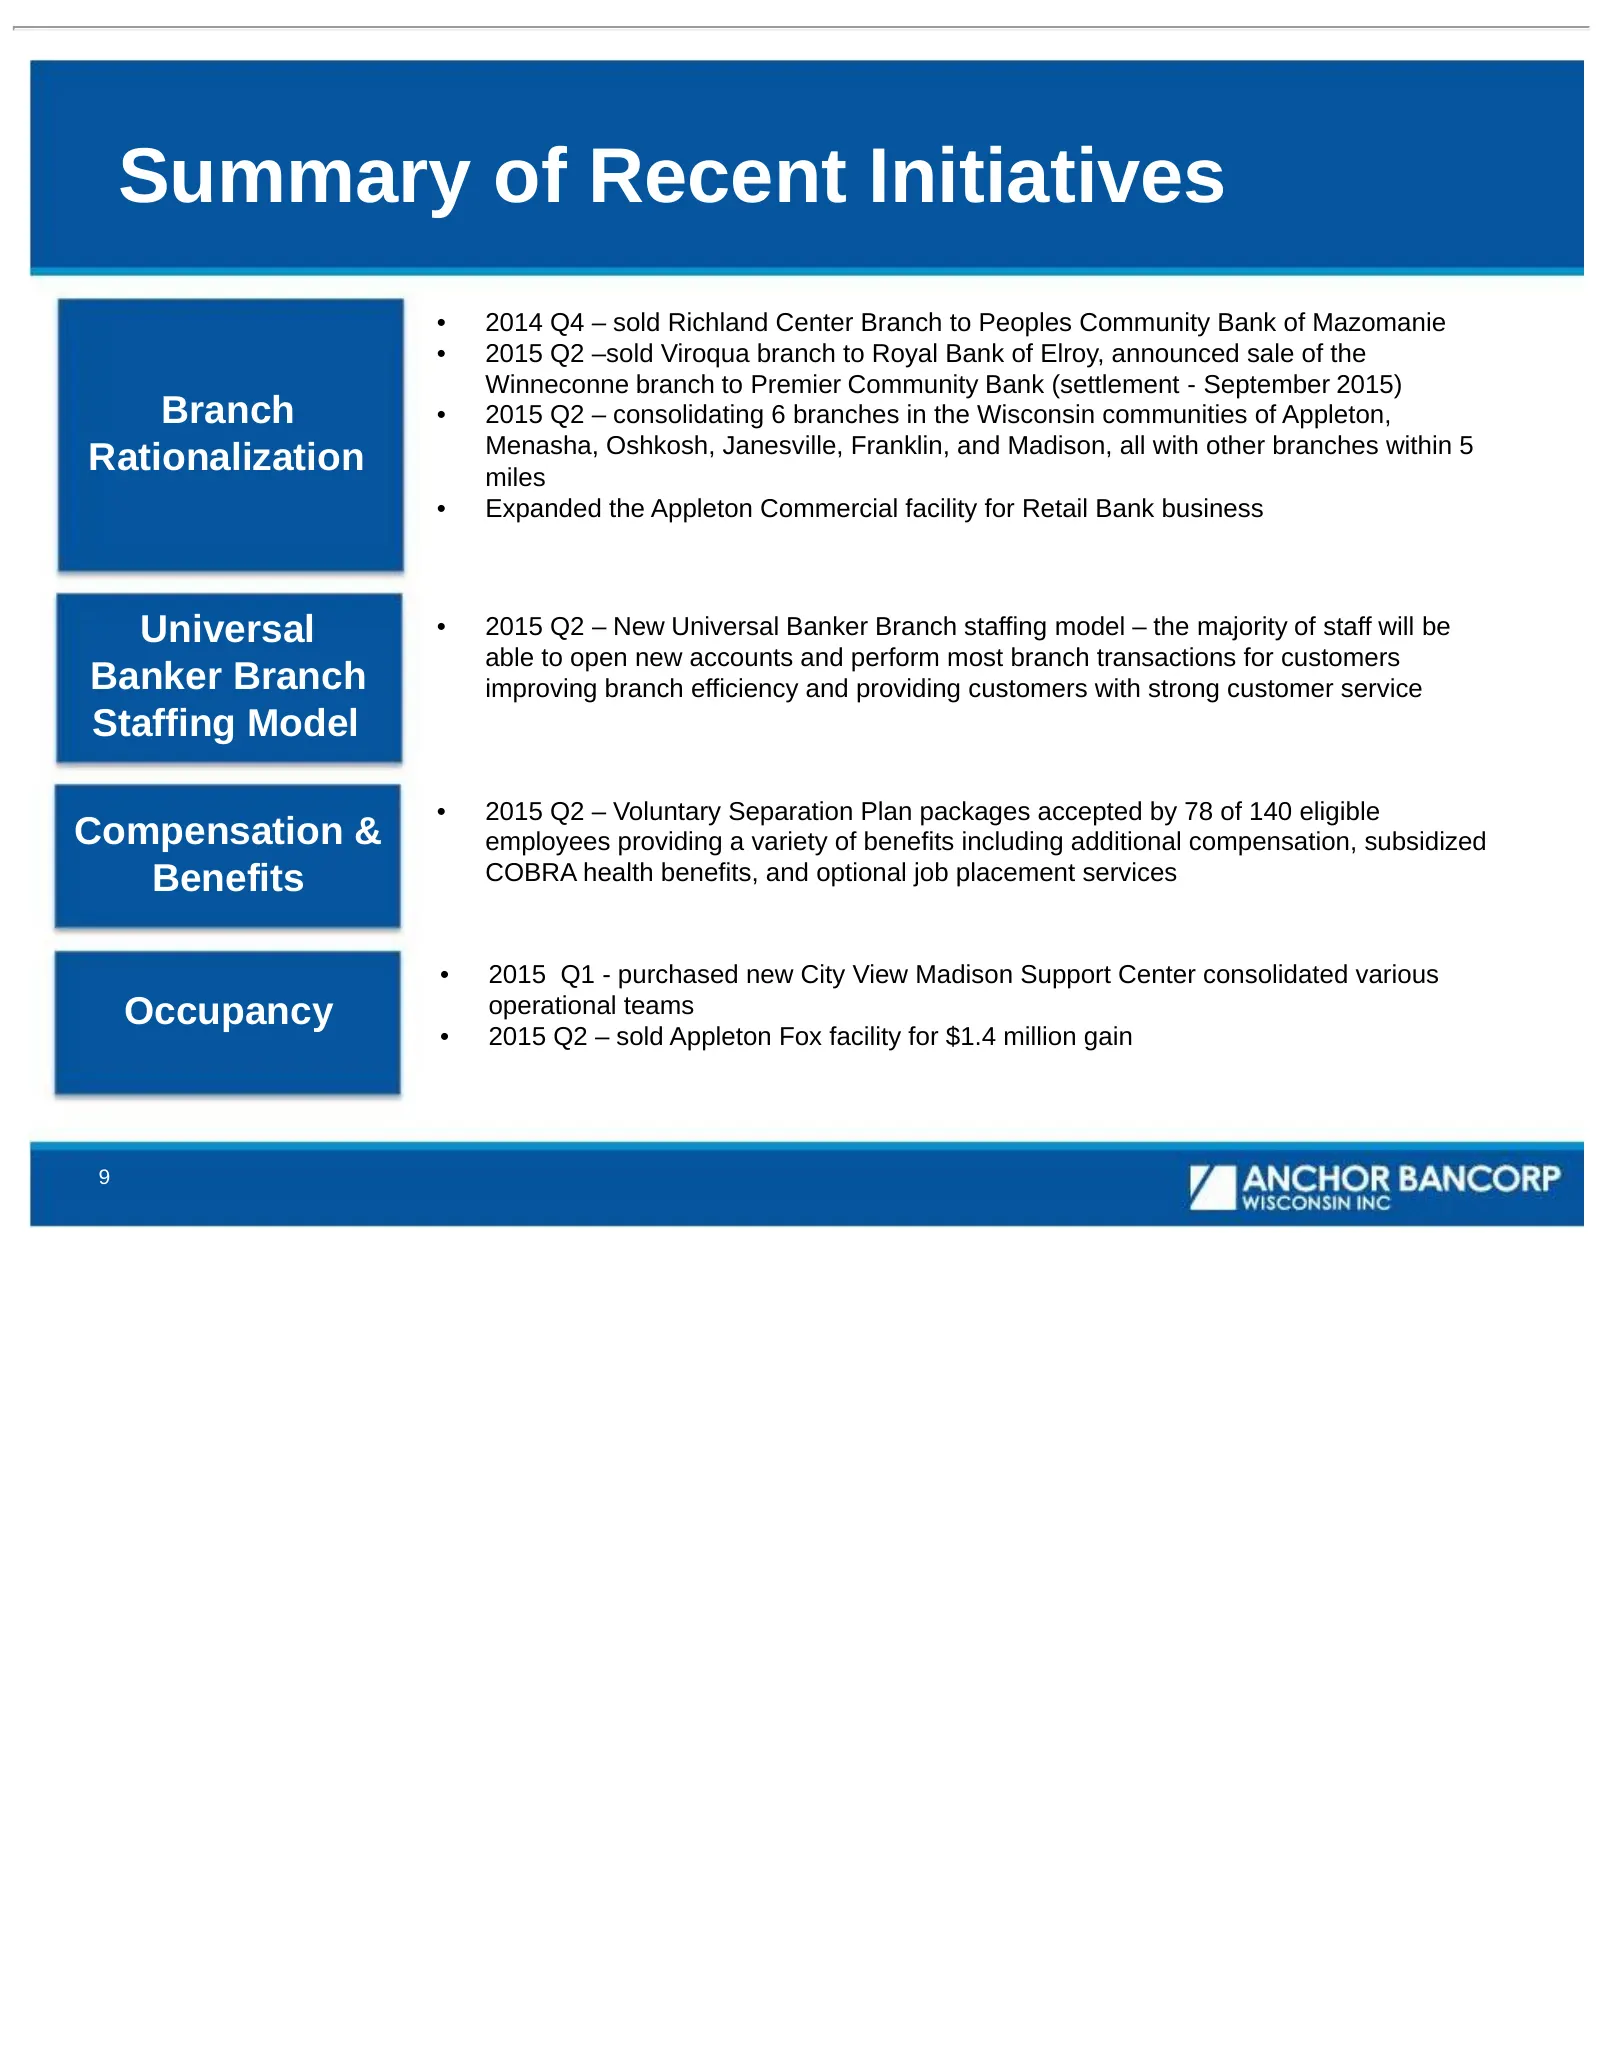
Summary of Recent Initiatives • 2014 Q4 – sold Richland Center Branch to Peoples Community Bank of Mazomanie • 2015 Q2 –sold Viroqua branch to Royal Bank of Elroy, announced sale of the Winneconne branch to Premier Community Bank (settlement - September 2015) Branch • 2015 Q2 – consolidating 6 branc
Slide 10: Loan Portfolio & Yields
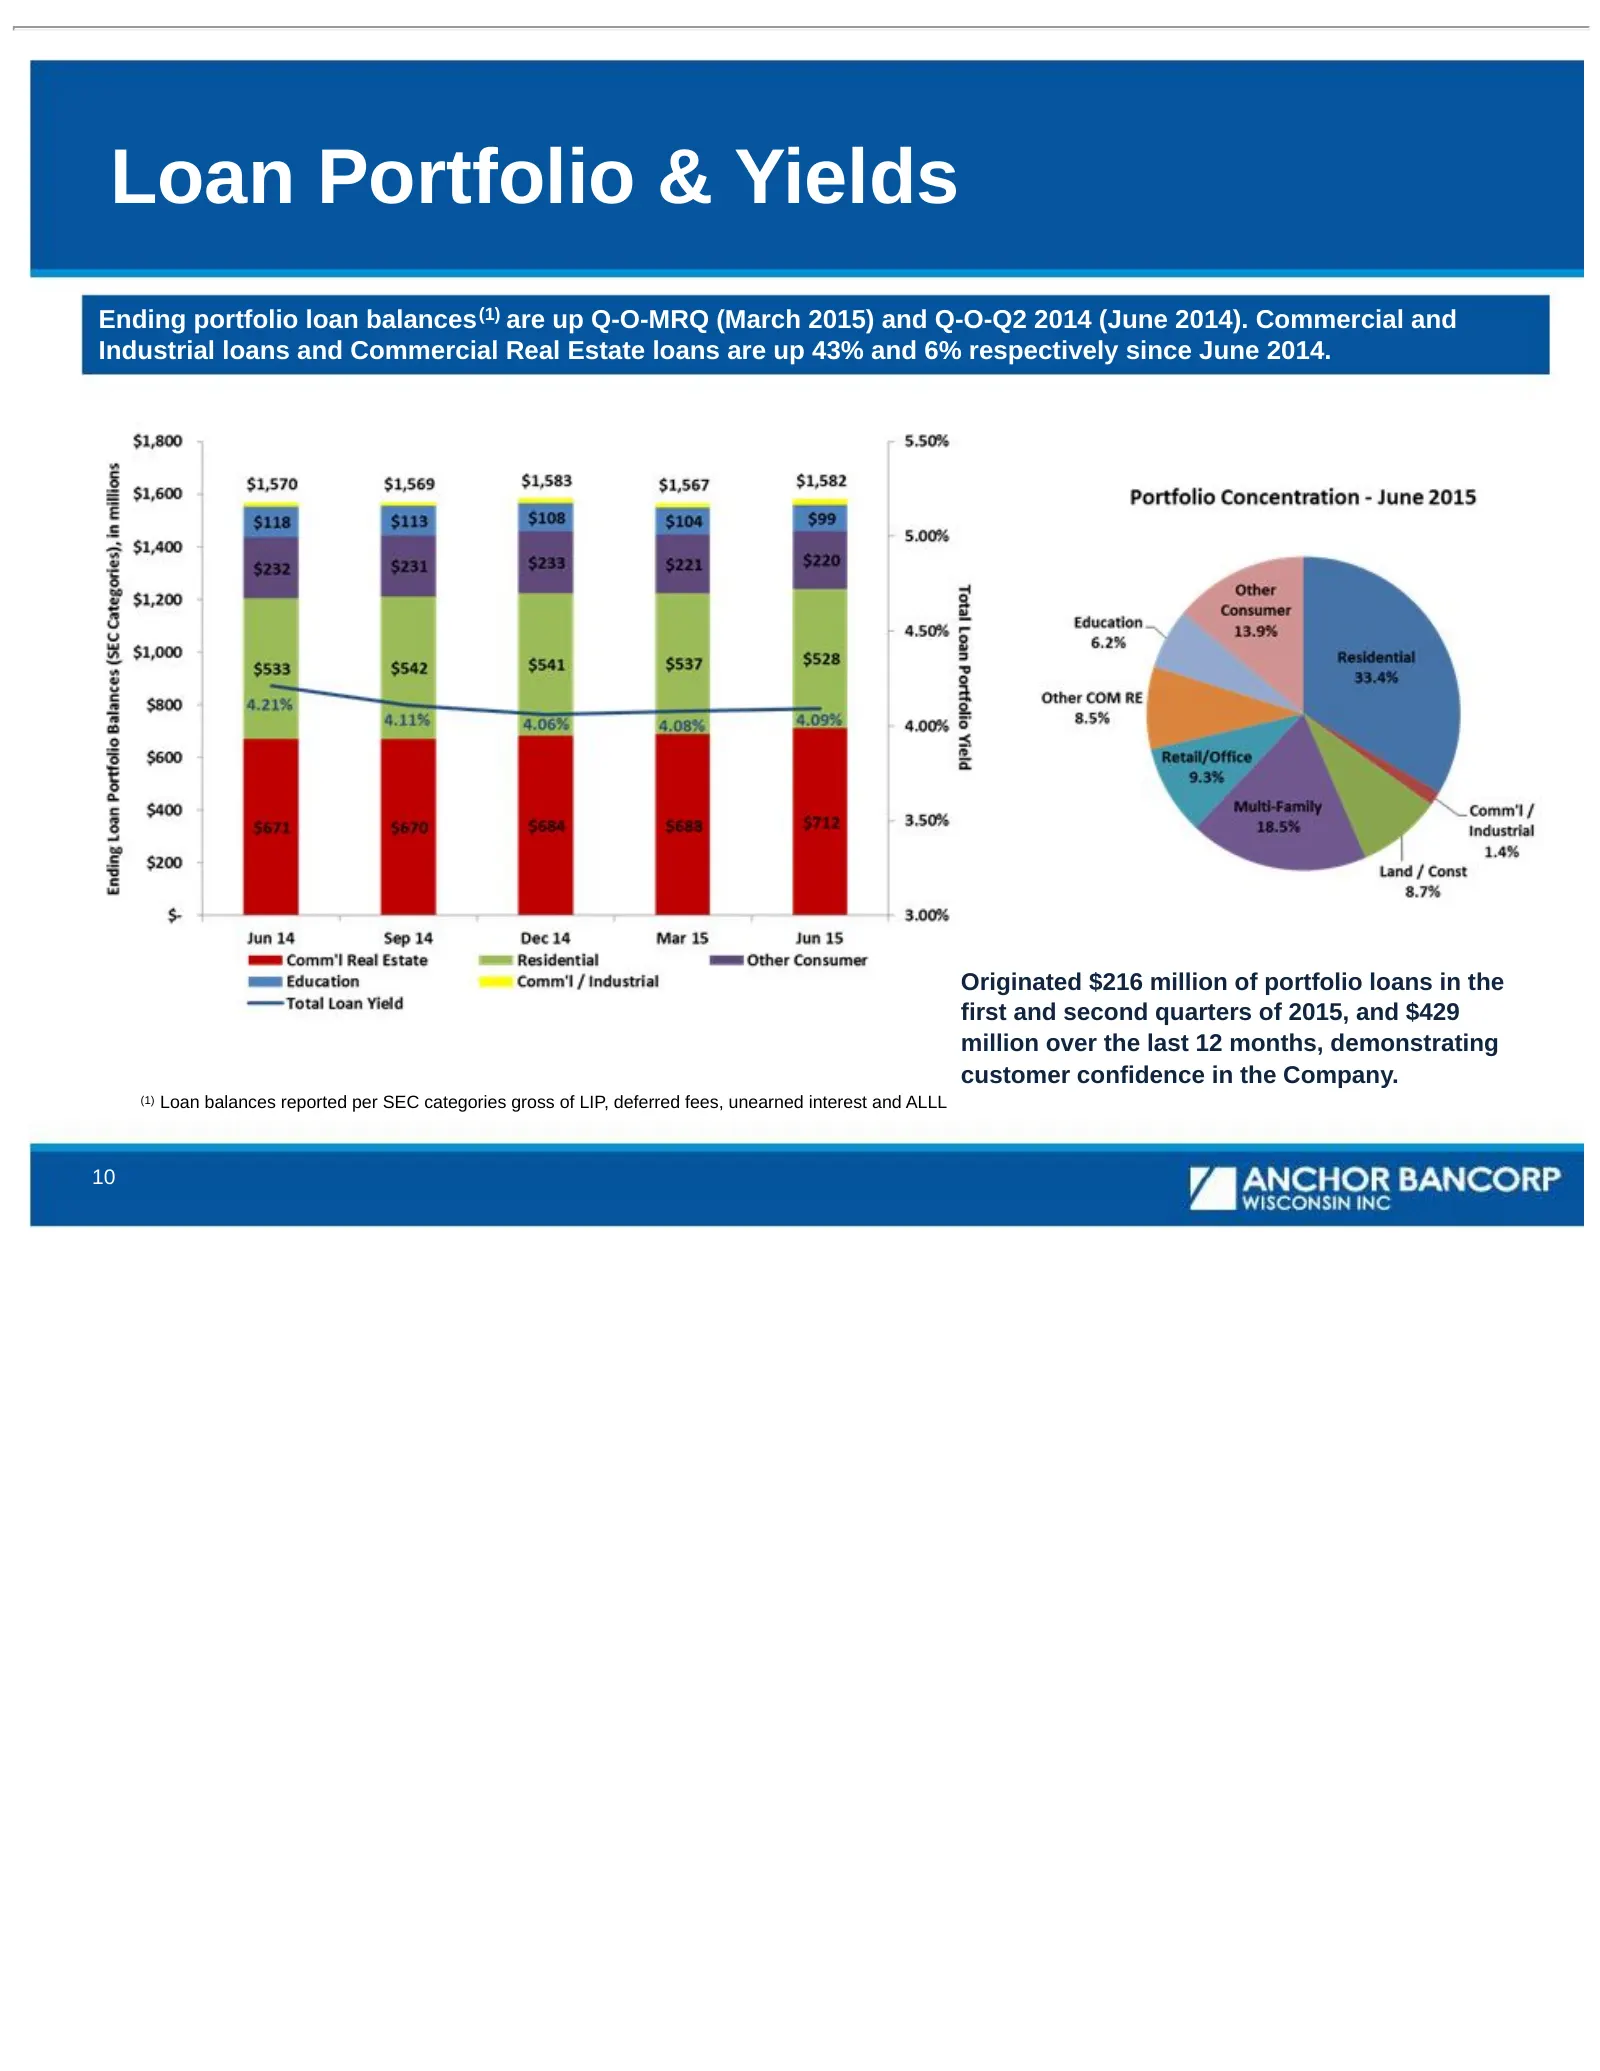
Loan Portfolio & Yields Ending portfolio loan balances (1) are up Q-O-MRQ (March 2015) and Q-O-Q2 2014 (June 2014). Commercial and Industrial loans and Commercial Real Estate loans are up 43% and 6% respectively since June 2014. Originated $216 million of portfolio loans in the first and second quar
Slide 11: Deposit Mix
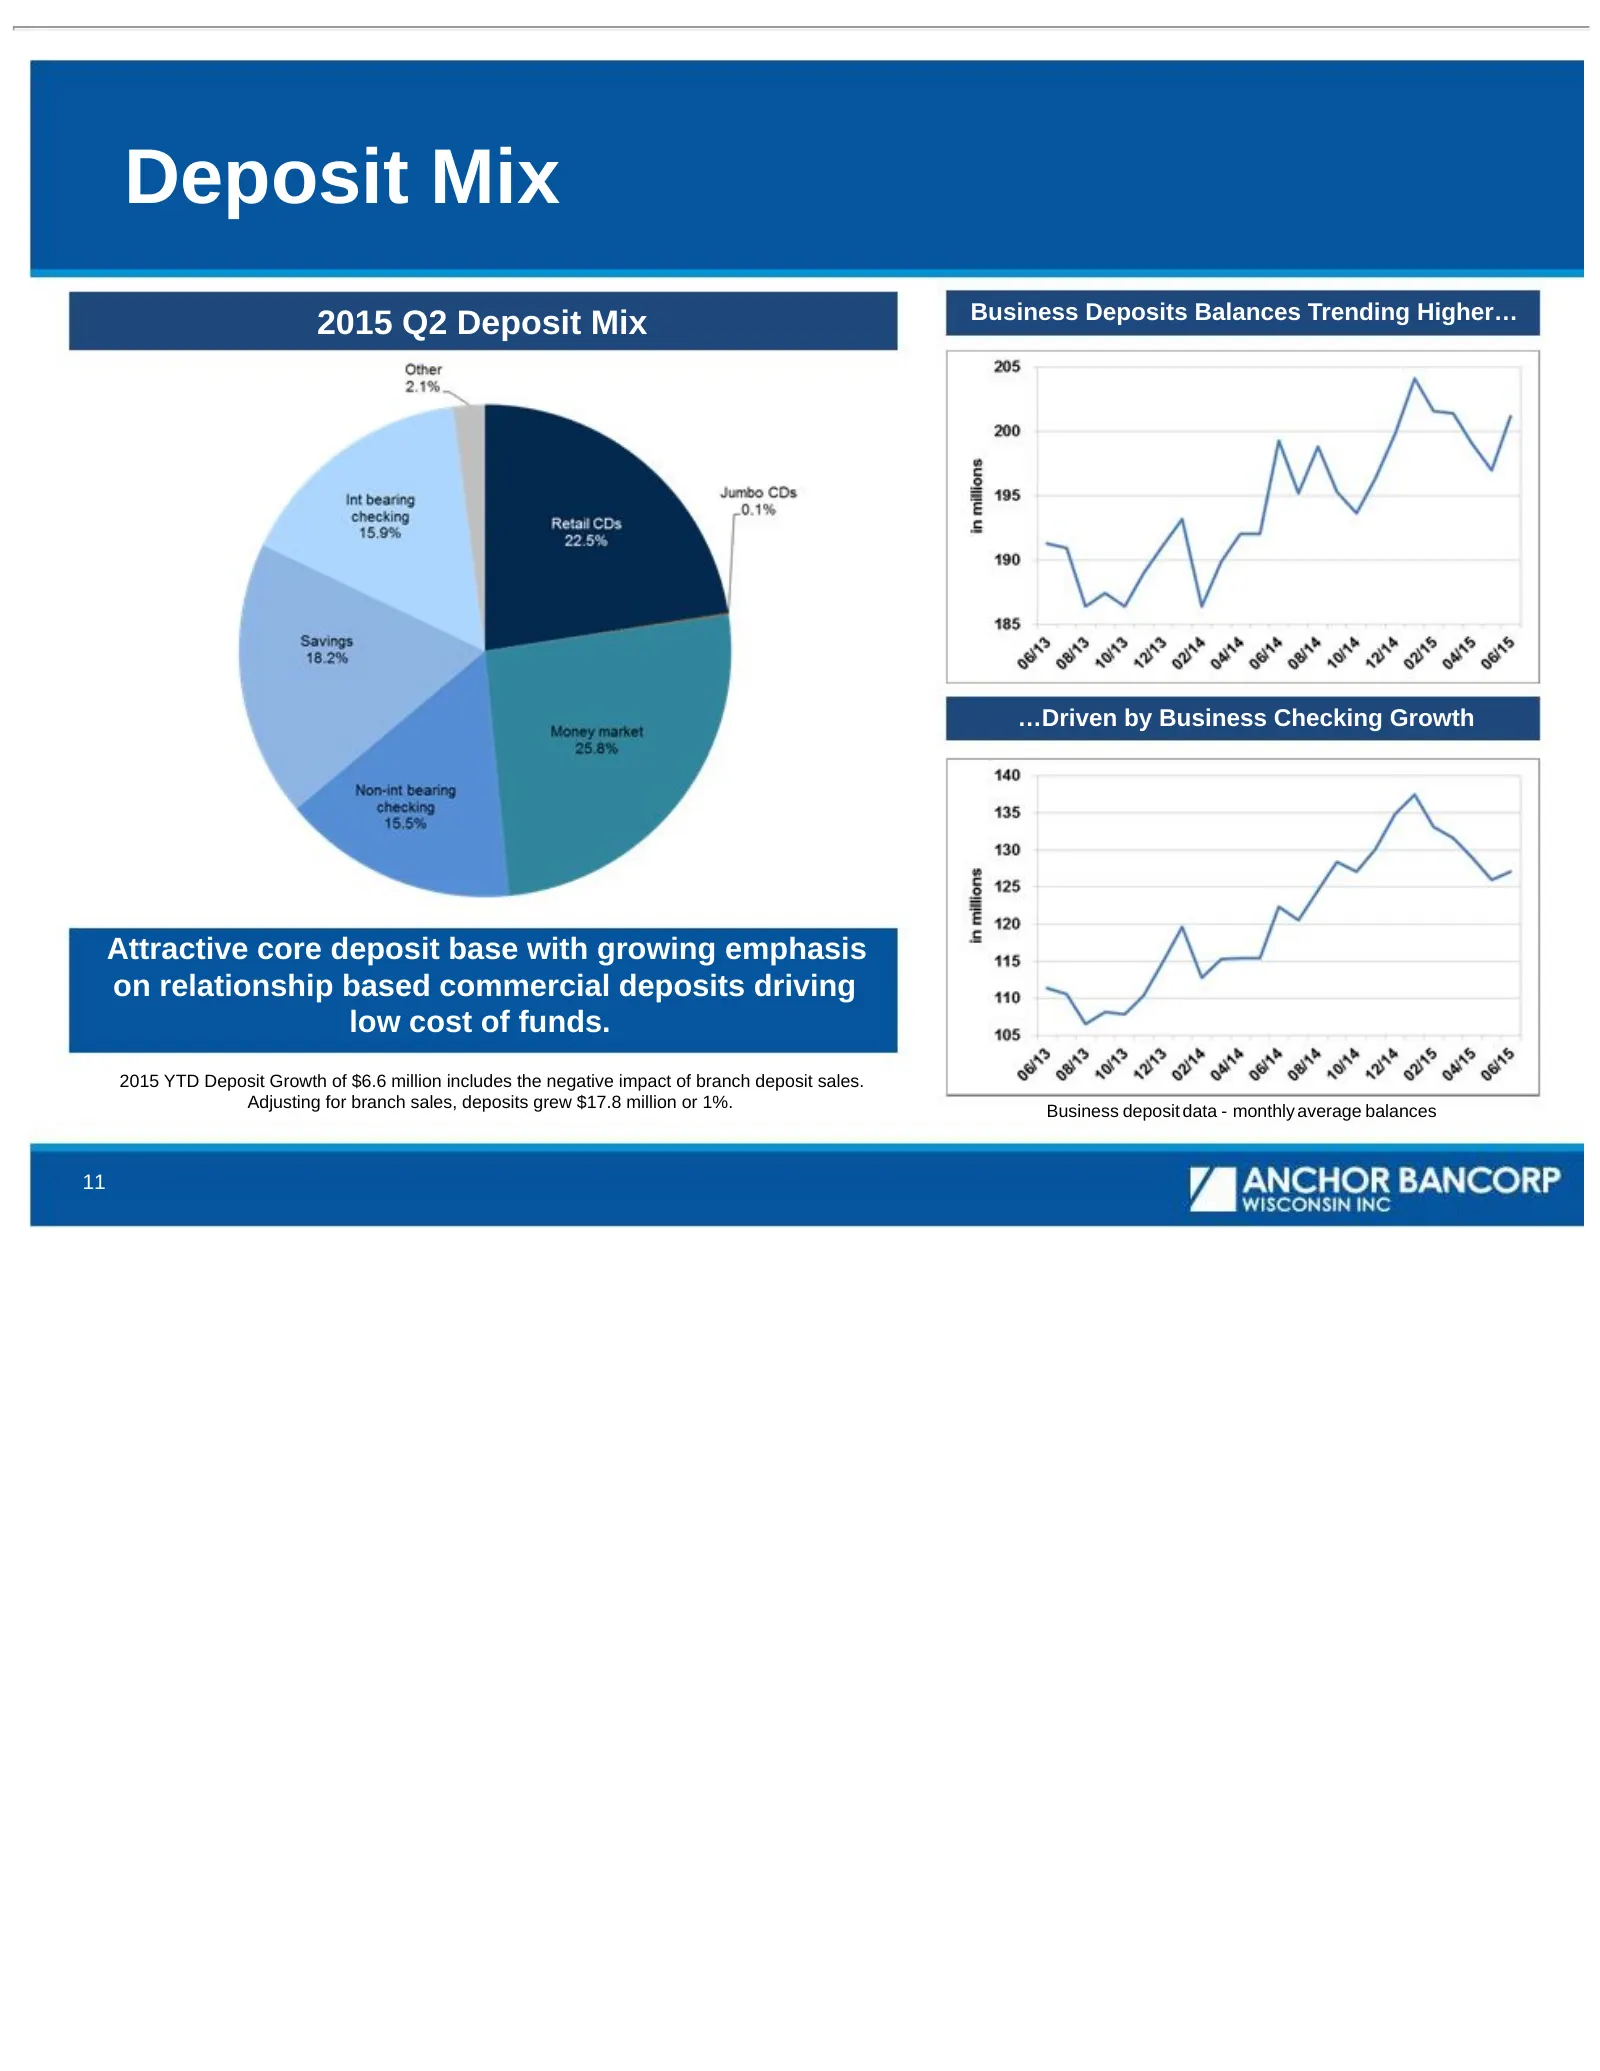
Deposit Mix Business Deposits Balances Trending Higher… 2015 Q2 Deposit Mix …Driven by Business Checking Growth Attractive core deposit base with growing emphasis on relationship based commercial deposits driving low cost of funds. 2015 YTD Deposit Growth of $6.6 million includes the negative impact
Slide 12: Significantly Improved Asset Quality
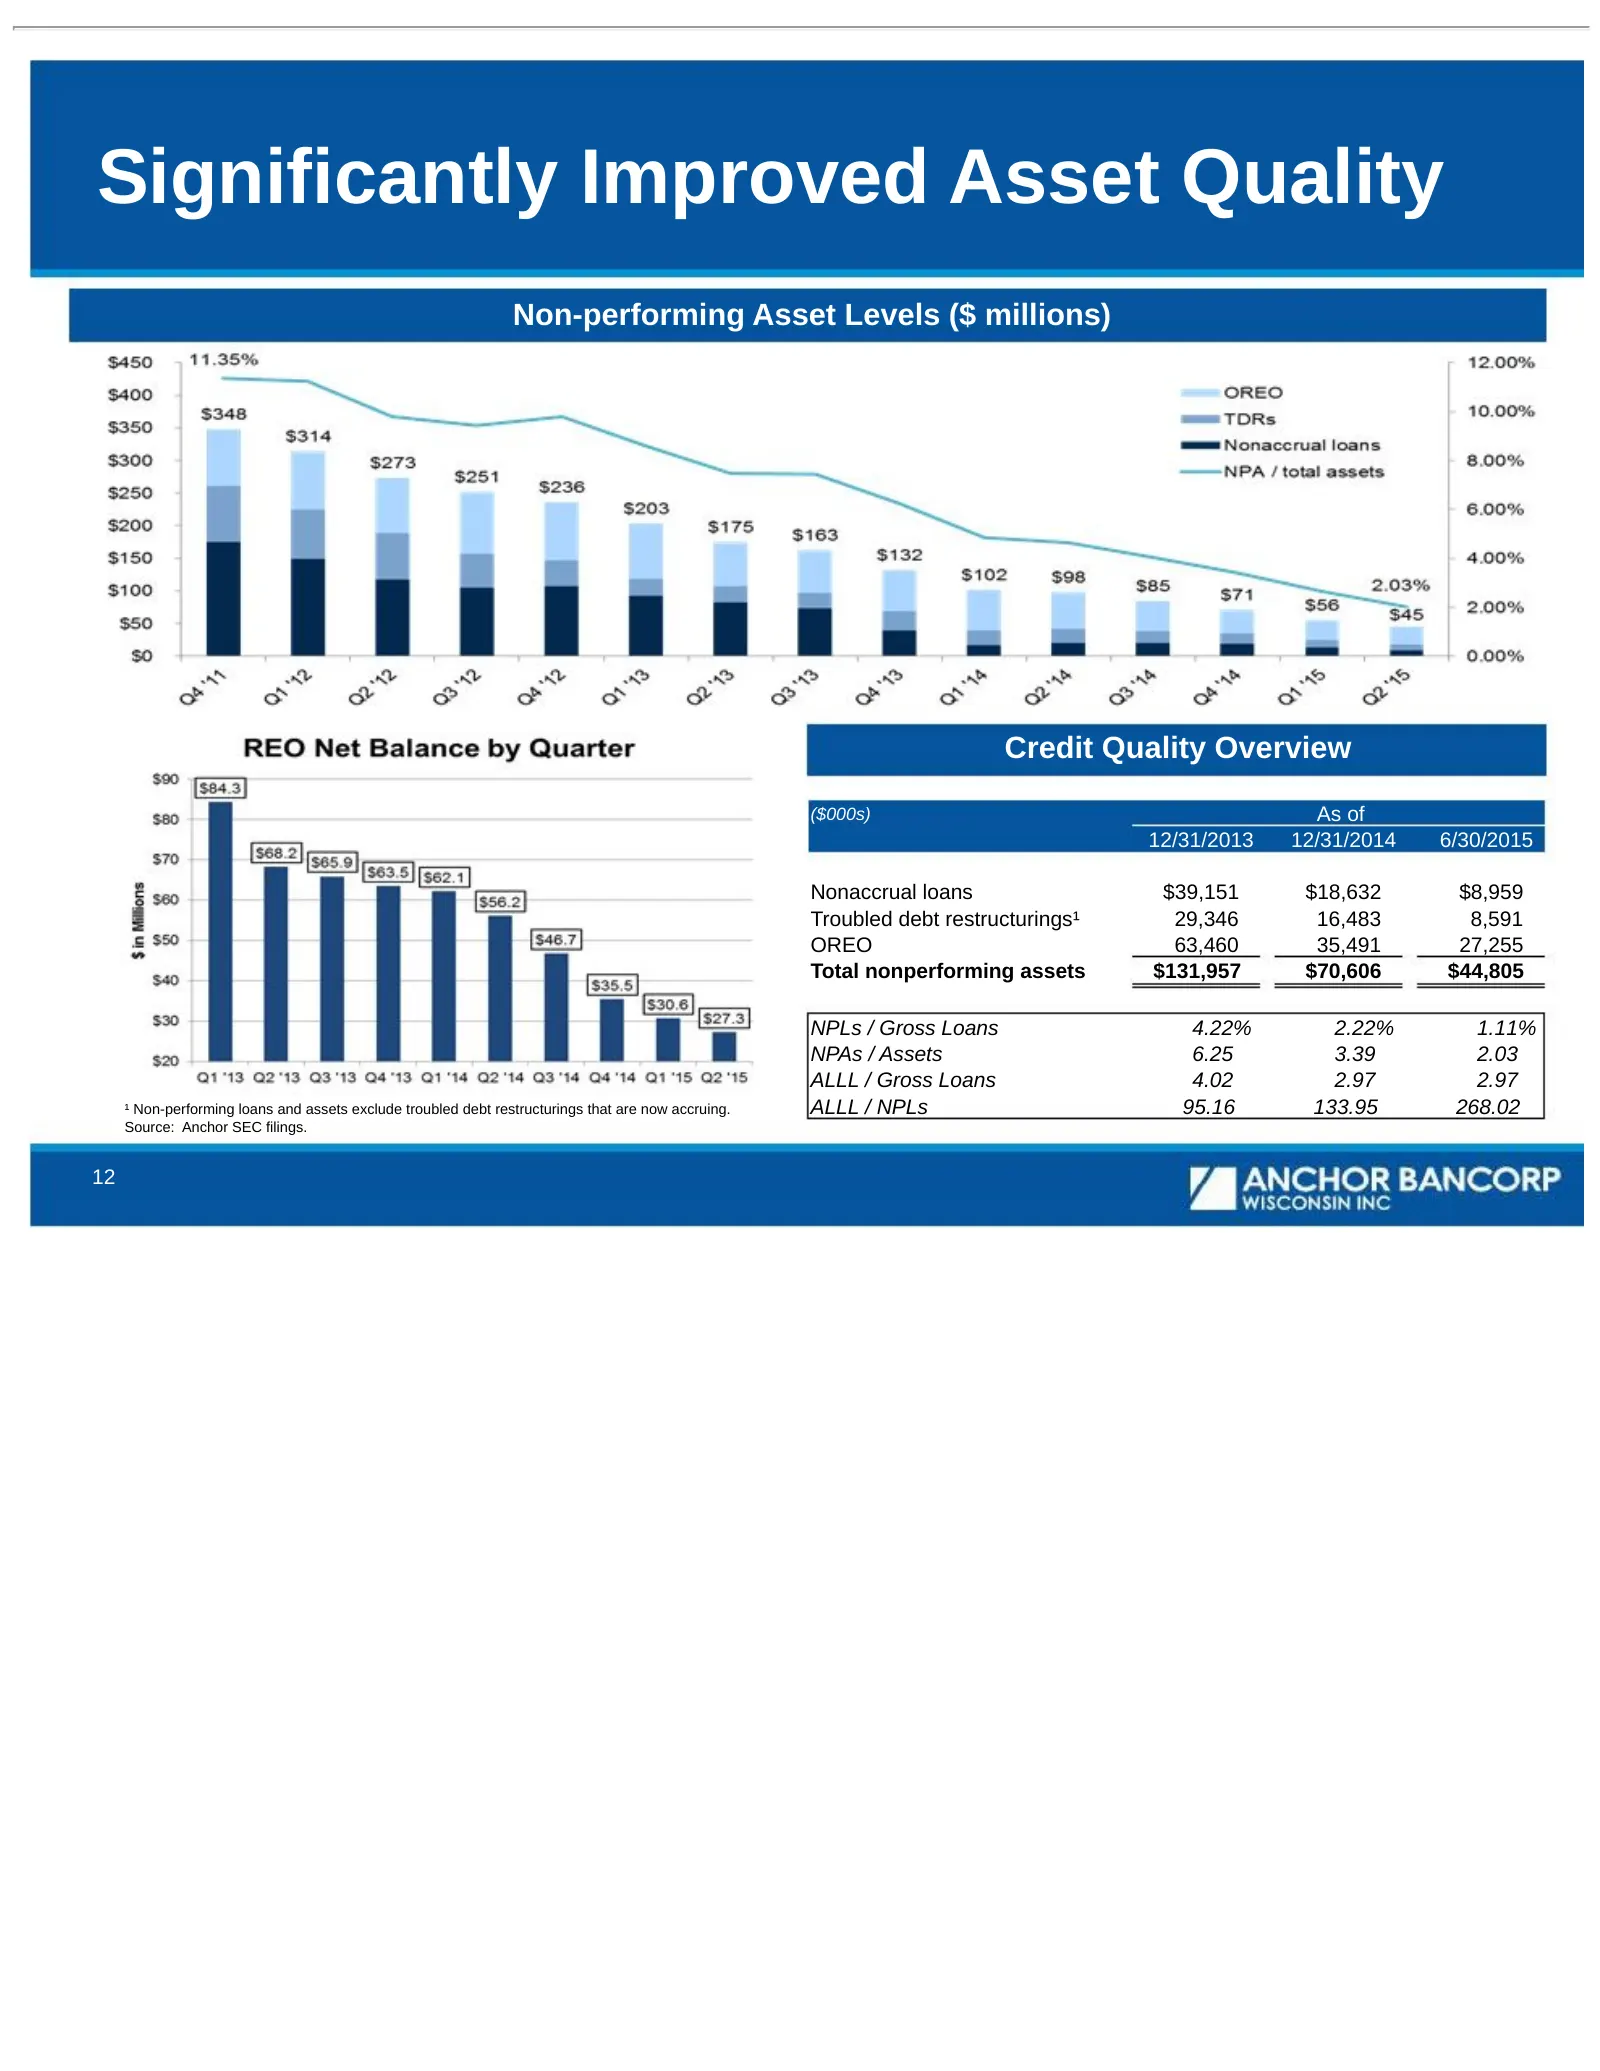
Significantly Improved Asset Quality Non-performing Asset Levels ($ millions) Credit Quality Overview ($000s) As of 12/31/2013 12/31/2014 6/30/2015 Nonaccrual loans $39,151 $18,632 $8,959 Troubled debt restructurings¹ 29,346 16,483 8,591 OREO 63,460 35,491 27,255 Total nonperforming assets $131,957
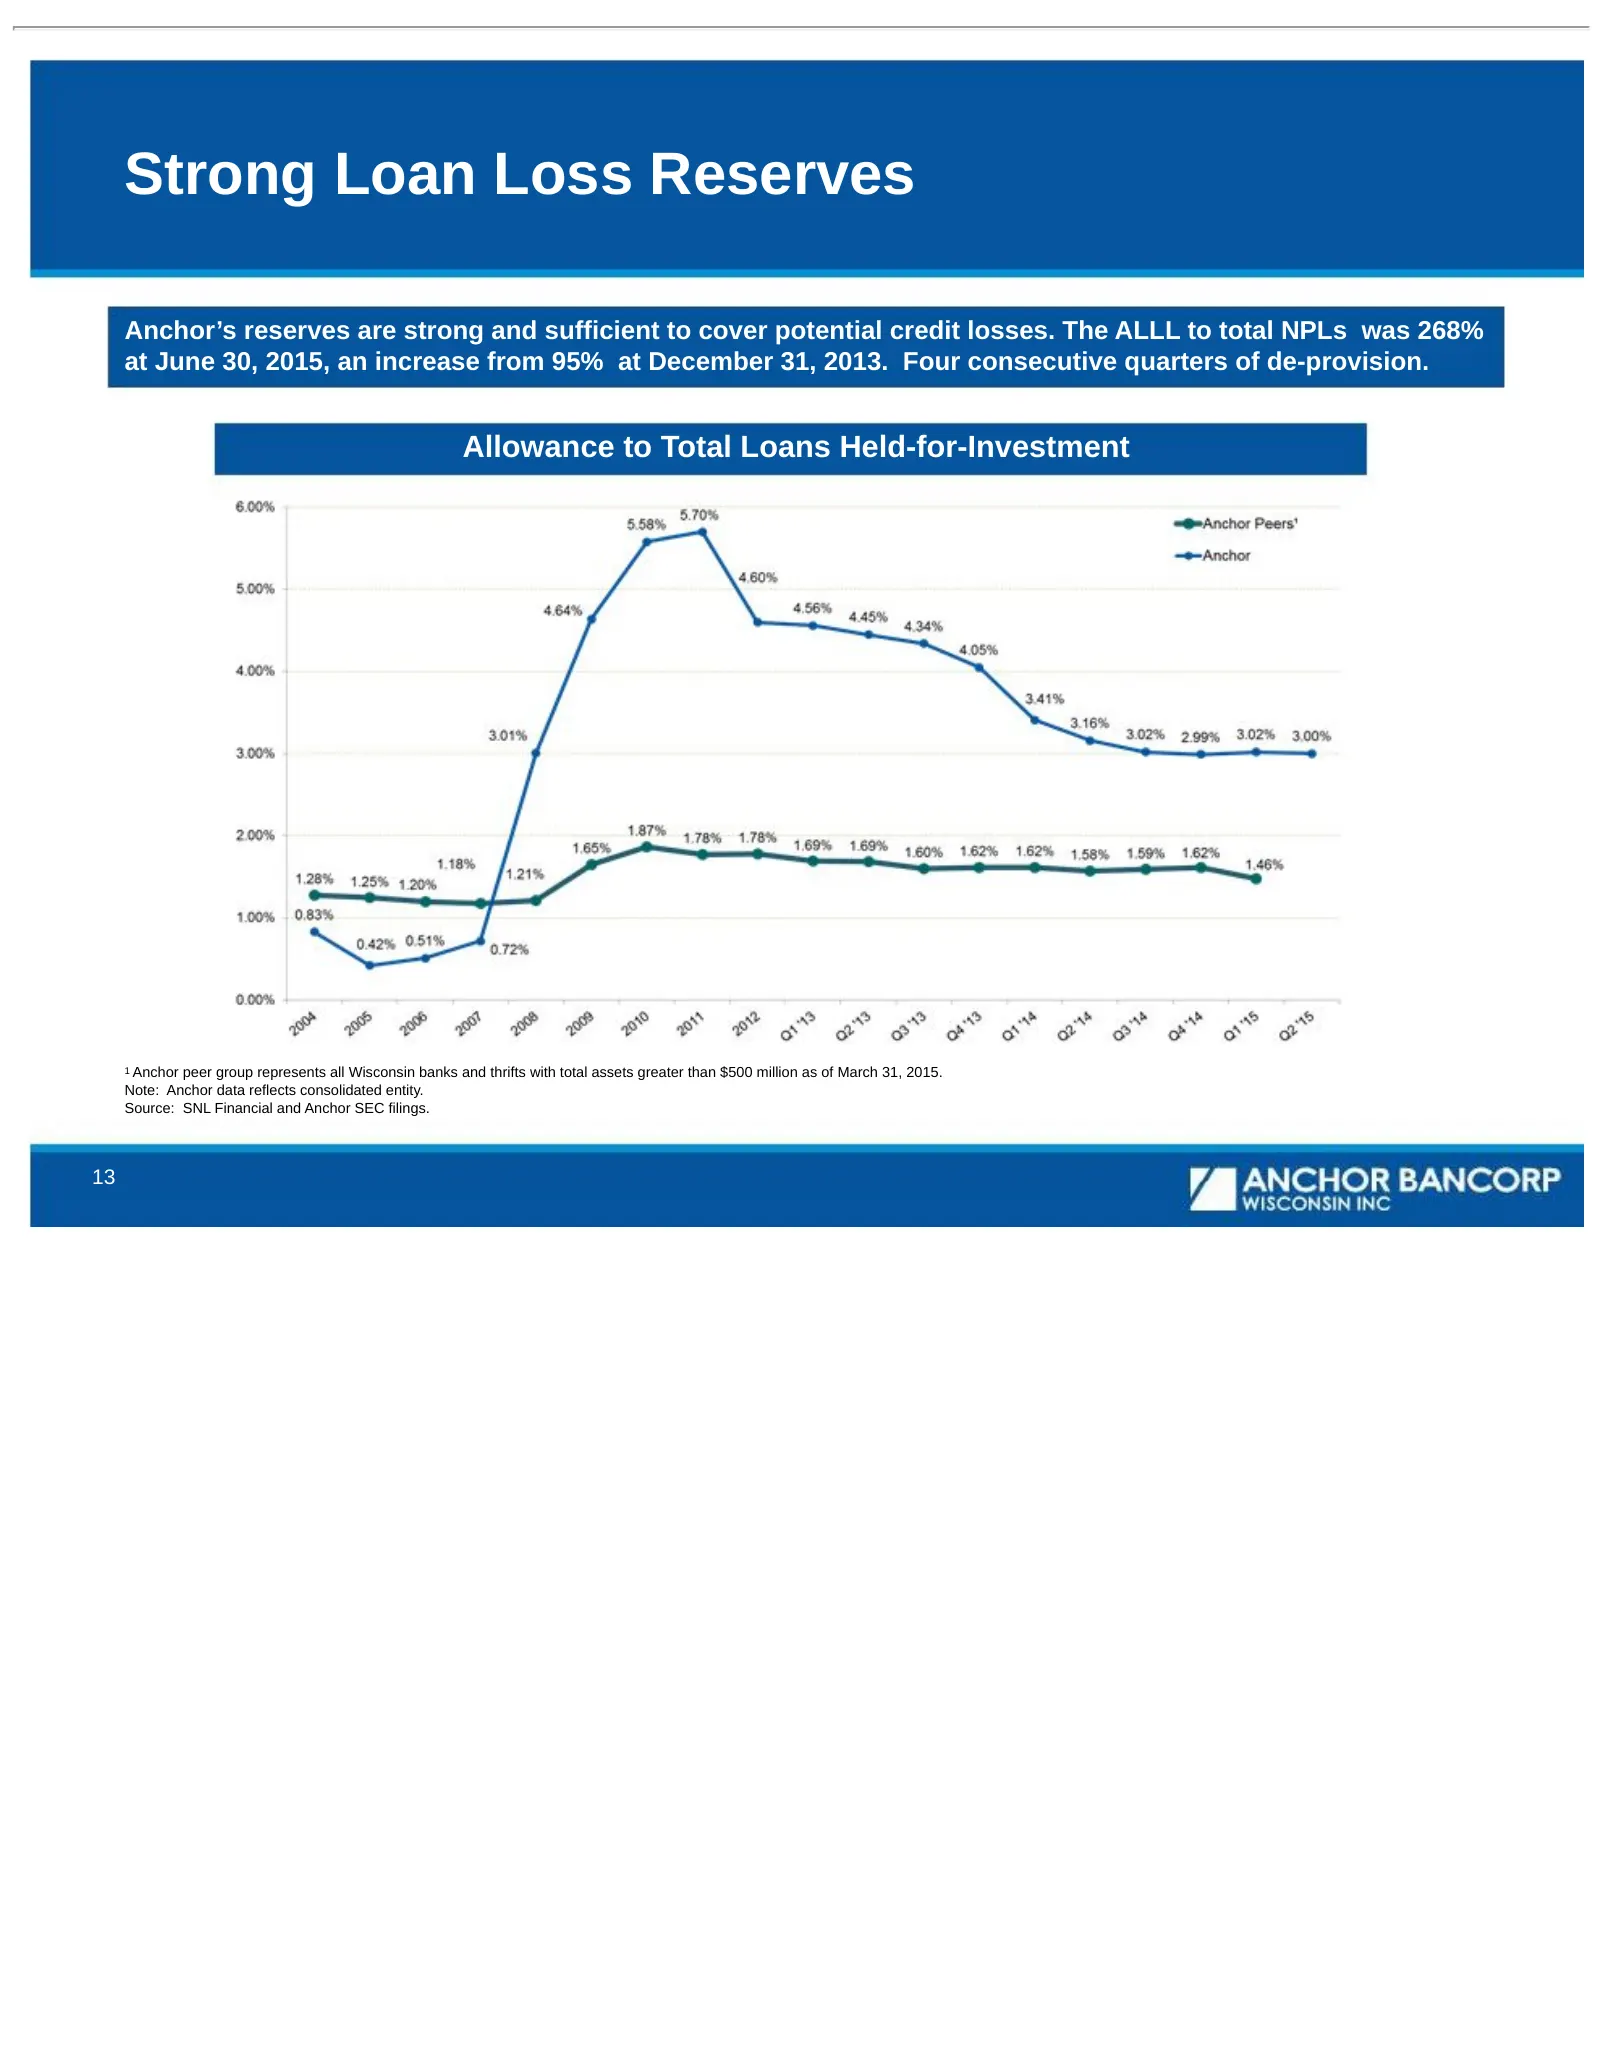
Slide 13: Strong Loan Loss Reserves
Strong Loan Loss Reserves Anchor’s reserves are strong and sufficient to cover potential credit losses. The ALLL to total NPLs was 268% at June 30, 2015, an increase from 95% at December 31, 2013. Four consecutive quarters of de-provision. Allowance to Total Loans Held-for-Investment 1 Anchor peer g
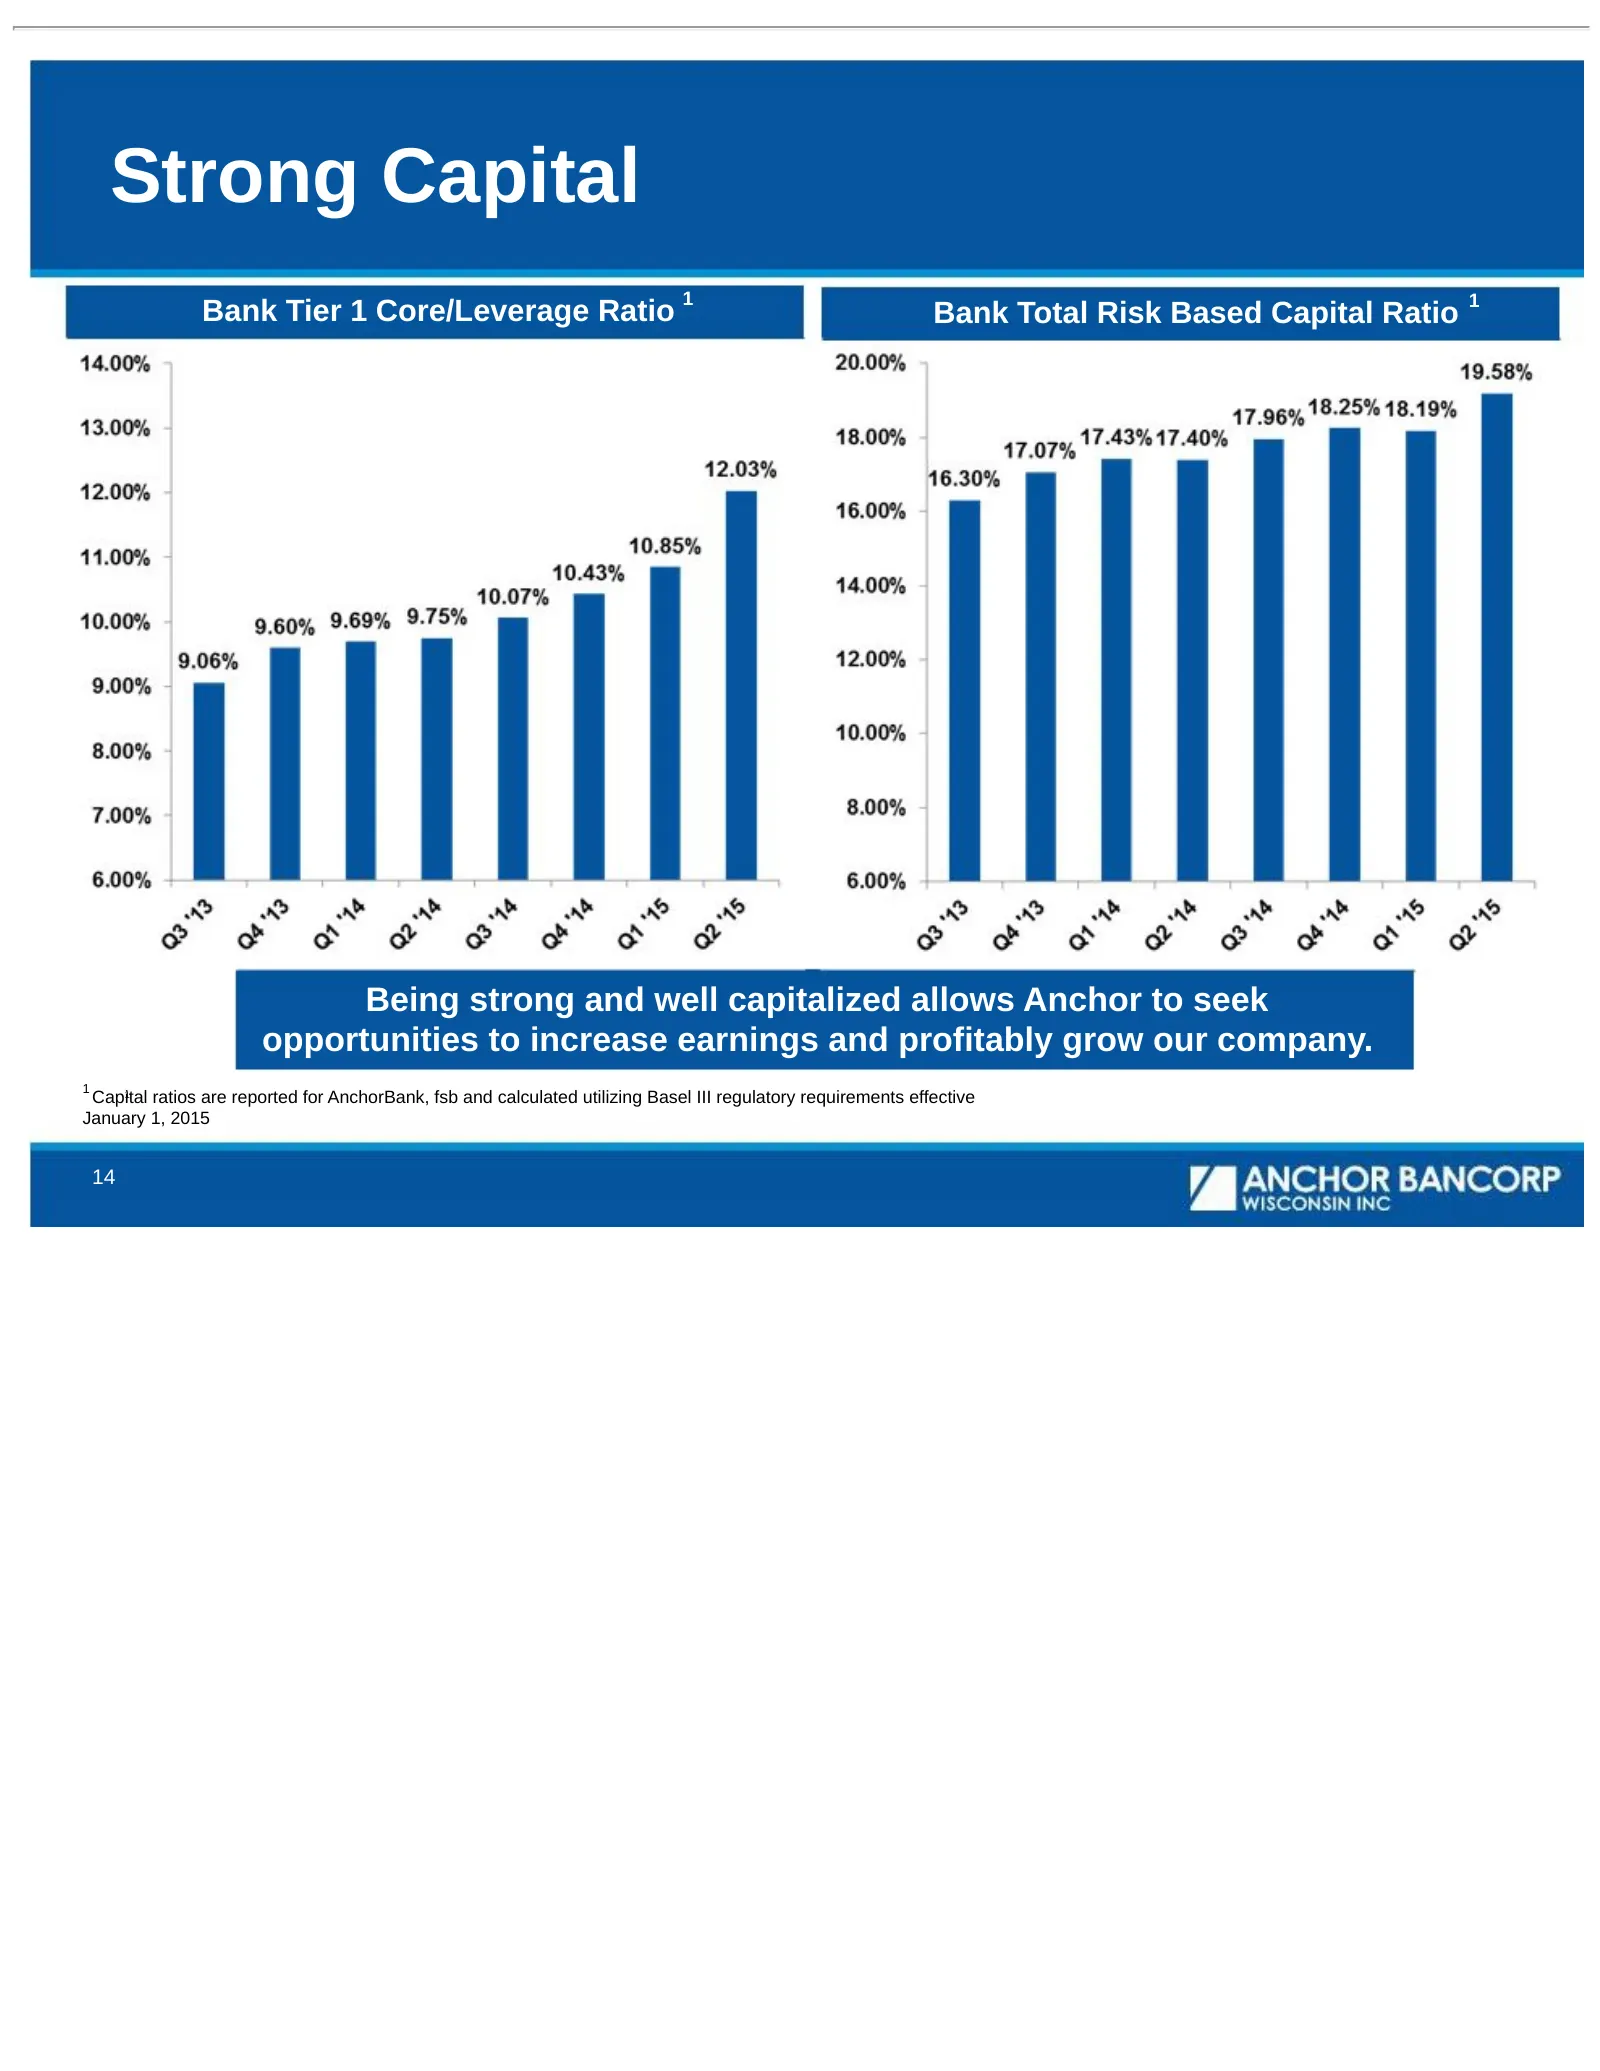
Slide 14: Strong Capital
Strong Capital 1 1 Bank Tier 1 Core/Leverage Ratio Bank Total Risk Based Capital Ratio Being strong and well capitalized allows Anchor to seek opportunities to increase earnings and profitably grow our company. 1 Capital 1 ratios are reported for AnchorBank, fsb and calculated utilizing Basel III re
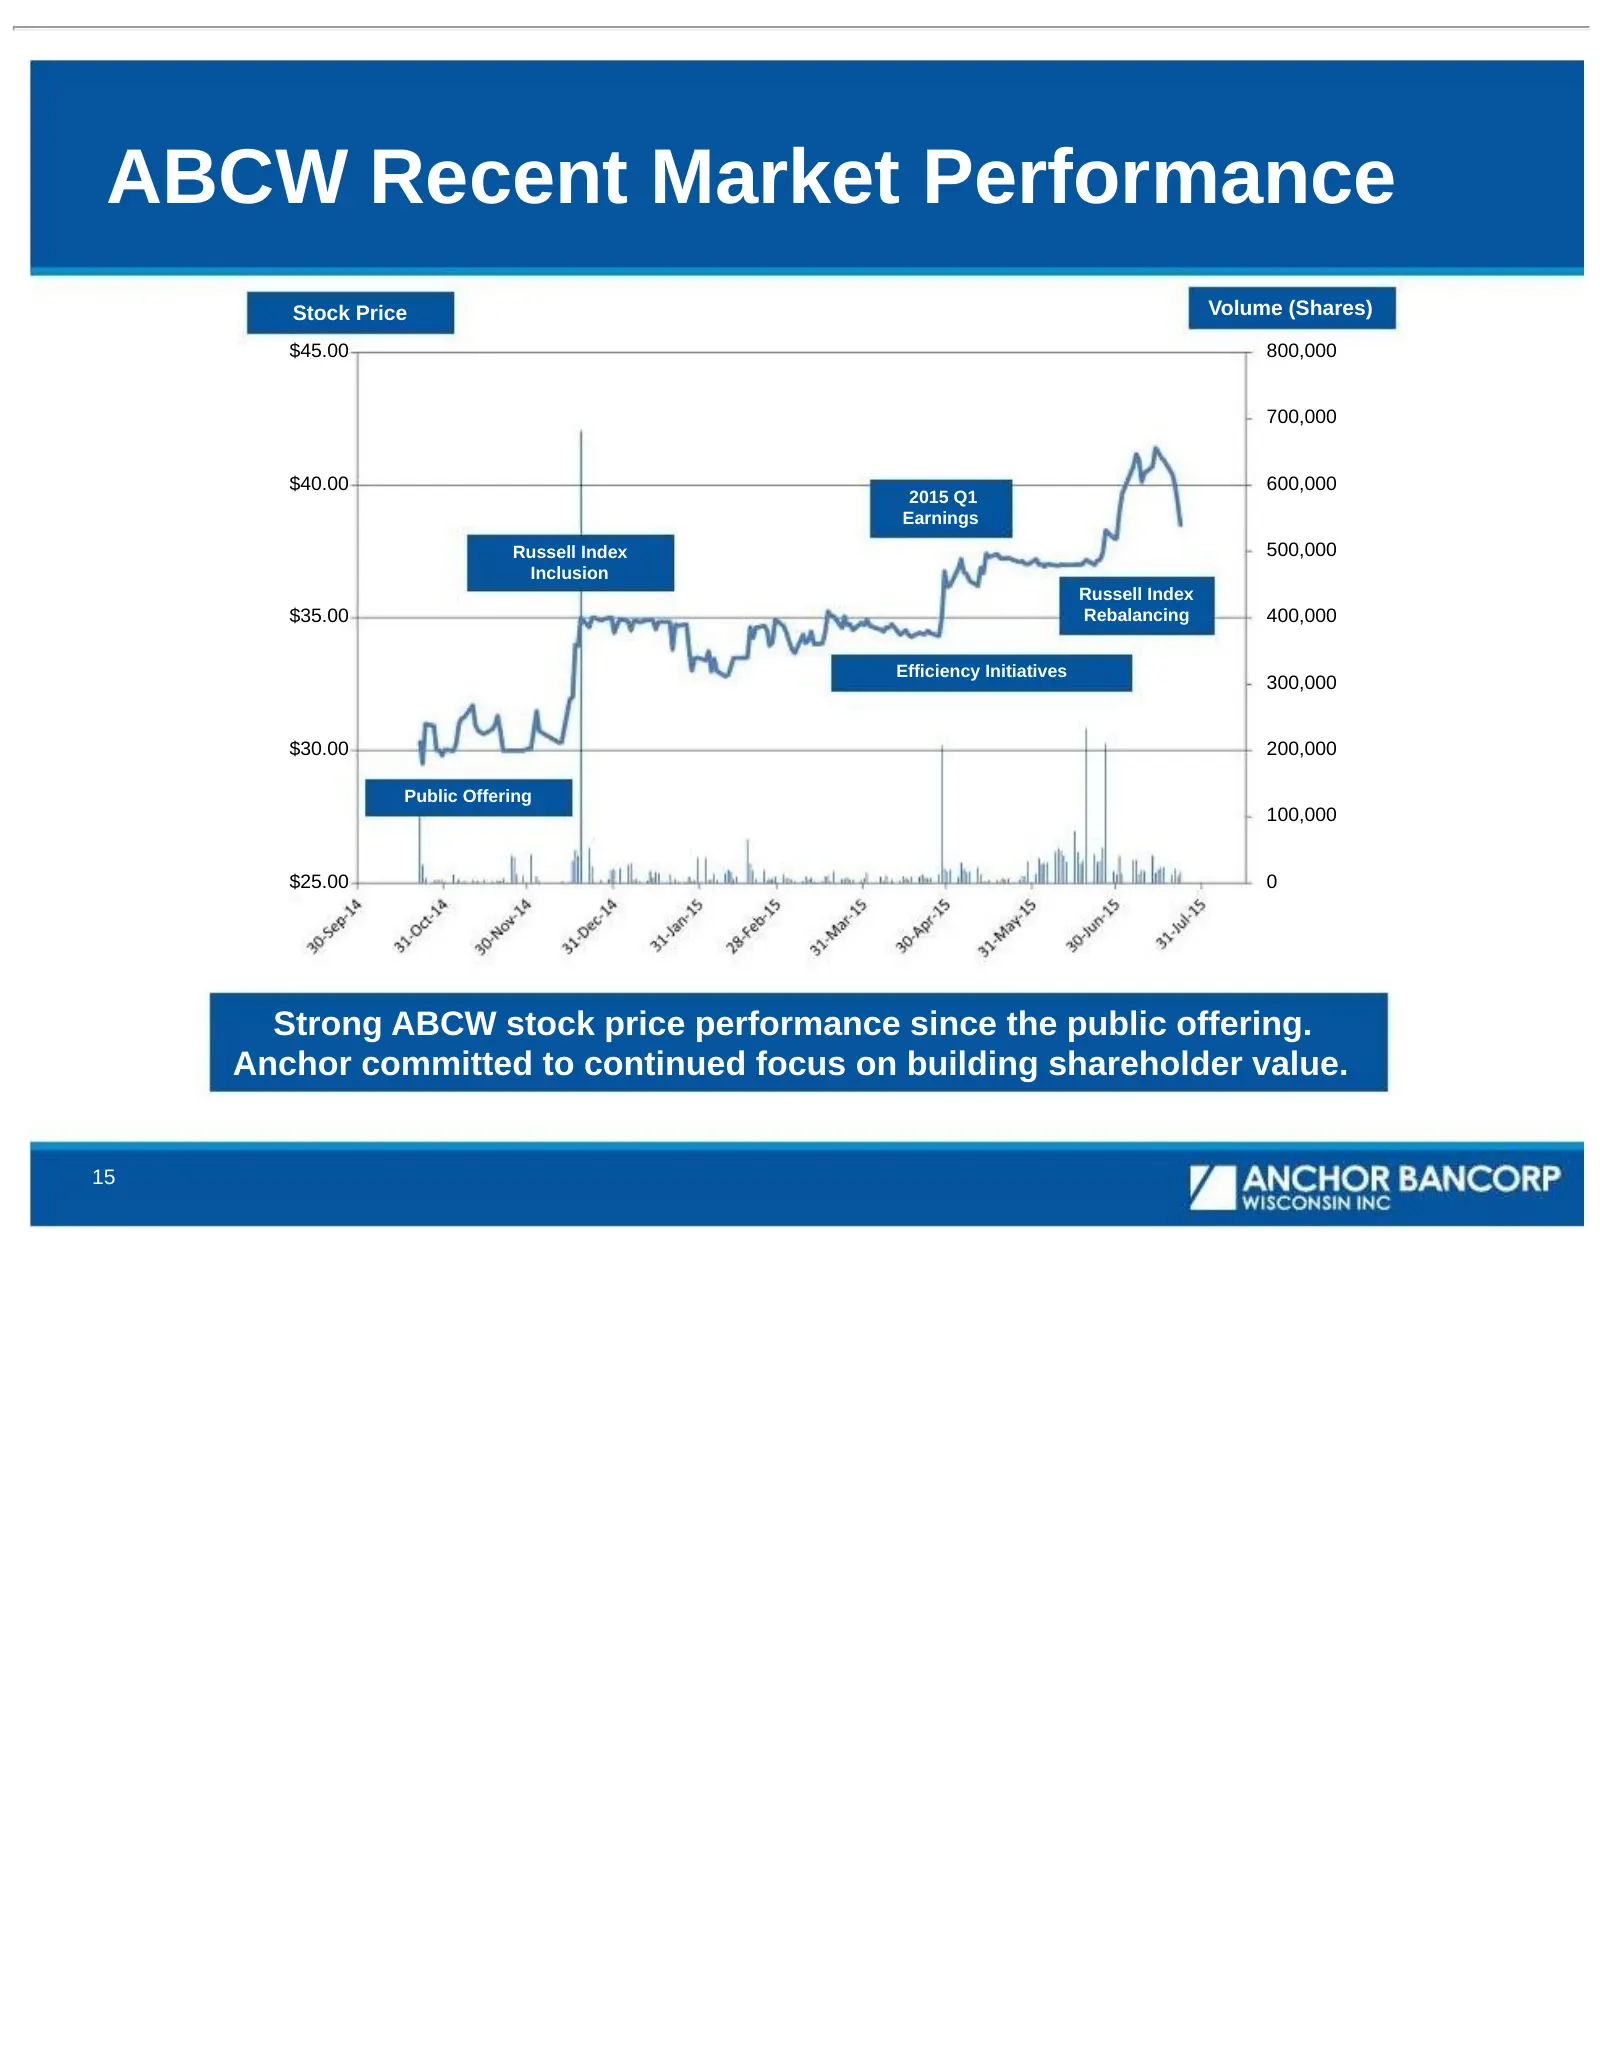
Slide 15: ABCW Recent Market Performance
ABCW Recent Market Performance Stock Price Volume (Shares) $45.00 800,000 700,000 $40.00 600,000 2015 Q1 Earnings Russell Index 500,000 Inclusion Russell Index $35.00 Rebalancing 400,000 Efficiency Initiatives 300,000 $30.00 200,000 Public Offering 100,000 $25.00 0 Strong ABCW stock price performanc
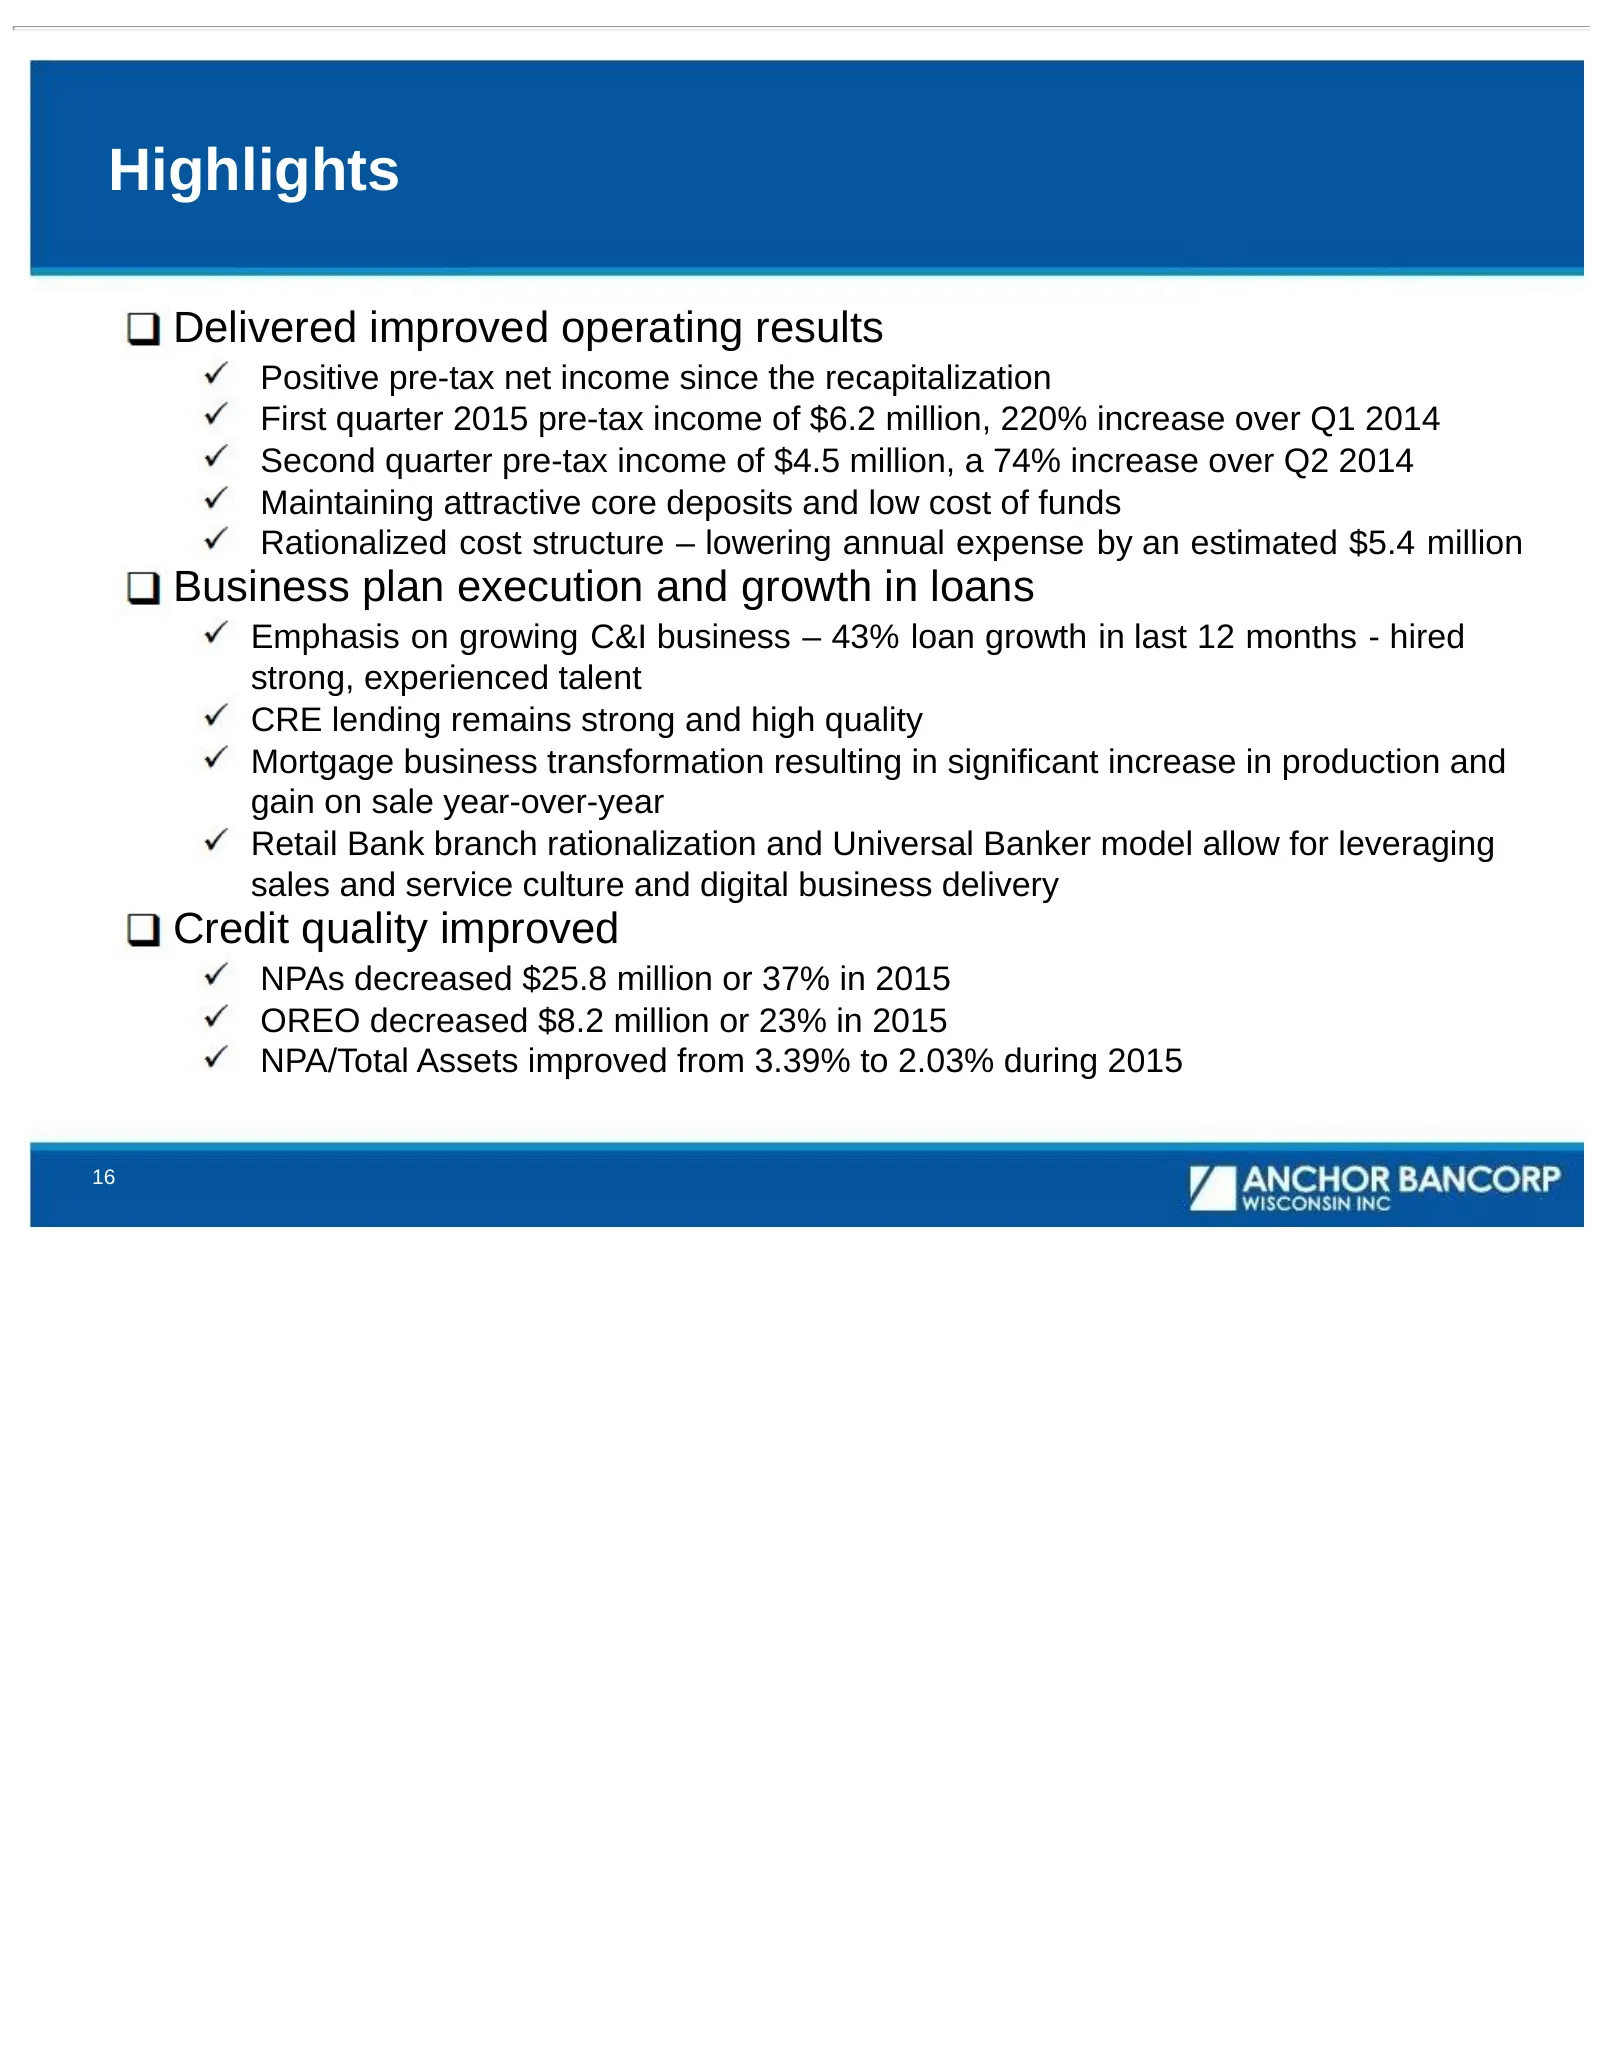
Slide 16: Highlights
Highlights Delivered improved operating results Positive pre-tax net income since the recapitalization First quarter 2015 pre-tax income of $6.2 million, 220% increase over Q1 2014 Second quarter pre-tax income of $4.5 million, a 74% increase over Q2 2014 Maintaining attractive core deposits and low
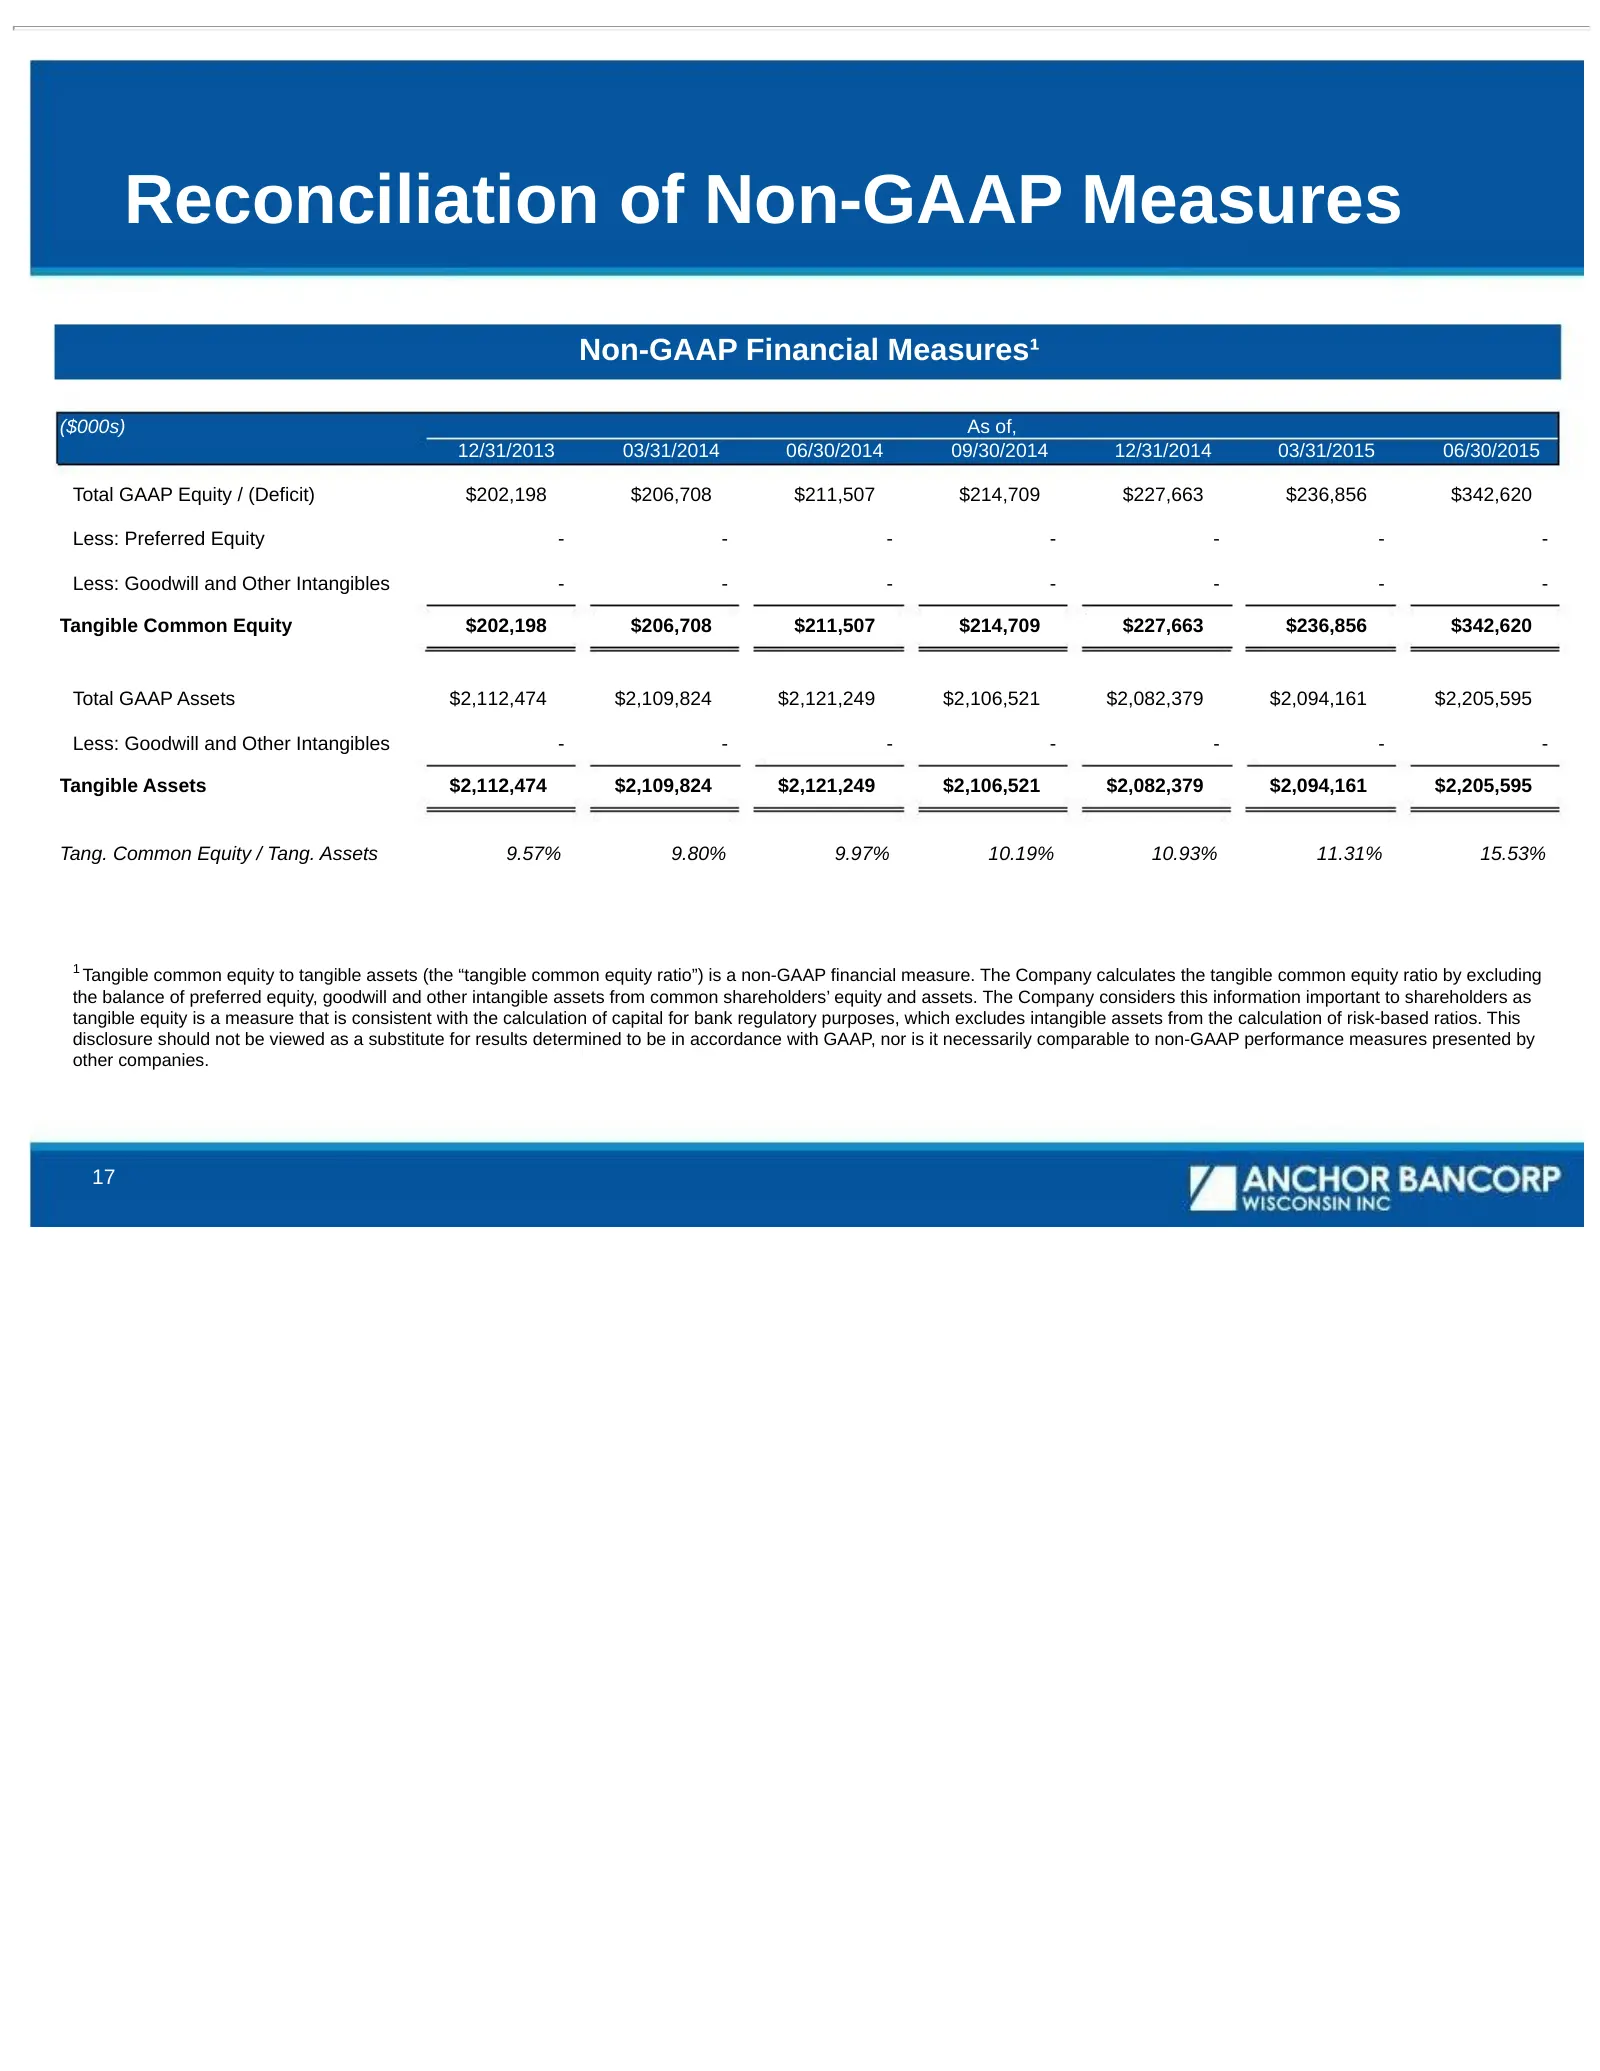
Slide 17: Reconciliation of Non-GAAP Measures
Reconciliation of Non-GAAP Measures Non-GAAP Financial Measures¹ ($000s) As of, 12/31/2013 03/31/2014 06/30/2014 09/30/2014 12/31/2014 03/31/2015 06/30/2015 Total GAAP Equity / (Deficit) $202,198 $206,708 $211,507 $214,709 $227,663 $236,856 $342,620 Less: Preferred Equity - - - - - - - Less: Goodwil
Source: SEC EDGAR · 8-K filed Jul 31, 2015
More decks from Anchor BanCorp Wisconsin Inc
 Merger or Acquisition (February 2016)13 slides · Feb 9, 2016
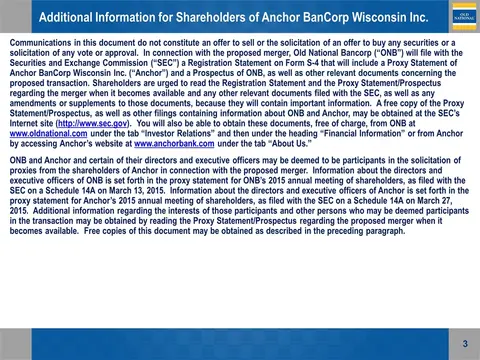 Merger or Acquisition (February 2016)5 slides · Feb 1, 2016
 Q4 2015 Earnings Presentation14 slides · Jan 29, 2016
 Merger or Acquisition (January 2016)25 slides · Jan 12, 2016
 Q3 2015 Earnings Presentation17 slides · Oct 29, 2015
 Q1 2015 Earnings Presentation12 slides · Apr 30, 2015