Anchor BanCorp Wisconsin — Q3 2015 Earnings Presentation
17 slides from Anchor BanCorp Wisconsin's earnings presentation, Oct 29, 2015
Slide 1: Third Quarter 2015 Earnings Presentation
Third Quarter 2015 Earnings Presentation
Slide 2: Disclaimer and forward-looking statements
2 This presentation does not constitute an offer to sell, nor a solicitation of an offer to buy, any securities of Anchor BanCorp Wisconsin, Inc. ("Anchor" or the “Company”) by any person in any jurisdiction in which it is unlawful for such person to make such an offering or solicitation. Neither th
Slide 3: Executing Our Business Plan
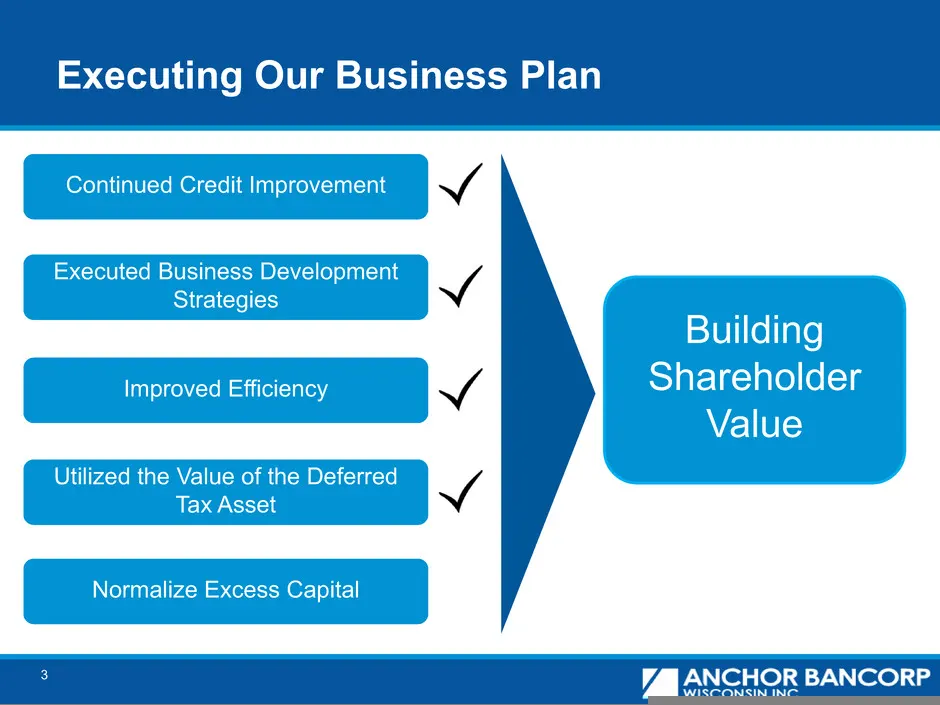
3 Executing Our Business Plan Continued Credit Improvement Executed Business Development Strategies Improved Efficiency Utilized the Value of the Deferred Tax Asset Normalize Excess Capital Building Shareholder Value
Slide 4: 2015 Q3 Financial Highlights
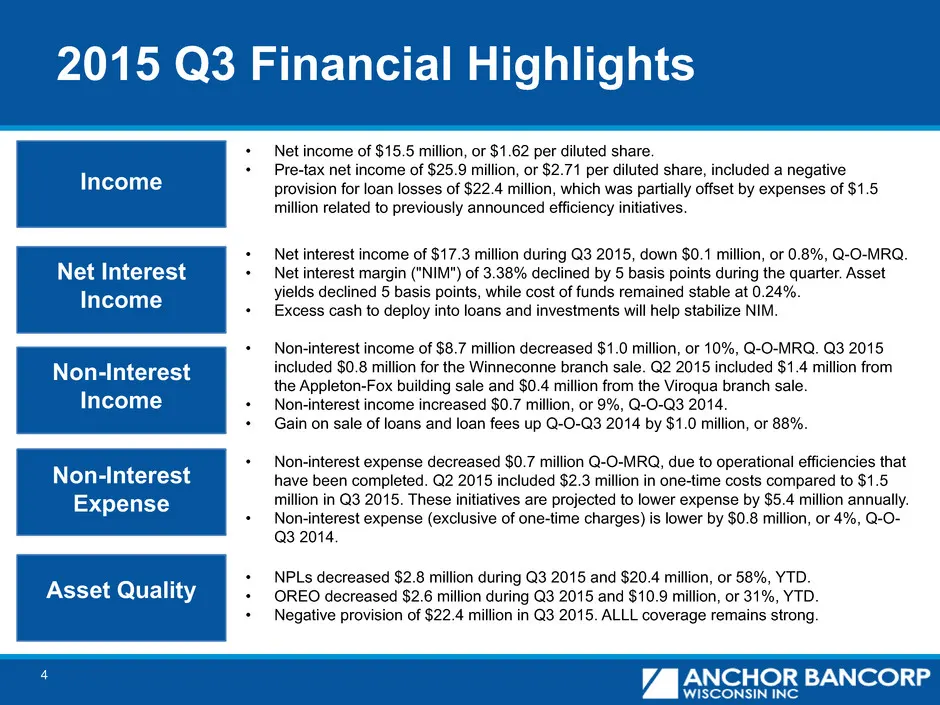
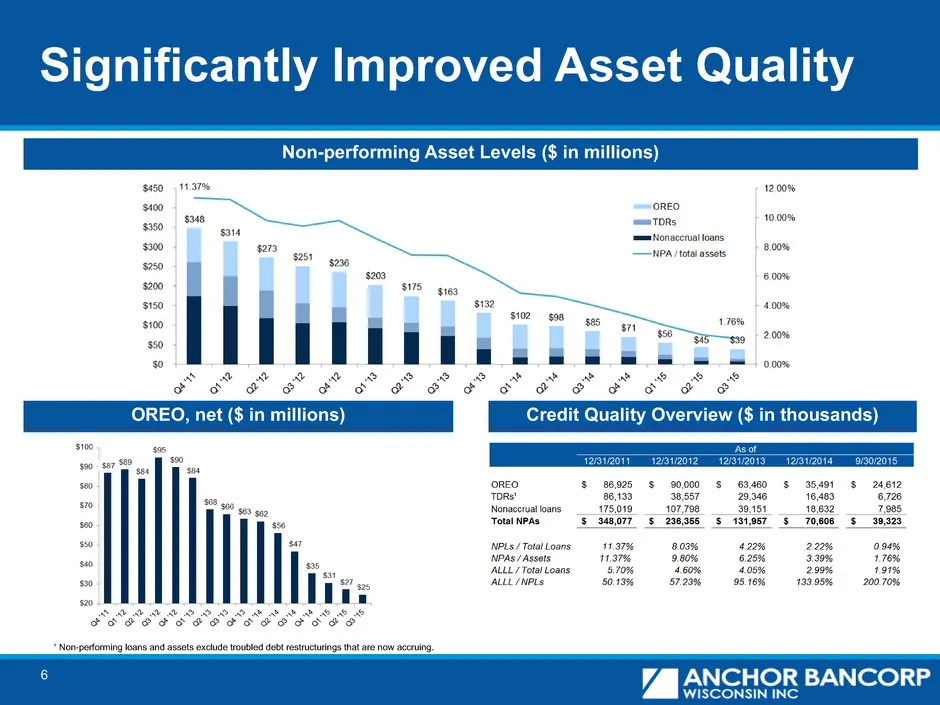
4 2015 Q3 Financial Highlights Non-Interest Expense Non-Interest Income Net Interest Income Asset Quality Asset Quality • NPLs decreased $2.8 million during Q3 2015 and $20.4 million, or 58%, YTD. • OREO decreased $2.6 million during Q3 2015 and $10.9 million, or 31%, YTD. • Negative provision of $2
Slide 5: Significant Negative Provision
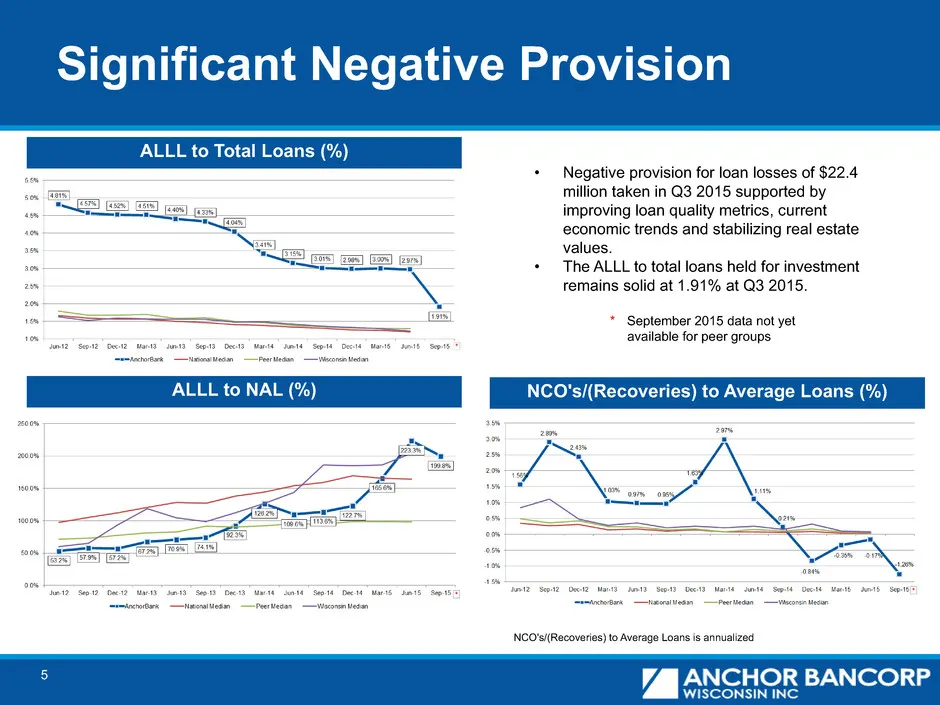
5 Significant Negative Provision Asset Quality Asset QualityIncome • Negative provision for loan losses of $22.4million taken in Q3 2015 supported by improving loan quality metrics, current economic trends and stabilizing real estate values. • The ALLL to total loans held for investment remains soli
Slide 6: Significantly Improved Asset Quality
6 Significantly Improved Asset Quality Non-performing Asset Levels ($ in millions) Credit Quality Overview ($ in thousands) ¹ Non-performing loans and assets exclude troubled debt restructurings that are now accruing. OREO, net ($ in millions)
Slide 7: Net Interest Income
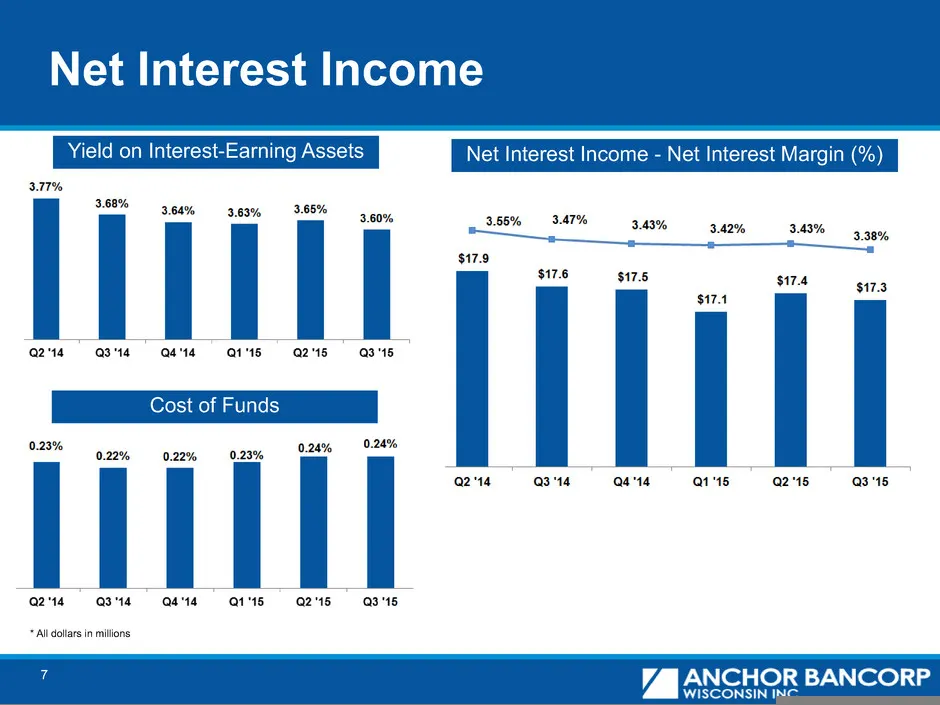
7 Net Interest Income Yield on Interest-Earning Assets Cost of Funds * All dollars in millions Net Interest Income - Net Interest Margin (%)
Slide 8: Non-Interest Income
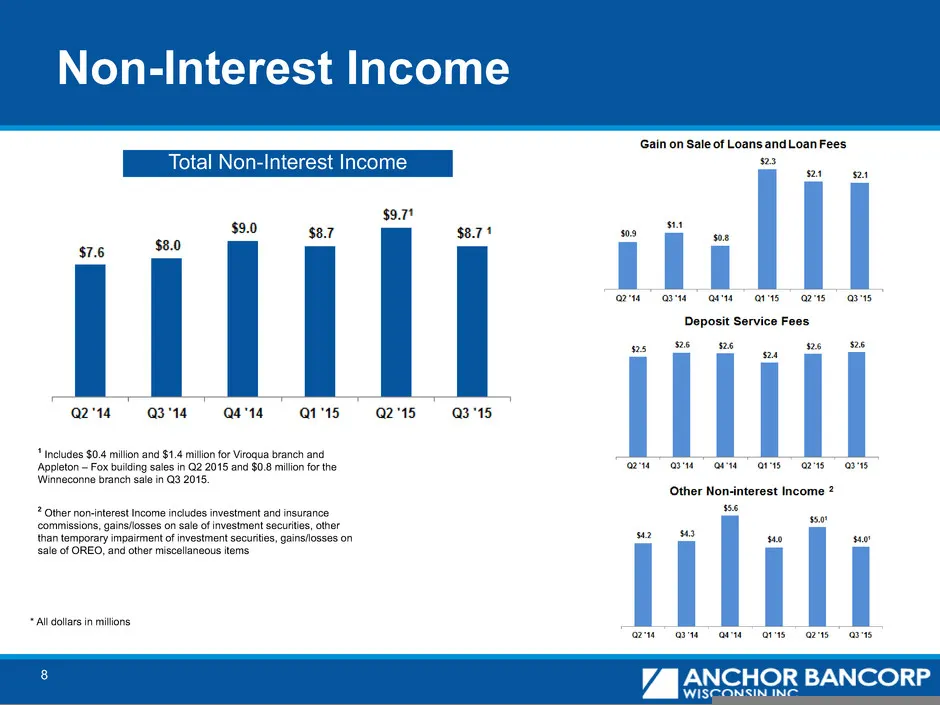
8 Non-Interest Income 2 Other non-interest Income includes investment and insurance commissions, gains/losses on sale of investment securities, other than temporary impairment of investment securities, gains/losses on sale of OREO, and other miscellaneous items 1 Includes $0.4 million and $1.4 milli
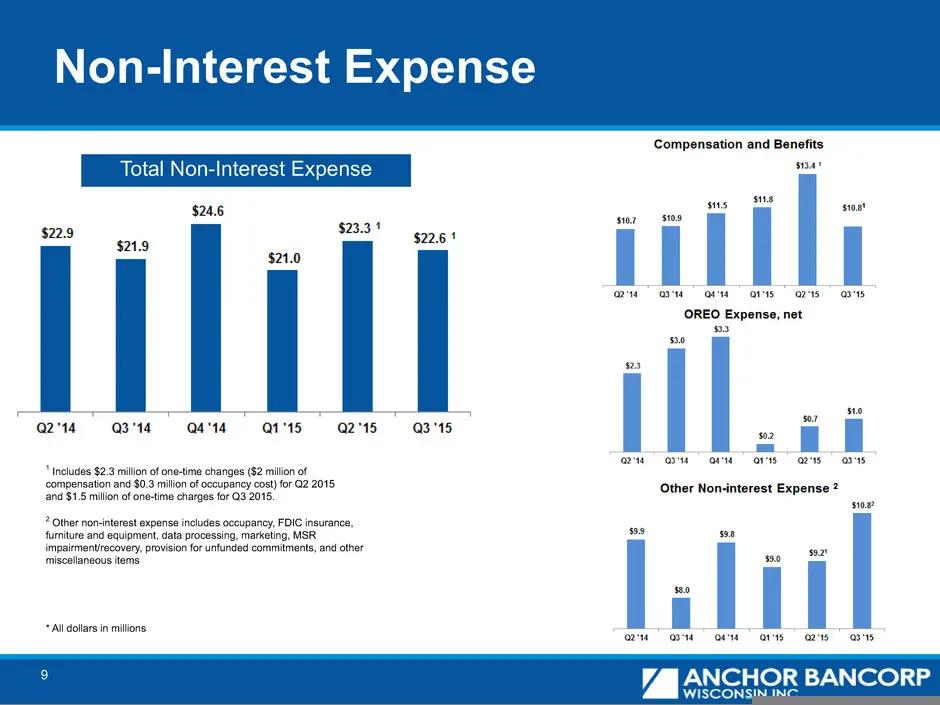
Slide 9: Non-Interest Expense
9 Non-Interest Expense 2 Other non-interest expense includes occupancy, FDIC insurance, furniture and equipment, data processing, marketing, MSR impairment/recovery, provision for unfunded commitments, and other miscellaneous items 1 Includes $2.3 million of one-time changes ($2 million of compensat
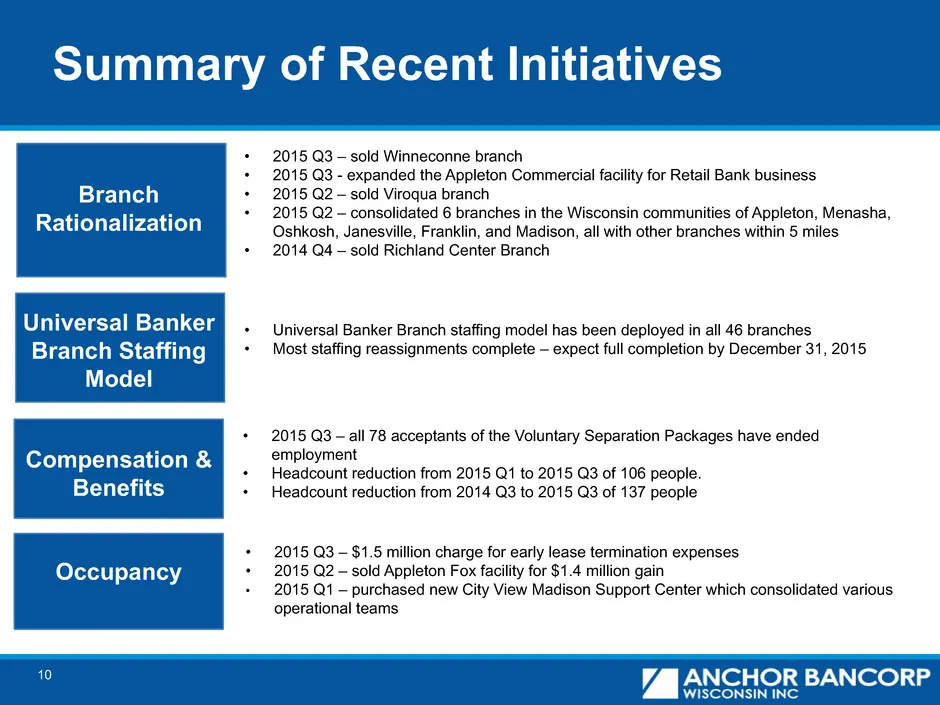
Slide 10: Summary of Recent Initiatives
10 Summary of Recent Initiatives Branch Rationalization Compensation & Benefits Occupancy Universal Banker Branch Staffing Model • 2015 Q3 – sold Winneconne branch • 2015 Q3 - expanded the Appleton Commercial facility for Retail Bank business • 2015 Q2 – sold Viroqua branch • 2015 Q2 – consolidated
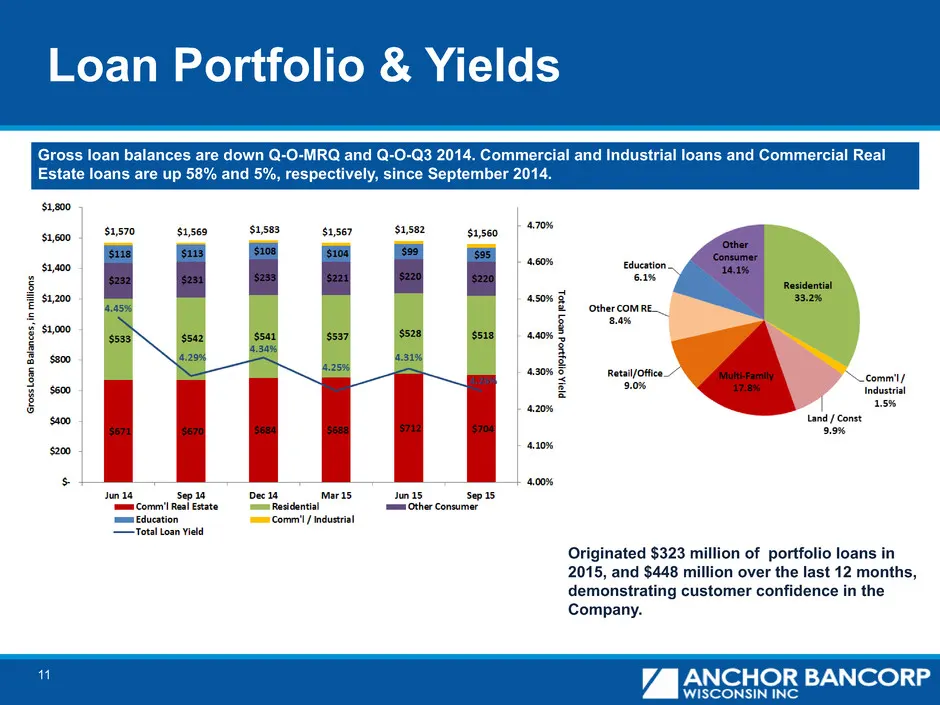
Slide 11: Loan Portfolio & Yields
11 Loan Portfolio & Yields Gross loan balances are down Q-O-MRQ and Q-O-Q3 2014. Commercial and Industrial loans and Commercial Real Estate loans are up 58% and 5%, respectively, since September 2014. Originated $323 million of portfolio loans in 2015, and $448 million over the last 12 months, demon
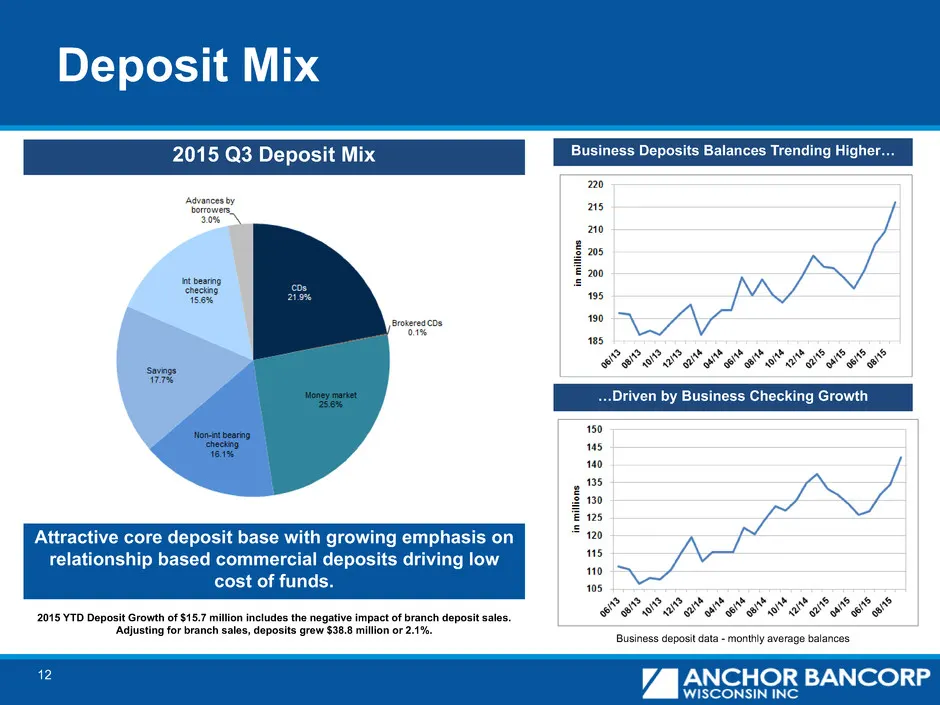
Slide 12: Deposit Mix
12 Deposit Mix Business Deposits Balances Trending Higher… …Driven by Business Checking Growth Business deposit data - monthly average balances Attractive core deposit base with growing emphasis on relationship based commercial deposits driving low cost of funds. 2015 Q3 Deposit Mix 2015 YTD Deposit
Slide 13: Strong Capital
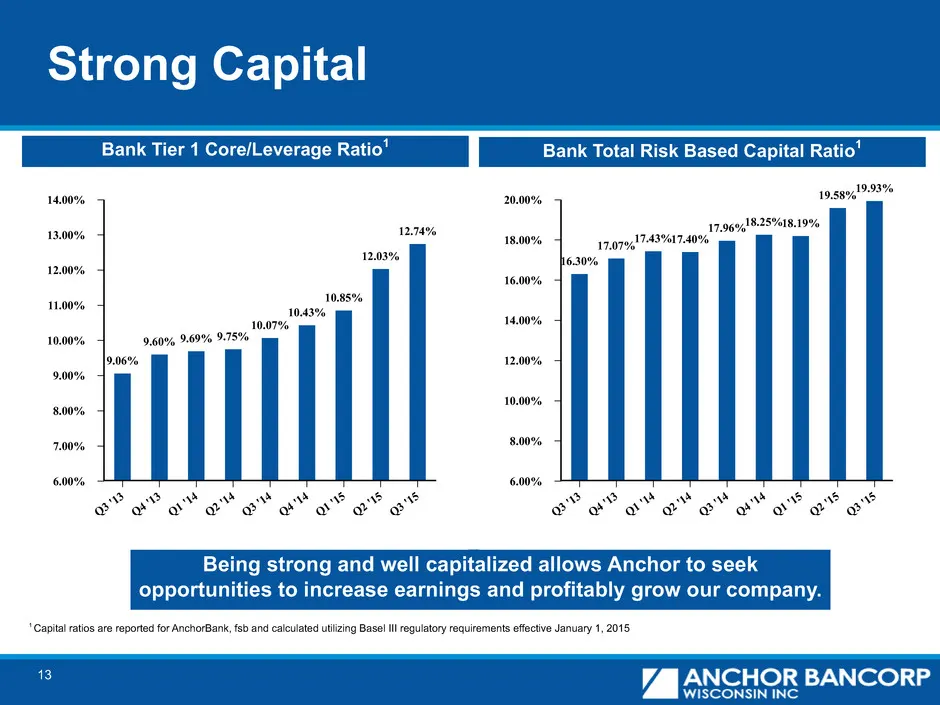
13 Strong Capital Being strong and well capitalized allows Anchor to seek opportunities to increase earnings and profitably grow our company. Bank Tier 1 Core/Leverage Ratio1 Bank Total Risk Based Capital Ratio1 1 Capital ratios are reported for AnchorBank, fsb and calculated utilizing Basel III reg
Slide 14: Current Trading View
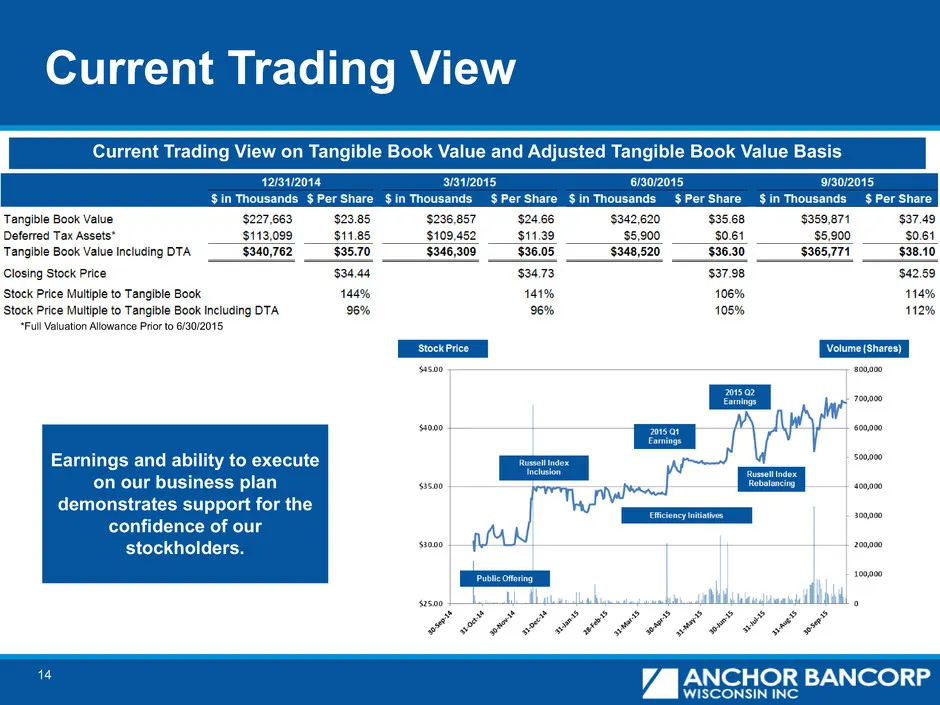
14 Current Trading View *Full Valuation Allowance Prior to 6/30/2015 Current Trading View on Tangible Book Value and Adjusted Tangible Book Value Basis Earnings and ability to execute on our business plan demonstrates support for the confidence of our stockholders.
Slide 15: Highlights
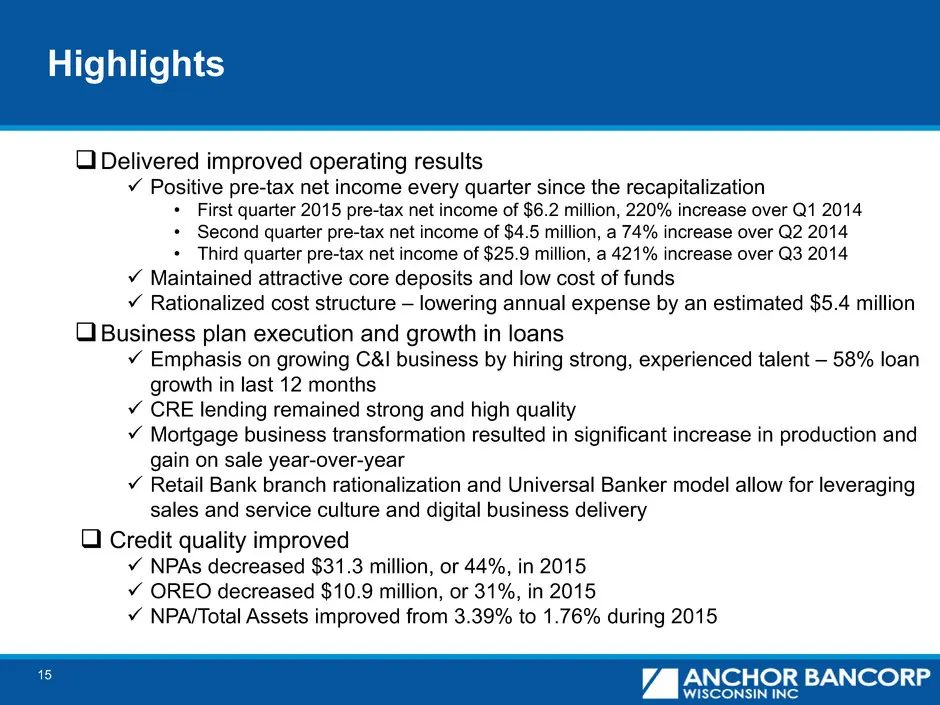
15 Highlights q Delivered improved operating results ü Positive pre-tax net income every quarter since the recapitalization • First quarter 2015 pre-tax net income of $6.2 million, 220% increase over Q1 2014 • Second quarter pre-tax net income of $4.5 million, a 74% increase over Q2 2014 • Third qua
Slide 16: Questions?
16 Questions?
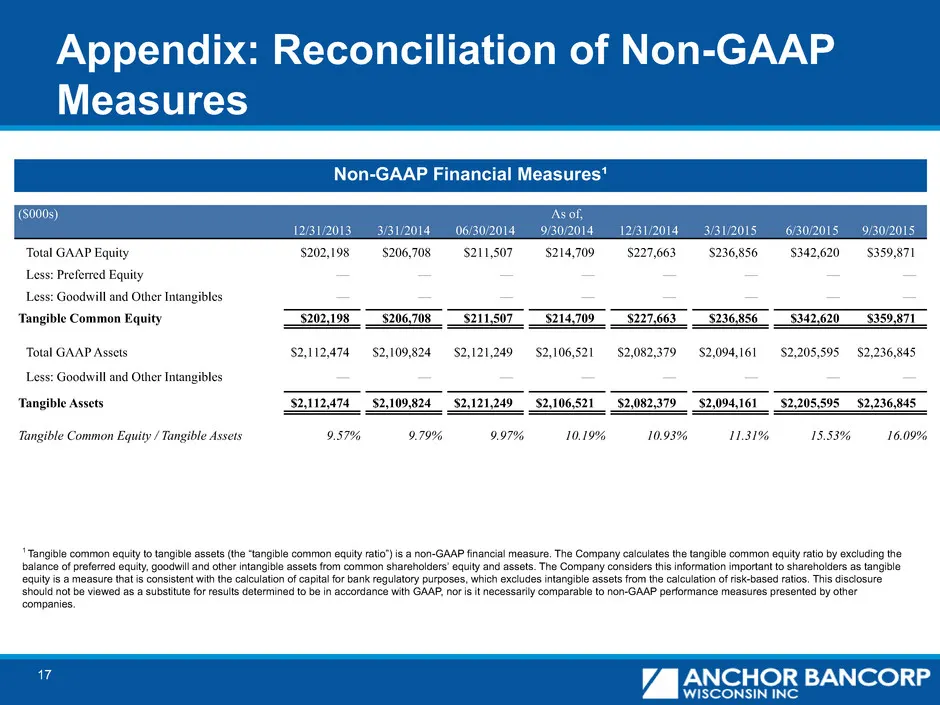
Slide 17: Appendix: Reconciliation of Non-GAAP Measures
17 Appendix: Reconciliation of Non-GAAP Measures Non-GAAP Financial Measures¹ 1 Tangible common equity to tangible assets (the “tangible common equity ratio”) is a non-GAAP financial measure. The Company calculates the tangible common equity ratio by excluding the balance of preferred equity, goodwi
Source: SEC EDGAR · 8-K filed Oct 29, 2015
More decks from Anchor BanCorp Wisconsin Inc
 Merger or Acquisition (February 2016)13 slides · Feb 9, 2016
 Merger or Acquisition (February 2016)5 slides · Feb 1, 2016
 Q4 2015 Earnings Presentation14 slides · Jan 29, 2016
 Merger or Acquisition (January 2016)25 slides · Jan 12, 2016
 Q2 2015 Earnings Presentation17 slides · Jul 31, 2015
 Q1 2015 Earnings Presentation12 slides · Apr 30, 2015